cognitive radio cdma networking with spectrum … radio cdma networking with spectrum sensing 1583...
TRANSCRIPT

INTERNATIONAL JOURNAL OF COMMUNICATION SYSTEMSInt. J. Commun. Syst. 2014; 27:1582–1600Published online 17 August 2012 in Wiley Online Library (wileyonlinelibrary.com). DOI: 10.1002/dac.2421
Cognitive radio CDMA networking with spectrum sensing
Sanjay Dhar Roy1,*,†, Sumit Kundu1, Gianluigi Ferrari2 and Riccardo Raheli2
1Department of Electronics and Communication Engineering, National Institute of Technology, Durgapur,West Bengal, India
2Department of Information Engineering, University of Parma, Parma, Italy
SUMMARY
In this paper, the performance of cognitive radio (CR) code division multiple access (CDMA) systems isanalyzed. More precisely, CR users belong to a cognitive radio network (CRN), which coexists with a pri-mary radio network (PRN). Both CRN and PRN are CDMA-based, with colocated base stations. Soft handoff and power control are considered in both the CRN and the PRN. Upon the development of an accuratesimulator for a representative three-cell cellular scenario, we evaluate the performance of the proposed CRsystem in terms of outage probability, blocking probability and average data rate of secondary users. Threedifferent spectrum sensing techniques are. Two new schemes, based on interference limit, are proposed andcompared with an existing adaptive spectrum sensing scheme. Spectrum activity measurements and spec-trum sharing decisions have been considered for evaluating the performance of the three schemes. The paperproposes a new CR-CDMA networking model and a simulation testbed for evaluating performances of sec-ondary users and primary users in terms of outage, blocking, BER and average data rate in the presence ofsoft hand-off and power control. For comparison purposes, the analysis in the absence of spectrum sensingis also investigated. Copyright © 2012 John Wiley & Sons, Ltd.
Received 19 July 2011; Revised 20 June 2012; Accepted 9 July 2012
KEY WORDS: cognitive radio; CDMA; spectrum sensing; blocking probability; soft handoff (HO)
1. INTRODUCTION
Measurements on the spectrum usage in the United States have shown that average spectrumoccupancy is only 5.5%, with a maximum of 13.1% in urban areas and a minimum of 1% in ruralareas [2]. The efficiency in using the available spectral resources has two sides: spectrum efficiencyand spectrum occupancy. While spectrum efficiency represents how efficiently a system uses itsspectrum (bit/sec/Hz), spectrum occupancy represents the utilization percentage of the overall spec-trum over time. These observations have motivated the study of techniques to efficiently exploit theavailable spectral resources. Among these, cognitive radio (CR) technology, formally defined byMitola and Maguire in 1999 [3], is an attractive approach.
Cognitive radio systems allow the presence of primary users (PUs) and secondary (or cognitive)users (SUs) [4]. In a CR system, an SU may change its radio parameters on demand. For exam-ple, it can adapt its rate when the number of PUs reduces or the interference level lowers [5]. SUsaccess the channel in an opportunistic way by performing spectrum sensing, that is, detecting thespectrum portions that are not being used by PUs or are being used by SUs with correspondinginterference level below a given interference limit. After finding spectrum ‘holes’ or ‘white spaces’[6], that is, unused spectrum in spatial and/or temporal domains, an SU selects the best availablechannel: this operation is known as spectrum decision. Other users, either secondary or primary, mayutilize the spectrum via spectrum sharing. An SU changes its transmission channel (or frequency)
*Correspondence to: Sanjay Dhar Roy, ECE Department, NIT Durgapur, M.G. Avenue, Burdwan, WB, India 713209.†E-mail: [email protected], [email protected]
Copyright © 2012 John Wiley & Sons, Ltd.

COGNITIVE RADIO CDMA NETWORKING WITH SPECTRUM SENSING 1583
upon detecting a PU transmitting in the same channel or upon detection of a channel degradation.A scheduled spectrum sensing scheme for spectrum sharing among a group of SUs and a groupof PUs is addressed in [7]. Cooperative spectrum sensing has emerged as an interesting researcharea. A hard decision combining-based cooperative spectrum sensing scheme, in the presence of afeedback error caused by imperfect channel conditions, was proposed in [8].
Cognitive radio technology is mainly used for dynamic spectrum access (DSA), which refers tothe opportunistic spectrum usage by SUs. Dynamic spectrum access leads an SU to select the bestavailable channel. SUs can coexist with PUs in two ways: through spectrum underlay or throughspectrum overlay [9]. According to the spectrum overlay approach, an SU uses a portion of thespectrum that is not being utilized by the PUs. An SU will have to leave the spectrum whenever aPU asks for it. An SU can also adapt its transmit power or modulation/coding scheme accordingto the situation [5]. In practice, CR users, and the CR manager (if present) [9], would measure theinterference level on the basis of broadcast information from the primary base stations (BSs) andwould change their main networking parameters to reduce the interference level at the PU. Codedivision multiple access (CDMA) based CR networks have been well investigated in recent years.In MultiCarrier CDMA (MC-CDMA) for CR systems, the noncontiguous vacant parts of a certainportion of the spectrum are shared with the users of a primary system. However, the large spectralsidelobes of the Fourier transform-based implementation of MC-CDMA interfere with adjacent pri-mary transmitted signals. To suppress the sidelobes, in [10] a novel complex signature sequence setwas proposed for synchronous downlink MC-CDMA-based cognitive radio networking.
In this paper, we consider a heterogeneous network consisting of a cellular CDMA primary radionetwork (PRN) and a cellular CDMA cognitive radio network (CRN). The PRN and the CRNcoexist, in the sense that the spatial cellular topology is the same and, in the centre of each cell,a primary BS (PBS) is colocated with a secondary BS (SBS). In each cell, the PBS and the SBSdo not interfere in downlink with each other (e.g., through time division duplexing). We considera representative three-cell scenario. Multirate CDMA systems use a variable spreading length or amulticode protocol [11]. Both PRN and SRN are multirate CDMA systems. Owing to the use ofmultirate CDMA, two classes of PUs, with two different data rates, will be considered. PUs in oneclass (PU1) transmit at a lower data rate, while PUs in the other class (PU2) transmit at a higher datarate. This corresponds to assuming the presence of two types of users who need different applica-tions with different bandwidth requirements. In general, higher data rate users are expected to causehigher interference. Our goal is to investigate the impact of spectrum sensing on the system per-formance. To this end, starting from the spectrum sensing approach originally proposed in [12], wederive two new spectrum sensing techniques. For comparison purposes, the performance is analyzedalso in the absence of spectrum sensing.
Spectrum sensing schemes are mainly classified as: (a) methods requiring both source signaland noise power information, (b) methods requiring only noise power information (semi-blinddetection), (c) methods requiring no information on source signal or noise power (blind detection)[1]. Likelihood ratio test-based spectrum sensing and matched filtering-based spectrum sensingbelong to category (a); wavelet-based spectrum sensing and covariance-based spectrum sensingbelong to semi blind detection; eigenvalue-based spectrum sensing belongs to blind detection. Thespectrum sensing techniques considered in this paper stem from the covariance-based semi blindspectrum sensing approach followed in [1, 12]. In particular, covariance-based spectrum sensingallows the SBS to know the spectrum activity of SUs. By properly thresholding the autocorrelationfunction of the received signal, the presence of PUs can be detected [13, 14].
We investigate the impacts of the number of PUs, the number of SUs and of other relevant sys-tem parameters (related to both the communication channel and the networking architecture) on theoutage probability, the blocking probability and the average data rate. Under the assumption thatthe PRN and the CRN contain fixed numbers of PUs and SUs, we evaluate the blocking probabilityexperienced by a new SU that attempts to join the system. In each cell, the PBS broadcasts informa-tion on the interference level to all PUs and SUs. On the basis of the received information, an SUmay decrease its transmit power, may decrease its data rate, or may temporarily stop its transmission[1]. This paper expands upon our preliminary work appearing in [15] and [16]. The present workdescribes the spectrum sensing methodology and corresponding spectrum access decision criteria as
Copyright © 2012 John Wiley & Sons, Ltd. Int. J. Commun. Syst. 2014; 27:1582–1600DOI: 10.1002/dac
1584 S. D. ROY ET AL.
used in our model. Specifically, the present work completes [15] and [16] by studying the effects ofthe data rate of cognitive users on the outage probability of an SU and by clearly discussing detailedprocedures for finding the blocking probability in the absence of spectrum sensing.
The major contributions of our paper can be summarized as follows. First, we propose a novelCR-CDMA networking model with coexisting CRN and PRN in the presence of soft hand-off (HO).In this context, two novel spectrum sensing schemes are developed. Performance evaluation of theproposed spectrum sensing schemes is carried out, through a custom MATLAB simulator (We haveused MATLAB developed by Mathworks, India.), in terms of outage probability, blocking probabil-ity, BER and average data rate of PUs and SUs. The joint impact of multiple antennas and spectrumsensing, in the presence of soft HO, is investigated.
The rest of the paper is organized as follows. In Section 2, the system model is introduced. InSection 3, the considered simulation model is described. In Section 4, numerical results arepresented and discussed. Finally, Section 5 concludes the paper.
2. SYSTEM MODEL
In this section, we describe the network model and explain spectrum sensing schemes used in thepresent work. In Section 2.1, the system model is discussed while spectrum sensing techniques aredescribed in Section 2.2. The major contributions of our paper have also been noted in Section 2.3.
2.1. Three-cell cognitive radio scenario
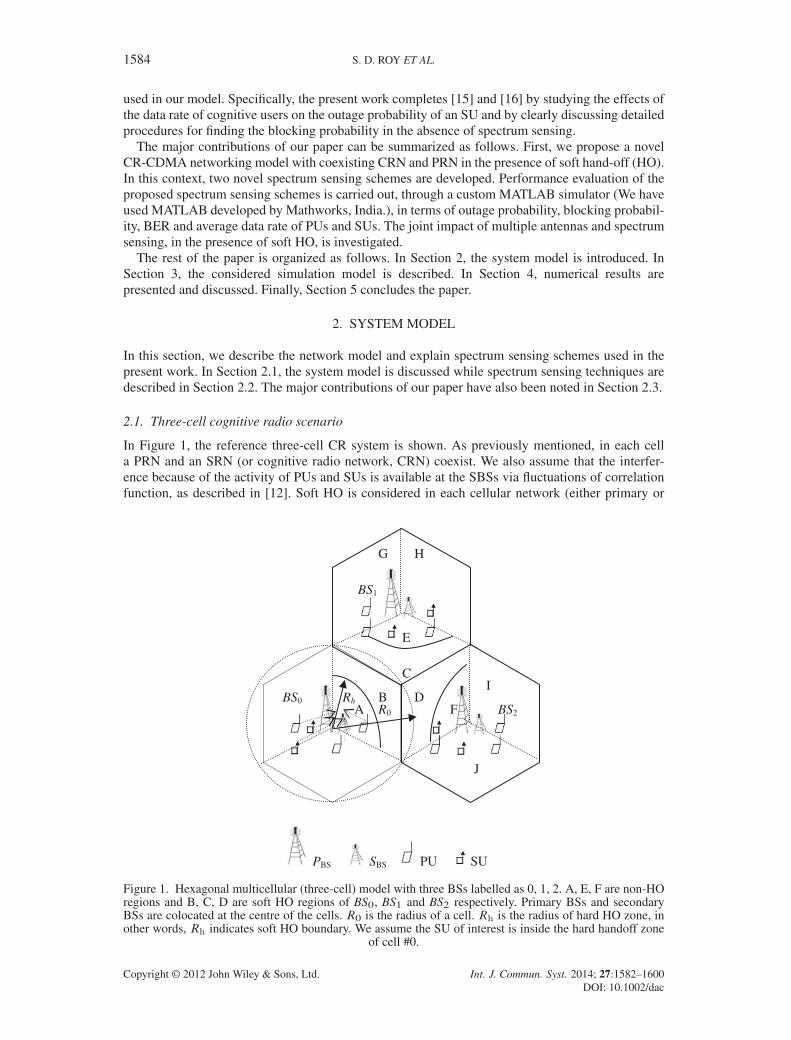
In Figure 1, the reference three-cell CR system is shown. As previously mentioned, in each cella PRN and an SRN (or cognitive radio network, CRN) coexist. We also assume that the interfer-ence because of the activity of PUs and SUs is available at the SBSs via fluctuations of correlationfunction, as described in [12]. Soft HO is considered in each cellular network (either primary or
PBS SBS PU SU
G
BS1
H
C
E
RhA
B DF
I
J
BS0BS2R0
Figure 1. Hexagonal multicellular (three-cell) model with three BSs labelled as 0, 1, 2. A, E, F are non-HOregions and B, C, D are soft HO regions of BS0, BS1 and BS2 respectively. Primary BSs and secondaryBSs are colocated at the centre of the cells. R0 is the radius of a cell. Rh is the radius of hard HO zone, inother words, Rh indicates soft HO boundary. We assume the SU of interest is inside the hard handoff zone
of cell #0.
Copyright © 2012 John Wiley & Sons, Ltd. Int. J. Commun. Syst. 2014; 27:1582–1600DOI: 10.1002/dac
COGNITIVE RADIO CDMA NETWORKING WITH SPECTRUM SENSING 1585
secondary). Soft HO requires a ‘make-before-break’ handover procedure [17], that is, a mobile sta-tion (MS) in a low signal zone under its current BS may already receive the signals sent from otherneighboring BSs and, therefore, can be virtually connected to (and power-controlled by) more thanone BS. To carry out a soft HO, the gains of all links between the MS and the connected BSs areevaluated and, then, a decision on power control is taken. Moreover, when carrying out the HO, auser may need to change its current pseudonoise (PN) code issued by the old BS to a new PN codeissued by the new BS. Each cell in Figure 1 is divided into three sectors, with the same number ofdata users per sector. Each sector is further divided into two regions, denoted as soft HO and non-HO. In each cell, there are then three soft HO regions (denoted as B, C, D) and three non-HO regions(denoted as A, E, F). The analysis in the remainder refers to uplink communications. The soft HOregion is defined on the basis of the distance from the BS, as shown in Figure 1. The three cells arenumbered as 0, 1 and 2. In each cell, the PBS and SBS are colocated, and PUs and SUs are power-controlled by their respective BSs. An MS, either an SU or a PU, placed outside the HO boundary.Rh/ (defined as the distance of the circular region within which there is no HO) is considered tobe under soft HO with the three BSs associated to the three neighboring cells. A PU interferes atthe SBS of its cell. Both the SBS and the SU are assumed to receive, from the PBS, information onthe usage capacity percentage .ucp/ of the cell, defined as the ratio between the number of activePUs in the cell and the maximum number of sustainable users (including both PUs and SUs) in thesystem. In the case of the PRN, a PU is assumed to transmit at a higher rate, given by mrd, wherem is an integer depending on the spreading length of PN codes for transmissions in the multirateCDMA system and rd is the basic data rate. Two classes of PUs are then considered, depending onthe used transmit rate: PU1 denotes the first group of PUs, using the basic rate rd; PU2 denotes thesecond group of PUs, using a data rate equal to 2rd. In the absence of spectrum sensing, all SUs areassumed to transmit at the same rate 4rd.
Under the above assumptions, the total interference power at an SBS, because of SUs and PUs,can be written as follows:
IULSBSD ISUC IPU1 C IPU2 , (1)
where the first term at the right-hand side of the equation corresponds to the interference powerbecause of all SUs active in the uplink, whereas the other two terms correspond to the interfer-ence powers because of PU1 and PU2, respectively. All these powers will be evaluated through thesimulator described in Section 3. The received power of each user (either a PU or a SU) isnormalized to 1 at its BS — this is consistent with the assumption of power control.
2.2. Spectrum sensing techniques
As described in the previous section, we assume the presence of three types of users with three dif-ferent data rates. The number (and, obviously, the presence) of each type of user and the interferencecaused by each of them can be obtained using the fluctuations of estimated autocorrelation functionas explained subsequently [13, 14].
At the SBS of the cell of interest, the interference from all SUs, but the desired SU, is computedaccording to the previously introduced (spectrum sensing) method. Obviously, all PUs will alsointerfere at the SBS and this interference contribution can be estimated as well using fluctuations ofthe correlation estimator. Because the SUs and PUs have different rates, their autocorrelation fluctu-ations will be different. Here, the choice of the value of the threshold used to detect the fluctuationsof the autocorrelation function depends on the data rate (which, in turn, depends on the spreadinglength). In other words, a particular class of users is typically detected using a threshold differentfrom that of another class of users. Different thresholds should be considered for different classesof users because a lower threshold value for a particular class of users may lead to the (erroneous)detection of users of other class, which requires higher threshold. With a proper choice of the detec-tion threshold, a user is detected if the fluctuations of the correlation estimator exceed the threshold[1]. In our CR-CDMA networks, the presence of users and their created interference at the SBS aredetermined in the same way. The threshold value is selected on the basis of the fluctuations of theautocorrelation function in the absence of the signal, that is, only in the presence of noise [13, 14].
Copyright © 2012 John Wiley & Sons, Ltd. Int. J. Commun. Syst. 2014; 27:1582–1600DOI: 10.1002/dac

1586 S. D. ROY ET AL.
The received signal is divided into M temporal windows, each of duration T . The fluctuationsof autocorrelation are estimated at each window. Using M windows, second-order moment of esti-mated correlation is found as follows [13, 14]: ' .�/ D 1
M
PM�1nD1
ˇ̌Rnyy .�/
ˇ̌2; where Rnyy.�/ is the
estimated correlation of received signal at n-th window.This fluctuation will exceed a predefined threshold level if signal is present along with noise. The
threshold level is selected on the basis of noise power.Thus, the covariance method uses the fluctuations of autocorrelation of the received signal at
different times, that is, �.�/ at different values of � . In an ideal situation, the correlations of noisesamples taken at different times should be zero if an AWGN channel is assumed. However, the corre-lation of the signal samples taken at different times would be larger than zero if the time separationsare smaller than the data symbol duration [18].
2.2.1. Scheme 0 (‘Ghavami SS’). This is the spectrum sensing scheme proposed by Ghavami andAbolhassani in [12]. SUs are prevented from transmitting (upon positive spectrum sensing) ifpˇ C 1 > .1/ucp/ is satisfied, where ˇ D I 2SU=I
2PU. ISU is the received interference power from
SUs, and IPU is the received interference power from PUs. The usage capacity percentage ucp isdefined as the percentage of the cell capacity used by the primary network. The PBS broadcasts thevalue of ucp in the control channel. The SUs and the SBS listen to the control channel to obtain ucp
and take consequential decision(s) about spectrum access. Therefore, we are implicitly assumingsome kind of cooperation between PBS and SBS. On the basis of the required QoS, the total num-ber of sustainable users in a CDMA network may be determined. At any particular time, all PUsare not likely to be simultaneously active, so that SUs can transmit without hampering the QoS ofPUs. Because the PBS knows the number of active PUs, it computes and broadcasts ucp as the ratiobetween active PUs and total sustainable users in the network.
2.2.2. Proposed spectrum sensing schemes.
Scheme 1: In this scheme, in the absence of SUs a fixed number of PUs in each sector is assumed.In the remainder, we will consider 30 PUs, equally divided into the two groups PU1and PU2, and a basic data rate rdD10 kb/s. The maximum interference generated byall PUs, denoted as Imax, will be evaluated with this constraint. At any time, the totalinterference caused by SUs and PUs must be lower than this interference limit.
Scheme 2: In this scheme, we assume that the PRN can tolerate some interference fromSUs, even when all PUs are present in the system, up to the limit Imax=ucp. Atany time, the total interference caused by SUs and PUs must be lower than thisinterference limit.
We now provide more details on the proposed spectrum sensing schemes. As anticipated inSection 1, both schemes are based on the covariance-based spectrum sensing as mentioned in [1,12].However, in our spectrum sensing schemes we also consider spectrum sharing condition/permissionfor SUs. For example, the spectrum is first sensed, using covariance-based spectrum sensing, toinfer about the presence of PUs. Because we are assuming multirate CDMA transmissions [12],we can distinguish between the presence of SUs and of the two types of PUs. Once the spectrumactivity (by all present users) is known, spectrum sharing permission might be given to an SU whorequests resources. By spectrum sensing, the overall interference created by currently active SUs inthe system is also known.
After measurement of the spectrum activity, there can be the two following possibilities:
(1) The total interference, because of active SUs and PUs, is higher than the maximum tolerablelevel. If the total interference is found to be more than the interference limit, then an SU(already active in the network) will be asked to stop transmitting to reduce spectrum activity.In this context, spectrum sensing thus indicates spectrum activity measurement and spectrumsharing decision for SUs. Note that we slightly modify the spectrum sensing scheme proposedin [1]. More precisely, we predetermine a fixed interference limit rather than considering anadaptive interference limit based on the activity level of PUs (as used in [12]).
Copyright © 2012 John Wiley & Sons, Ltd. Int. J. Commun. Syst. 2014; 27:1582–1600DOI: 10.1002/dac
COGNITIVE RADIO CDMA NETWORKING WITH SPECTRUM SENSING 1587
(2) If the overall interference caused by all active users is lower than the allowed limit, a new SUmay thus be allowed.
In a nutshell, we consider spectrum sensing as a combination of spectrum activity measurementand spectrum sharing decision for new SUs. Spectrum activity measurement is needed to find thepresence of PUs and of existing interfering SUs. In any case, the total amount of interference gen-erated by all users should not exceed the preset interference level of a fully loaded CDMA cell [12].The condition for a positive spectrum sharing decision (i.e., to allow a new SU to transmit data) isderived using the proposed algorithm, which relies on proper observations of the fluctuations outputby the correlation estimator.
There is another significant difference with other spectrum sensing schemes. In general, thepresence of a PU is determined by traditional spectrum sensing techniques such as, for example,energy detection-based sensing, matched filtering-based sensing, etc. In a CDMA cellular network,an MS is identified by a PN code. A user’s signal is modulated twice: first, it is modulated witha high frequency signal (the PN sequence or chip signal), which converts the user signal into awideband signal; then, the latter signal is modulated with an RF carrier signal and transmittedthrough the antenna. Any user in a CDMA environment is an interferer to every other user. In partic-ular, our system considers coexistence of SUs and PUs in one coverage area. Both types of users arepresent inside the CDMA network; however, SUs are served by an SBS while PUs are served by aPBS. At the SBS, the presence of PUs is detected and the total interference from currently active PUsis also measured using fluctuations of correlation estimators. The levels of interference caused byPUs and SUs are compared with respect to chosen thresholds, which are selected as explained in theprevious section.
Traditional spectrum sensing schemes only find the presence of a PU. If a PU is found using spec-trum sensing, an SU is not allowed to use the spectrum. A CDMA network is interference-limitedand the number of users may be increased using many PN codes with graceful QoS degradation.Energy detectors are not used to detect CDMA signals, because the energy of the signal is almost thesame as that of the noise. Thus, CDMA signals are not easily detectable using energy detectors orother popular spectrum-sensing schemes. CDMA signals are detected with the help of fluctuationsof correlation estimators.
We assume the same threshold for all spectrum sensing schemes studied in this paper, itis expected that similar probability of detection will be obtained in all three cases of sensingalgorithms for our three-cell model. The reference SBS detects the presence of CDMA signalsgenerated by PU1, PU2 and SUs in the same manner as mentioned in [12, 14]. Interference from allinterferers at the SBS is estimated in the presence of noise as in [14]. However, to properly selecta threshold in our model, the following considerations are crucial. If we choose a too high thresh-old value, the probability of false alarm will be reduced, but the probability of missed detection willincrease because some signals giving low fluctuations will not be detected. With the same threshold,the probability of detection seems to be lower than in the case when only one BS scenario (i.e., onePBS and one SBS) is considered.
The spectrum sensing method proposed in [1] has been used, in our work, in a three-cellCR-CDMA network considering soft HO and power control. Although we consider only three cells,the analysis presented here can be applied to a generic scenario with more than three cells as well.Furthermore, our approach can be appropriately modified if the PBS and the SBS are not colocated.However, this extension, currently under investigation, is not straightforward and goes beyond thescope of this paper.
As previously mentioned, the interference powers ISU, IPU1 and IPU2 will be evaluated viasimulations in Section 3. The PRN and CRN are colocated, with the corresponding BSs PBSand SBS positioned at the centre of each cell. We evaluate interference at SBS considering the(two classes of) PUs and the SUs separately.
The propagation radio channel is modeled as in [19]. More precisely, the link gain for a user atlocation .r , �/ in polar coordinates, with respect to BSi , i 2 ¹0, 1, 2º, is
Gi .r , �/D di .r , �/�˛p10�S=10 , (2)
Copyright © 2012 John Wiley & Sons, Ltd. Int. J. Commun. Syst. 2014; 27:1582–1600DOI: 10.1002/dac
1588 S. D. ROY ET AL.
where d i .r , �/ is the distance between the MS and BSi , ˛p is the path loss exponent and 10�s=10
is the log-normal component with �s normally distributed with zero mean and variance �2s . Theshadow fading at i-th BS is [19]
�s,i D a� C b�i , (3)
where a2 C b2 D 1, � and �i are independent Gaussian random variables with zero mean andvariance �2s [20]. The out-cell interference consists of the interference because of MSs from regionsE, C, G, H of cell #1 and from regions D, F, I, J of cell #2. MSs in the farthest sectors (G, H, I, J) areassumed to be power controlled by the respective BSs. The reference user is located in the non-HOregion of the reference sector, that is, in region ‘A’. The total in-cell interference in cell # 0 is
Iin D I1C I2, (4)
where I1 is due to all MSs in A and those in B connected to BS0, I2 is due to MSs in B but connectedto BS1 and BS2. The out-cell interference is
Iout D 2 .IEC Ic1C Ic2C IcoC IGC IH/ , (5)
where IE is the interference power because of MSs in region E and connected to BS1 (note that SUswould be connected to SBS1 and PUs would be connected to PBS1); Ic1 and Ic2 are the interferencepowers because of MSs in region C and power controlled by BS1 and BS2, respectively; Ico is dueto the MSs in region C and controlled by BS0; IG and IH are the interference powers because ofMSs in regions G and H. As previously mentioned, MSs in these farthest sectors are assumed to bepower controlled by the corresponding BS, that is, BS1. A multiplication factor equal to 2 is usedin (5) to take into account the (same) interference contribution from cell #2. The actual receivedpower from the desired SU is U D SReS , where S is a Gaussian random variable with zero meanand variance �2S D �
2e . Thus, �e can be interpreted as a power control error (PCE). The desired SU
is assumed to be in the non-HO region, that is, in region ‘A’.
2.3. Contribution of the paper
Now we highlight the major contributions of our paper:
� We propose a CR-CDMA networking model with coexisting CRN and PRN in the presence ofsoft HO.� Two new spectrum sensing schemes have been developed.� Performance evaluation of spectrum sensing schemes (Scheme 0, Scheme 1, Scheme 2) has
been carried out in terms of outage, blocking probability, BER and average data rate of PUand SU.� A simulation testbed, as described below, has been developed to evaluate the performance of
the spectrum sensing schemes.
In the next section, we show the simulation model and subsequently show some interesting results.
3. SIMULATION MODEL
The simulations are carried out in MATLAB with the following main input parameters: the degreeof soft HO (denoted as PRh/, the shadowing correlation (denoted as a2), the PCE (denoted as �e)and the number of PUs and SUs. The soft HO region boundary Rh is given as Rh D R0
p1�PRh ,
where R0 is the radius (normalized to unity for ease of implementation) of the circular cell whichapproximates the hexagonal cell.
3.1. Generation of user locations and interference powers
In each cell, users are assumed to be uniformly distributed and continuously active [21]. Thegeneration of the users’ locations and the interference powers is carried out considering thefollowing steps:
Copyright © 2012 John Wiley & Sons, Ltd. Int. J. Commun. Syst. 2014; 27:1582–1600DOI: 10.1002/dac
COGNITIVE RADIO CDMA NETWORKING WITH SPECTRUM SENSING 1589
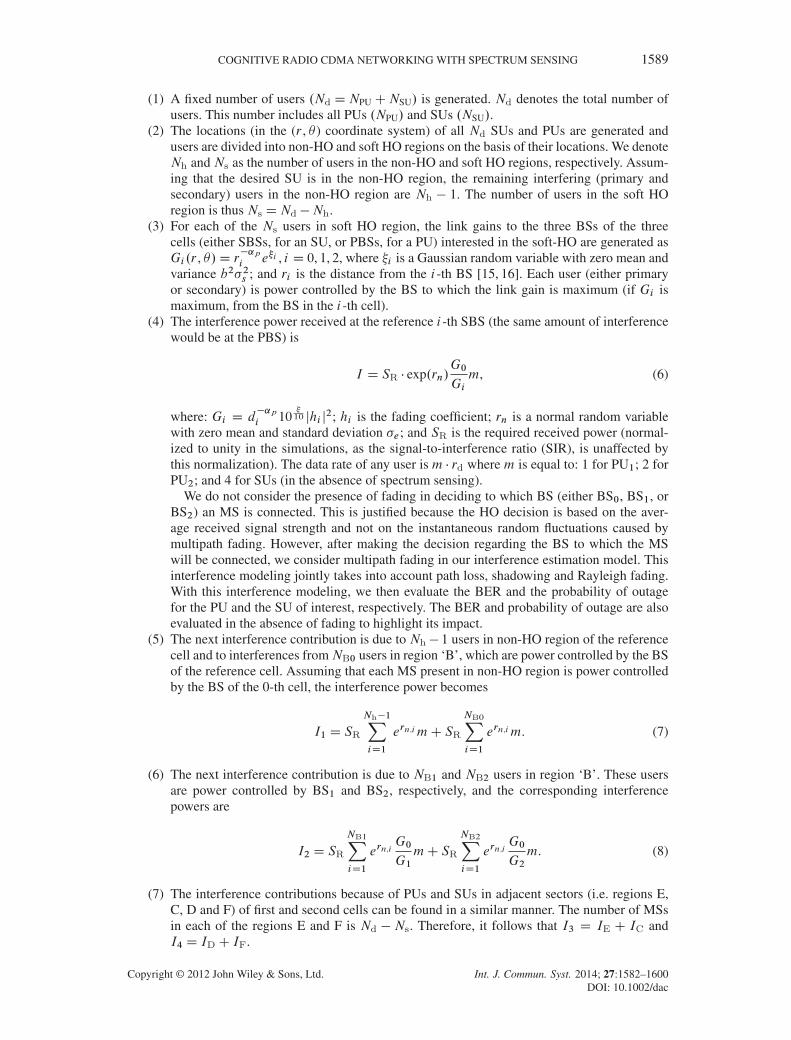
(1) A fixed number of users .Nd DNPUCNSU/ is generated. Nd denotes the total number ofusers. This number includes all PUs .NPU/ and SUs .NSU/.
(2) The locations (in the (r , �) coordinate system) of all Nd SUs and PUs are generated andusers are divided into non-HO and soft HO regions on the basis of their locations. We denoteNh and Ns as the number of users in the non-HO and soft HO regions, respectively. Assum-ing that the desired SU is in the non-HO region, the remaining interfering (primary andsecondary) users in the non-HO region are Nh � 1. The number of users in the soft HOregion is thus Ns DNd �Nh.
(3) For each of the Ns users in soft HO region, the link gains to the three BSs of the threecells (either SBSs, for an SU, or PBSs, for a PU) interested in the soft-HO are generated asGi .r , �/D r�˛pi e�i , i D 0, 1, 2, where �i is a Gaussian random variable with zero mean andvariance b2�2s ; and ri is the distance from the i-th BS [15, 16]. Each user (either primaryor secondary) is power controlled by the BS to which the link gain is maximum (if Gi ismaximum, from the BS in the i-th cell).
(4) The interference power received at the reference i-th SBS (the same amount of interferencewould be at the PBS) is
I D SR � exp.rn/G0
Gim, (6)
where: Gi D d�˛pi 10
�10 jhi j
2; hi is the fading coefficient; rn is a normal random variablewith zero mean and standard deviation �e; and SR is the required received power (normal-ized to unity in the simulations, as the signal-to-interference ratio (SIR), is unaffected bythis normalization). The data rate of any user is m � rd where m is equal to: 1 for PU1; 2 forPU2; and 4 for SUs (in the absence of spectrum sensing).
We do not consider the presence of fading in deciding to which BS (either BS0, BS1, orBS2) an MS is connected. This is justified because the HO decision is based on the aver-age received signal strength and not on the instantaneous random fluctuations caused bymultipath fading. However, after making the decision regarding the BS to which the MSwill be connected, we consider multipath fading in our interference estimation model. Thisinterference modeling jointly takes into account path loss, shadowing and Rayleigh fading.With this interference modeling, we then evaluate the BER and the probability of outagefor the PU and the SU of interest, respectively. The BER and probability of outage are alsoevaluated in the absence of fading to highlight its impact.
(5) The next interference contribution is due to Nh � 1 users in non-HO region of the referencecell and to interferences fromNB0 users in region ‘B’, which are power controlled by the BSof the reference cell. Assuming that each MS present in non-HO region is power controlledby the BS of the 0-th cell, the interference power becomes
I1 D SR
Nh�1X
iD1
ern,imC SR
NB0X
iD1
ern,im. (7)
(6) The next interference contribution is due to NB1 and NB2 users in region ‘B’. These usersare power controlled by BS1 and BS2, respectively, and the corresponding interferencepowers are
I2 D SR
NB1X
iD1
ern,iG0
G1mC SR
NB2X
iD1
ern,iG0
G2m. (8)
(7) The interference contributions because of PUs and SUs in adjacent sectors (i.e. regions E,C, D and F) of first and second cells can be found in a similar manner. The number of MSsin each of the regions E and F is Nd � Ns. Therefore, it follows that I3 D IE C IC andI4 D IDC IF.
Copyright © 2012 John Wiley & Sons, Ltd. Int. J. Commun. Syst. 2014; 27:1582–1600DOI: 10.1002/dac

1590 S. D. ROY ET AL.
(8) The interference powers from MSs in regions G, H, I and J are then generated. LetI5 D IG C IH and I6 D II C IJ. II and IJ are the interference powers because of MSsin regions I and J.
(9) The total interference power can then be computed as
I D
6X
kD1
Ik . (9)
(10) The useful signal from the desired SU is then U D Sdex , where x is a Gaussian random
variable with zero mean and variance �2e . The corresponding SIR is U=I .
3.2. Probability of outage without spectrum sensing
The probability of outage for a user is defined as the probability that the SIR at the user falls belowa predefined SIR threshold. If this happens, then the link quality and other QoS indicators would bedegraded. Therefore, the probability of outage provides a measure of the acceptable user QoS level.
The following steps are considered for the evaluation of the probability of outage:
(1) The users (either PUs or SUs) are assumed to be continuously active, that is, the users arecharacterized by an activity factor equal to 1.
(2) For a desired SU, the SIR is generated as shown in the previous section and is compared witha threshold value given by �=th D �th=Gp, where Gp indicates the processing gain and the SIRthreshold is denoted as �th.
(3) If the SIR falls below �=th, an outage counter (outagecount) is incremented.
(4) Steps (2) and (3) are repeated a large number of times .Nt >> 1/ to yield an accurate estimateof the probability of outage Pout as outagecount=Nt .
3.3. Probability of outage with spectrum sensing
The following steps are considered for the evaluation of the probability of outage in this scenario:
(1) As in the absence of spectrum sensing, a fixed number of users .NPU andNSU/ is consid-ered. The interference contributions by PUs (PU1 and PU2) are obtained as described inSection 3.1. The interference caused by SUs can be similarly calculated. The interferencepowers from SUs and PUs are calculated on the basis of the number of PUs and SUs currentlyactive in the system.
(2)pˇ D ISU=IPU, that is, the ratio between the interference power because of SUs’ activity and
the interference power because of PUs’ activity, is evaluated at the SBS.(3) The condition
pˇC 1 6 .1=ucp/ (or the conditions imposed by Schemes 1 and 2 described
in Section 2) is checked at the SBS.(4) If the condition is not satisfied, then SUs are removed one by one, initially from the non-HO
region of the 0-th cell (region ‘A’) and then from other zones, that is, regions B, C, D, E, F, Gor H. Once the condition is satisfied or all SUs are removed, then the probability of outage isevaluated as shown in Section 3.3., that is, Pout D outagecount=Nt .
Because our three-cell model is an extension of the one-cell model in [1], we expect similareffects, if the PBS and SBS are not colocated, to those mentioned in [1]. In this situation, all receivedpower must be appropriately modified, at the SBS, in the uplink, because the distances are now dif-ferent. Localization modules, such as GPS, are expedient to find the distances and angles associatedwith each of SUs and PUs. On the opposite, when PBS and SBS are colocated, the same receivedpower at the PBS and the SBS can be considered. In this situation, the power received from a PU atthe PBS is different from the interference caused by the same PU at the SBS. Intuitively, this mightlead to increase in interference level.
Copyright © 2012 John Wiley & Sons, Ltd. Int. J. Commun. Syst. 2014; 27:1582–1600DOI: 10.1002/dac

COGNITIVE RADIO CDMA NETWORKING WITH SPECTRUM SENSING 1591
3.4. Probability of blocking without spectrum sensing
When a user wants to make a call to another user in the network, the user may get a connection ifsome of the channels (radio resources, such as frequency bands and spreading codes) are free. How-ever, if all the channels are occupied, then the user will be denied a connection. The probability ofblocking indicates the probability of a denied connection. In a network, the probability of blockingshould be as small as possible, because it physically relates to the satisfaction of a user requestinga connection.
A new user, attempting to join the network and violating the condition described in Section 3.3at point 3, will be denied access to the network, that is, will be blocked. The probability of blockingcan then be computed considering the following steps:
(1) We consider an SIR threshold that guarantees a sufficient QoS level to continue a call.(2) Next, we consider a new user generating a call. We evaluate the instantaneous SIR at the SBS
considering a fixed number of PUs and a fixed number of SUs (including the new user).(3) If the instantaneous SIR at the SBS is lower than �=th D �th=Gp, then the call is blocked.
The above steps are repeated a number of times sufficiently large to allow the evaluation of theprobability of blocking as follows: Pblk DNo. of blocked cal ls=No. of cal ls.
3.5. Probability of blocking with spectrum sensing
In this case, we consider one SU of interest and all other SUs as interferers. After spectrum sens-ing, ucp information is made available to the SBS, which can then decide to admit or not the SU.More precisely, when a new SU tries to join the system (i.e. it makes a call) the following casescan occur:
Case 1. The SU may be allowed to join the system with its current profile, that is, with its desireddata rate and current transmit power, because it fulfils the necessary constraints.
Case 2. The SU may be allowed to join the system with reduced data rate and/or transmitpower values, because its current profile does not fulfil the necessary constraints. Ifthis is the case, the transmit power is reduced in steps according to the rule Pnext DPcurrnt � ˛.Pcurrent. The transmit power is reduced up to a minimum value fixed to 50%of the original transmit power. When the interference remains higher than the allowedmaximum tolerable level, even after the transmit power reduction described above, thenthe data rate is reduced. The data rate of the SU is reduced from 4rd to rd, in steps ofrd, until the condition on the maximum tolerable interference level is fulfilled, at whichpoint the SU is allowed into the network. If the condition cannot be satisfied, even afterdata rate reduction to rd, then the SU is blocked.
Case 3. When the condition on the maximum tolerable interference cannot be fulfilled, regardlessof power control and data rate reduction, the call is blocked.
3.6. Average data rate with spectrum sensing
In the presence of spectrum sensing, the average data rate is evaluated together with the block-ing probability. In each simulation run, the data rate of an allowed SU can vary between 4rd and0, as described earlier. Therefore, over a large number of consecutive simulation runs the datarates of the desired SUs are collected and the average data rate is then obtained as the followingarithmetic average:
Avg. data rate Dsummation of data rates
no. of iterations.
3.7. Bit error rate analysis
The BER of a PU is estimated in our three-cell CR-CDMA networking model from the signal-to-interference plus noise ratio expression that takes into account also the signal-to-noise ratio(SNR) because of AWGN. However, for other results, multiple access interference (MAI) will only
Copyright © 2012 John Wiley & Sons, Ltd. Int. J. Commun. Syst. 2014; 27:1582–1600DOI: 10.1002/dac

1592 S. D. ROY ET AL.
be considered, because our scenario is interference-dominated. We compare the BER performanceof our model with that of Ref. [1]. The signal-to-interference plus noise ratio expression given byEquation (9) in [22] has been used to determine, analytically, the BER in one-cell coexistence modelof [12]. However, in our three-cell scenario the BER is evaluated using our simulation testbed, theonly difference, with respect to the evaluation of the other performance indicators, being the fact thatthe AWGN is taken into account following the approach in [22–24]. We also consider the presenceof Rayleigh fading in the evaluation of the BER, to evaluate its impact on the performance of a PU.
4. RESULTS AND DISCUSSIONS
The main parameters of the analytical framework are set as follows: the standard deviation of theshadow fading is �s D 6 dB; the distance between BSs is D D 2000m; the spreading bandwidth isW D 5.0MHz; the chip rate isRchD 5.0Mcps; the PCE is �D 2 dB; the SIR threshold is �thD 6 dB;the path loss exponent is ˛p D 4; the shadowing correlation is characterized by a2 D 0.3 andPRh D 0.3; the basic data rate rd is set to 7 kb/s, if not otherwise explicitly stated; finally, theprocessing gain is defined as GpDRch=rd.
In Figure 2, the probability of outage for an SU is shown as a function of the number of SUs.The number of PUs of type 1 and type 2 are fixed to 5 in both cases. It can be observed that theprobability of outage increases for increasing values of the number of cognitive users. This is due
5 5.5 6 6.5 7 7.5 8 8.5 9
0.01
0.02
0.03
0.04
0.05
0.06
0.07
0.08
Number of SUs
Pro
babi
lity
of O
utag
e
PU1=5, PU2=5, rd=7 kbps, Scheme1
PU1=5, PU2=5, rd=7 kbps, Scheme2
Ghavami SS
Figure 2. Probability of outage for a SU as a function of the number of SUs. The number of PUs is fixed to10 and the basic data rate is set to 7 kb/s.
5 5.5 6 6.5 7 7.5 8 8.5 9 9.5 100
0.05
0.1
0.15
0.2
0.25
0.3
0.35
Data rate of SUs (Kbps)
Pro
babi
lity
of O
utag
e
Without SS Ghavami Scheme1
Figure 3. Probability of outage for a SU as a function of the admissible data rate of a SU. The numbers ofPUs of type 1, of PUs of type 2 and of SUs are 5, 5 and 10, respectively.
Copyright © 2012 John Wiley & Sons, Ltd. Int. J. Commun. Syst. 2014; 27:1582–1600DOI: 10.1002/dac

COGNITIVE RADIO CDMA NETWORKING WITH SPECTRUM SENSING 1593
to a corresponding increase of the MAI caused by SUs. Three curves are shown in this figure: twoare associated with the two schemes proposed in our paper, whereas the remaining one is associatedwith the scheme with spectrum sensing proposed in [12] (the curves are labeled as ‘Ghavami’). Inparticular, three different approaches to spectrum sensing are directly compared: Scheme 1, Scheme2 and the scheme proposed in [12] (‘Ghavami SS’). The probability of outage is lowest when spec-trum sensing is performed jointly with the algorithm proposed in [12]. In this case, in fact, theallowed interference for SUs is determined on the basis of the actual number of PUs currentlyactive. More precisely, if at any given time the active PUs cause an interference power IPU, thenthe interference tolerable by SBS caused from SUs would be equal to
pˇIPU. Thus, the tolerable
interference caused at SBS because of SUs would change adaptively according to the PUs’ activity.On the opposite, Schemes 1 and 2 consider a fixed interference limit because of the overall numberof PUs and SUs in the system, regardless of their specific activity levels. The allowed interferencelimit is lower with less number of PUs. In this figure, the interference limit is set by considering thenumber of PUs to 10 (5 each) in the absence of SUs. However, the maximum tolerable interferencelimit in Scheme 1 is lower than the corresponding one in Scheme 2, so that the probability of out-age is slightly better for Scheme 1. Therefore, it is expected that the performance with the adaptivespectrum sensing algorithm proposed in [12] is the best among all three schemes.
In Figure 3, the probability of outage for a cognitive user is shown as a function of the number ofSUs for different values of the data rate. As one can see, the probability of outage increases when
5 6 7 8 9 10 11 12 130
0.05
0.1
0.15
0.2
0.25
0.3
0.35
Number of SUs
Pro
babi
lity
of B
lock
ing
PU1=5, PU2=5, rd=5, Ghavami SS
PU1=5, PU2=5, rd=10, Ghavami SS
PU1=10, PU2=10, rd=10, Scheme 1
5 5.5 6 6.5 7 7.5 8 8.5 9 9.5 100
0.02
0.04
0.06
0.08
0.1
0.12
0.14
0.16
0.18
Number of SUs
Pro
babi
lity
of B
lock
ing
Ghavami SS Ghavami SS + FadingScheme 1 + Fading
a
b
Figure 4. (a) Probability of blocking of a SU as a function of the number of SUs. The number of PUs is setto 10 and two different values of data rate are considered. (b) Probability of blocking of a SU as a function
of the number of SUs. Comparison of Ghavami SS with Scheme 1 in the presence of Rayleigh fading.
Copyright © 2012 John Wiley & Sons, Ltd. Int. J. Commun. Syst. 2014; 27:1582–1600DOI: 10.1002/dac

1594 S. D. ROY ET AL.
the data rate increases. This is expected, because a higher data rate increases the interference in amultirate CDMA system. The three curves in the figure refer to the three spectrum sensing schemesand correspond to fixed number of both types of PUs (5 PUs for each type) and a fixed numberof SUs (10 SUs). The probability of outage is lowest when spectrum sensing is carried out usingthe ‘Ghavami SS’ scheme. PRh is set to 0.3; however, the probability of outage is likely to reduce,regardless of the spectrum sensing scheme, when higher degrees of soft HO (e.g. PRhD 0.7) areconsidered [20].
In Figure 4(a), the blocking probability for a SU is shown as a function of the number of SUs,while the number of PUs is kept fixed. Two different values of the data rate of SUs are considered.The blocking probability is evaluated in the presence of spectrum sensing. Regardless of the valueof the basic data-rate, the blocking probability is an increasing function of the number of SUs. Itcan be observed that the basic data-rate has a limited impact on the blocking probability. Scheme1 performs better than ‘Ghavami SS’ in terms of blocking probability. In Figure 4(a), the blockingprobability, in case of Scheme 1, is increasing at a low rate (almost a constant for the chosen range ofnumber of SUs) because the maximum interference threshold is set by considering a higher numberof PUs (i.e. at 10 (each)). Because the allowed interference level is set higher by considering largernumber of PUs, the increase in blocking probability of an SU is not significant. In Figure 4(b), we
5 6 7 8 9 10 11 12 130
0.05
0.1
0.15
0.2
0.25
0.3
0.35
Number of PUs
Blo
ckin
g P
roba
bilit
y
SU=5, rd=10 kbps, Scheme1
SU=5, rd=10 kbps, Scheme2
Figure 5. Probability of blocking of a SU as a function of the number of PUs (equally split between the twodifferent types). The number of SUs is set to 5 and the basic data rate is set to 10 kb/s.
5 6 7 8 9 10 11 123000
4000
5000
6000
7000
8000
9000
10000
Number of SUs
Ave
rage
dat
a ra
te o
f SU
(bps
)
PU1=5, PU2=5, rd=5 kbps
PU1=5, PU2=5, rd=10 kbps
Figure 6. Average data rate of a SU as a function of the number of SUs, in the presence of spectrum sensing.The number of PUs is fixed and two possible values for the basic data-rate are considered.
Copyright © 2012 John Wiley & Sons, Ltd. Int. J. Commun. Syst. 2014; 27:1582–1600DOI: 10.1002/dac

COGNITIVE RADIO CDMA NETWORKING WITH SPECTRUM SENSING 1595
compare the performance of Ghavami SS with Scheme 1 in the presence of Rayleigh fading underthe same scenario. In Figure 4(b), in the case of Scheme 1, the maximum interference threshold isset with the number of PUs to five (5) each. The number of PUs is the same as in the case of GhavamiSS. Because the blocking here is based on the maximum interference threshold, the performance ofScheme 1 is slightly better than Ghavami SS. We did not consider the cooperation amongst users forperformance evaluation of a SU as considered in [1]. It is expected that the performance of GhavamiSS with cooperation among users will be better in comparison to Scheme 1. However, the outageprobability is significantly less in the case of Ghavami SS under the same number of PUs.
In Figure 5, the blocking probability for a SU is shown as a function of the number of PUs,considering both Schemes 1 and 2. It can be observed that the blocking probability increases forincreasing numbers of PUs in the system. This is due to the corresponding increase in the inter-ference caused by a large number of users. Scheme 2, however, performs significantly better thanScheme 1 because the maximum tolerable interference limit (related to the maximum number ofsupported PUs) is considerably higher.
In Figure 6, the average data rate of an SU is shown as a function of the number of SUs, consid-ering two possible values of the basic data rate. It can be observed that the average data rate of anSU reduces for increasing values of the number of SUs. This is expected because the interference is
5 5.5 6 6.5 7 7.5 8 8.5 90
0.02
0.04
0.06
0.08
0.1
0.12
0.14
0.16
0.18
Number of SUs
Pro
babi
lity
of O
utag
e
Fading, no SSFading, Ghavami SSNo fading, no SSNo fading, Ghavami SSFading, Scheme 1
5 5.5 6 6.5 7 7.5 8 8.5 90.004
0.006
0.008
0.01
0.012
0.014
0.016
0.018
0.02
0.022
Pro
babi
lity
of O
utag
e Ghavami SS, FadingGhavami SS, No fadingGhavami SS, Multiple antenna
b
a
Number of SUs
Figure 7. (a) The probability of outage for a SU as a function of the number of SUs, in presence of spectrumsensing and Rayleigh fading. The number of PUs is fixed to 10 and the basic data rate is set to 10 kb/s.(b) The probability of outage for a SU as a function of the number of SUs with multiple antennas with five
antenna elements at the SBS.
Copyright © 2012 John Wiley & Sons, Ltd. Int. J. Commun. Syst. 2014; 27:1582–1600DOI: 10.1002/dac
1596 S. D. ROY ET AL.
an increasing function of the number of SUs. Furthermore, the number of users to be blocked wouldbe larger when the interference increases. Assuming that the data rate of a blocked user is zero, thenthe admissible data rate would vary from 4rd to zero. For both considered values of the data rate, theaverage data rate of SUs is a decreasing function of the number of cognitive users. Note, however,that the decrease is relatively faster for higher values of rd. In this figure, the data rate of PUs is keptconstant to evaluate the effects of spectrum sensing scheme, ‘Ghavami SS’, on the achievable datarate of a SU.
In Figure 7(a), the probability of outage for an SU is shown, as a function of the number of SUs, inthe presence of Rayleigh fading. No SS and ‘Ghavami SS’ schemes are considered. In all cases, theoutage probability is an increasing function of the number of SUs. The probability of outage versusthe number of SUs plots for Schemes 1 and 2, in the absence of fading, is already shown in Figure 2.The effect of fading on Scheme 1 is similar as in case of ‘Ghavami SS’. However, in Figure 7(a), theallowed interference limit is set higher in comparison to that of Figure 2. The allowed interferencelimit in the present case is found by considering the number of PUs to 30 (15 each) in the absenceof SUs. The figure clearly indicates that the probability of outage increases significantly, for no SScase, in the presence of Rayleigh fading.
In Figure 7(b), the probability of outage for an SU is shown, as a function of the number ofSUs, in the presence of Rayleigh fading and multiple antennas. The number of antenna elements isassumed to be five (5). The received signals from different antennas are assumed to be independent.We compare the performance of ‘Ghavami SS’ scheme for three different cases, that is, with fading,without fading and using multiple antennas. Multiple antennas are considered in the uplink at theSBS for the SU of interest. Multiple antenna forms a beam for the desired user and other users comeunder the null of the beam. Thus, the total uplink interference at the SBS decreases and the outageprobability of the SU of interest decreases to a large extent as evident from the figure.
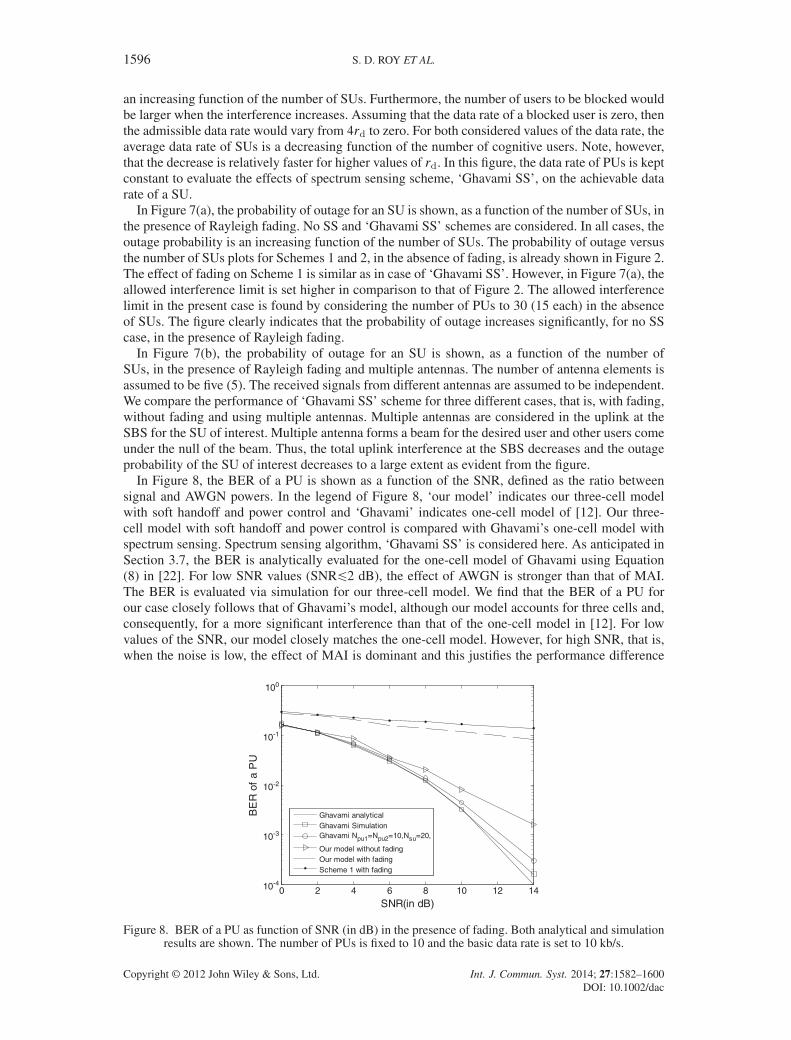
In Figure 8, the BER of a PU is shown as a function of the SNR, defined as the ratio betweensignal and AWGN powers. In the legend of Figure 8, ‘our model’ indicates our three-cell modelwith soft handoff and power control and ‘Ghavami’ indicates one-cell model of [12]. Our three-cell model with soft handoff and power control is compared with Ghavami’s one-cell model withspectrum sensing. Spectrum sensing algorithm, ‘Ghavami SS’ is considered here. As anticipated inSection 3.7, the BER is analytically evaluated for the one-cell model of Ghavami using Equation(8) in [22]. For low SNR values (SNR62 dB), the effect of AWGN is stronger than that of MAI.The BER is evaluated via simulation for our three-cell model. We find that the BER of a PU forour case closely follows that of Ghavami’s model, although our model accounts for three cells and,consequently, for a more significant interference than that of the one-cell model in [12]. For lowvalues of the SNR, our model closely matches the one-cell model. However, for high SNR, that is,when the noise is low, the effect of MAI is dominant and this justifies the performance difference
0 2 4 6 8 10 12 1410-4
10-3
10-2
10-1
SNR(in dB)
BE
R o
f a
PU
Ghavami analyticalGhavami SimulationGhavami Npu1=Npu2=10,Nsu=20,
Our model without fadingOur model with fadingScheme 1 with fading
100
Figure 8. BER of a PU as function of SNR (in dB) in the presence of fading. Both analytical and simulationresults are shown. The number of PUs is fixed to 10 and the basic data rate is set to 10 kb/s.
Copyright © 2012 John Wiley & Sons, Ltd. Int. J. Commun. Syst. 2014; 27:1582–1600DOI: 10.1002/dac

COGNITIVE RADIO CDMA NETWORKING WITH SPECTRUM SENSING 1597
0 1 2 3 4 5 6 7 8 9 1010-4
10-3
10-2
10-1
SIR Threshold (dB)
Pro
babi
lity
of B
lock
ing
of a
PU
PU1 = 15, PU2 = 15, rd = 10 Kbps
PU1 = 20, PU2 = 20, rd = 5 Kbps
PU1 = 20, PU2 = 20, rd = 10 Kbps
PU1 = 15, PU2 = 15, rd = 20 Kbps
100
Figure 9. Probability of blocking of a PU as a function of SIR threshold (in dB).
between our three-cell model and one-cell model of [12]. Furthermore, a significant performancedegradation can be observed in the presence of fading. Performance of Scheme 1 in the presenceof fading has also been shown here. The performance of Scheme 1 is slightly worse than that of‘Ghavami SS’ in the presence of fading.
In Figure 9, the probability of blocking of a PU is shown as a function of the SIR threshold. In thiscase, we assume that all SUs are already blocked. This is justified because a PU can be blocked onlywhen all SUs are blocked already to decrease the total interference at the PBS. Furthermore, theblocking of a PU is considered on the basis of received SIR at the corresponding PBS. The effectsof increasing the number of users and increasing the basic data rate are investigated in this figure.As the number of users is increased, the total interference at the PBS increases, and as a result, theSIR of the PU of interest decreases and finally the probability of blocking of the PU increases. A PUis blocked if the uplink SIR at the PBS is less than the SIR threshold. The probability of blockingof a PU increases as the basic data rate increases. It may be noted that the increase in data rate leadsto decrease in processing gain. The corresponding SIR of the PU of interest at PBS also reduces asthe processing gain decreases. Hence, the blocking probability of the PU of interest increases.
5. CONCLUSIONS
In this paper, we have analyzed the performance of a cognitive (secondary) user in a CR-CDMAsystem. A simulation model has been developed to assess the performance of an SU considering, as areference, the spectrum sensing scheme proposed in [12]. Starting from this scheme, two new spec-trum sensing schemes for a three-cell cellular scenario, incorporating soft HO, have been developed.In particular, the proposed simulation model allows fast performance evaluation of a CR-CDMAsystem. More precisely, the outage and blocking probabilities of the above three spectrum sens-ing schemes have been compared. All these schemes with spectrum sensing perform better thanany scheme with no spectrum sensing. Moreover, Scheme 2 outperforms Scheme 1 in terms of SUblocking probability for any given fixed number of SUs and this improvement is more pronouncedfor large numbers of PUs. The SU performance, in terms of outage and blocking probabilities,improves if the data rate of SUs decreases. Finally, a larger number of cognitive users degrade theSU performance, in terms of outage and blocking probabilities, for fixed number of PUs.
ACKNOWLEDGEMENTS
The activities of G. Ferrari were carried out within the framework of the COST Action IC0902:‘Cognitive Radio and Networking for Cooperative Coexistence of Heterogeneous Wireless Networks’(http://newyork.ing.uniroma1.it/IC0902/).
Copyright © 2012 John Wiley & Sons, Ltd. Int. J. Commun. Syst. 2014; 27:1582–1600DOI: 10.1002/dac

1598 S. D. ROY ET AL.
REFERENCES
1. Ghavami S, Abolhassani B. Spectrum sensing and power/rate control for CDMA cognitive radio networks.International Journal of Communication Systems 2012; 25:121–145. DOI: 10.1002/dac.1258.
2. Shared spectrum company. Spectrum occupancy measurements, 2005. (Available from: http://www.sharedspectrum.com/measurements) [Accessed on May 2008].
3. Mitola III J, Maguire GQ Jr. Cognitive radio: making software radios more personal. IEEE Personal CommunicationsMagazine Aug, 1999; 6(4):13–18.
4. Larson E, Skoglund M. Cognitive radio in a frequency-planned environment: some basic limits. IEEE Transactionon Wireless Communication December 2008; 7(12):4800–4806.
5. Haykin S. Cognitive radio: brain-empowered wireless communications. IEEE Journal on Selected Areas ofCommunications Feb. 2005; 3(2):201–220.
6. Akyildiz IF, Lee W-Y, Varun Mehmet C, Mohanty S. A survey on spectrum management in cognitive radio network.IEEE Communication Magazine April 2008; 46(4):40–48.
7. Chen H, Chen H-H. Spectrum sensing scheduling for group spectrum sharing in cognitive radio networks.International Journal of Communication Systems 2011; 24:62–74. DOI: 10.1002/dac.1139.
8. Oh D-C, Lee Y-H. Cooperative spectrum sensing with imperfect feedback channel in the cognitive radio systems.International Journal of Communication Systems 2010; 23:763–779. DOI: 10.1002/dac.1129.
9. Kim DI, Le LB, Hossain E. Joint rate and power allocation for cognitive radios in dynamic spectrum accessenvironment. IEEE Transaction on Wireless Communication December 2008; 7(12):5517–5527.
10. Rajabzadeh M, Khoshbin H. A novel multicarrier CDMA transmission scheme for cognitive radios with sidelobesuppression. International Journal of Communication Systems 2012. DOI: 10.1002/dac.2326.
11. Raju GVS, Charoensakwiroj J. Orthogonal codes performance in multi-code CDMA. In Proceedings of IEEEInternational Conference on Systems, Man and Cybernetics, Washington, D.C., Vol. 2, 5-8th Oct. 2003; 1928–1931.
12. Ghavami S, Abolhassani B. Opportunistic communications in Multi-Rate CDMA systems for cell capacity improve-ment using cognitive radio. In Proceedings of International Symposium on Telecommunications (IST 2008), Tehran,Iran, August 2008; 193–198.
13. Burel G. Detection of spread spectrum transmissions using fluctuations of correlation estimators. In Proceeding ofIEEE-ISPACS’2000, Honolulu, HI, November 2000; 1–6.
14. Nsiala Nzéza C, Gautier R, Burel G. Blind multiuser detection in multirate CDMA transmissions using fluctuationsof correlation estimators. In Proceedings of IEEE Globe COM, San Francisco, California, USA, November 2006;1–5.
15. Dhar Roy S, Kundu S, Ferrari G, Raheli R. Performance evaluation of cognitive radio CDMA networks with andwithout spectrum sensing. In Proceedings of IEEE Int. Conf. on Communications (ICC 2010), Workshop on CognitiveRadio Interfaces and Signal Processing (CRISP), Cape Town, South Africa, May 2010; 1–5.
16. Dhar Roy S, Kundu S, Ferrari G, Raheli R. On Spectrum Sensing for Underlay Cognitive - CDMA Networks. InProceedings of International Conference on Computers, Communications and Devices (ICCCD), IIT Kharagpur,India, 10-12 December 2010; 1–6.
17. Wong D, Lim T. Soft handoff in CDMA mobile system. IEEE Personal Communication Dec 1997:6–17.18. Kuo-Hao L, Abhijeet M, I-Tai L. Practical implementation of time covariance based spectrum sensing methods
using WARP. In Proceedings of Systems, Applications and Technology Conference (LISAT), IEEE Long Island,Farmingdale, NY, May 2011; 1–5.
19. Kim JY, Stuber GL. CDMA soft HO analysis in the presence of power control error and shadowing correlation. IEEETransaction on Wireless Communication April 2002; 1(2):245–255.
20. Dhar Roy S, Kundu S. Performance of data services in Cellular CDMA in presence of soft handoff and beamforming.In Proceedings of Third International Conference on Industrial and Information Systems, ICIIS 2008, IIT Kharagpur,India, December 2008; 1–6.
21. Kim J, Honig M. Resource allocation for multiple class of DS-CDMA traffic. IEEE Transaction on VehicularTechnology March 2000; 49(2):506–518.
22. Houda K, Fortier P, Huynh TH. Performance of coded multi-rate CDMA systems. In Proceedings of 2000 CanadianConference Electrical and Computer Engineering, Halifax, NS, Canada, Vol. 2, 7-10 March 2010; 1068–1071.
23. Pursley MB, Roffs HEA. Numerical evaluation of correlation parameters for optimal phases of binary shift-registersequences. IEEE Transactions on Communications October 1979; COM-27(10):1597–1604.
24. Hamelin E, Rusch LA, Fortier P. New cross-correlation results for multi-rate CDMA. In Proceedings of IEEEInternational Conference on Communications, Atlanta, June 7-11, 1998; 693–698.
Copyright © 2012 John Wiley & Sons, Ltd. Int. J. Commun. Syst. 2014; 27:1582–1600DOI: 10.1002/dac
COGNITIVE RADIO CDMA NETWORKING WITH SPECTRUM SENSING 1599
AUTHORS’ BIOGRAPHIES
Sanjay Dhar Roy received his BE (Hons.) degree in Electronics and Telecommunica-tion Engineering in 1997 from Jadavpur University, Kolkata, India and M.Tech. degree inTelecommunication Engineering in 2008 from National Institute of Technology Durgapur.He received his Ph.D. degree from National Institute of Technology Durgapur in 2011. Heworked for Koshika Telecom Ltd. from 1997 to 2000. After that he joined the Departmentof Electronics and Communication Engineering, National Institute of Technology Durgapuras a Lecturer in 2000 and is currently an Assistant Professor there. His research interestsinclude radio resource management, handoff, and cognitive radio networks. As of today,he has published 50 research papers in various journals and conferences. Dr. Dhar Roy isa member of IEEE (Communication Society) and is a reviewer of IET Communications,Electronics Letters and Journal of PIER, IJCS, Wiley, International Journal of Electronics,Taylor & Francis.
Sumit Kundu received his BE (Hons.) degree in Electronics and Communication Engineer-ing in 1991 from NIT, Durgapur, India and M.Tech. degree in Telecommunication SystemsEngineering and Ph.D. in Wireless Communication Engineering from IIT Kharagpur, Indiarespectively. He has been a member of the faculty of the Department of ECE, National Insti-tute of Technology, Durgapur since 1995 and is currently an Associate Professor there. Hisresearch interests include radio resource management in wireless networks, cognitive radionetworks, wireless Ad Hoc and sensor networks. He is a member of IEEE (CommunicationSociety) and is a reviewer of several IEEE journals.
Gianluigi Ferrari was born in Parma, Italy, in 1974. He received his ‘Laurea’ and Ph.D.degrees from the University of Parma, Italy, in 1998 and 2002, respectively. Since 2002,he has been with the University Parma, where he currently is an Associate Professorof Telecommunications. He was a visiting researcher at USC (Los Angeles, CA, USA,2000–2001), CMU (Pittsburgh, PA, USA, 2002–2004), KMITL (Bangkok, Thailand, 2007),and ULB (Brussels, Belgium, 2010). Since 2006, he has been the Coordinator of the Wire-less Ad-hoc and Sensor Networks (WASN) Lab (http://wasnlab.tlc.unipr.it/) in the Depart-ment of Information Engineering of the University of Parma. As of today he has publishedmore than 160 papers in leading international journals and conferences, and more than 10book chapters. He is coauthor of 7 books, including ‘Detection Algorithms for WirelessCommunications, with Applications to Wired and Storage Systems’ (Wiley: 2004), ‘Ad HocWireless Networks: A Communication-Theoretic Perspective’ (Wiley: 2006-technical best
seller), ‘LDPC Coded Modulations’ (Springer: 2009), and ‘Sensor Networks with IEEE 802.15.4 Systems: Dis-tributed Processing, MAC, and Connectivity’ (Springer: 2011). He edited the book ‘Sensor Networks: whereTheory Meets Practice’ (Springer: 2010). His research interests include digital communication systems analysisand design, wireless ad hoc and sensor networking, and adaptive digital signal processing. He participates in sev-eral research projects funded by public and private bodies. Professor Ferrari is a co-recipient of: a best studentpaper award at IWWAN’06; a best paper award at EMERGING’10; an award for the outstanding technical con-tributions at ITST-2011; the best paper award at SENSORNETS 2012. The WASNLab team won the first BodySensor Network (BSN) contest, held in conjunction with BSN 2011. He acts as a frequent reviewer for many inter-national journals and conferences. He acts also as a technical program member for many international conferences.He currently serves on the Editorial Boards of several international journals. He was a Guest Editor of the 2010EURASIP JWCN Special Issue on ‘Dynamic Spectrum Access: From the Concept to the Implementation’.
Riccardo Raheli received the Dr. Ing. degree (Laurea) in Electrical Engineering ‘summacum laude’ from the University of Pisa in 1983, the Master of Science degree in Electri-cal and Computer Engineering with full marks from the University of Massachusetts atAmherst, USA, in 1986, and the Doctoral degree (Perfezionamento) in Electrical Engineer-ing ‘summa cum laude’ from the Scuola Superiore S. Anna, Pisa, in 1987. From 1986 to1988 he was a Project Engineer with Siemens Telecomunicazioni, Milan. From 1988 to1991, he was a Research Professor at the Scuola Superiore S. Anna, Pisa. In 1990, hewas a Visiting Assistant Professor at the University of Southern California, Los Angeles,USA. Since 1991, he has been with the University of Parma, as a Research Professor, Asso-ciate Professor since 1998 and Full Professor since 2001. In this role, he was Chairman ofthe Communication Engineering Program Committee from 2002 to 2010 and Member of
Copyright © 2012 John Wiley & Sons, Ltd. Int. J. Commun. Syst. 2014; 27:1582–1600DOI: 10.1002/dac
1600 S. D. ROY ET AL.
the Scientific Committee of CNIT (Consorzio Nazionale Interuniversitario per le Telecomunicazioni) from 2000to 2005. He has also been Member of the Executive Committee of CNIT since 2008 and Member of the Scien-tific Committee of the Doctoral School in Engineering and Architecture since 2011. His scientific interests are inthe general area of Information and Communication Technology, with special attention toward systems for com-munication, processing and storage of information. His research has lead to numerous international publicationsin journals, conference proceedings, and a few industrial patents. He is coauthor of a few scientific monographssuch as ‘Detection Algorithms for Wireless Communications, with Applications to Wired and Storage Systems’(John Wiley & Sons, 2004) and ‘LDPC Coded Modulations’ (Springer, 2009). He is supervising coauthor of thepaper which received the ‘2006 Best Student Paper Award in Signal Processing & Coding for Data Storage’ fromthe Communications Society of the Institute of Electrical and Electronics Engineers (IEEE). He served on theEditorial Board of the IEEE Transactions on Communications from 1999 to 2003. He was Guest Editor of a spe-cial issue of the IEEE Journal on Selected Areas in Communications (JSAC) published in 2005. He served on theEditorial Board of the European Transactions on Telecommunications (ETT) from 2003 to 2008. He was GuestEditor of a special issue of the IEEE Journal of Selected Topics in Signal Processing (JSTSP) published in 2011.He served as Co-Chair of the General Symposium on Selected Areas in Communications at the International Com-munications Conference (ICC 2010), Cape Town, South Africa, and the Communication Theory Symposium atthe Global Communications Conference (GLOBECOM 2011), Houston, Texas, USA. He has also served on theTechnical Program Committee of many international conferences such as ICC, GLOBECOM, IEEE Intern. Symp.Power-Line Commun. and its Appl. (ISPLC), European Signal Processing Conf. (EUSIPCO) and others.
Copyright © 2012 John Wiley & Sons, Ltd. Int. J. Commun. Syst. 2014; 27:1582–1600DOI: 10.1002/dac