cognex corp - annual report
TRANSCRIPT

COGNEX CORP
FORM 10-K(Annual Report)
Filed 02/10/16 for the Period Ending 12/31/15
Address ONE VISION DR
NATICK, MA 01760Telephone 5086503000
CIK 0000851205Symbol CGNX
SIC Code 3823 - Industrial Instruments for Measurement, Display, and Control of Process Variables; and Related Products
Industry Scientific & Technical Instr.Sector Technology
Fiscal Year 12/31
http://www.edgar-online.com© Copyright 2016, EDGAR Online, Inc. All Rights Reserved.
Distribution and use of this document restricted under EDGAR Online, Inc. Terms of Use.

Table of Contents
UNITED STATESSECURITIES AND EXCHANGE COMMISSION
Washington, D.C. 20549
FORM 10-K(MarkOne)
[ X ] Annual report pursuant to Section 13 or 15(d) of the Securities Exchange Act of 1934 for the fiscal year ended December 31, 2015 or[ ] Transition report pursuant to Section 13 or 15(d) of the Securities Exchange Act of 1934 for the transition period from to
.Commission File Number 001-34218
COGNEX CORPORATION(Exactnameofregistrantasspecifiedinitscharter)
Massachusetts 04-2713778
(Stateorotherjurisdictionofincorporationororganization)
(I.R.S.EmployerIdentificationNo.)
One Vision DriveNatick, Massachusetts 01760-2059
(508) 650-3000
(Address,includingzipcode,andtelephonenumber,includingareacode,ofprincipalexecutiveoffices)
Securities registered pursuant to Section 12(b) of the Act:
Title of Each Class Name of Exchange on Which RegisteredCommon Stock, par value $.002 per share The NASDAQ Stock Market LLC
Preferred Stock Purchase Rights The NASDAQ Stock Market LLCSecurities registered pursuant to Section 12(g) of the Act: NoneIndicate by check mark if the registrant is a well-known seasoned issuer, as defined in Rule 405 of the Securities Act.
Yes X No Indicate by check mark if the registrant is not required to file reports pursuant to Section 13 or Section 15(d) of the Act.
Yes No X Indicate by check mark whether the registrant (1) has filed all reports required to be filed by Section 13 or 15(d) of the Securities Exchange Act of 1934 duringthe preceding 12 months (or for such shorter period that the registrant was required to file such reports), and (2) has been subject to such filing requirements forthe past 90 days.
Yes X No Indicate by check mark whether the registrant has submitted electronically and posted on its corporate web site, if any, every Interactive Data File required to besubmitted and posted pursuant to Rule 405 of Regulation S-T during the preceding 12 months (or for such shorter period that the registrant was required tosubmit and post such files).
Yes X No Indicate by check mark if disclosure of delinquent filers pursuant to Item 405 of Regulation S-K is not contained herein, and will not be contained, to the best ofthe registrant’s knowledge, in definitive proxy or information statements incorporated by reference in Part III of this Form 10-K or any amendment to this Form10-K. [ X ]Indicate by check mark whether the registrant is a large accelerated filer, an accelerated filer, a non-accelerated filer, or a smaller reporting company. See thedefinitions of “large accelerated filer,” “accelerated filer” and “smaller reporting company” in Rule 12b-2 of the Exchange Act. (Check one):
x Large accelerated filer ¨ Accelerated filer¨ Non-accelerated filer (Do not check if a smaller reporting company) ¨ Smaller reporting companyIndicate by check mark whether the registrant is a shell company (as defined in Rule 12b-2 of the Exchange Act).
Yes No X Aggregate market value of voting stock held by non-affiliates of the registrant as of July 5, 2015 : $ 3,975,185,000
Common stock, par value $.002 per share, outstanding as of January 31, 2016 : 84,885,334 sharesDOCUMENTS INCORPORATED BY REFERENCE:
The registrant intends to file a Definitive Proxy Statement pursuant to Regulation 14A within 120 days of the end of the fiscal year ended December 31, 2015 .Portions of such Proxy Statement are incorporated by reference in Part III of this report.

Table of Contents
COGNEX CORPORATIONANNUAL REPORT ON FORM 10-K
FOR THE YEAR ENDED DECEMBER 31, 2015
INDEX
PART I 1ITEM 1. BUSINESS 1ITEM 1A. RISK FACTORS 6ITEM 1B. UNRESOLVED STAFF COMMENTS 12ITEM 2. PROPERTIES 12ITEM 3. LEGAL PROCEEDINGS 12ITEM 4. MINE SAFETY DISCLOSURES 13ITEM 4A. EXECUTIVE OFFICERS OF THE REGISTRANT 13
PART II 14ITEM 5. MARKET FOR REGISTRANT’S COMMON EQUITY, RELATED STOCKHOLDER MATTERS, AND
ISSUER PURCHASES OF EQUITY SECURITIES14
ITEM 6. SELECTED FINANCIAL DATA 16ITEM 7. MANAGEMENT’S DISCUSSION AND ANALYSIS OF FINANCIAL CONDITION AND RESULTS OF
OPERATIONS17
ITEM 7A. QUANTITATIVE AND QUALITATIVE DISCLOSURES ABOUT MARKET RISK 29ITEM 8. FINANCIAL STATEMENTS AND SUPPLEMENTARY DATA 32ITEM 9. CHANGES IN AND DISAGREEMENTS WITH ACCOUNTANTS ON ACCOUNTING AND FINANCIAL
DISCLOSURE68
ITEM 9A. CONTROLS AND PROCEDURES 68ITEM 9B. OTHER INFORMATION 70
PART III 70ITEM 10. DIRECTORS, EXECUTIVE OFFICERS, AND CORPORATE GOVERNANCE 70ITEM 11. EXECUTIVE COMPENSATION 70ITEM 12. SECURITY OWNERSHIP OF CERTAIN BENEFICIAL OWNERS AND MANAGEMENT AND
RELATED STOCKHOLDER MATTERS70
ITEM 13. CERTAIN RELATIONSHIPS AND RELATED TRANSACTIONS, AND DIRECTOR INDEPENDENCE 71ITEM 14. PRINCIPAL ACCOUNTING FEES AND SERVICES 71
PART IV 71ITEM 15. EXHIBITS AND FINANCIAL STATEMENT SCHEDULES 71
Table of Contents
PART IThis Annual Report on Form 10-K contains forward-looking statements within the meaning of the Federal Securities Laws. Readers can identifythese forward-looking statements by our use of the words “expects,” “anticipates,” “estimates,” “believes,” “projects,” “intends,” “plans,” “will,” “may,”“shall,” “could,” “should,” and similar words and other statements of a similar sense. Our future results may differ materially from current results andfrom those projected in the forward-looking statements as a result of known and unknown risks and uncertainties. Readers should pay particularattention to considerations described in the section captioned “Risk Factors,” appearing in Part I - Item 1A of this Annual Report on Form 10-K. Wecaution readers not to place undue reliance upon any such forward-looking statements, which speak only as of the date made. We disclaim anyobligation to subsequently revise forward-looking statements to reflect the occurrence of anticipated or unanticipated events or circumstances afterthe date such statements are made.Unless the context otherwise requires, the words “Cognex ® ,” the “Company,” “we,” “our,” “us,” and “our company” refer to Cognex Corporation andits consolidated subsidiaries.
ITEM 1: BUSINESSCorporate ProfileCognex Corporation was incorporated in Massachusetts in 1981. Our corporate headquarters are located at One Vision Drive, Natick,Massachusetts 01760 and our telephone number is (508) 650-3000.Cognex is a leading worldwide provider of machine vision products that capture and analyze visual information in order to automate tasks, primarilyin manufacturing processes, where vision is required. Machine vision products are used to automate the manufacture and tracking of discrete items,such as mobile phones, aspirin bottles, and automobile tires, by locating, identifying, inspecting, and measuring them during the manufacturing ordistribution process. Machine vision is important for applications in which human vision is inadequate to meet requirements for size, accuracy, orspeed, or in instances where substantial cost savings are obtained through the reduction of labor or improved product quality. Today, many types ofmanufacturing equipment require machine vision because of the increasing demands for speed and accuracy in manufacturing processes, as wellas the decreasing size of items being manufactured.
What is Machine Vision?Since the beginning of the Industrial Revolution, human vision has played an indispensable role in the process of manufacturing products. Humaneyes did what no machines could do themselves: locating and positioning work, tracking the flow of parts, and inspecting output for quality andconsistency. Today, however, the requirements of many manufacturing processes have surpassed the limits of human eyesight. Manufactured itemsoften are produced too quickly or with tolerances too small to be analyzed by the human eye. In response to manufacturers’ needs, “machine vision”technology emerged, providing manufacturing equipment with the gift of sight. Machine vision systems were first widely embraced by manufacturersof electronic components who needed this technology to produce computer chips with decreasing geometries. However, advances in technologyand ease-of-use, combined with the decreasing cost of implementing vision applications, have made machine vision available to a broader range ofusers.
1

Table of Contents
Machine vision products combine cameras with intelligent software to collect images and then answer questions about these images, such as:
Question Description ExampleGUIDANCE Where is it?
Determining the exact physical location andorientation of an object.
Determining the position of a printed circuit board so that arobot can automatically be guided to place electroniccomponents.
IDENTIFICATION What is it?
Identifying an object by analyzing itsphysical appearance or by reading a serialnumber or symbol.
Reading a two-dimensional barcode directly marked on anautomotive airbag so that it can be tracked and processedcorrectly through manufacturing.
INSPECTION How good is it?
Inspecting an object for flaws or defects.
Checking for debris to ensure that foreign objects are notpresent in a product before shipping to consumers.
GAUGING What size is it?
Determining the dimensions of an object.
Determining the diameter of a bearing prior to finalassembly.
Machine Vision MarketCognex machine vision is primarily used in the manufacturing sector, where the technology is widely recognized as an important component ofautomated production and quality assurance. In this sector, the Company’s customers are primarily in the factory automation market. Factoryautomation customers purchase Cognex vision products and incorporate them into their manufacturing processes. Virtually every manufacturer canachieve better quality and manufacturing efficiency by using machine vision, and therefore, this market includes a broad base of customers across avariety of industries, including consumer electronics, automotive, consumer products, food and beverage, medical devices, and pharmaceuticals.Factory automation customers also purchase Cognex products for use outside of the assembly process, such as using ID products in logisticsautomation for package sorting and distribution. Sales to factory automation customers represented 95% of total revenue in 2015 compared to 94%of total revenue in 2014.A small percentage of our customers are in the semiconductor and electronics capital equipment market. These customers purchase Cognex visionproducts and integrate them into the automation equipment that they manufacture and then sell to their customers to either make semiconductorchips or assemble printed circuit boards. Demand from these customers has been relatively flat on an annual basis for the past several years. Salesto semiconductor and electronics capital equipment manufacturers represented only 5% of total revenue in 2015 compared to 6% of total revenue in2014.In 2015 and 2014, direct and indirect revenue from Apple Inc. accounted for 18% and 16% of total revenue, respectively. In 2013, no customeraccounted for greater than 10% of total revenue.Business StrategyOur goal is to expand our position as a leading worldwide provider of machine vision products. Sales to customers in the factory automation marketrepresent the largest percentage of our total revenue, and we believe that this market provides the greatest potential for long-term revenue growth.In order to grow the factory automation market, we have invested in developing new products and functionality that make vision easier to use andmore affordable, and therefore, available to a broader base of customers. This investment includes selective expansion into new industrial visionapplications through internal development, as well as the acquisition of businesses and technologies. We have also invested in building a worldwidesales and support infrastructure in order to access more of the potential market for machine vision. This investment includes opening sales offices inemerging markets, such as China, India, Brazil, and Eastern Europe, where we believe many manufacturers can benefit from incorporating machinevision into their production processes, and developing strategic alliances with other leading providers of factory automation products.Acquisitions and DivestituresOur business strategy includes selective expansion into new machine vision applications and markets through the acquisition of businesses andtechnologies. We plan to continue to seek opportunities to expand our product line, customer base, distribution network, and technical talent throughacquisitions in the machine vision industry.
2

Table of Contents
On July 6, 2015, we completed the sale of our Surface Inspection Systems Division (SISD) to AMETEK, Inc. for $156 million in cash. The after-taxgain associated with this sale was $78 million. SISD specializes in machine vision products that inspect the surfaces of materials processed in acontinuous fashion. SISD did not meet our long-term objectives and its divestiture was a strategic decision for us. With this sale, we intend to focusour efforts on discrete manufacturing where we see the greatest growth potential. The financial results of SISD are reported as a discontinuedoperation in this Annual Report on Form 10-K and all prior period comparative financial data have been reported excluding SISD.We had previously reported SISD as one of our two segments. Given the disposition of the SISD segment, management reviewed its segmentreporting and concluded that the Company now operates in one segment, machine vision technology. We offer a variety of machine vision productsthat have similar economic characteristics, have the same productions processes, and are distributed by the same sales channels to the same typesof customers. Information about segments may be found in Note 18 to the Consolidated Financial Statements, appearing in Part II - Item 8 of thisAnnual report on Form 10-K.On August 21, 2015, we acquired selected assets of Manatee Works, Inc., a privately-held U.S.-based developer of barcode scanning softwaredevelopment kits (SDKs). We plan to leverage Manatee's current developer network and business model of attracting new developers to drive leadsfor our ID products. As a result of this transaction, we also acquired technology for use in mobile devices. We paid $1 million in cash upon closingand may pay additional contingent cash consideration of up to $5 million over the next three years based upon certain milestone revenue levels.Management considers business acquisitions to be an important part of our growth strategy, and although we continue to actively seek outacquisition opportunities, we are selective in choosing businesses that we believe will enhance our long-term growth rate and profitability.ProductsCognex offers a full range of vision and ID products designed to meet customer needs at different performance and price points. Our products rangefrom low-cost vision sensors that are easily integrated, to PC-based systems for users with more experience or more complex requirements. Ourproducts also have a variety of physical forms, depending upon the user’s need. For example, customers can purchase vision software to use withtheir own camera and processor, or they can purchase a standalone unit that combines camera, processor, and software into a single package.Vision SoftwareVision software provides users with the most flexibility by combining the full general-purpose library of Cognex vision tools with the cameras, framegrabbers, and peripheral equipment of their choice. The vision software may run on the customer’s PC, which enables easy integration with PC-based data and controls. Applications based upon Cognex vision software perform a wide range of vision tasks, including part location, identification,measurement, assembly verification, and robotic guidance. Cognex's VisionPro ® software offers an extensive suite of patented vision tools foradvanced programming, while Cognex Designer allows customers to build complete vision applications with the simplicity of a graphical, flowchart-based programming environment. Cognex also offers a series of Displacement Sensors that are sold with vision software for use in highlydemanding three-dimensional applications.Vision SystemsVision systems combine camera, processor, and vision software into a single, rugged package with a simple and flexible user interface forconfiguring applications. These general-purpose vision systems are designed to be easily programmed to perform a wide range of vision tasksincluding part location, identification, measurement, assembly verification, and robotic guidance. Cognex offers the In-Sight ® product line of visionsystems in a wide range of models to meet various price and performance requirements.Vision SensorsUnlike general-purpose vision systems that can be programmed to perform a wide variety of vision tasks, vision sensors are designed to deliver verysimple, low-cost, reliable solutions for a limited number of common vision applications such as checking the presence and size of parts. Cognexoffers the Checker ® product line of vision sensors that performs single-purpose vision tasks. Late in 2015, Cognex introduced a new vision sensor,the In-Sight 2000 Series, which combines the power of an In-Sight vision system with the simplicity and affordability of a vision sensor.ID ProductsID products quickly and reliably read codes (e.g., one-dimensional barcodes or two-dimensional data matrix codes) that have been applied to, ordirectly marked on, discrete items during the manufacturing process. Manufacturers of goods ranging from automotive parts, pharmaceutical items,aircraft components, and medical devices are increasingly using direct part mark (DPM) identification to ensure that the appropriate manufacturingprocesses are performed in
3

Table of Contents
the correct sequence and on the right parts. In addition, DPM is used to track parts from the beginning of their life to the end, and is also used insupply chain management and repair.Cognex also offers applications in the automatic identification market outside of the manufacturing sector, such as using ID products in logisticsautomation for package sorting and distribution. As shipping volumes grow, more distribution centers are choosing to upgrade their traditional laser-based scanners to image-based barcode readers, which will cost-effectively increase package sorter efficiency and throughput by improving readrates. Cognex offers the DataMan ® product line of ID readers that includes both hand-held and fixed-mount models.
Research, Development, and EngineeringCognex engages in research, development, and engineering (RD&E) to enhance our existing products and to develop new products andfunctionality to meet market opportunities. In addition to internal research and development efforts, we intend to continue our strategy of gainingaccess to new technology through strategic relationships and acquisitions where appropriate.As of December 31, 2015 , Cognex employed 352 professionals in RD&E, many of whom are software developers. Cognex’s RD&E expensestotaled $69,791,000 in 2015 , $55,831,000 in 2014 , and $44,315,000 in 2013 , or approximately 15%, 13%, and 15% of revenue, respectively. Webelieve that a continued commitment to RD&E activities is essential in order to maintain or achieve product leadership with our existing products andto provide innovative new product offerings, as well as to provide engineering support for large customers. In addition, we consider our ability toaccelerate time-to-market for new products to be critical to our revenue growth. Therefore, we expect to continue to make significant RD&Einvestments in the future. At any point in time, we have numerous research and development projects underway. Although we target our RD&Espending to be between 10% and 15% of total revenue, this percentage is impacted by revenue levels and investing cycles.
Manufacturing and Order Fulfillment
Cognex’s products are manufactured utilizing a turnkey operation whereby the majority of component procurement, system assembly, and initialtesting are performed by third-party contract manufacturers. Cognex’s primary contract manufacturer is located in Indonesia. The contractmanufacturers use specified components sourced from a vendor list approved by Cognex and assembly/test documentation created and controlledby Cognex. Certain components are presently sourced from a single vendor that is selected based on price and performance considerations. In theevent of a supply disruption from a single-source vendor, these components may be purchased from an alternative vendor.After the completion of initial testing, a fully assembled product from the contract manufacturers is routed to our facility in Cork, Ireland or Natick,Massachusetts, USA, where trained Cognex personnel load the software onto the product and perform quality control procedures. Finished productfor customers in the Americas is then shipped from our Natick, Massachusetts facility, while finished product for customers outside of the Americasis shipped from our Cork, Ireland facility.Sales Channels and Support ServicesCognex sells its products through a worldwide direct sales force that focuses on the development of strategic accounts that generate or areexpected to generate significant sales volume, as well as through a global network of integration and distribution partners. Our integration partnersare experts in vision and complementary technologies that can provide turnkey solutions for complex automation projects using vision, and ourdistribution partners provide sales and local support to help Cognex reach the many prospects for our products in factories around the world.As of December 31, 2015, Cognex’s sales force consisted of 491 professionals, and our partner network consisted of approximately 488 activeintegrators and authorized distributors. Sales engineers call directly on targeted accounts, with the assistance of application engineers, and managethe activities of our partners within their territories in order to implement the most advantageous sales model for our products. Cognex has sales andsupport personnel located throughout the Americas, Europe, and Asia. In recent years, we have expanded our sales force in emerging markets,such as China, India, Brazil, and Eastern Europe, where we believe many manufacturers can benefit from incorporating machine vision into theirproduction processes. In 2010, we established a Wholly Foreign Owned Enterprise (WFOE) in Shanghai, China, and we began to sell to ourChinese customers through this new entity in 2011. The WFOE is able to accept payment from Chinese customers in Yuan, also known asRenminbi, which we believe allows us to reach more of the potential market for machine vision throughout Mainland China.Sales to customers based outside of the United States represented approximately 73% of total revenue in 2015 compared to approximately 72% oftotal revenue in 2014. In 2015, approximately 44% of our total revenue came from customers based in Europe, 12% from customers based inGreater China, 6% from customers based in Japan, and
4

Table of Contents
11% from customers based in other regions outside the United States. Sales to customers based in Europe are denominated in Euros and U.S.Dollars, sales to customers based in Greater China are denominated in Yuan for sales within Mainland China and U.S. Dollars in other territories,sales to customers based in Japan are predominantly denominated in Yen, and sales to customers based in other regions are denominated in U.S.Dollars. Financial information about geographic areas may be found in Note 18 to the Consolidated Financial Statements, appearing in Part II -Item 8 of this Annual Report on Form 10-K.Cognex’s service offerings include maintenance and support, consulting, and training services. Maintenance and support programs includehardware support programs that entitle customers to have failed products repaired, as well as software support programs that provide customerswith application support and software updates on the latest software releases. Application support is provided by technical support personnellocated at Cognex regional offices, as well as by field service engineers that provide support at the customer’s production site. We provideconsulting services that range from a specific area of functionality to a completely integrated vision application or installed ID application. Trainingservices include a variety of product courses that are available at our offices worldwide, at customer facilities, and on computer-based tutorials,video, and the internet.
Intellectual PropertyWe rely on the technical expertise, creativity, and knowledge of our personnel, and therefore, we utilize patent, trademark, copyright, and tradesecret protection to maintain our competitive position and protect our proprietary rights in our products and technology. While our intellectualproperty rights are important to our success, we believe that our business as a whole is not materially dependent on any particular patent,trademark, copyright, or other intellectual property right.As of December 31, 2015 , Cognex had been granted, or owned by assignment, 437 patents issued worldwide and had another 358 patentapplications pending worldwide. Cognex has used, registered, or applied to register a number of trademark registrations in the United States and inother countries. Cognex’s trademark and servicemark portfolio includes various registered marks, including, among others, Cognex ® , VisionPro ® ,In-Sight ® , Checker ® , and DataMan ® , as well as many common-law marks.
Compliance with Environmental ProvisionsCognex’s capital expenditures, earnings, and competitive position are not materially affected by compliance with federal, state, and localenvironmental provisions which have been enacted or adopted to regulate the distribution of materials into the environment.CompetitionThe machine vision market is fragmented and our competitors are typically other vendors of machine vision systems, controllers, and components;manufacturers of image processing systems, sensors, and components; and system integrators. In addition, in the semiconductor and electronicscapital equipment market, and with respect to machine builders in the factory automation market, we compete with the internal engineeringdepartments of current or prospective customers. In the identification and logistics market, we compete with manufacturers of automaticidentification systems. Any of these competitors may have greater financial and other resources than Cognex. Although we consider Cognex to beone of the leading machine vision companies in the world, reliable estimates of the machine vision market and the number of competitors are notavailable.Cognex’s ability to compete depends upon our ability to design, manufacture, and sell high-quality products, as well as our ability to develop newproducts and functionality that meet evolving customer requirements. The primary competitive factors affecting the choice of a machine vision or IDsystem include vendor reputation, product functionality and performance, ease of use, price, and post-sales support. The importance of each ofthese factors varies depending upon the specific customer’s needs.
BacklogAs of December 31, 2015 , backlog, which includes deferred revenue, totaled $27,020,000, compared to $36,036,000 as of December 31, 2014 .Backlog reflects customer purchase orders for products scheduled for shipment primarily within 60 days. The level of backlog at any particular dateis not necessarily indicative of future revenue. Delivery schedules may be extended and orders may be canceled at any time subject to certaincancellation penalties.
EmployeesAs of December 31, 2015 , Cognex employed 1,305 persons, including 658 in sales, marketing, and service activities; 352 in research,development, and engineering; 128 in manufacturing and quality assurance; and 167 in information technology, finance, and administration. Of our1,305 employees, 728 are based outside of the United States. None
5

Table of Contents
of our employees are represented by a labor union and we have experienced no work stoppages. We believe that our employee relations are good.
Available InformationCognex maintains a website on the World Wide Web at www.cognex.com. We make available, free of charge, on our website in the “Company”section under the caption “Investor Information” followed by “Financial Information” and then “SEC FiIings,” our Annual Report on Form 10-K,Quarterly Reports on Form 10-Q, and Current Reports on Form 8-K, including exhibits, and amendments to those reports filed or furnished pursuantto Section 13(a) or 15(d) of the Securities Exchange Act of 1934, as amended, as soon as reasonably practicable after such reports areelectronically filed with, or furnished to, the SEC. Cognex’s reports filed with, or furnished to, the SEC are also available at the SEC’s website atwww.sec.gov. Information contained on our website is not a part of, or incorporated by reference into, this Annual Report on Form 10-K.
ITEM 1A: RISK FACTORSThe risks and uncertainties described below are not the only ones that we face. Additional risks and uncertainties that we are unaware of, or that wecurrently deem immaterial, also may become important factors that affect our company in the future. If any of these risks were to occur, ourbusiness, financial condition, or results of operations could be materially and adversely affected. This section includes or refers to certain forward-looking statements. We refer you to the explanation of the qualifications and limitations on such forward-looking statements, appearing under theheading "Forward-Looking Statements" in Part II - Item 7 of this Annual Report on Form 10-K.The loss of a large customer could have an adverse effect on our business.Revenue from a single customer accounted for 18% of total revenue in 2015 and 16% of total revenue in 2014. Customers of this size may divertmanagement’s attention from other operational matters and pull resources from other areas of the business, resulting in potential loss of revenuefrom other customers. In addition, customers of this size may receive volume pricing discounts and a higher level of post-sale support, which maylower our gross margin percentage. Furthermore, we have extended credit terms to this customer, resulting in large expenditures for inventorymonths in advance of cash collection, as well as large accounts receivable balances denominated in U.S. Dollars on our Irish subsidiary’s Euro-denominated books that exposes us to foreign currency gains or losses while these receivables are outstanding. In certain instances due to longsupplier lead times, we have purchased inventory in advance of receipt of a customer purchase order, and this has exposed us to an increased riskof excess or obsolete inventory and resulting charges.In 2013, no customer accounted for greater than 10% of total revenue. As a large portion of our sales are through resellers however, there may beend customers of our resellers that are large consumers of our products. Furthermore, there may be industry leaders that are able to exertpurchasing power over their vendors' supply chains, particularly in the automotive and consumer electronics industries. Our expansion within thefactory automation marketplace has reduced our reliance upon the revenue from any one customer. Nevertheless, the loss of, or significantcurtailment of purchases by, any one or more of our larger customers could have a material adverse effect on our operating results.Global economic conditions may negatively impact our operating results.Our revenue levels are impacted by global economic conditions, as we have a significant business presence in many countries throughout theworld. In 2009, the credit market crisis and slowing global economies resulted in significantly lower demand for our products, as many of ourcustomers experienced deterioration in their businesses, cash flow issues, difficulty obtaining financing, and declining business confidence. Althoughour business has recovered since that time, economic conditions are still unsettled in certain regions, resulting in a challenging environment toachieve our targeted rate of revenue growth. If global economic conditions remain unsettled or were to deteriorate, our revenue and our ability togenerate operating profits could be materially adversely affected.
6

Table of Contents
As a result of global economic conditions, our business is subject to the following risks, among others:• our customers may not have sufficient cash flow or access to financing to purchase our products,• our customers may not pay us within agreed upon terms or may default on their payments altogether,• our vendors may be unable to fulfill their delivery obligations to us in a timely manner,• lower demand for our products may result in charges for excess and obsolete inventory if we are unable to sell inventory that is
either already on hand or committed to purchase,• lower cash flows may result in impairment charges for acquired intangible assets or goodwill,• a decline in our stock price may make stock options a less attractive form of compensation and a less effective form of retention
for our employees, and• the trading price of our common stock may be volatile.
As of December 31, 2015, the Company had $622 million in cash and investments. In addition, Cognex has no long-term debt and we do notanticipate needing debt financing in the near future. We believe that our strong cash position puts us in a relatively good position to weather anothereconomic downturn. Nevertheless, our operating results have been materially adversely affected in the past, and could be materially adverselyaffected in the future, as a result of unfavorable economic conditions and reduced capital spending by manufacturers worldwide.A downturn in the consumer electronics or automotive industries may adversely affect our business.In 2015, the largest industries that we served in the factory automation market were the consumer electronics and automotive industries. Ourbusiness is impacted by the level of capital spending in these industries, as well as the product design cycles of our major customers in theseindustries. The market leaders in these industries are able to exert purchasing power over their vendors' supply chains, and our large customers inthese industries may decide to purchase fewer products from Cognex or stop purchasing from Cognex altogether. As a result, our operating resultscould be materially and adversely affected by declining sales in these industries.Our inability to penetrate new markets may impede our revenue growth.We are pursuing applications in the automatic identification market outside of the manufacturing sector, such as using ID products in logisticsautomation for package sorting and distribution. As shipping volumes grow, more distribution centers are choosing to upgrade their traditional laser-based scanners to image-based barcode readers, which will cost-effectively increase package sorter efficiency and throughput by improving readrates. Cognex has introduced image-based barcode readers in order to penetrate the ID logistics market and grow our ID Products business beyondthe traditional manufacturing sector that we currently serve. Our growth plan is dependent upon successfully penetrating the ID logistics market andwe are making significant investments in this area. Therefore, our failure to generate revenue in this new market in the amounts or within the timeperiods anticipated may have a material adverse impact on our revenue growth and operating results.Economic, political, and other risks associated with international sales and operations could adversely affect our business and operatingresults.In 2015, approximately 73% of our revenue was derived from customers located outside of the United States. We anticipate that international saleswill continue to account for a significant portion of our revenue. In addition, certain of our products are assembled by third-party contractmanufacturers, primarily located in Indonesia. We intend to continue to expand our sales and operations outside of the United States and expandour presence in international emerging markets, such as our expansion into China, India, Brazil, and Eastern Europe. In 2010, we established aWholly Foreign Owned Enterprise (WFOE) in Shanghai, China and we began to sell to our Chinese customers through this new entity in 2011. Thisnew entity has required and will continue to require significant management attention and financial resources. As a result, our business is subject tothe risks inherent in international sales and operations, including, among other things:
• various regulatory and statutory requirements,• difficulties in injecting and repatriating cash,• export and import restrictions,• transportation delays,• employment regulations and local labor conditions,• difficulties in staffing and managing foreign sales operations,
7
Table of Contents
• instability in economic or political conditions,• difficulties protecting intellectual property,• business systems connectivity issues, and• potentially adverse tax consequences.
Any of these factors could have a material adverse effect on our operating results.Fluctuations in foreign currency exchange rates and the use of derivative instruments to hedge these exposures could adversely affectour reported results, liquidity, and competitive position.We face exposure to foreign currency exchange rate fluctuations, as a significant portion of our revenues, expenses, assets, and liabilities aredenominated in currencies other than the functional currencies of our subsidiaries or the reporting currency of our company, which is the U.S. Dollar.In certain instances, we utilize forward contracts to hedge against foreign currency fluctuations. These contracts are used to minimize foreigncurrency gains or losses, as the gains or losses on the derivative are intended to offset the losses or gains on the underlying exposure. We do notengage in foreign currency speculation. If the counterparty to any of our hedging arrangements experiences financial difficulties, or is otherwiseunable to honor the terms of the contract, we may experience material losses.In 2013, we expanded our foreign currency hedging program to include foreign currency cash flow hedges that protect our budgeted revenues andexpenses against foreign currency exchange rate changes compared to our budgeted rates. These derivatives are designated for hedge accounting,and therefore, the effective portion of the forward contract's gain or loss is reported in shareholders' equity as other comprehensive income (loss)and is reclassified into current operations as the hedged transaction impacts current operations. Should these hedges fail to qualify for hedgeaccounting or be ineffective, the gain or loss on the forward contract would be reported in current operations immediately as opposed to when thehedged transaction impacts current operations. This may result in material foreign currency gains or losses.The success of our foreign currency risk management program depends upon forecasts of transaction activity denominated in various currencies.To the extent that these forecasts are overstated or understated during periods of currency volatility, we could experience unanticipated foreigncurrency gains or losses that could have a material impact on our results of operations. Furthermore, our failure to identify new exposures andhedge them in an effective manner may result in material foreign currency gains or losses.A significant portion of our revenues and expenses are denominated in the Euro, the Japanese Yen, and the Chinese Yuan, also known asRenminbi. Our predominant currency of sale is the U.S. Dollar in the Americas, the Euro and U.S. Dollar in Europe, the Yuan in Mainland China, theYen in Japan, and the U.S. Dollar in other regions. We estimate that approximately 40% of our sales in 2015 were invoiced in currencies other thanthe U.S. Dollar, and we expect sales denominated in foreign currencies to continue to represent a significant portion of our total revenue. While wealso have expenses denominated in these same foreign currencies, the impact on revenues has historically been, and is expected to continue to be,greater than the offsetting impact on expenses. Therefore, in times when the U.S. Dollar strengthens in relation to these foreign currencies, wewould expect to report a net decrease in operating income. Conversely, in times when the U.S. Dollar weakens in relation to these foreigncurrencies, we would expect to report a net increase in operating income. Thus, changes in the relative strength of the U.S. Dollar may have amaterial impact on our operating results.Information security breaches or business system disruptions may adversely affect our business.We rely on our information technology infrastructure and management information systems to effectively run our business. We may be subject toinformation security breaches caused by hacking, malicious software, or acts of vandalism or terrorism. Our security measures or those of our third-party service providers may not detect or prevent such breaches. Any such compromise to our information security could result in a misappropriationof our cash or other assets, an interruption in our operations, the unauthorized publication of our confidential business or proprietary information, theunauthorized release of customer, vendor, or employee data, the violation of privacy or other laws, and the exposure to litigation, any of which couldharm our business and operating results. Any disruption occurring with our management information systems may cause significant businessdisruption, including our ability to provide quotes, process orders, ship products, invoice customers, process payments, and otherwise run ourbusiness. Any disruption occurring with these systems may have a material adverse effect on our operating results.
8

Table of Contents
Our business could suffer if we lose the services of, or fail to attract, key personnel.We are highly dependent upon the management and leadership of Robert J. Shillman, our Chairman of the Board of Directors and Chief CultureOfficer, and Robert J. Willett, our President and Chief Executive Officer, as well as other members of our senior management team. Although wehave many experienced and qualified senior managers, the loss of key personnel could have a material adverse effect on our company. Ourcontinued growth and success also depends upon our ability to attract and retain skilled employees and on the ability of our officers and keyemployees to effectively manage the growth of our business through the implementation of appropriate management information systems andinternal controls.We have historically used stock options as a key component of our employee compensation program in order to align employee interests with theinterests of our shareholders, provide competitive compensation and benefits packages, and encourage employee retention. We are limited as tothe number of options that we may grant under our stock option plans. Accordingly, we may find it difficult to attract, retain, and motivate employees,and any such difficulties could materially adversely affect our business.The failure of a key supplier to deliver quality product in a timely manner or our inability to obtain components for our products couldadversely affect our operating results.A significant portion of our product is manufactured by a third-party contractor located in Indonesia. This contractor has agreed to provide Cognexwith termination notification periods and last-time-buy rights, if and when that may be applicable. We rely upon this contractor to provide qualityproduct and meet delivery schedules. We engage in extensive product quality programs and processes, including actively monitoring theperformance of our third-party manufacturers; however, we may not detect all product quality issues through these programs and processes.Certain components are presently sourced from a single vendor that is selected based on price and performance considerations. In the event of asupply disruption from a single-source vendor, these components may be purchased from an alternative vendor, which may result in manufacturingdelays based on the lead time of the new vendor. Certain key electronic and mechanical components that are purchased from strategic suppliers,such as processors or imagers, are fundamental to the design of Cognex products. A disruption in the supply of these key components, such as alast-time-buy announcement, natural disaster, financial bankruptcy, or other event, may require us to purchase a significant amount of inventory atunfavorable prices resulting in lower gross margins and higher risk of carrying excess inventory.We are subject to the requirements of the Dodd-Frank Wall Street Reform and Consumer Protection Act that obligates companies to inquire into theorigin of conflict minerals in their supply chains. We are working with our supply chain partners to take reasonable steps to assure conflict mineralsare not sourced by Cognex or our supply chain partners. These steps may include purchasing supply from alternative vendors. If we are unable tosecure adequate supply from alternative vendors, we may have to redesign our products, which may lead to a delay in manufacturing and a possibleloss of sales. Although we are taking certain actions to mitigate supply risk, an interruption in, termination of, or material change in the purchaseterms of any key components could have a material adverse effect on our operating results.Our failure to effectively manage product transitions or accurately forecast customer demand could result in excess or obsoleteinventory and resulting charges.Because the market for our products is characterized by rapid technological advances, we frequently introduce new products with improved ease-of-use, improved hardware performance, additional software features and functionality, or lower cost that may replace existing products. Among therisks associated with the introduction of new products are difficulty predicting customer demand and effectively managing inventory levels to ensureadequate supply of the new product and avoid excess supply of the legacy product.We may strategically enter into non-cancelable commitments with vendors to purchase materials for our products in advance of demand to takeadvantage of favorable pricing or address concerns about the availability of future supplies or long lead times. This practice may expose us to anincreased risk of excess or obsolete inventory and resulting charges if actual demand is lower than anticipated. Our failure to effectively manageproduct transitions or accurately forecast customer demand, in terms of both volume and configuration, has led to, and may again in the future leadto, an increased risk of excess or obsolete inventory and resulting charges.
9

Table of Contents
Our products may contain design or manufacturing defects, which could result in reduced demand, significant delays, or substantialcosts.If flaws in either the design or manufacture of our products were to occur, we could experience a rate of failure in our products that could result insignificant delays in shipment and material repair or replacement costs. Our release-to-market process may not be robust enough to detectsignificant design flaws or software bugs. While we engage in extensive product quality programs and processes, including actively monitoring andevaluating the quality of our component suppliers and contract manufacturers, these actions may not be sufficient to avoid a product failure rate thatresults in:
• substantial delays in shipment,• significant repair or replacement costs,• product liability claims or lawsuits, or• potential damage to our reputation.
Any of these results could have a material adverse effect on our operating results.Our failure to introduce new products in a successful and timely manner could result in the loss of our market share and a decrease inour revenues and profits.The market for our products is characterized by rapidly changing technology. Accordingly, we believe that our future success will depend upon ourability to accelerate time-to-market for new products with improved functionality, ease-of-use, performance, or price. There can be no assurance thatwe will be able to introduce new products in accordance with scheduled release dates or that new products will achieve market acceptance. Ourability to keep pace with the rapid rate of technological change in the high-technology marketplace could have a material adverse effect on ouroperating results.Product development is often a complex, time-consuming, and costly process involving significant investment in research and development with noassurance of return on investment. Our strong balance sheet allows us to continue to make significant investments in research, development, andmarketing for new products and technologies. Research is by its nature speculative and the ultimate commercial success of a product depends uponvarious factors, many of which are not under our control. We may not achieve significant revenue from new product investments for a number ofyears, if at all. Moreover, new products may not generate the operating margins that we have experienced historically.Our failure to properly manage the distribution of our products and services could result in the loss of revenues and profits.We utilize a direct sales force, as well as a network of integration and distribution partners, to sell our products and services. Successfully managingthe interaction of our direct and indirect sales channels to reach various potential customers for our products and services is a complex process. Inaddition, our reliance upon indirect selling methods may reduce visibility to demand and pricing issues. Each sales channel has distinct risks andcosts, and therefore, our failure to implement the most advantageous balance in the sales model for our products and services could adverselyaffect our revenue and profitability.If we fail to successfully protect our intellectual property, our competitive position and operating results could suffer.We rely on our proprietary software technology and hardware designs, as well as the technical expertise, creativity, and knowledge of our personnelto maintain our position as a leading provider of machine vision products. Software piracy and reverse engineering, specifically from companies inRussia and Asia, may result in counterfeit products that are misrepresented in the market as Cognex products. Although we use a variety ofmethods to protect our intellectual property, we rely most heavily on patent, trademark, copyright, and trade secret protection, as well as non-disclosure agreements with customers, suppliers, employees, and consultants. We also attempt to protect our intellectual property by restrictingaccess to our proprietary information by a combination of technical and internal security measures. These measures, however, may not be adequateto:
• protect our proprietary technology,• protect our patents from challenge, invalidation, or circumvention, or• ensure that our intellectual property will provide us with competitive advantages.
Any of these adverse circumstances could have a material adverse effect on our operating results.
10
Table of Contents
Our Company may be subject to time-consuming and costly litigation.From time to time, we may be subject to various claims and lawsuits by competitors, customers, or other parties arising in the ordinary course ofbusiness, including lawsuits charging patent infringement, or claims and lawsuits instituted by us to protect our intellectual property or for otherreasons. We may be a party to actions that are described in the section captioned “Legal Proceedings,” appearing in Part I - Item 3 of this AnnualReport on Form 10-K. These matters can be time-consuming, divert management’s attention and resources, and cause us to incur significantexpenses. Furthermore, the results of any of these actions may have a material adverse effect on our operating results.Increased competition may result in decreased demand or prices for our products and services.The machine vision market is fragmented and Cognex’s competitors are typically other vendors of machine vision systems, controllers, andcomponents; manufacturers of image processing systems, sensors, and components; and system integrators. Any of these competitors may havegreater financial and other resources than we do. Ease-of-use and product price are significant competitive factors in the factory automationmarketplace. We may not be able to compete successfully in the future and our investments in research and development, sales and marketing, andsupport activities may be insufficient to enable us to maintain our competitive advantage. In addition, competitive pressures could lead to priceerosion that could have a material adverse effect on our gross margins and operating results. We refer you to the section captioned “Competition,”appearing in Part I - Item 1 of this Annual Report on Form 10-K for further information regarding the competition that we face.Implementation of our acquisition strategy may not be successful, which could affect our ability to increase our revenue or profitabilityand result in the impairment of acquired intangible assets.We have in the past acquired, and will in the future consider the acquisition of, businesses and technologies in the machine vision industry. Ourbusiness may be negatively impacted by risks related to those acquisitions. These risks include, among others:
• the inability to find or close attractive acquisition opportunities,• the diversion of management’s attention from other operational matters,• the inability to realize expected synergies resulting from the acquisition,• the failure to retain key customers or employees, and• the impairment of acquired intangible assets resulting from lower-than-expected cash flows from the acquired assets.
Acquisitions are inherently risky and the inability to effectively manage these risks could have a material adverse effect on our operating results.We are at risk for impairment charges with respect to our investments or for acquired intangible assets or goodwill, which could have amaterial adverse effect on our results of operations.As of December 31, 2015, we had $570 million of investments, of which $569 million consisted of debt securities. These debt securities are reportedat fair value, with unrealized gains and losses, net of tax, recorded in shareholders’ equity as other comprehensive income (loss) since thesesecurities are designated as available-for-sale securities. As of December 31, 2015, our portfolio of debt securities had a net unrealized loss of$1,659,000. Included in this net loss, were gross unrealized losses totaling $1,818,000, of which $1,615,000 were in a loss position for less thantwelve months and $203,000 were in a loss position for greater than twelve months. As of December 31, 2015, these unrealized losses weredetermined to be temporary. However, if conditions change and future unrealized losses were determined to be other-than-temporary, we would berequired to record an impairment charge.Management monitors the carrying value of its investments in debt securities compared to their fair value to determine whether an other-than-temporary impairment has occurred. In considering whether a decline in fair value is other-than-temporary, we consider many factors, bothqualitative and quantitative. Management considers the type of security, the credit rating of the security, the length of time the security has been in aloss position, the size of the loss position, our ability and intent to hold the security to expected recovery of value, and other meaningful information.If a decline in fair value is determined to be other-than-temporary, an impairment charge would be recorded in current operations to reduce thecarrying value of the investment to its fair value. Should the fair value of investments decline in future periods below their carrying value,management will need to determine whether this decline is other-than-temporary and future impairment charges may be required.As of December 31, 2015, we had $81 million in acquired goodwill. The fair value of goodwill is susceptible to changes in the fair value of thereporting segment in which the goodwill resides, and therefore, a decline in our market capitalization or cash flows relative to our net book valuemay result in future impairment charges.
11

Table of Contents
As of December 31, 2015, we had $6 million in acquired intangible assets, consisting primarily of acquired distribution networks and completedtechnologies. These assets are susceptible to changes in fair value due to a decrease in the historical or projected cash flows from the use of theasset, which may be negatively impacted by economic trends. A decline in the cash flows generated by these assets, such as the revenue we areable to generate through our distribution network, may result in future impairment charges.If we determine that any of these investments, acquired intangible assets, or goodwill is impaired, we would be required to take a related charge toearnings that could have a material adverse effect on our results of operations.We may have additional tax liabilities, which could adversely affect our operating results and financial condition.We are subject to income taxes in the United States, as well as numerous foreign jurisdictions. Significant judgment is required in determining ourworldwide provision for income taxes. In the ordinary course of business, there are many transactions and calculations where the ultimate taxdetermination is uncertain. We are regularly under audit by tax authorities. Although we believe our tax positions are reasonable, the finaldetermination of tax audits and any related litigation could be materially different than that which is reflected in our financial statements and couldhave a material adverse effect on our income tax provision, net income, or cash flows in the period in which the determination is made.
ITEM 1B: UNRESOLVED STAFF COMMENTSNone
ITEM 2: PROPERTIESIn 1994, Cognex purchased and renovated a 100,000 square-foot building located in Natick, Massachusetts that serves as our corporateheadquarters and is occupied by employees primarily in research, development and engineering, manufacturing and quality assurance, andinformation technology, finance and administration functions. In 1997, Cognex completed construction of a 50,000 square-foot addition to thisbuilding.In 1995, Cognex purchased an 83,000 square-foot office building adjacent to our corporate headquarters that is partially occupied by employeesprimarily in sales, marketing, and service functions. The remainder of this building is occupied by tenants who have lease agreements that expire atvarious dates through 2021.In 1997, Cognex purchased a three and one-half acre parcel of land adjacent to our corporate headquarters. This land is being held for futureexpansion.In 2007, Cognex purchased a 19,000 square-foot building adjacent to our corporate headquarters. A portion of this facility serves as the distributioncenter for customers in the Americas. The remainder of this building is occupied by a tenant who has a lease agreement that expires in 2017.In 2014, Cognex purchased the 50,000 square foot building in Cork, Ireland where we had previously leased space for several years. This facilityserves as the distribution center for customers outside of the Americas.Cognex conducts certain of its operations in leased facilities. These lease agreements expire at various dates through 2023. Certain of these leasescontain renewal options, retirement obligations, escalation clauses, rent holidays, and leasehold improvement incentives.
ITEM 3: LEGAL PROCEEDINGSIn March 2013, the Company filed a lawsuit against Microscan Systems, Inc. (“Microscan”) and Code Corporation ("Code") in the United StatesDistrict Court for the Southern District of New York alleging that Microscan’s Mobile Hawk handheld imager infringes U.S. Patent 7,874,487 ownedby the Company (the "'487 patent”). The lawsuit sought to prohibit Code from manufacturing the product, and Microscan from selling and distributingthe product.
In August 2014, Microscan filed a lawsuit against the Company in the United States District Court for the Southern District of New York alleging thatthe Company’s DataMan ® 8500 handheld imager infringes U.S. Patent 6,352,204 owned by Microscan (the “'204 patent”). The lawsuit sought toprohibit the Company from manufacturing, selling, and distributing the DataMan ® 7500, 8500, 8600, and 9500 products.
In June 2015, the Company executed a settlement agreement with Microscan requiring a payment by the Company of $3,500,000 which settles alloutstanding litigation between the parties. The settlement included a patent license agreement valued at $1,667,000 that allows the Company tocontinue producing current models of its handheld barcode readers, which was recorded as an asset and is being amortized to cost of revenue overthe five year life of the patent. The remaining $1,833,000 of the settlement was recorded as expense. All cases were dismissed by the end of July2015. In July 2015, the Company also executed an immaterial settlement agreement with Code. This matter is now closed.
12
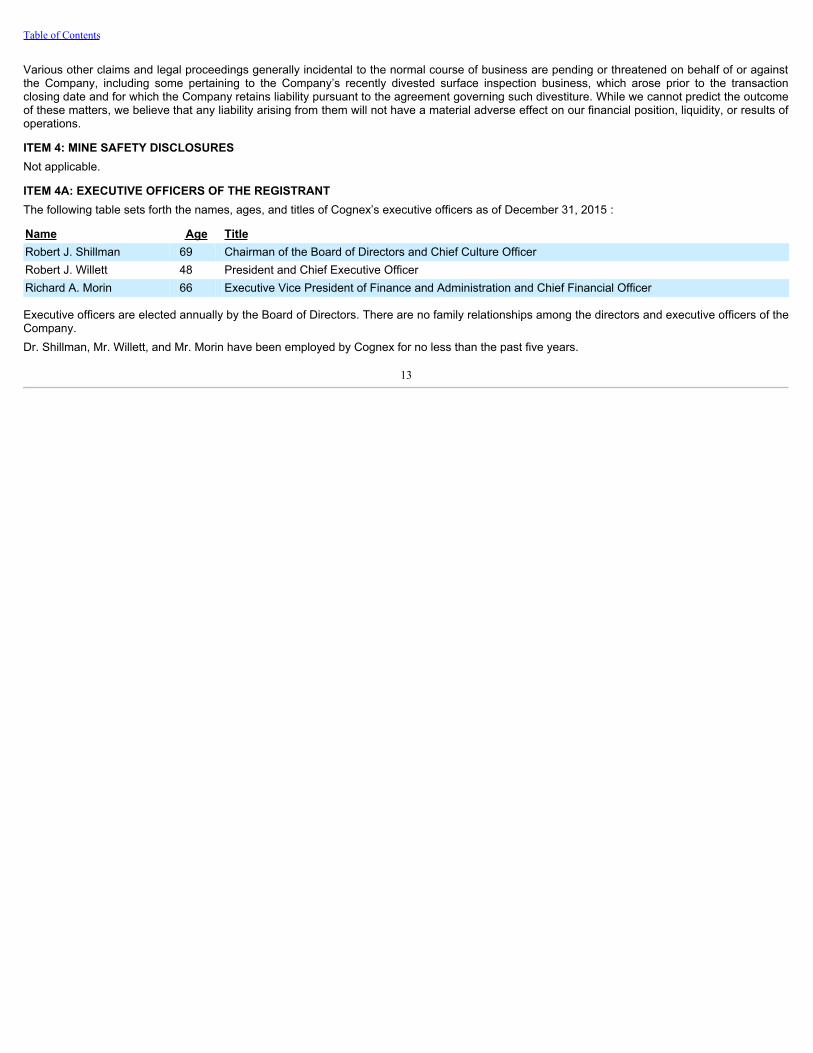
Table of Contents
Various other claims and legal proceedings generally incidental to the normal course of business are pending or threatened on behalf of or againstthe Company, including some pertaining to the Company’s recently divested surface inspection business, which arose prior to the transactionclosing date and for which the Company retains liability pursuant to the agreement governing such divestiture. While we cannot predict the outcomeof these matters, we believe that any liability arising from them will not have a material adverse effect on our financial position, liquidity, or results ofoperations.
ITEM 4: MINE SAFETY DISCLOSURESNot applicable.
ITEM 4A: EXECUTIVE OFFICERS OF THE REGISTRANTThe following table sets forth the names, ages, and titles of Cognex’s executive officers as of December 31, 2015 :
Name Age TitleRobert J. Shillman 69 Chairman of the Board of Directors and Chief Culture OfficerRobert J. Willett 48 President and Chief Executive OfficerRichard A. Morin 66 Executive Vice President of Finance and Administration and Chief Financial Officer
Executive officers are elected annually by the Board of Directors. There are no family relationships among the directors and executive officers of theCompany.Dr. Shillman, Mr. Willett, and Mr. Morin have been employed by Cognex for no less than the past five years.
13

Table of Contents
PART II
ITEM 5: MARKET FOR REGISTRANT’S COMMON EQUITY, RELATED STOCKHOLDER MATTERS, AND ISSUER PURCHASES OF EQUITYSECURITIESThe Company’s common stock is traded on The NASDAQ Stock Market LLC, under the symbol CGNX. As of January 31, 2016 , there wereapproximately 735 shareholders of record of the Company’s common stock. The Company believes the number of beneficial owners of theCompany’s common stock on that date was substantially greater.The high and low sales prices of the Company’s common stock as reported by the NASDAQ Stock Market for each quarter in 2015 and 2014 wereas follows:
First Second Third Fourth2015
High $ 50.57 $ 52.48 $ 48.56 $ 38.06Low 36.12 44.84 32.35 32.40
2014 High $ 40.14 $ 39.67 $ 45.80 $ 42.49Low 32.83 30.66 37.43 35.16
The Company’s Board of Directors declared and paid cash dividends of $0.07 per share in the second, third, and fourth quarters of 2015. The cashdividend in the second quarter of 2015 was the first dividend declared and paid since the fourth quarter of 2012 when the Company’s Board ofDirectors accelerated dividends in advance of an increase in the federal tax on dividends paid after December 31, 2012. Due to these acceleratedpayments, no cash dividends were declared or paid in 2014 or the first quarter of 2015. Future dividends will be declared at the discretion of theCompany's Board of Directors and will depend upon such factors as the Board deems relevant, including, among other things, the Company's abilityto generate positive cash flow from operations.In August 2015, the Company’s Board of Directors authorized the repurchase of $100,000,000 of the Company’s common stock. During the thirdquarter of 2015, the Company repurchased 2,311,000 shares at a cost of $83,936,000 under this program. No shares were repurchased under thisprogram during the fourth quarter of 2015. In November 2015, the Company’s Board of Directors authorized the repurchase of an additional$100,000,000 of the Company’s common stock. Purchases under this November 2015 program will commence upon completion of the August 2015program. The Company may repurchase shares under these programs in future periods depending on a variety of factors, including, among otherthings, the impact of dilution from employee stock options, stock price, share availability, and cash requirements.The following table sets forth information with respect to purchases by the Company of shares of its common stock during the fourth quarter of 2015:
Total Number of
Shares Purchased
AveragePrice Paidper Share
Total Number ofShares Purchased as
Part of PubliclyAnnounced Plans or
Programs
Approximate DollarValue of Shares that
May Yet BePurchased Under the
Plans or ProgramsOctober 5 - November 1, 2015 — — — $ 116,064,000November 2 - November 29, 2015 — — — 116,064,000November 30 - December 31, 2015 — — — 116,064,000Total — — — $ 116,064,000
14

Table of Contents
Set forth below is a line graph comparing the annual percentage change in the cumulative total shareholder return on the Company’s commonstock, based upon the market price of the Company’s common stock, with the total return on companies within the Nasdaq Composite Index and theResearch Data Group, Inc. Nasdaq Lab Apparatus & Analytical, Optical, Measuring & Controlling Instrument (SIC 3820-3829 US Companies) Index(the “Nasdaq Lab Apparatus Index”). The performance graph assumes an investment of $100 in each of the Company and the two indices, and thereinvestment of any dividends. The historical information set forth below is not necessarily indicative of future performance. Data for the NasdaqComposite Index and the Nasdaq Lab Apparatus Index was provided to the Company by Research Data Group, Inc.
*$100 invested on 12/31/2010 in stock or index, including reinvestment of dividends. Fiscal year ending December 31. 12/10 12/11 12/12 12/13 12/14 12/15
Cognex Corporation 100.00 123.02 131.80 273.56 296.13 243.26NASDAQ Composite 100.00 100.53 116.92 166.19 188.78 199.95NASDAQ Stocks 100.00 91.02 110.50 154.96 184.23 179.56(SIC 3820-3829 U.S. Companies) Lab Apparatus & Analyt,Opt, Measuring, and Controlling Instr
15

Table of Contents
ITEM 6: SELECTED FINANCIAL DATA
Year Ended December 31,
2015 2014 2013 2012 2011 (In thousands, except per share amounts)Statement of Operations Data:
Revenue $ 450,557 $ 426,449 $ 307,651 $ 273,696 $ 273,673Cost of revenue (1) 102,571 94,067 62,889 56,161 54,382Gross margin 347,986 332,382 244,762 217,535 219,291Research, development, and engineering expenses (1) 69,791 55,831 44,315 37,975 37,614Selling, general, and administrative expenses (1) 156,674 148,699 123,509 108,670 105,982Operating income 121,521 127,852 76,938 70,890 75,695Non-operating income 5,441 3,904 1,518 3,223 1,762Income from continuing operations before income taxexpense 126,962 131,756 78,456 74,113 77,457Income tax expense on continuing operations 19,298 20,915 11,273 14,386 14,002Net income from continuing operations 107,664 110,841 67,183 59,727 63,455Net income from discontinued operations (1) 79,410 10,644 6,390 8,371 6,414Net income $ 187,074 $ 121,485 $ 73,573 $ 68,098 $ 69,869
Basic earnings per weighted-average common and common-equivalent share (2):
Net income from continuing operations $ 1.25 $ 1.28 $ 0.77 $ 0.70 $ 0.76Net income from discontinued operations $ 0.92 $ 0.12 $ 0.08 $ 0.09 $ 0.07Net income $ 2.17 $ 1.40 $ 0.85 $ 0.79 $ 0.83
Diluted earnings per weighted-average common andcommon-equivalent share (2):
Net income from continuing operations $ 1.22 $ 1.24 $ 0.76 $ 0.68 $ 0.74Net income from discontinued operations $ 0.91 $ 0.12 $ 0.07 $ 0.10 $ 0.08Net income $ 2.13 $ 1.36 $ 0.83 $ 0.78 $ 0.82
Weighted-average common and common-equivalent sharesoutstanding (2):
Basic 86,296 86,858 86,946 85,666 83,718Diluted 87,991 89,071 88,901 87,280 85,524
Cash dividends per common share (2) $ 0.21 $ — $ — $ 0.77 $ 0.18 (1) Amounts include stock-based compensation expense, asfollows:
Cost of revenue $ 1,515 $ 1,116 $ 820 $ 637 $ 503Research, development, and engineering 5,194 3,709 2,502 2,107 2,202Selling, general, and administrative 13,032 9,234 6,461 5,216 4,722Discontinued operations 1,533 1,099 837 560 641Total stock-based compensation expense $ 21,274 $ 15,158 $ 10,620 $ 8,520 $ 8,068
(2) Prior period results have been adjusted to reflect the two-for-one stock split effected in the form of a stock dividend which occurred in 2013. December 31,
2015 2014 2013 2012 2011 (In thousands)Balance Sheet Data:
Working capital $ 397,591 $ 191,237 $ 278,160 $ 197,130 $ 238,061Total assets 887,756 821,734 709,699 627,605 611,881Shareholders’ equity 825,667 736,437 643,912 572,285 552,980
16
Table of Contents
ITEM 7: MANAGEMENT’S DISCUSSION AND ANALYSIS OF FINANCIAL CONDITION AND RESULTS OF OPERATIONSFORWARD-LOOKING STATEMENTSCertain statements made in this report, as well as oral statements made by the Company from time to time, constitute forward-looking statementswithin the meaning of Section 27A of the Securities Act of 1933, as amended, and Section 21E of the Securities Exchange Act of 1934, asamended. Readers can identify these forward-looking statements by our use of the words “expects,” “anticipates,” “estimates,” “believes,” “projects,”“intends,” “plans,” “will,” “may,” “shall,” “could,” “should,” and similar words and other statements of a similar sense. These statements are basedupon our current estimates and expectations as to prospective events and circumstances, which may or may not be in our control and as to whichthere can be no firm assurances given. These forward-looking statements, which include statements regarding business and market trends, futurefinancial performance, customer order rates, expected areas of growth, emerging markets, future product mix, research and development activities,investments, and strategic plans, involve known and unknown risks and uncertainties that could cause actual results to differ materially from thoseprojected. Such risks and uncertainties include: (1) the loss of a large customer; (2) current and future conditions in the global economy; (3) thereliance on revenue from the consumer electronics or automotive industries; (4) the inability to penetrate new markets; (5) the inability to achievesignificant international revenue; (6) fluctuations in foreign currency exchange rates and the use of derivative instruments; (7) information securitybreaches or business system disruptions; (8) the inability to attract and retain skilled employees; (9) the reliance upon key suppliers to manufactureand deliver critical components for our products; (10) the failure to effectively manage product transitions or accurately forecast customer demand;(11) the inability to design and manufacture high-quality products; (12) the technological obsolescence of current products and the inability todevelop new products; (13) the failure to properly manage the distribution of products and services; (14) the inability to protect our proprietarytechnology and intellectual property; (15) our involvement in time-consuming and costly litigation; (16) the impact of competitive pressures; (17) thechallenges in integrating and achieving expected results from acquired businesses; (18) potential impairment charges with respect to ourinvestments or for acquired intangible assets or goodwill; and (19) exposure to additional tax liabilities. The foregoing list should not be construed asexhaustive and we encourage readers to refer to the detailed discussion of risk factors included in Part I - Item 1A of this Annual Report on Form 10-K. The Company cautions readers not to place undue reliance upon any such forward-looking statements, which speak only as of the date made.The Company disclaims any obligation to subsequently revise forward-looking statements to reflect the occurrence of anticipated or unanticipatedevents or circumstances after the date such statements are made.EXECUTIVE OVERVIEWCognex Corporation is a leading worldwide provider of machine vision products that capture and analyze visual information in order to automatetasks, primarily in manufacturing processes, where vision is required. On July 6, 2015, the Company completed the sale of its Surface InspectionSystems Division (SISD) that specializes in machine vision products that inspect the surfaces of materials processed in a continuous fashion. Thefinancial results of SISD are reported as a discontinued operation for all periods presented.In addition to product revenue derived from the sale of machine vision products, the Company also generates revenue by providing maintenanceand support, consulting, and training services to its customers; however, service revenue accounted for less than 10% of total revenue for allperiods presented.The Company’s customers are predominantly in the factory automation market. Factory automation customers purchase Cognex products andincorporate them into their manufacturing processes. Virtually every manufacturer can achieve better quality and manufacturing efficiency by usingmachine vision, and therefore, this market includes a broad base of customers across a variety of industries, including consumer electronics,automotive, consumer products, food and beverage, medical devices, and pharmaceuticals. Factory automation customers also purchase Cognexproducts for use outside of the manufacturing process, such as using ID products in logistics automation for package sorting and distribution. Salesto factory automation customers represented 95% of total revenue in 2015 compared to 94% of total revenue in 2014.A small percentage of the Company’s customers are in the semiconductor and electronics capital equipment market. These customers purchaseCognex products and integrate them into the automation equipment that they manufacture and then sell to their customers to either makesemiconductor chips or assemble printed circuit boards. Demand from these customers has been relatively flat on an annual basis for the pastseveral years. Sales to semiconductor and electronics capital equipment manufacturers represented only 5% of total revenue in 2015 compared to6% of total revenue in 2014.
17

Table of Contents
Revenue for the year ended December 31, 2015 totaled $450,557,000, representing an increase of $24,108,000, or 6%, over the prior year.Changes in foreign currency exchange rates, primarily the Euro and Japanese Yen, had an unfavorable impact on revenue, as amountsdenominated in foreign currencies were translated into U.S. Dollars at a lower rate. On a constant-currency basis, revenue increased approximately11% from 2014. Gross margin was 77% of revenue in 2015 compared to 78% of revenue in 2014. This decline was largely due to the unfavorableimpact of foreign currency exchange rate changes, as the gross margin percentage on a constant-currency basis was relatively flat with 2014.Operating expenses increased by $21,935,000, or 11% , from the prior year due primarily to higher personnel-related costs, stock-basedcompensation expense, and outsourced engineering costs, partially offset by lower expenses related to incentive compensation plans and thefavorable impact of foreign currency exchange rate changes on expenses. The majority of these expense increases were RD&E investments thatare anticipated to generate future revenue. These investments outpaced revenue growth, and therefore, operating income decreased by$6,331,000, or 5%, from the prior year. Operating income was $121,521,000, or 27% of revenue, in 2015 compared to $127,852,000, or 30% ofrevenue, in 2014; net income from continuing operations was $107,664,000, or 24% of revenue, in 2015 compared to $110,841,000, or 26% ofrevenue, in 2014; and net income from continuing operations per diluted share was $1.22 in 2015 compared to $1.24 in 2014.The following table sets forth certain consolidated financial data for continuing operations as a percentage of revenue:
Year Ended December 31, 2015 2014 2013Revenue 100% 100% 100%Cost of revenue 23 22 20Gross margin 77 78 80Research, development, and engineering expenses 15 13 15Selling, general, and administrative expenses 35 35 40Operating income 27 30 25Non-operating income 1 1 1Income from continuing operations before income tax expense 28 31 26Income tax expense on continuing operations 4 5 4Net income from continuing operations 24% 26% 22%
RESULTS OF OPERATIONSAs foreign currency exchange rates are a factor in understanding period-to-period comparisons, we believe the presentation of results on aconstant-currency basis in addition to reported results helps improve investors’ ability to understand our operating results and evaluate ourperformance in comparison to prior periods. We also use results on a constant-currency basis as one measure to evaluate our performance. Constant-currency information compares results between periods as if exchange rates had remained constant period-over-period. We generallyrefer to such amounts calculated on a constant-currency basis as excluding the impact of foreign currency exchange rate changes. Results on aconstant-currency basis are not in accordance with accounting principles generally accepted in the United States of America (U.S. GAAP) andshould be considered in addition to, and not as a substitute for, results prepared in accordance with U.S. GAAP.
Year Ended December 31, 2015 Compared to Year Ended December 31, 2014RevenueRevenue for the year ended December 31, 2015 increased by $24,108,000, or 6%, from the prior year. Excluding the impact of foreign currencyexchange rate changes, revenue increased by $46,718,000, or 11%, as sales denominated in foreign currencies, primarily the Euro and JapaneseYen, were translated into U.S. Dollars at a lower rate. Revenue from factory automation customers increased by $48,682,000, or 12%, on aconstant-currency basis due primarily to a higher volume of machine vision products sold, with the highest growth coming from Greater China andEurope. Factory automation revenue in the Americas was relatively flat. Revenue from semiconductor and electronics capital equipmentmanufacturers decreased by $1,964,000, or 7%, on a constant-currency basis from the prior year, with the majority of the decline coming fromJapan.Gross MarginGross margin as a percentage of revenue was 77% in 2015 compared to 78% in 2014. Changes in foreign currency exchange rates had a negativeimpact on gross margin, as a significant amount of revenue is denominated in Euros
18

Table of Contents
while inventories are predominantly purchased in U.S. Dollars. A shift in revenue mix to relatively-lower margin products and services also had anegative impact on gross margin. These gross margin decreases were partially offset by lower inventory charges in 2015 as compared to 2014.Operating ExpensesResearch,Development,andEngineeringExpensesResearch, development, and engineering (RD&E) expenses in 2015 increased by $13,960,000, or 25%, from the prior year as detailed in the tablebelow (in thousands).
RD&E expenses in 2014 $ 55,831Outsourced engineering costs 6,952Personnel-related costs 6,559Stock-based compensation expense 1,579Foreign currency exchange rate changes (2,226)Other 1,096RD&E expenses in 2015 $ 69,791
RD&E expenses increased due to higher personnel-related costs resulting from headcount additions, such as salaries and fringe benefits, as well asmodest salary increases granted early in 2015. The Company also incurred higher spending on outsourced engineering costs, primarily related tothe development of engineering prototypes for anticipated customer orders. In addition, stock-based compensation expense increased due to ahigher valuation of stock options granted early in 2015. Offsetting these increases was the favorable impact on expenses of changes in foreigncurrency exchange rates, which resulted in lower U.S. Dollar expenses when expenses denominated in foreign currencies, primarily the Euro, weretranslated into U.S. Dollars.RD&E expenses as a percentage of revenue were 15% in 2015 compared to 13% in 2014. We believe that a continued commitment to RD&Eactivities is essential in order to maintain or achieve product leadership with our existing products and to provide innovative new product offerings,as well as to provide engineering support for large customers. In addition, we consider our ability to accelerate time to market for new products to becritical to our revenue growth. Therefore, we expect to continue to make significant RD&E investments in the future, and we target our RD&Espending to be between 10% and 15% of revenue. This percentage is impacted by revenue levels and investing cycles.Selling,General,andAdministrativeExpensesSelling, general, and administrative (SG&A) expenses in 2015 increased by $7,975,000, or 5%, from the prior year as detailed in the table below (inthousands).
SG&A expenses in 2014 $ 148,699Personnel-related costs 15,420Stock-based compensation expense 4,082Microscan settlement and legal fees 2,405Incentive compensation plans (6,226)Foreign currency exchange rate changes (7,896)Other 190SG&A expenses in 2015 $ 156,674
SG&A expenses increased due to higher personnel-related costs resulting from headcount additions, such as salaries, fringe benefits, salescommissions, and travel expenses, as well as modest salary increases granted early in 2015. In addition, stock-based compensation expenseincreased due to a higher valuation of stock options granted early in 2015. Offsetting these increases were lower expenses related to incentivecompensation plans, such as company bonuses and sales commissions, resulting from lower achievement levels on plans that were set at thebeginning of the year. In addition, changes in foreign currency exchange rates resulted in lower U.S. Dollar expenses when expenses denominatedin foreign currencies, primarily the Euro, were translated into U.S. Dollars.In the second quarter of 2015, the Company reached a settlement of outstanding patent litigation with Microscan Systems, Inc. for $3,500,000. Thesettlement included a patent license agreement valued at $1,667,000 that allows the Company to continue producing current models of its handheldbarcode readers, which was recorded as an asset and is being amortized to cost of revenue over the five year life of the patent starting in the thirdquarter of 2015. The
19

Table of Contents
remaining $1,833,000 of the settlement was recorded as SG&A expense in the second quarter of 2015. Legal fees related to this litigation were$572,000 higher in 2015 than the prior year.Non-operating Income (Expense)The Company recorded foreign currency gains of $1,122,000 in 2015 and $1,031,000 in 2014. The foreign currency gains and losses in each periodresulted primarily from the revaluation and settlement of accounts receivable, accounts payable, and intercompany balances that are reported in onecurrency and collected in another.Investment income increased by $518,000, or 16%, from the prior year due to increased funds available for investment.The Company recorded other income of $645,000 in 2015 compared to other expense of $283,000 in 2014. Other income in 2015 includes a$790,000 benefit resulting from a decrease in the fair value of the contingent consideration liability that arose from a business acquisition completedearlier in 2015 (refer to Note 20 to the Consolidated Financial Statements in Part II - Item 8 of this Annual Report on Form 10-K). Other income(expense) also includes rental income, net of associated expenses, from leasing space in buildings adjacent to the Company’s corporateheadquarters.Income Tax ExpenseThe Company’s effective tax rate was 15% of the Company’s pre-tax income in 2015 compared to 16% in 2014.The effective tax rate for 2015 included the impact of the following discrete tax events: (1) a decrease in tax expense of $1,105,000 from the finaltrue-up of the prior year’s tax accrual upon filing the actual tax returns, (2) a decrease in tax expense of $975,000 from the expiration of statutes oflimitations for certain reserves for income tax uncertainties, (3) a decrease in tax expense, net of reserves, of $910,000 from the retroactiveapplication of the 2015 research and development tax credit passed by Congress in December 2015 and applied retroactively to January 1, 2015,and (4) an increase in tax expense of $65,000 from the write down of a deferred tax asset.
The effective tax rate for 2014 included the impact of the following discrete tax events: (1) a decrease in tax expense of $652,000 from the final true-up on the prior year’s tax accrual upon filing the actual tax returns, (2) a decrease in tax expense, net of reserves, of $645,000 from the retroactiveapplication of the 2014 research and development tax credit passed by Congress in December 2014 and applied retroactively to January 1, 2014,(3) a decrease in tax expense of $418,000 from the closing of the Internal Revenue Service audit of the Company for tax years 2010 and 2011, and(4) a decrease in tax expense of $217,000 from the expiration of the statutes of limitations for certain reserves for income tax uncertainties.
Excluding the impact of these discrete tax events, the Company’s effective tax rate was relatively consistent for 2015 and 2014 at approximately17.5%.Discontinued OperationsOn July 6, 2015, the Company completed the sale of its Surface Inspection Systems Division (SISD) that specializes in machine vision products thatinspect the surfaces of materials processed in a continuous fashion. The financial results of SISD are reported as a discontinued operation for allperiods presented. Income from discontinued operations, net of tax, was $1,228,000 for the six-month period ended July 5, 2015 and was$10,644,000 for the year ended December 31, 2014. The gain on the sale of SISD, net of tax, recorded in 2015 was $78,182,000. Refer to Note 19to the Consolidated Financial Statements in Part I - Item 1 of this Quarterly Report on Form 10-Q for further information.Year Ended December 31, 2014 Compared to Year Ended December 31, 2013RevenueRevenue for the year ended December 31, 2014 increased by $118,798,000, or 39%, from the prior year. Sales to factory automation customersincreased by $115,519,000, or 41% and sales to semiconductor and electronics capital equipment customers increased by $3,279,000, or 14%.Sales to customers in the factory automation market represented 94% of total revenue in 2014 compared to 93% of total revenue in 2013. Sales tothese customers increased by $115,519,000, or 41%, from the prior year. Foreign currency exchange rate changes did not have a material impacton total factory automation revenue, as the impact of a stronger Euro in 2014 compared to the prior year was offset by the impact of a weakerJapanese Yen. Although the Euro was stronger, on average, for the full year 2014 compared to the full year 2013, the Euro weakened vs. the U.S.Dollar in the fourth quarter of 2014. A weaker Euro and Japanese Yen vs. the U.S. Dollar results in lower reported U.S. Dollar revenue when theCompany’s sales denominated in these currencies are translated into U.S. Dollars.The Company recorded factory automation revenue from a single customer, both direct and indirect, of approximately $70,000,000 in 2014compared to approximately $10,000,000 in 2013. Excluding revenue from this customer in both
20

Table of Contents
years, factory automation revenue increased by $55,519,000, or 20%, from the prior year. Geographically, this incremental revenue came primarilyfrom the Americas, Greater China, and Europe.Sales to customers who make automation equipment for the semiconductor and electronics industries represented 6% of total revenue in 2014compared to 7% of total revenue in 2013. Sales to these customers increased by $3,279,000, or 14%, from the prior year. Excluding the impact offoreign currency exchange rate changes, which primarily related to the Japanese Yen, sales to semiconductor and electronics capital equipmentcustomers increased by approximately $4,051,000, or 18%, from 2013.Gross MarginGross margin as a percentage of revenue was 78% in 2014 compared to 80% in 2013 due to lower product and service margins, as well as agreater percentage of revenue from the sale of services, which have lower margins than the sale of products. The lower product margin was due toa relatively lower product margin on the single-customer revenue arrangement noted in “Revenue,” as well as higher new product introduction costsand higher inventory charges recorded in 2014 than in the prior year. These product margin decreases were partially offset by the favorable impactof material cost reductions and volume purchasing, as well as manufacturing efficiencies achieved from higher revenue levels as fixedmanufacturing costs were spread over a larger revenue base. The lower service margin was due to the on-site support services provided as part ofthe single-customer revenue arrangement noted in “Revenue.” These services were provided at a relatively lower service margin than theCompany’s other service offerings.Operating ExpensesResearch,Development,andEngineeringExpensesResearch, development, and engineering (RD&E) expenses in 2014 increased by $11,516,000, or 26%, from the prior year as detailed in the tablebelow (in thousands).
RD&E expenses in 2013 $ 44,315Personnel-related costs (recurring nature) 3,256Recruiting and other non-recurring personnel-related costs 1,420Engineering prototypes 1,283Company bonus and other employee incentive programs 1,206Stock-based compensation expense 1,205Travel costs 716Outsourced engineering costs 443Other 1,987RD&E expenses in 2014 $ 55,831
The increase in RD&E expenses was due to higher personnel-related costs, such as salaries and fringe benefits, resulting from headcount additionsand modest salary increases granted early in 2014. Headcount was added to support the significantly higher level of business in 2014. Recruitingand other non-recurring personnel-related costs, as well as travel costs, also increased as a result of the additional headcount and higher businesslevel. Company bonus expense increased due to the additional headcount and the Company incurred higher expenses related to other employeeincentive programs, including a $1,000 bonus given to every full-time employee in celebration of the Company’s one-millionth shipment. In addition,the Company incurred higher spending on materials for engineering prototypes, as well as higher outsourced engineering costs in 2014. Stock-based compensation expense increased due to a higher valuation of stock options granted early in 2014.Selling,General,andAdministrativeExpensesSelling, general, and administrative (SG&A) expenses in 2014 increased by $25,190,000, or 20%, from the prior year as detailed in the table below(in thousands).
21
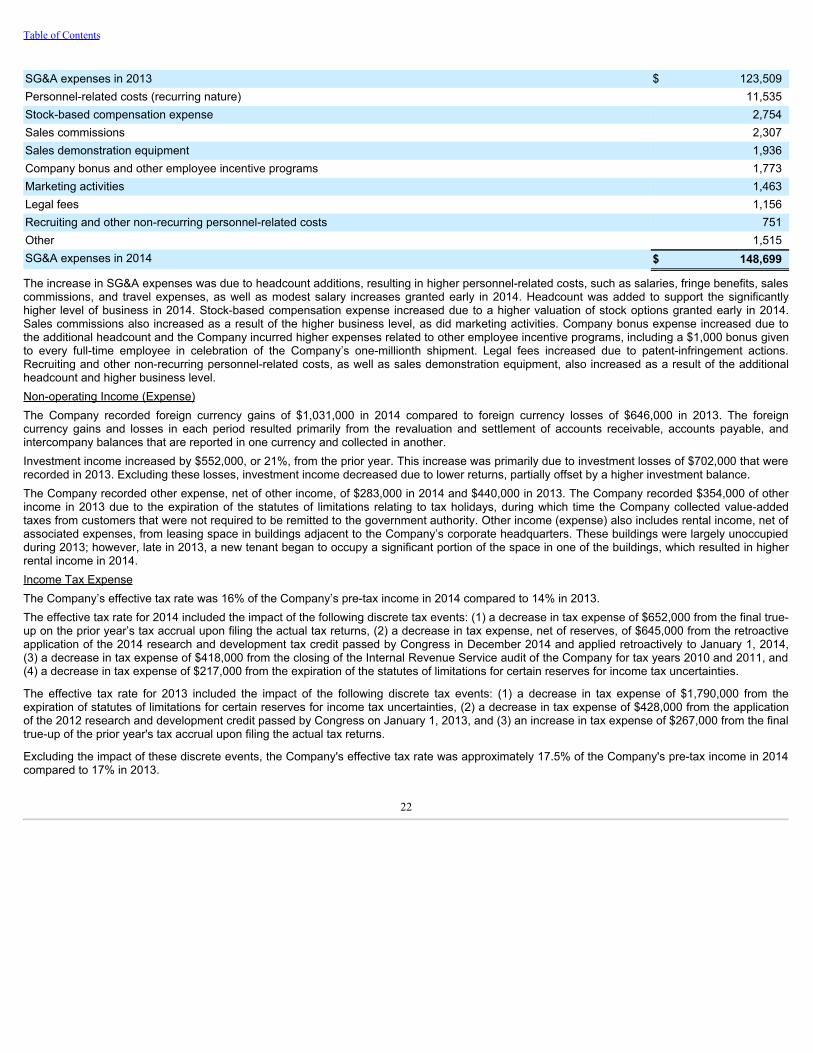
Table of Contents
SG&A expenses in 2013 $ 123,509Personnel-related costs (recurring nature) 11,535Stock-based compensation expense 2,754Sales commissions 2,307Sales demonstration equipment 1,936Company bonus and other employee incentive programs 1,773Marketing activities 1,463Legal fees 1,156Recruiting and other non-recurring personnel-related costs 751Other 1,515SG&A expenses in 2014 $ 148,699
The increase in SG&A expenses was due to headcount additions, resulting in higher personnel-related costs, such as salaries, fringe benefits, salescommissions, and travel expenses, as well as modest salary increases granted early in 2014. Headcount was added to support the significantlyhigher level of business in 2014. Stock-based compensation expense increased due to a higher valuation of stock options granted early in 2014.Sales commissions also increased as a result of the higher business level, as did marketing activities. Company bonus expense increased due tothe additional headcount and the Company incurred higher expenses related to other employee incentive programs, including a $1,000 bonus givento every full-time employee in celebration of the Company’s one-millionth shipment. Legal fees increased due to patent-infringement actions.Recruiting and other non-recurring personnel-related costs, as well as sales demonstration equipment, also increased as a result of the additionalheadcount and higher business level.Non-operating Income (Expense)The Company recorded foreign currency gains of $1,031,000 in 2014 compared to foreign currency losses of $646,000 in 2013. The foreigncurrency gains and losses in each period resulted primarily from the revaluation and settlement of accounts receivable, accounts payable, andintercompany balances that are reported in one currency and collected in another.Investment income increased by $552,000, or 21%, from the prior year. This increase was primarily due to investment losses of $702,000 that wererecorded in 2013. Excluding these losses, investment income decreased due to lower returns, partially offset by a higher investment balance.The Company recorded other expense, net of other income, of $283,000 in 2014 and $440,000 in 2013. The Company recorded $354,000 of otherincome in 2013 due to the expiration of the statutes of limitations relating to tax holidays, during which time the Company collected value-addedtaxes from customers that were not required to be remitted to the government authority. Other income (expense) also includes rental income, net ofassociated expenses, from leasing space in buildings adjacent to the Company’s corporate headquarters. These buildings were largely unoccupiedduring 2013; however, late in 2013, a new tenant began to occupy a significant portion of the space in one of the buildings, which resulted in higherrental income in 2014.Income Tax ExpenseThe Company’s effective tax rate was 16% of the Company’s pre-tax income in 2014 compared to 14% in 2013.The effective tax rate for 2014 included the impact of the following discrete tax events: (1) a decrease in tax expense of $652,000 from the final true-up on the prior year’s tax accrual upon filing the actual tax returns, (2) a decrease in tax expense, net of reserves, of $645,000 from the retroactiveapplication of the 2014 research and development tax credit passed by Congress in December 2014 and applied retroactively to January 1, 2014,(3) a decrease in tax expense of $418,000 from the closing of the Internal Revenue Service audit of the Company for tax years 2010 and 2011, and(4) a decrease in tax expense of $217,000 from the expiration of the statutes of limitations for certain reserves for income tax uncertainties.
The effective tax rate for 2013 included the impact of the following discrete tax events: (1) a decrease in tax expense of $1,790,000 from theexpiration of statutes of limitations for certain reserves for income tax uncertainties, (2) a decrease in tax expense of $428,000 from the applicationof the 2012 research and development credit passed by Congress on January 1, 2013, and (3) an increase in tax expense of $267,000 from the finaltrue-up of the prior year's tax accrual upon filing the actual tax returns.
Excluding the impact of these discrete events, the Company's effective tax rate was approximately 17.5% of the Company's pre-tax income in 2014compared to 17% in 2013.
22
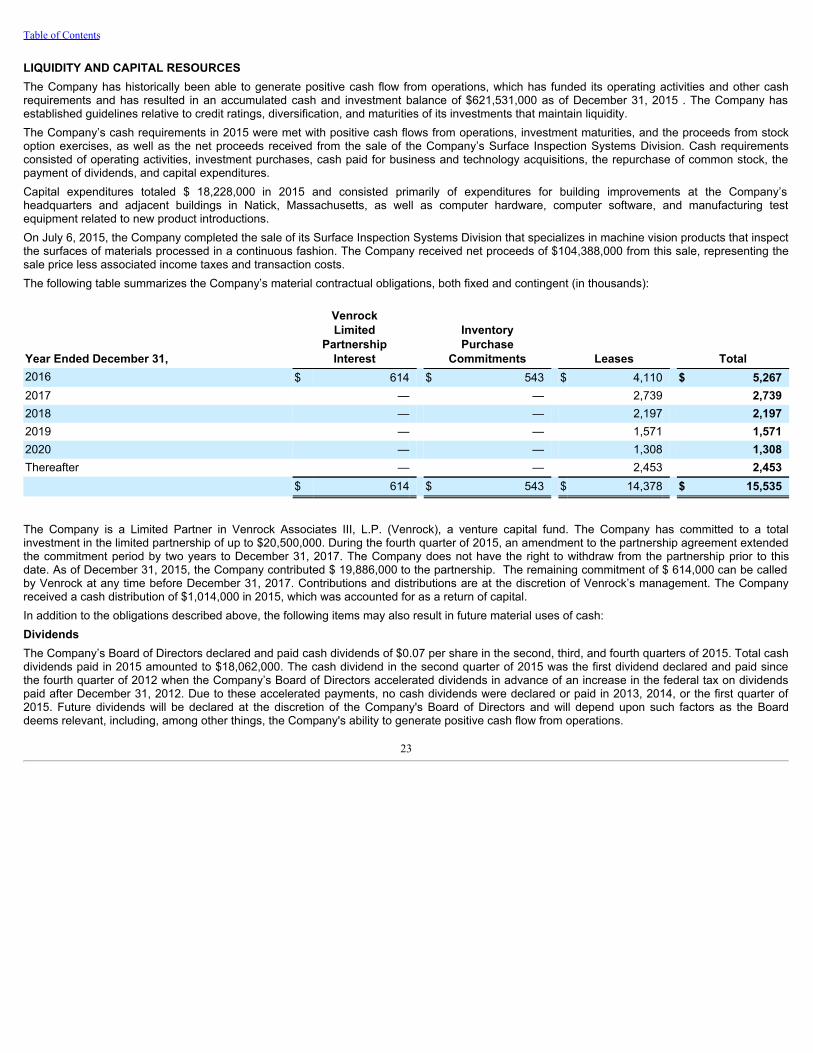
Table of Contents
LIQUIDITY AND CAPITAL RESOURCESThe Company has historically been able to generate positive cash flow from operations, which has funded its operating activities and other cashrequirements and has resulted in an accumulated cash and investment balance of $621,531,000 as of December 31, 2015 . The Company hasestablished guidelines relative to credit ratings, diversification, and maturities of its investments that maintain liquidity.The Company’s cash requirements in 2015 were met with positive cash flows from operations, investment maturities, and the proceeds from stockoption exercises, as well as the net proceeds received from the sale of the Company’s Surface Inspection Systems Division. Cash requirementsconsisted of operating activities, investment purchases, cash paid for business and technology acquisitions, the repurchase of common stock, thepayment of dividends, and capital expenditures.Capital expenditures totaled $ 18,228,000 in 2015 and consisted primarily of expenditures for building improvements at the Company’sheadquarters and adjacent buildings in Natick, Massachusetts, as well as computer hardware, computer software, and manufacturing testequipment related to new product introductions.On July 6, 2015, the Company completed the sale of its Surface Inspection Systems Division that specializes in machine vision products that inspectthe surfaces of materials processed in a continuous fashion. The Company received net proceeds of $104,388,000 from this sale, representing thesale price less associated income taxes and transaction costs.The following table summarizes the Company’s material contractual obligations, both fixed and contingent (in thousands):
Year Ended December 31,
VenrockLimited
PartnershipInterest
InventoryPurchase
Commitments Leases Total2016 $ 614 $ 543 $ 4,110 $ 5,2672017 — — 2,739 2,7392018 — — 2,197 2,1972019 — — 1,571 1,5712020 — — 1,308 1,308Thereafter — — 2,453 2,453 $ 614 $ 543 $ 14,378 $ 15,535
The Company is a Limited Partner in Venrock Associates III, L.P. (Venrock), a venture capital fund. The Company has committed to a totalinvestment in the limited partnership of up to $20,500,000. During the fourth quarter of 2015, an amendment to the partnership agreement extendedthe commitment period by two years to December 31, 2017. The Company does not have the right to withdraw from the partnership prior to thisdate. As of December 31, 2015, the Company contributed $ 19,886,000 to the partnership. The remaining commitment of $ 614,000 can be calledby Venrock at any time before December 31, 2017. Contributions and distributions are at the discretion of Venrock’s management. The Companyreceived a cash distribution of $1,014,000 in 2015, which was accounted for as a return of capital.In addition to the obligations described above, the following items may also result in future material uses of cash:DividendsThe Company’s Board of Directors declared and paid cash dividends of $0.07 per share in the second, third, and fourth quarters of 2015. Total cashdividends paid in 2015 amounted to $18,062,000. The cash dividend in the second quarter of 2015 was the first dividend declared and paid sincethe fourth quarter of 2012 when the Company’s Board of Directors accelerated dividends in advance of an increase in the federal tax on dividendspaid after December 31, 2012. Due to these accelerated payments, no cash dividends were declared or paid in 2013, 2014, or the first quarter of2015. Future dividends will be declared at the discretion of the Company's Board of Directors and will depend upon such factors as the Boarddeems relevant, including, among other things, the Company's ability to generate positive cash flow from operations.
23

Table of Contents
Stock RepurchasesIn April 2014, the Company's Board of Directors authorized the repurchase of $50,000,000 of the Company's common stock. As of December 31,2015, the Company repurchased 1,079,000 shares at a cost of $50,000,000 under this program, including 895,000 shares at a cost of $42,415,000in 2015. Stock repurchases under this 2014 program are now complete. In August 2015, the Company’s Board of Directors authorized therepurchase of an additional $100,000,000 of the Company’s common stock. Purchases under this August 2015 program began in the third quarterof 2015 upon completion of the 2014 program. As of December 31, 2015, the Company repurchased 2,311,000 shares at a cost of $83,936,000under this program. Total stock repurchases in 2015 amounted to $126,351,000. In November 2015, the Company’s Board of Directors authorizedthe repurchase of an additional $100,000,000 of the Company’s common stock. Purchases under this November 2015 program will commence uponcompletion of the August 2015 program. The Company may repurchase shares under these programs in future periods depending on a variety offactors, including, among other things, the impact of dilution from employee stock options, stock price, share availability, and cash requirements.AcquisitionsThe Company’s business strategy includes selective expansion into new machine vision markets and applications through the acquisition ofbusinesses and technologies, which may result in significant cash outlays in the future.On August 21, 2015, the Company acquired selected assets of Manatee Works, Inc., a privately-held U.S.-based developer of barcode scanningsoftware development kits (SDKs). Cognex paid $1,023,000 in cash upon closing and may pay additional contingent cash consideration of up to$5,000,000 over the next three years based upon certain milestone revenue levels. In the second quarter of 2015, the Company paid $10,475,000 incash to purchase technology that was subsequently transferred as part of the sale of the Surface Inspections Systems Division.The Company believes that its existing cash and investment balances, together with cash flow from operations, will be sufficient to meet itsoperating, investing, and financing activities for the next twelve months. As of December 31, 2015, the Company had $621,531,000 in cash andinvestments. In addition, Cognex has no long-term debt and does not anticipate needing debt financing in the near future. We believe that our strongcash position has put us in a relatively good position with respect to our longer-term liquidity needs.
OFF-BALANCE SHEET ARRANGEMENTSAs of December 31, 2015 , the Company has no off-balance sheet arrangements as defined in Item 303(a)(4)(ii) of Regulation S-K.CRITICAL ACCOUNTING POLICIES AND ESTIMATESOur discussion and analysis of the Company’s financial condition and results of operations are based upon the consolidated financial statements,which have been prepared in accordance with accounting principles generally accepted in the United States. The preparation of these financialstatements requires management to make estimates and judgments that affect the reported amounts of assets, liabilities, revenue, and expenses,and related disclosure of contingent assets and liabilities. We base our estimates on historical experience and various other assumptions believed tobe reasonable under the circumstances, the results of which form the basis for making judgments about the carrying values of assets and liabilitiesthat are not readily apparent from other sources. Actual results could differ from these estimates under different assumptions or circumstancesresulting in charges that could be material in future reporting periods. We believe the following critical accounting policies require the use ofsignificant estimates and judgments in the preparation of our consolidated financial statements.Revenue RecognitionThe Company’s product revenue is derived from the sale of machine vision systems, which can take the form of hardware with embedded softwareor software-only, and related accessories. The Company also generates revenue by providing maintenance and support, consulting, and trainingservices to its customers. Certain of the Company’s arrangements include multiple deliverables that provide the customer with a combination ofproducts or services. In order to recognize revenue, the Company requires that a signed customer contract or purchase order is received, the feefrom the arrangement is fixed or determinable, and collection of the resulting receivable is probable. Assuming that these criteria have been met,product revenue is generally recognized upon delivery, revenue from maintenance and support programs is recognized ratably over the programperiod, and revenue from consulting and training services is recognized when the services have been provided. When customer-specifiedacceptance criteria exist that are substantive, product revenue is deferred until these criteria have been met, along with the associated incrementaldirect costs.
24

Table of Contents
The majority of the Company’s product offerings consist of hardware with embedded software. Under the revenue recognition rules for tangibleproducts, the fee from a multiple-deliverable arrangement is allocated to each of the deliverables based upon their relative selling prices asdetermined by a selling-price hierarchy. A deliverable in an arrangement qualifies as a separate unit of accounting if the delivered item has value tothe customer on a stand-alone basis. A delivered item that does not qualify as a separate unit of accounting is combined with the other undelivereditems in the arrangement and revenue is recognized for those combined deliverables as a single unit of accounting. The selling price used for eachdeliverable is based upon vendor-specific objective evidence (VSOE) if available, third-party evidence (TPE) if VSOE is not available, andmanagement’s best estimate of selling price (BESP) if neither VSOE nor TPE are available. VSOE is the price charged for a deliverable when it issold separately. TPE is the price of the Company’s or any competitor’s largely interchangeable products or services in stand-alone sales to similarly-situated customers. BESP is the price at which the Company would sell the deliverable if it were sold regularly on a stand-alone basis, consideringmarket conditions and entity-specific factors.Management exercises judgment in connection with the determination of the amount of revenue to be recognized each period. Such judgmentsinclude, but are not limited to, determining whether separate contracts with the same customer that are entered into at or near the same time shouldbe accounted for as a single arrangement, identifying the various elements in an arrangement, determining if delivered items have stand-alonevalue, determining the relative selling prices of the arrangement’s deliverables, determining whether options to buy additional products or services inthe future are substantive and should be accounted for as a deliverable in the original arrangement, assessing whether the fee is fixed ordeterminable, determining the probability of collecting the receivable, determining whether customer-specified acceptance criteria are substantive innature, determining whether remaining performance obligations are inconsequential or perfunctory, and assessing whether vendor-specific objectiveevidence of fair value has been established for undelivered elements.
InvestmentsAs of December 31, 2015 , the Company’s investment balance totaled $569,556,000, of which $568,614,000 consisted of debt securities and $942,000 consisted of a limited partnership interest in a venture capital fund. The debt securities are reported at fair value, with unrealized gains andlosses, net of tax, recorded in shareholders’ equity as other comprehensive income (loss) since these securities are designated as available-for-salesecurities. As of December 31, 2015 ,the Company’s portfolio of debt securities had a net unrealized loss of $1,659,000. The limited partnershipinterest is in Venrock Associates III, L.P., a venture capital fund with an investment focus on Information Technology and Health Care and LifeSciences. The limited partnership interest is accounted for using the cost method because our investment is less than 5% of the partnership and wehave no influence over the partnership’s operating and financial policies. Furthermore, this investment does not have a readily determinable marketvalue, and therefore, does not qualify for fair value accounting.The Company applies a three-level valuation hierarchy for fair value measurements. The categorization of assets and liabilities within the valuationhierarchy is based upon the lowest level of input that is significant to the measurement of fair value. Level 1 inputs to the valuation methodologyutilize unadjusted quoted market prices in active markets for identical assets and liabilities. Level 2 inputs to the valuation methodology are otherobservable inputs, including quoted market prices for similar assets and liabilities, quoted prices for identical and similar assets and liabilities inmarkets that are not active, or other inputs that are observable or can be corroborated by observable market data. Level 3 inputs to the valuationmethodology are unobservable inputs based upon management’s best estimate of the inputs that market participants would use in pricing the assetor liability at the measurement date, including assumptions about risk. Changes in the valuation methodology, interest rates, credit rates, or themarket for these investments could result in changes to their fair values. Changes to the Level of an investment within the fair value hierarchy aredetermined at the end of the reporting period.The Company’s money market instruments are reported at fair value based upon the daily market price for identical assets in active markets, andare therefore classified as Level 1. The Company’s debt securities are reported at fair value based upon model-driven valuations in which allsignificant inputs are observable or can be derived from or corroborated by observable market data for substantially the full term of the asset, andare therefore classified as Level 2. Management is responsible for estimating the fair value of these financial assets and liabilities, and in doing so,considers valuations provided by a large, third-party pricing service. This service maintains regular contact with market makers, brokers, dealers,and analysts to gather information on market movement, direction, trends, and other specific data. They use this information to structure yield curvesfor various types of debt securities and arrive at the daily valuations.Management monitors the carrying value of its investments in debt securities and the limited partnership interest compared to their fair value todetermine whether an other-than-temporary impairment has occurred. In considering whether a decline in fair value is other-than-temporary, weconsider many factors, both qualitative and quantitative in
25

Table of Contents
nature. In its evaluation of its debt securities, management considers the type of security, the credit rating of the security, the length of time thesecurity has been in a loss position, the size of the loss position, our ability and intent to hold the security to expected recovery of value, and othermeaningful information. If a decline in fair value is determined to be other-than-temporary, an impairment charge would be recorded in currentoperations to reduce the carrying value of the investment to its fair value. There were no other-than-temporary impairments of investments in 2015,2014, or 2013.Accounts ReceivableThe Company maintains reserves against its accounts receivable for potential credit losses. Ongoing credit evaluations of customers are performedand the Company has historically not experienced significant losses related to the collection of its accounts receivable. Allowances for specificaccounts determined to be at risk for collection are estimated by management taking into account the length of time the receivable has beenoutstanding, the customer’s current ability to pay its obligations to the Company, general economic and industry conditions, as well as various otherfactors. Global economic uncertainty may result in longer payment cycles and challenges in collecting accounts receivable balances, which makethese estimates more judgmental. An adverse change in any of these factors could result in higher than expected customer defaults and may resultin the need for additional bad debt provisions. As of December 31, 2015 , the Company’s reserve against accounts receivable was $736,000, or 2%of the gross accounts receivable balance. A 10% difference in the reserve against accounts receivable as of December 31, 2015 would haveaffected net income by approximately $61,000.InventoriesInventories are stated at the lower of cost or market. Management estimates excess and obsolescence exposures based upon assumptions aboutfuture demand, product transitions, and market conditions, and records reserves to reduce the carrying value of inventories to their net realizablevalue. Volatility in the global economy makes these assumptions about future demand more judgmental. Among the risks associated with theintroduction of new products are difficulty predicting customer demand and effectively managing inventory levels to ensure adequate supply of thenew product and avoid excess supply of the legacy product. In addition, we may strategically enter into non-cancelable commitments with vendorsto purchase materials for products in advance of demand to take advantage of favorable pricing or address concerns about the availability of futuresupplies and long lead times. As of December 31, 2015 , the Company’s reserve for excess and obsolete inventory totaled $3,803,000, or 9% of thegross inventory balance. A 10% difference in inventory reserves as of December 31, 2015 would have affected net income by approximately$314,000.Long-lived AssetsThe Company has long-lived assets, including property, plant, and equipment and acquired intangible assets. These assets are susceptible toshortened estimated useful lives and changes in fair value due to changes in their use, market or economic changes, or other events orcircumstances. The Company evaluates the potential impairment of these long-lived assets whenever events or circumstances indicate theircarrying value may not be recoverable. Factors that could trigger an impairment review include historical or projected results that are less than theassumptions used in the original valuation of an acquired asset, a change in the Company’s business strategy or its use of an acquired asset, ornegative economic or industry trends.If an event or circumstance indicates the carrying value of long-lived assets may not be recoverable, the Company assesses the recoverability of theassets by comparing the carrying value of the assets to the sum of the undiscounted future cash flows that the assets are expected to generate overtheir remaining economic lives. If the carrying value exceeds the sum of the undiscounted future cash flows, the Company compares the fair valueof the long-lived assets to the carrying value and records an impairment loss for the difference. The Company generally estimates the fair value ofits long-lived assets using the income approach based upon a discounted cash flow model. The income approach requires the use of manyassumptions and estimates including future revenues and expenses, discount factors, income tax rates, the identification of groups of assets withhighly independent cash flows, and assets’ economic lives. Volatility in the global economy makes these assumptions and estimates morejudgmental. No impairment losses were recorded in 2015, 2014, or 2013. Actual future operating results and the remaining economic lives of ourlong-lived assets could differ from those used in assessing the recoverability of these assets and could result in an impairment of long-lived assets infuture periods.
26

Table of Contents
GoodwillManagement evaluates the potential impairment of goodwill annually each fourth quarter and whenever events or circumstances indicate theircarrying value may not be recoverable. On July 6, 2015, the Company completed the sale of its Surface Inspection Systems Division (SISD). TheCompany had previously identified SISD, along with its Modular Vision Systems Division (MVSD), as reporting units for purposes of its goodwillimpairment test. Given the disposition of SISD, management reviewed its reporting units and concluded that the Company now has one reportingunit . Determining the Company’s reporting units requires judgments regarding what constitutes a business and at what level discrete financialinformation is available and reviewed by management.The Company performs a qualitative assessment of goodwill (commonly known as “step zero”) to determine whether further impairment testing isnecessary. If this qualitative assessment indicates that it is more likely than not that the fair value of a reporting unit is less than its carrying amount,the entity would proceed to a two-step process. Step one compares the fair value of the reporting unit with its carrying value, including goodwill. Ifthe carrying amount exceeds the fair value of the reporting unit, step two is required to measure the amount of impairment loss. Step two comparesthe implied fair value of the reporting unit goodwill to the carrying amount of the goodwill. The Company estimates the fair value of its reporting unitusing the income approach based upon a discounted cash flow model. In addition, the Company uses the market approach, which compares thereporting unit to publicly-traded companies and transactions involving similar businesses, to support the conclusions based upon the incomeapproach. The income approach requires the use of many assumptions and estimates including future revenues, expenses, capital expenditures,and working capital, as well as discount factors and income tax rates.Factors that management considered in the qualitative assessment include macroeconomic conditions, industry and market considerations, overallfinancial performance (both current and projected), changes in management or strategy, and changes in the composition or carrying amount of netassets. In addition, management took into consideration the goodwill valuation as of October 4, 2010, which was the last time it was performedunder the two-step process. At that time, this analysis indicated that the fair value of the MVSD reporting unit exceeded its carrying value byapproximately 208%. Based on the qualitative assessment, management does not believe that it is more likely than not that the carrying value of itsreporting unit exceeds its fair value. No impairment losses were recorded in 2015, 2014, or 2013.Warranty ObligationsThe Company records the estimated cost of fulfilling product warranties at the time of sale based upon historical costs to fulfill claims. Obligationsmay also be recorded subsequent to the time of sale whenever specific events or circumstances impacting product quality become known thatwould not have been taken into account using historical data. While we engage in extensive product quality programs and processes, includingactively monitoring and evaluating the quality of our component suppliers and third-party contract manufacturers, the Company’s warranty obligationis affected by product failure rates, material usage, and service delivery costs incurred in correcting a product failure. An adverse change in any ofthese factors may result in the need for additional warranty provisions. As of December 31, 2015 , the Company’s accrued warranty obligationsamounted to $4,174,000. A 10% difference in accrued warranty obligations as of December 31, 2015 would have affected net income byapproximately $344,000.ContingenciesEstimated losses from contingencies are accrued by management based upon whether a loss is probable and whether management has the abilityto reasonably estimate the amount of the loss. Estimating potential losses, or even a range of losses, is difficult and involves a great deal ofjudgment. Management relies primarily on assessments made by its internal and external legal counsel to make the determination as to whether aloss contingency arising from litigation should be recorded or disclosed. This analysis is performed on a quarterly basis or when facts andcircumstances dictate. Should the resolution of a contingency result in a loss that we did not accrue because management did not believe that theloss was probable or capable of being reasonably estimated, then this loss would result in a charge to income in the period the contingency wasresolved. The Company did not have any significant accrued contingencies as of December 31, 2015.Stock-Based CompensationCompensation expense is recognized for all stock option and restricted stock grants. Determining the appropriate valuation model and estimatingthe fair values of these grants requires the input of subjective assumptions, including expected stock price volatility, dividend yields, expected term,and forfeiture rates. The expected volatility assumption is based partially upon the historical volatility of the Company’s common stock, which may ormay not be a true indicator of future volatility, particularly as the Company continues to seek to diversify its customer base. The assumptions used incalculating the fair values of stock option grants represent management’s best estimates, but these estimates involve inherent uncertainties and theapplication of judgment. As a result, if factors change and different assumptions are
27

Table of Contents
used, stock-based compensation expense could be significantly different from what the Company recorded in the current period.Income TaxesSignificant judgment is required in determining worldwide income tax expense based upon tax laws in the various jurisdictions in which the Companyoperates. The Company has established reserves for income taxes by applying the “more likely than not” criteria, under which the recognitionthreshold is met when an entity concludes that a tax position, based solely on its technical merits, is more likely than not to be sustained uponexamination by the relevant tax authority. All tax positions are analyzed periodically and adjustments are made as events occur that warrantmodification, such as the completion of audits or the expiration of statutes of limitations, which may result in future charges or credits to income taxexpense.As part of the process of preparing consolidated financial statements, management is required to estimate income taxes in each of the jurisdictionsin which the Company operates. This process involves estimating the current tax liability, as well as assessing temporary differences arising fromthe different treatment of items for financial statement and tax purposes. These differences result in deferred tax assets and liabilities, which arerecorded on the Consolidated Balance Sheets.The Company has net deferred tax assets primarily resulting from temporary differences between the financial statement and tax bases of assetsand liabilities. Management has evaluated the realizability of these deferred tax assets and has determined that it is more likely than not that theseassets will be realized, net of any valuation allowance. In reaching this conclusion, we have evaluated relevant criteria, including the Company’shistorical profitability, current projections of future profitability, and the lives of tax credits, net operating and capital losses, and other carryforwards,certain of which have indefinite lives. Should the Company fail to generate sufficient pre-tax profits in future periods, we may be required to recordmaterial adjustments to these deferred tax assets, resulting in a charge to income in the period of determination.Derivative InstrumentsIn certain instances, the Company enters into forward contracts to hedge against foreign currency fluctuations. The Company's forward contractsare reported at fair value based upon model-driven valuations in which all significant inputs are observable or can be derived from or corroboratedby observable market data for substantially the full term of the asset or liability, and are therefore classified as Level 2. The Company's forwardcontracts are typically traded or executed in over-the-counter markets with a relatively high degree of pricing transparency. The market participantsare generally large commercial banks.Currently, the Company enters into two types of hedges to manage foreign currency exchange rate risk. The first are economic hedges which utilizeforeign currency forward contracts to manage the exposure to fluctuations in foreign currency exchange rates arising primarily from foreign-denominated receivables and payables. The gains and losses on these derivatives are intended to be offset by the changes in the fair value of theassets and liabilities being hedged. These economic hedges are not designated as effective hedges, and therefore, do not qualify for effectivehedge accounting. The second are cash flow hedges which utilize foreign currency forward contracts to protect our budgeted revenues andexpenses against foreign currency exchange rate changes compared to our budgeted rates. These cash flow hedges are designated for hedgeaccounting, and therefore, the effective portion of the forward contract's gain or loss is reported in shareholders' equity as other comprehensiveincome (loss) and is reclassified into current operations as the hedged transaction impacts current operations. Should these hedges fail to qualify forhedge accounting or be ineffective, the gain or loss on the forward contract would be reported in current operations immediately as opposed to whenthe hedged transaction impacts current operations. This may result in material foreign currency gains or losses.
NEW PRONOUNCEMENTSAccounting Standards Update (ASU) 2014-09, “Revenue from Contracts with Customers”
The amendments in ASU 2014-09 will supersede and replace all currently existing U.S. GAAP, including industry-specific revenue recognitionguidance, with a single, principle-based revenue recognition framework. The concept guiding this new model is that revenue recognition will depicttransfer of control to the customer in an amount that reflects consideration to which an entity expects to be entitled. The core principles supportingthis framework include (1) identifying the contract with a customer, (2) identifying separate performance obligations within the contract, (3)determining the transaction price, (4) allocating the transaction price to the performance obligations, and (5) recognizing revenue. This newframework will require entities to apply significantly more judgment. This increase in management judgment will require expanded disclosure onestimation methods, inputs, and assumptions for revenue recognition. The Transition Resource Group (TRG) is evaluating the impact of this ASUand will release implementation guidance
28

Table of Contents
in future periods. ASU 2015-14, "Deferral of the effective date" amended the effective date of ASU 2014-09 for public companies to annual reportingperiods beginning after December 15, 2017. Early adoption is permitted, but only beginning after December 15, 2016. Management will continue toevaluate the impact of this standard as it evolves.
Accounting Standards Update (ASU) 2015-05, "Customer's Accounting for Fees Paid in a Cloud Computing Arrangement"
ASU 2015-05 provides guidance to customers about whether a cloud computing arrangement includes a software license. If a cloud computingarrangement includes a software license, then the customer should account for the software license element of the arrangement consistent with theacquisition of other software licenses. If a cloud computing arrangement does not include a software license, then the customer should account forthe arrangement as a service contract. For public companies, the guidance in ASU 2015-05 is effective for annual periods beginning after December15, 2015, and interim periods within those annual periods. Early adoption is permitted. Management does not expect ASU 2015-05 to have amaterial impact on the Company's financial statements and disclosures.
Accounting Standards Update (ASU) 2015-11, "Inventory - Simplifying the Measurement of Inventory"
ASU 2015-11 requires companies to measure most inventory at the lower of cost and net realizable value, thereby simplifying the current guidanceunder which a company must measure inventory at the lower of cost or market. This ASU eliminates the need to determine replacement cost andevaluate whether said cost is within a quantitative range. This ASU also further aligns U.S. GAAP and international accounting standards. For publiccompanies, the guidance in ASU 2015-11 is effective for annual periods beginning after December 15, 2016, and interim periods within those annualperiods. Early adoption is permitted. Management does not expect ASU 2015-11 to have a material impact on the Company's financial statementsand disclosures.
Accounting Standards Update (ASU) 2015-16, "Business Combinations - Simplifying the Accounting for Measurement-Period Adjustments"
ASU 2015-16 simplifies the requirements to retrospectively account for adjustments made to provisional amounts recognized in a businesscombination. This ASU applies to all entities that have reported provisional amounts for items in a business combination for which the accounting isincomplete by the end of the reporting period in which the combination occurs and that have recognized an adjustment to provisional amountsduring the measurement period. For public companies, the guidance in ASU 2015-16 is effective for annual periods beginning after December 15,2015, and interim periods within those annual periods. This ASU should be applied prospectively to adjustments to provisional amounts that occurafter the effective date. Management does not expect ASU 2015-16 to have a material impact on the Company's financial statements anddisclosures.
Accounting Standard Update (ASU) 2015-17, "Income Taxes - Balance Sheet Classification of Deferred Taxes”
ASU 2015-17 simplifies the presentation of deferred income taxes to require that deferred tax assets and liabilities be classified as non-current in aclassified balance sheet. Current U.S. GAAP requires an entity to separate deferred income tax assets and liabilities into current and non-currentamounts in a classified balance sheet.The current requirement that deferred tax assets and liabilities of a tax-paying component of an entity beoffset and presented as a single amount is not affected by the amendments of this Update. For public companies, the guidance in ASC 2015-17 iseffective for annual periods beginning after December 15, 2016, and interim periods within those annual periods. Earlier adoption is permitted.Management will comply with the presentation and disclosure requirements of ASU-2017 for the year ended December 31, 2016.
ITEM 7A: QUANTITATIVE AND QUALITATIVE DISCLOSURES ABOUT MARKET RISKThe Company is exposed to certain risks relating to its ongoing business operations, including foreign currency exchange rate risk and interest raterisk. The Company currently mitigates certain foreign currency exchange rate risks with derivative instruments. The Company does not currentlymanage its interest rate risk with derivative instruments.Foreign Currency RiskThe Company faces exposure to foreign currency exchange rate fluctuations, as a significant portion of its revenues, expenses, assets, andliabilities are denominated in currencies other than the functional currencies of the Company’s subsidiaries or the reporting currency of theCompany, which is the U.S. Dollar. In certain instances, we utilize forward contracts to hedge against foreign currency fluctuations. These contractsare used to minimize foreign gains or losses, as the gains or losses on the derivative are intended to offset the losses or gains on the underlyingexposure. We do not engage in foreign currency speculation.The Company’s foreign currency risk management strategy is principally designed to mitigate the potential financial impact of changes in the valueof transactions and balances denominated in foreign currencies resulting from changes
29

Table of Contents
in foreign currency exchange rates. Currently, the Company enters into two types of hedges to manage this risk. The first are economic hedgeswhich utilize foreign currency forward contracts with maturities of up to 45 days to manage the exposure to fluctuations in foreign currency exchangerates arising primarily from foreign-denominated receivables and payables. The gains and losses on these derivatives are intended to be offset bythe changes in the fair value of the assets and liabilities being hedged. The second are cash flow hedges which utilize foreign currency forwardcontracts with maturities of up to 18 months to hedge specific forecasted transactions of the Company's foreign subsidiaries with the goal ofprotecting our budgeted revenues and expenses against foreign currency exchange rate changes compared to our budgeted rates.
The Company had the following outstanding forward contracts (in thousands):
December 31, 2015 December 31, 2014
CurrencyNotional
ValueUSD
Equivalent High Rate Low RateNotional
ValueUSD
Equivalent High Rate Low Rate DerivativesDesignatedasHedgingInstruments: U.S. Dollar 16,720 $ 16,720 1.1462 1.0903 — $ — — —Japanese Yen 942,500 7,605 147.82 129.08 1,225,000 10,211 148.12 138.70Hungarian Forint 547,000 1,893 319.87 301.10 803,000 3,099 319.05 305.07Singapore Dollar 2,063 1,425 1.6451 1.5063 3,515 2,564 1.7413 1.6304Canadian Dollar 41 37 1.1155 1.1145 758 688 1.1250 1.0620British Pound 25 34 0.8039 0.8021 491 732 0.8375 0.7914DerivativesNotDesignatedasHedgingInstruments: Japanese Yen 700,000 $ 5,800 131.07 131.07 345,000 $ 2,878 145.02 145.02British Pound 1,650 2,441 0.7342 0.7342 1,400 2,183 0.7760 0.7760Korean Won 1,400,000 1,187 1,281 1,281 940,000 858 1,325 1,325Singapore Dollar 1,525 1,074 1.5422 1.5422 1,225 922 1.6070 1.6070Hungarian Forint 250,000 857 316.95 316.95 410,000 1,569 316.10 316.10Taiwanese Dollar 26,425 800 35.85 35.85 28,000 883 38.36 38.36
A change in foreign currency exchange rates could materially impact the fair value of these contracts; however, if this occurred, the fair value of theunderlying exposures hedged by the contracts would change by a similar amount. Accordingly, management does not believe that a materialchange in foreign currency exchange rates used in the fair value of our derivative instruments would materially impact operations or cash flows.
The success of our foreign currency risk management program depends upon forecasts of transaction activity denominated in various currencies.To the extent that these forecasts are overstated or understated during periods of currency volatility, we could experience unanticipated foreigncurrency gains or losses that could have a material impact on our results of operations. Furthermore, our failure to identify new exposures andhedge them in an effective manner may result in material foreign currency gains or losses.
The Company’s functional currency/reporting currency exchange rate exposures result from revenues and expenses that are denominated incurrencies other than the U.S. Dollar. A significant portion of our revenues and expenses are denominated in the Euro, the Japanese Yen, and theChinese Yuan, also known as Renminbi. Our predominant currency of sale is the U.S. Dollar in the Americas, the Euro and U.S. Dollar in Europe,the Yuan in Mainland China, the Yen in Japan, and the U.S. Dollar in other regions. We estimate that approximately 40% of our sales in 2015 wereinvoiced in currencies other than the U.S. Dollar, and we expect sales denominated in foreign currencies to continue to represent a significantportion of our total revenue. While we also have expenses denominated in these same foreign currencies, the impact on revenues has historicallybeen, and is expected to continue to be, greater than the offsetting impact on expenses. Therefore, in times when the U.S. Dollar strengthens inrelation to these foreign currencies, we would expect to report a net decrease in operating income. Conversely, in times when the U.S. Dollarweakens in relation to these foreign currencies, we would expect to report a net increase in operating income. Thus, changes in the relative strengthof the U.S. Dollar may have a material impact on our operating results.
Interest Rate RiskThe Company’s investment portfolio of debt securities includes corporate bonds, treasury bills, asset-backed securities, a Euro liquidity fund, agencybonds, sovereign bonds and municipal bonds. Debt securities with original maturities
30

Table of Contents
greater than three months are designated as available-for-sale and are reported at fair value. As of December 31, 2015 , the fair value of theCompany’s portfolio of debt securities amounted to $568,614,000 with principal amounts totaling $570,273,000 , maturities that do not exceed sevenyears, and a yield to maturity of 0.85%. Differences between the fair value and principal amounts of the Company’s portfolio of debt securities areprimarily attributable to discounts and premiums arising at the acquisition date, as well as unrealized gains and losses as of the balance sheet date.Although it is the Company’s policy to invest in debt securities with effective maturities that do not exceed ten years, 96% of the investment portfolioas of December 31, 2015 has effective maturity dates of less than three years. Given the relatively short maturities and investment-grade quality ofthe Company’s portfolio of debt securities as of December 31, 2015 , a sharp rise in interest rates should not have a material adverse effect on thefair value of these instruments. As a result, the Company does not currently hedge these interest rate exposures.The following table presents the hypothetical change in the fair value of the Company’s portfolio of debt securities arising from selected potentialchanges in interest rates (in thousands). This modeling technique measures the change in fair value that would result from a parallel shift in the yieldcurve plus or minus 50 and 100 basis points (BP) over a twelve-month time horizon.
Type of security Valuation of securities given
an interest rate decrease No change ininterest rates
Valuation of securities givenan interest rate increase
(100 BP) (50 BP) 50 BP 100 BPCorporate bonds $ 232,786 $ 231,869 $ 230,951 $ 230,034 $ 229,117Treasury bills 155,020 154,409 153,797 153,185 152,573Asset-backed securities 87,266 86,921 86,576 86,233 85,889Euro liquidity fund 47,964 47,847 47,730 47,613 47,496Sovereign bonds 35,220 35,081 34,943 34,804 34,666Agency bonds 9,231 9,195 9,158 9,122 9,085Municipal bonds 5,502 5,480 5,459 5,437 5,415 $ 572,989 $ 570,802 $ 568,614 $ 566,428 $ 564,241
31

Table of Contents
ITEM 8: FINANCIAL STATEMENTS AND SUPPLEMENTARY DATA
INDEX TO FINANCIAL STATEMENTS AND SUPPLEMENTARY DATA
Consolidated Financial Statements: Report of Independent Registered Public Accounting Firm 33Consolidated Statements of Operations for the Years Ended December 31, 2015, 2014, and 2013 34Consolidated Statements of Comprehensive Income for the Years Ended December 31, 2015, 2014, and 2013 35Consolidated Balance Sheets as of December 31, 2015 and 2014 36Consolidated Statements of Cash Flows for the Years Ended December 31, 2015, 2014, and 2013 37Consolidated Statements of Shareholders’ Equity for the Years Ended December 31, 2015, 2014, and 2013 38Notes to the Consolidated Financial Statements 39Selected Quarterly Financial Data (unaudited) 65
Financial Statement Schedule: Report of Independent Registered Public Accounting Firm 66Schedule II – Valuation and Qualifying Accounts for the Years Ended December 31, 2015, 2014, and 2013 67
32

Table of Contents
REPORT OF INDEPENDENT REGISTERED PUBLIC ACCOUNTING FIRM
To the Board of Directors and Shareholders of Cognex Corporation:We have audited the accompanying consolidated balance sheets of Cognex Corporation (a Massachusetts corporation) and subsidiaries (the“Company”) as of December 31, 2015 and 2014 , and the related consolidated statements of operations, comprehensive income, cash flows, andshareholders’ equity for each of the three years in the period ended December 31, 2015 . These financial statements are the responsibility of theCompany’s management. Our responsibility is to express an opinion on these financial statements based on our audits.We conducted our audits in accordance with the standards of the Public Company Accounting Oversight Board (United States). Those standardsrequire that we plan and perform the audit to obtain reasonable assurance about whether the financial statements are free of material misstatement.An audit includes examining, on a test basis, evidence supporting the amounts and disclosures in the financial statements. An audit also includesassessing the accounting principles used and significant estimates made by management, as well as evaluating the overall financial statementpresentation. We believe that our audits provide a reasonable basis for our opinion.In our opinion, the consolidated financial statements referred to above present fairly, in all material respects, the financial position of CognexCorporation and subsidiaries as of December 31, 2015 and 2014 , and the results of their operations and their cash flows for each of the three yearsin the period ended December 31, 2015 in conformity with accounting principles generally accepted in the United States of America.We also have audited, in accordance with the standards of the Public Company Accounting Oversight Board (United States), the Company’s internalcontrol over financial reporting as of December 31, 2015 , based on criteria established in the 2013 InternalControl-IntegratedFrameworkissued bythe Committee of Sponsoring Organizations of the Treadway Commission (COSO), and our report dated February 10, 2016 expressed anunqualified opinion.
/s/ GRANT THORNTON LLP
Boston, MassachusettsFebruary 10, 2016
33
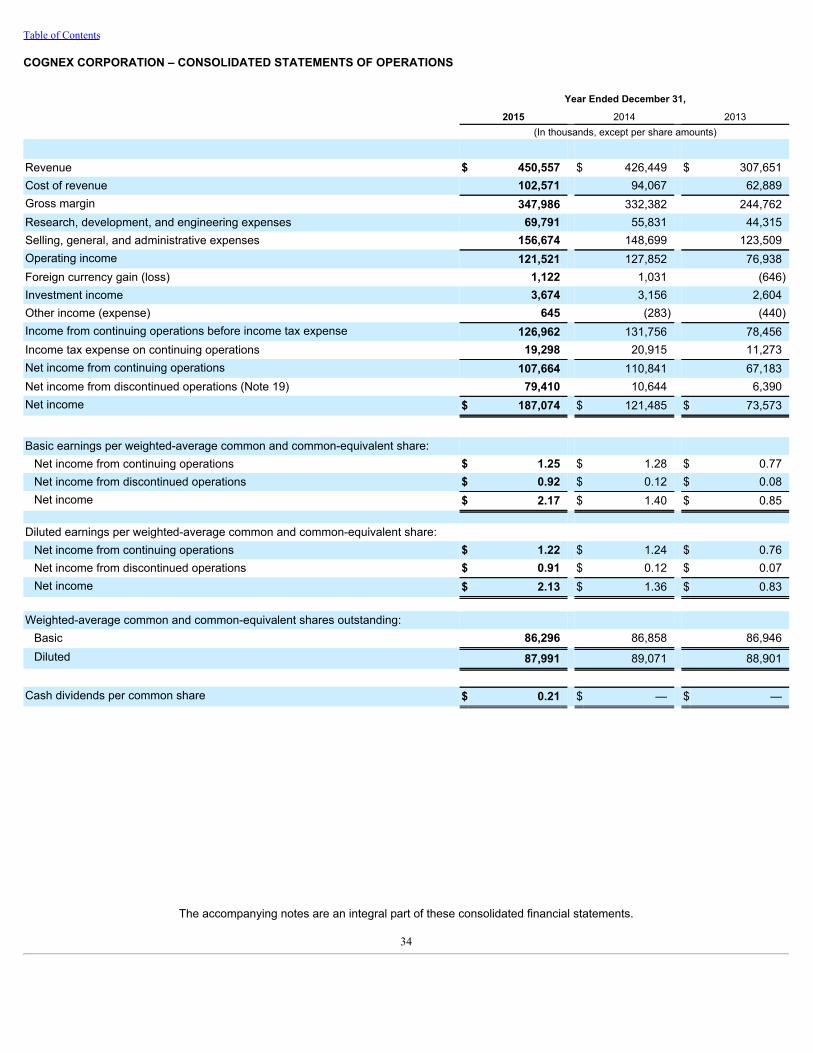
Table of Contents
COGNEX CORPORATION – CONSOLIDATED STATEMENTS OF OPERATIONS
Year Ended December 31, 2015 2014 2013 (In thousands, except per share amounts)
Revenue $ 450,557 $ 426,449 $ 307,651Cost of revenue 102,571 94,067 62,889Gross margin 347,986 332,382 244,762Research, development, and engineering expenses 69,791 55,831 44,315Selling, general, and administrative expenses 156,674 148,699 123,509Operating income 121,521 127,852 76,938Foreign currency gain (loss) 1,122 1,031 (646)Investment income 3,674 3,156 2,604Other income (expense) 645 (283) (440)Income from continuing operations before income tax expense 126,962 131,756 78,456Income tax expense on continuing operations 19,298 20,915 11,273Net income from continuing operations 107,664 110,841 67,183Net income from discontinued operations (Note 19) 79,410 10,644 6,390Net income $ 187,074 $ 121,485 $ 73,573
Basic earnings per weighted-average common and common-equivalent share: Net income from continuing operations $ 1.25 $ 1.28 $ 0.77Net income from discontinued operations $ 0.92 $ 0.12 $ 0.08Net income $ 2.17 $ 1.40 $ 0.85
Diluted earnings per weighted-average common and common-equivalent share:
Net income from continuing operations $ 1.22 $ 1.24 $ 0.76Net income from discontinued operations $ 0.91 $ 0.12 $ 0.07Net income $ 2.13 $ 1.36 $ 0.83
Weighted-average common and common-equivalent shares outstanding:
Basic 86,296 86,858 86,946Diluted 87,991 89,071 88,901
Cash dividends per common share $ 0.21 $ — $ —
The accompanying notes are an integral part of these consolidated financial statements.
34

Table of Contents
COGNEX CORPORATION – CONSOLIDATED STATEMENTS OF COMPREHENSIVE INCOME
Year Ended December 31, 2015 2014 2013 (In thousands)Net income $ 187,074 $ 121,485 $ 73,573Other comprehensive income (loss), net of tax:
Cash flow hedges: Net unrealized gain (loss), net of tax of $22, $0, and $13 in 2015, 2014,and 2013, respectively (27) (118) 104Reclassification of net realized (gain) loss into current operations 201 46 —
Net change related to cash flow hedges 174 (72) 104
Available-for-sale investments: Net unrealized gain (loss), net of tax of ($279), $40, and ($147) in 2015,2014, and 2013, respectively (939) 579 (190)Reclassification of net realized (gain) loss into current operations (344) (673) (314)
Net change related to available-for-sale investments (1,283) (94) (504)
Foreign currency translation adjustments: Foreign currency translation adjustments, net of tax of ($711), ($870), and$22 in 2015, 2014, and 2013, respectively (11,616) (9,400) 82
Net change related to foreign currency translation adjustments (11,616) (9,400) 82
Other comprehensive income (loss), net of tax (12,725) (9,566) (318)Total comprehensive income $ 174,349 $ 111,919 $ 73,255
The accompanying notes are an integral part of these consolidated financial statements.
35

Table of Contents
COGNEX CORPORATION – CONSOLIDATED BALANCE SHEETS
December 31, 2015 2014 (In thousands)ASSETS Current assets:
Cash and cash equivalents $ 51,975 $ 55,694Short-term investments 296,468 90,456Accounts receivable, less reserves of $736 and $820 in 2015 and 2014, respectively 42,846 40,053Inventories 37,334 29,223Deferred income taxes 7,104 8,985Prepaid expenses and other current assets 15,871 17,686Held for sale assets (Note 19) — 29,814
Total current assets 451,598 271,911Long-term investments 273,088 400,845Property, plant, and equipment, net 53,285 45,963Goodwill 81,448 77,388Intangible assets, net 6,315 9,670Deferred income taxes 19,413 14,452Other assets 2,609 1,505
Total assets $ 887,756 $ 821,734
LIABILITIES AND SHAREHOLDERS’ EQUITY Current liabilities:
Accounts payable $ 7,860 $ 17,223Accrued expenses 33,272 35,614Accrued income taxes 985 1,048Deferred income taxes 319 —Deferred revenue and customer deposits 11,571 14,598Held for sale liabilities (Note 19) — 12,191
Total current liabilities 54,007 80,674Reserve for income taxes 4,830 4,623Other non-current liabilities 3,252 —
Total liabilities 62,089 85,297
Commitments and contingencies (Note 10) Shareholders’ equity:
Common stock, $.002 par value – Authorized: 140,000 shares, issued and outstanding: 84,856 and 86,542 shares in 2015 and2014, respectively 170 173Additional paid-in capital 311,008 251,717Retained earnings 566,613 523,946Accumulated other comprehensive loss, net of tax (52,124) (39,399)
Total shareholders’ equity 825,667 736,437 $ 887,756 $ 821,734
The accompanying notes are an integral part of these consolidated financial statements.
36
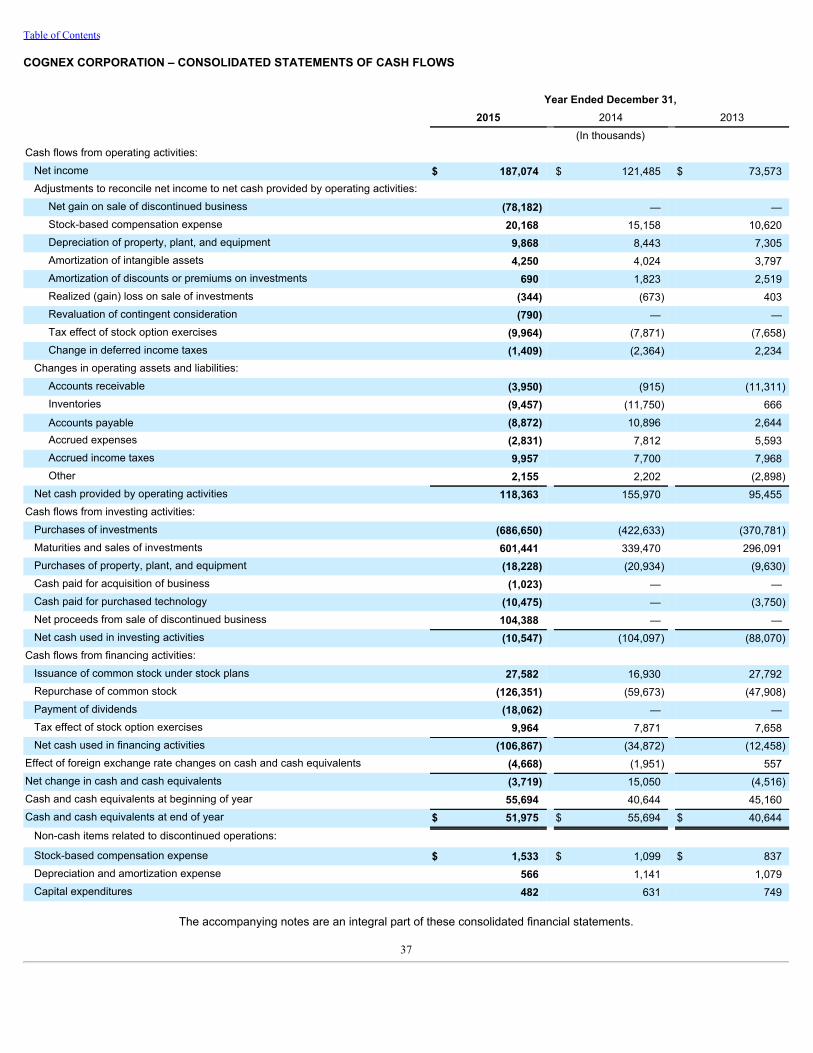
Table of Contents
COGNEX CORPORATION – CONSOLIDATED STATEMENTS OF CASH FLOWS
Year Ended December 31, 2015 2014 2013 (In thousands)Cash flows from operating activities:
Net income $ 187,074 $ 121,485 $ 73,573Adjustments to reconcile net income to net cash provided by operating activities:
Net gain on sale of discontinued business (78,182) — —Stock-based compensation expense 20,168 15,158 10,620Depreciation of property, plant, and equipment 9,868 8,443 7,305Amortization of intangible assets 4,250 4,024 3,797Amortization of discounts or premiums on investments 690 1,823 2,519Realized (gain) loss on sale of investments (344) (673) 403Revaluation of contingent consideration (790) — —Tax effect of stock option exercises (9,964) (7,871) (7,658)Change in deferred income taxes (1,409) (2,364) 2,234
Changes in operating assets and liabilities: Accounts receivable (3,950) (915) (11,311)Inventories (9,457) (11,750) 666Accounts payable (8,872) 10,896 2,644Accrued expenses (2,831) 7,812 5,593Accrued income taxes 9,957 7,700 7,968Other 2,155 2,202 (2,898)
Net cash provided by operating activities 118,363 155,970 95,455Cash flows from investing activities:
Purchases of investments (686,650) (422,633) (370,781)Maturities and sales of investments 601,441 339,470 296,091Purchases of property, plant, and equipment (18,228) (20,934) (9,630)Cash paid for acquisition of business (1,023) — —Cash paid for purchased technology (10,475) — (3,750)Net proceeds from sale of discontinued business 104,388 — —Net cash used in investing activities (10,547) (104,097) (88,070)
Cash flows from financing activities: Issuance of common stock under stock plans 27,582 16,930 27,792Repurchase of common stock (126,351) (59,673) (47,908)Payment of dividends (18,062) — —Tax effect of stock option exercises 9,964 7,871 7,658Net cash used in financing activities (106,867) (34,872) (12,458)
Effect of foreign exchange rate changes on cash and cash equivalents (4,668) (1,951) 557Net change in cash and cash equivalents (3,719) 15,050 (4,516)Cash and cash equivalents at beginning of year 55,694 40,644 45,160Cash and cash equivalents at end of year $ 51,975 $ 55,694 $ 40,644
Non-cash items related to discontinued operations: Stock-based compensation expense $ 1,533 $ 1,099 $ 837Depreciation and amortization expense 566 1,141 1,079Capital expenditures 482 631 749
The accompanying notes are an integral part of these consolidated financial statements.
37

Table of Contents
COGNEX CORPORATION – CONSOLIDATED STATEMENTS OF SHAREHOLDERS’ EQUITY
Common Stock Additional
Paid-inCapital
RetainedEarnings
AccumulatedOther
ComprehensiveLoss
TotalShareholders’
Equity(In thousands) Shares Par Value
Balance as of December 31, 2012 86,110 $ 172 $ 165,162 $ 436,466 $ (29,515) $ 572,285Issuance of common stock under stock plans 2,440 2 27,790 — — 27,792Repurchase of common stock (1,719) — — (47,908) — (47,908)Stock-based compensation expense — — 10,620 — — 10,620Excess tax benefit from stock option exercises — — 7,658 — — 7,658Tax benefit for research and development credits as a result of stockoptions — — 210 — — 210Net income — — — 73,573 — 73,573Net unrealized gain on cash flow hedges net of tax of $13 — — — — 104 104Net unrealized loss on available-for-sale investments, net of tax of $147 — — — — (190) (190)Reclassification of net realized gain on the sale of available-for-saleinvestments — — — — (314) (314)Foreign currency translation adjustment, net of tax of $22 — — — — 82 82
Balance as of December 31, 2013 86,831 $ 174 $ 211,440 $ 462,131 $ (29,833) $ 643,912Issuance of common stock under stock plans 1,245 2 16,928 — — 16,930Repurchase of common stock (1,534) (3) — (59,670) — (59,673)Stock-based compensation expense — — 15,158 — — 15,158Excess tax benefit from stock option exercises — — 7,871 — — 7,871Tax benefit for research and development credits as a result of stockoptions — — 320 — — 320Net income — — — 121,485 — 121,485Net unrealized loss on cash flow hedges net of tax of $0 — — — — (118) (118)Reclassification of net realized loss on cash flow hedges — — — — 46 46Net unrealized gain on available-for-sale investments, net of tax of $40 — — — — 579 579Reclassification of net realized gain on the sale of available-for-saleinvestments — — — — (673) (673)Foreign currency translation adjustment, net of tax of $870 — — — — (9,400) (9,400)
Balance as of December 31, 2014 86,542 $ 173 $ 251,717 $ 523,946 $ (39,399) $ 736,437Issuance of common stock under stock plans 1,520 3 27,579 — — 27,582Repurchase of common stock (3,206) (6) — (126,345) — (126,351)Stock-based compensation expense — — 21,274 — — 21,274Excess tax benefit from stock option exercises — — 9,964 — — 9,964Tax benefit for research and development credits as a result of stockoptions — — 474 — — 474Payment of dividends — — — (18,062) — (18,062)Net income — — — 187,074 — 187,074Net unrealized loss on cash flow hedges, net of tax of $22 — — — — (27) (27)Reclassification of net realized loss on cash flow hedges — — — — 201 201Net unrealized loss on available-for-sale investments, net of tax of $279 — — — — (939) (939)Reclassification of net realized gain on the sale of available-for-saleinvestments — — — — (344) (344)Foreign currency translation adjustment, net of tax of $711 — — — — (11,616) (11,616)
Balance as of December 31, 2015 84,856 $ 170 $ 311,008 $ 566,613 $ (52,124) $ 825,667
The accompanying notes are an integral part of these consolidated financial statements.
38

Table of Contents
COGNEX CORPORATION - NOTES TO CONSOLIDATED FINANCIAL STATEMENTS
NOTE 1: Summary of Significant Accounting PoliciesThe accompanying consolidated financial statements reflect the application of the significant accounting policies described below.
Nature of Operations
Cognex Corporation is a leading provider of machine vision products that capture and analyze visual information in order to automate tasks,primarily in manufacturing processes, where vision is required.
Use of Estimates in the Preparation of Financial Statements
The preparation of financial statements in conformity with accounting principles generally accepted in the United States of America (U.S. GAAP)requires management to make estimates and judgments that affect the reported amounts of assets and liabilities and the disclosure of contingentliabilities as of the balance sheet date, and the reported amounts of revenues and expenses during the year. Actual results could differ from thoseestimates. Significant estimates and judgments include those related to revenue recognition, investments, accounts receivable, inventories, long-lived assets, goodwill, warranty obligations, contingencies, stock-based compensation, income taxes and derivative instruments.
Basis of Consolidation
The consolidated financial statements include the accounts of Cognex Corporation and its subsidiaries, all of which are wholly-owned. Allintercompany accounts and transactions have been eliminated.
Foreign Currency TranslationThe financial statements of the Company’s foreign subsidiaries, where the local currency is the functional currency, are translated using exchangerates in effect at the end of the year for assets and liabilities and average exchange rates during the year for results of operations. The resultingforeign currency translation adjustment, net of tax, is recorded in shareholders’ equity as other comprehensive income (loss).
Fair Value MeasurementsThe Company applies a three-level valuation hierarchy for fair value measurements. The categorization of assets and liabilities within the valuationhierarchy is based upon the lowest level of input that is significant to the measurement of fair value. Level 1 inputs to the valuation methodologyutilize unadjusted quoted market prices in active markets for identical assets and liabilities. Level 2 inputs to the valuation methodology are otherobservable inputs, including quoted market prices for similar assets and liabilities, quoted prices for identical and similar assets and liabilities inmarkets that are not active, or other inputs that are observable or can be corroborated by observable market data. Level 3 inputs to the valuationmethodology are unobservable inputs based upon management’s best estimate of the inputs that market participants would use in pricing the assetor liability at the measurement date, including assumptions about risk. A change to the level of an asset or liability within the fair value hierarchy isdetermined at the end of a reporting period.
Cash, Cash Equivalents, and InvestmentsMoney market instruments purchased with original maturities of three months or less are classified as cash equivalents and are stated at amortizedcost. Debt securities with original maturities greater than three months and remaining maturities of one year or less are classified as short-terminvestments, as well as equity securities that the Company intends to sell within one year. Debt securities with remaining maturities greater than oneyear, as well as a limited partnership interest, are classified as long-term investments. It is the Company’s policy to invest in debt securities witheffective maturities that do not exceed ten years.Debt securities with original maturities greater than three months are designated as available-for-sale and are reported at fair value, with unrealizedgains and losses, net of tax, recorded in shareholders’ equity as other comprehensive income (loss). Equity securities that are held for short periodsof time with the intention of selling them in the near term are designated as trading and are reported at fair value, with unrealized gains and lossesrecorded in current operations. Realized gains and losses are included in current operations, along with the amortization of the discount or premiumon debt securities arising at acquisition, and are calculated using the specific identification method. The Company’s limited partnership interest isaccounted for using the cost method because the Company’s investment is less than 5% of the partnership and the Company has no influence overthe partnership’s operating and financial policies.
39

Table of Contents
COGNEX CORPORATION - NOTES TO CONSOLIDATED FINANCIAL STATEMENTS
Management monitors the carrying value of its investments in debt securities and a limited partnership interest compared to their fair value todetermine whether an other-than-temporary impairment has occurred. If the fair value of a debt security is less than its amortized cost, the Companyassesses whether the impairment is other-than-temporary. In considering whether a decline in fair value is other-than-temporary, we consider manyfactors. In its evaluation of its debt securities, management considers the type of security, the credit rating of the security, the length of time thesecurity has been in a loss position, the size of the loss position, our intent and ability to hold the security to expected recovery of value, and othermeaningful information. An impairment is considered other-than-temporary if (i) the Company has the intent to sell the security, (ii) it is more likelythan not that the Company will be required to sell the security before recovery of the entire amortized cost basis, or (iii) the Company does notexpect to recover the entire amortized cost basis of the security. If impairment is considered other-than-temporary based upon condition (i) or(ii) described above, the entire difference between the amortized cost and the fair value of the security is recognized in current operations. If animpairment is considered other-than-temporary based upon condition (iii), the amount representing credit losses (defined as the difference betweenthe present value of the cash flows expected to be collected and the amortized cost basis of the security) is recognized in current operations and theamount relating to all other factors is recognized in shareholders' equity as other comprehensive income (loss). In its evaluation of its limitedpartnership interest, management considers the duration and extent of the decline, the length of the Company’s commitment to the investment,general economic trends, and specific communications with the General Partner.
Accounts ReceivableThe Company extends credit with various payment terms to customers based upon an evaluation of their financial condition. Accounts that areoutstanding longer than the payment terms are considered to be past due. The Company establishes reserves against accounts receivable forpotential credit losses and records bad debt expense in current operations when it determines receivables are at risk for collection based upon thelength of time the receivable has been outstanding, the customer’s current ability to pay its obligations to the Company, general economic andindustry conditions, as well as various other factors. Receivables are written off against these reserves in the period they are determined to beuncollectible and payments subsequently received on previously written-off receivables are recorded as a reversal of the bad debt expense.
InventoriesInventories are stated at the lower of cost or market. Cost is determined using standard costs, which approximates actual costs under the first-in,first-out (FIFO) method. The Company’s inventory is subject to rapid technological change or obsolescence. The Company reviews inventoryquantities on hand and estimates excess and obsolescence exposures based upon assumptions about future demand, product transitions, andmarket conditions, and records reserves to reduce the carrying value of inventories to their net realizable value. If actual future demand is less thanestimated, additional inventory write-downs would be required.
The Company generally disposes of obsolete inventory upon determination of obsolescence. The Company does not dispose of excess inventoryimmediately, due to the possibility that some of this inventory could be sold to customers as a result of differences between actual and forecasteddemand. When inventory has been written down below cost, such reduced amount is considered the new cost basis for subsequent accountingpurposes. As a result, the Company would recognize a higher than normal gross margin if the reserved inventory were subsequently sold.
Property, Plant, and EquipmentProperty, plant, and equipment are stated at cost and depreciated using the straight-line method over the assets’ estimated useful lives. Buildings’useful lives are 39 years, building improvements’ useful lives are ten years, and the useful lives of computer hardware and software, manufacturingtest equipment, and furniture and fixtures range from two to five years. Leasehold improvements are depreciated over the shorter of the estimateduseful lives or the remaining terms of the leases. Maintenance and repairs are expensed when incurred; additions and improvements arecapitalized. Upon retirement or disposition, the cost and related accumulated depreciation of the disposed assets are removed from the accounts,with any resulting gain or loss included in current operations.
40
Table of Contents
COGNEX CORPORATION - NOTES TO CONSOLIDATED FINANCIAL STATEMENTS
GoodwillGoodwill is stated at cost. The Company evaluates the possible impairment of goodwill annually each fourth quarter and whenever events orcircumstances indicate the carrying value of the goodwill may not be recoverable. For the past five years, the Company has performed a qualitativeassessment of goodwill (commonly known as “step zero”) to determine whether further impairment testing is necessary. Factors that managementconsiders in this assessment include macroeconomic conditions, industry and market considerations, overall financial performance (both currentand projected), changes in management or strategy, and changes in the composition or carrying amount of net assets. In addition, managementtakes into consideration the goodwill valuation under the last quantitative analysis that was performed. If this qualitative assessment indicates that itis more likely than not that the fair value of a reporting unit is less than its carrying amount, the entity would proceed to a two-step process. Step onecompares the fair value of the reporting unit with its carrying value, including goodwill. If the carrying amount exceeds the fair value of the reportingunit, step two is required to measure the amount of impairment loss. Step two compares the implied fair value of the reporting unit goodwill to thecarrying amount of the goodwill.
Intangible AssetsIntangible assets are stated at cost and amortized over the assets’ estimated useful lives. Intangible assets are either amortized in relation to therelative cash flows anticipated from the intangible asset or using the straight-line method, depending upon facts and circumstances. The useful livesof distribution networks range from eleven to twelve years, of customer contracts and relationships from five to twelve years, and of completedtechnologies and other intangible assets from three to eight years. The Company evaluates the possible impairment of long-lived assets, includingintangible assets, whenever events or circumstances indicate the carrying value of the assets may not be recoverable. At the occurrence of a certainevent or change in circumstances, the Company evaluates the potential impairment of an asset by estimating the future undiscounted cash flowsexpected to result from the use and eventual disposition of the asset. If the sum of the estimated future cash flows is less than the carrying value,the Company determines the amount of such impairment by comparing the fair value of the asset to its carrying value. The fair value is based uponthe present value of the estimated future cash flows using a discount rate commensurate with the risks involved.
Warranty ObligationsThe Company warrants its products to be free from defects in material and workmanship for periods primarily ranging from one to three years fromthe time of sale based upon the product being purchased and the terms of the customer arrangement. Warranty obligations are evaluated andrecorded at the time of sale since it is probable that customers will make claims under warranties related to products that have been sold and theamount of these claims can be reasonably estimated based upon historical costs to fulfill claims. Obligations may also be recorded subsequent tothe time of sale whenever specific events or circumstances impacting product quality become known that would not have been taken into accountusing historical data.
ContingenciesLoss contingencies are accrued if the loss is probable and the amount of the loss can be reasonably estimated. Legal costs associated withpotential loss contingencies, such as patent infringement matters, are expensed as incurred.
Revenue RecognitionThe Company’s product revenue is derived from the sale of machine vision systems, which can take the form of hardware with embedded softwareor software-only, and related accessories. The Company also generates revenue by providing maintenance and support, consulting, and trainingservices to its customers. Certain of the Company’s arrangements include multiple deliverables that provide the customer with a combination ofproducts or services. In order to recognize revenue, the Company requires that a signed customer contract or purchase order is received, the feefrom the arrangement is fixed or determinable, and collection of the resulting receivable is probable. Assuming that these criteria have been met,product revenue is generally recognized upon delivery, revenue from maintenance and support programs is recognized ratably over the programperiod, and revenue from consulting and training services is recognized when the services have been provided. When customer-specifiedacceptance criteria exists that are substantive, product revenue is deferred until these criteria have been met, along with the associated incrementaldirect costs.
The majority of the Company’s product offerings consist of hardware with embedded software. Under the revenue recognition rules for tangibleproducts, the fee from a multiple-deliverable arrangement is allocated to each of the deliverables based upon their relative selling prices asdetermined by a selling-price hierarchy. A deliverable in an
41

Table of Contents
COGNEX CORPORATION - NOTES TO CONSOLIDATED FINANCIAL STATEMENTS
arrangement qualifies as a separate unit of accounting if the delivered item has value to the customer on a stand-alone basis. A delivered item thatdoes not qualify as a separate unit of accounting is combined with the other undelivered items in the arrangement and revenue is recognized forthose combined deliverables as a single unit of accounting. The selling price used for each deliverable is based upon vendor-specific objectiveevidence (VSOE) if available, third-party evidence (TPE) if VSOE is not available, and management’s best estimate of selling price (BESP) if neitherVSOE nor TPE are available. VSOE is the price charged for a deliverable when it is sold separately. TPE is the price of the Company’s or anycompetitor’s largely interchangeable products or services in stand-alone sales to similarly-situated customers. BESP is the price at which theCompany would sell the deliverable if it were sold regularly on a stand-alone basis, considering market conditions and entity-specific factors.The selling prices used in the relative selling price allocation method for (1) certain of the Company’s services are based upon VSOE, (2) third-partyaccessories available from other vendors are based upon TPE, and (3) hardware products with embedded software, custom accessories, andservices for which VSOE does not exist are based upon BESP. The Company does not believe TPE exists for these products and services becausethey are differentiated from competing products and services in terms of functionality and performance and there are no competing products orservices that are largely interchangeable. BESP has been established for each product line within each region. Management establishes BESP withconsideration for market conditions, such as the impact of competition and geographic considerations, and entity-specific factors, such as pricingpractices, gross margin objectives, customer size, and market share goals. Management believes that BESP is reflective of reasonable pricing ofthat deliverable as if priced on a stand-alone basis.Under the revenue recognition rules for software-only products, the fee from a multiple-deliverable arrangement is allocated to each of theundelivered elements based upon VSOE, which is limited to the price charged when the same deliverable is sold separately, with the residual valuefrom the arrangement allocated to the delivered element. The portion of the fee that is allocated to each deliverable is then recognized as revenuewhen the criteria for revenue recognition are met with respect to that deliverable. If VSOE does not exist for all of the undelivered elements, then allrevenue from the arrangement is typically deferred until all elements have been delivered to the customer.The Company’s products are sold directly to end users, as well as to resellers including original equipment manufacturers (OEMs), distributors, andintegrators. Revenue is recognized upon delivery of the product to the reseller, assuming all other revenue recognition criteria have been met. TheCompany establishes reserves against revenue for potential product returns, since the amount of future returns can be reasonably estimated basedupon experience. These reserves have historically been immaterial.Amounts billed to customers related to shipping and handling, as well as reimbursements received from customers for out-of-pocket expenses, areclassified as revenue, with the associated costs included in cost of revenue.
Research and DevelopmentResearch and development costs for internally-developed or acquired products are expensed when incurred until technological feasibility has beenestablished for the product. Thereafter, all software costs may be capitalized until the product is available for general release to customers. TheCompany determines technological feasibility at the time the product reaches beta in its stage of development. Historically, the time incurredbetween beta and general release to customers has been short, and therefore, the costs have been insignificant.
Advertising CostsAdvertising costs are expensed as incurred and totaled $2,009,000 in 2015 , $2,609,000 in 2014 , and $2,219,000 in 2013 .
Stock-Based CompensationThe Company’s share-based payments that result in compensation expense consist of stock option grants and restricted stock awards. TheCompany has reserved a specific number of shares of its authorized but unissued shares for issuance upon the exercise of stock options or thegranting of restricted stock. When a stock option is exercised or a restricted stock award is granted, the Company issues new shares from this pool.The fair values of stock options are estimated on the grant date using a binomial lattice model. Management is responsible for determining theappropriate valuation model and estimating these fair values, and in doing so, considers a number of factors, including information provided by anoutside valuation advisor.
The Company recognizes compensation expense related to stock options using the graded attribution method, in which expense is recognized on astraight-line basis over the service period for each separately vesting portion of the stock
42

Table of Contents
COGNEX CORPORATION - NOTES TO CONSOLIDATED FINANCIAL STATEMENTS
option as if the option was, in substance, multiple awards. The amount of compensation expense recognized at the end of the vesting period isbased upon the number of stock options for which the requisite service has been completed. No compensation expense is recognized for optionsthat are forfeited for which the employee does not render the requisite service. The term “forfeitures” is distinct from “expirations” and representsonly the unvested portion of the surrendered option. The Company applies estimated forfeiture rates to its unvested options to arrive at the amountof compensation expense that is expected to be recognized over the requisite service period. At the end of each separately vesting portion of anoption, the expense that was recognized by applying the estimated forfeiture rate is compared to the expense that should be recognized based uponthe employee’s service, and a credit to expense is recorded related to those employees that have not rendered the requisite service.
TaxesThe Company recognizes a tax position in its financial statements when that tax position, based solely upon its technical merits, is more likely thannot to be sustained upon examination by the relevant taxing authority. Those tax positions failing to qualify for initial recognition are recognized inthe first interim period in which they meet the more likely than not standard, or are resolved through negotiation or litigation with the taxing authority,or upon expiration of the statutes of limitations. Derecognition of a tax position that was previously recognized occurs when an entity subsequentlydetermines that a tax position no longer meets the more likely than not threshold of being sustained.Only the portion of the liability that is expected to be paid within one year is classified as a current liability. As a result, liabilities expected to beresolved without the payment of cash (e.g., resolution due to the expiration of the statutes of limitations) or are not expected to be paid within oneyear are not classified as current. It is the Company’s policy to record estimated interest and penalties as income tax expense and tax credits as areduction in income tax expense.Deferred tax assets and liabilities are determined based upon the differences between the financial statement and tax bases of assets and liabilitiesas measured by the enacted tax rates that will be in effect when these differences reverse. Valuation allowances are provided if, based upon theweight of available evidence, it is more likely than not that some or all of the deferred tax assets will not be realized.Sales tax in the United States and similar taxes in other jurisdictions that are collected from customers and remitted to government authorities arepresented on a gross basis (i.e., a receivable from the customer with a corresponding payable to the government). Amounts collected fromcustomers and retained by the Company during tax holidays are recognized as non-operating income when earned.
Net Income Per ShareBasic net income per share is computed by dividing net income available to common shareholders by the weighted-average number of commonshares outstanding for the period. Diluted net income per share is computed by dividing net income available to common shareholders by theweighted-average number of common shares outstanding for the period plus potential dilutive common shares. Dilutive common equivalent sharesconsist of stock options and are calculated using the treasury stock method. Common equivalent shares do not qualify as participating securities. Inperiods where the Company records a net loss, potential common stock equivalents are not included in the calculation of diluted net loss per share.
Comprehensive IncomeComprehensive income is defined as the change in equity of a company during a period from transactions and other events and circumstances,excluding transactions resulting from investments by owners and distributions to owners. Accumulated other comprehensive loss, net of tax, as ofDecember 31, 2015 and December 31, 2014 , consists of foreign currency translation adjustments of $49,646,000 and $38,030,000 , respectively;net unrealized losses on available-for-sale investments of $1,413,000 and $130,000 , respectively; net unrealized gains on derivative instruments of$ 206,000 and $ 32,000 , respectively; and losses on currency swaps, net of gains on long-term intercompany loans, of $1,271,000 and $ 1,271,000, respectively.Amounts reclassified from accumulated other comprehensive income to investment income on the Consolidated Statements of Operations were netrealized gains of $344,000 , $673,000 , and $314,000 for 2015 , 2014 , and 2013 , respectively.
43

Table of Contents
COGNEX CORPORATION - NOTES TO CONSOLIDATED FINANCIAL STATEMENTS
Concentrations of RiskFinancial instruments that potentially subject the Company to concentrations of credit risk consist primarily of cash, cash equivalents, investments,and trade receivables. The Company has certain domestic and foreign cash balances that exceed the insured limits set by the Federal DepositInsurance Corporation (FDIC) in the United States and equivalent regulatory agencies in foreign countries. The Company primarily invests ininvestment-grade debt securities and has established guidelines relative to credit ratings, diversification, and maturities of its debt securities thatmaintain safety and liquidity. The Company has not experienced any significant realized losses on its debt securities.
The Company performs ongoing credit evaluations of its customers and maintains allowances for potential credit losses. The Company has notexperienced any significant losses related to the collection of its accounts receivable.
A significant portion of the Company's product is manufactured by a third-party contractor located in Indonesia. This contractor has agreed toprovide Cognex with termination notification periods and last-time-buy rights, if and when that may be applicable. We rely upon this contractor toprovide quality product and meet delivery schedules. We engage in extensive product quality programs and processes, including actively monitoringthe performance of our third-party manufacturers; however, we may not detect all product quality issues through these programs and processes.
Certain components are presently sourced from a single vendor that is selected based on price and performance considerations. In the event of asupply disruption from a single-source vendor, these components may be purchased from an alternative vendor, which may result in manufacturingdelays based on the lead time of the new vendor. Certain key electronic and mechanical components that are purchased from strategic suppliers,such as processors or imagers, are fundamental to the design of Cognex products. A disruption in the supply of these key components, such as alast-time-buy announcement, natural disaster, financial bankruptcy, or other event, may require us to purchase a significant amount of inventory atunfavorable prices resulting in lower gross margins and higher risk of carrying excess inventory. If we are unable to secure adequate supply fromalternative sources, we may have to redesign our products, which may lead to a delay in manufacturing and a possible loss of sales.
Derivative InstrumentsDerivative instruments are recorded on the Consolidated Balance Sheets at fair value. Changes in the fair value of derivatives are recorded eachperiod in current operations or in shareholders' equity as other comprehensive income (loss), depending upon whether the derivative is designatedas a hedge transaction and, if it is, the effectiveness of the hedge. At the inception of the contract, the Company designates foreign currency forwardexchange contracts as either a cash flow hedge of certain forecasted foreign currency denominated sales and purchase transactions or as aneconomic hedge. Changes in the fair value of a derivative that is highly effective and that is designated and qualifies as a cash flow hedge arerecorded in shareholders' equity as other comprehensive income (loss), and reclassified into current operations in the same period during which thehedged transaction affects current operations and in the same financial statement line item as that of the forecasted transaction. Cash flow hedgesare evaluated for effectiveness quarterly. Any hedge ineffectiveness (which represents the amount by which the changes in the fair value of thederivative exceed the variability in the cash flows of the forecasted transaction) is recorded in current operations in the period in whichineffectiveness is determined. Changes in the fair value of the Company’s economic hedges (not designated as a cash flow hedge) are reported incurrent operations. The cash flows from derivative instruments are presented in the same category on the Consolidated Statements of Cash Flowsas the category for the cash flows from the hedged item. Generally, this accounting policy election results in cash flows related to derivativeinstruments being classified as an operating activity on the Consolidated Statements of Cash Flows.
The Company formally documents all relationships between hedging instruments and hedged items, as well as its risk-management objective andstrategy for undertaking various hedge transactions. This process includes linking all derivatives that are designated as cash flow hedges to specificforecasted transactions. The Company also formally assesses (both at the hedge’s inception and on an ongoing basis) whether the derivatives thatare used in hedging transactions have been highly effective in offsetting changes in the fair value or cash flows of hedged items and whether thosederivatives may be expected to remain highly effective in future periods. When it is determined that a derivative is not (or has ceased to be) highlyeffective as a hedge, the Company discontinues hedge accounting prospectively, as discussed below.The Company discontinues hedge accounting prospectively when (1) it determines that the derivative is no longer effective in offsetting changes inthe cash flows of a hedged item; (2) the derivative expires or is sold, terminated, or exercised; (3) it is no longer probable that the forecastedtransaction will occur; or (4) management determines that designating the derivative as a hedging instrument is no longer appropriate or desired.When the Company discontinues
44

Table of Contents
COGNEX CORPORATION - NOTES TO CONSOLIDATED FINANCIAL STATEMENTS
hedge accounting because it is no longer probable that the forecasted transaction will occur in the originally expected period, the gain or loss on thederivative remains in accumulated other comprehensive income (loss) and is reclassified into current operations when the forecasted transactionaffects current operations. However, if it is probable that a forecasted transaction will not occur by the end of the originally specified time period orwithin an additional two-month period of time thereafter, the gain or loss that was accumulated in other comprehensive income (loss) is recognizedimmediately in current operations. In all situations in which hedge accounting is discontinued and the derivative remains outstanding, the Companycarries the derivative at fair value on the Consolidated Balance Sheets, recognizing changes in the fair value in current operations, unless it isdesignated in a new hedging relationship.The Company recognizes all derivative instruments as either current assets or current liabilities at fair value on the Consolidated Balance Sheets.When the Company is engaged in more than one outstanding derivative contract with the same counterparty and also has a legally enforceablemaster netting agreement with that counterparty, the “net” mark-to-market exposure represents the netting of the positive and negative exposureswith that counterparty. Accordingly, cash flow hedges are presented net on the Consolidated Balance Sheets.
NOTE 2: New PronouncementsAccounting Standards Update (ASU) 2014-09, “Revenue from Contracts with Customers”
The amendments in ASU 2014-09 will supersede and replace all currently existing U.S. GAAP, including industry-specific revenue recognitionguidance, with a single, principle-based revenue recognition framework. The concept guiding this new model is that revenue recognition will depicttransfer of control to the customer in an amount that reflects consideration to which an entity expects to be entitled. The core principles supportingthis framework include (1) identifying the contract with a customer, (2) identifying separate performance obligations within the contract, (3)determining the transaction price, (4) allocating the transaction price to the performance obligations, and (5) recognizing revenue. This newframework will require entities to apply significantly more judgment. This increase in management judgment will require expanded disclosure onestimation methods, inputs, and assumptions for revenue recognition. The Transition Resource Group (TRG) is evaluating the impact of this ASUand will release implementation guidance in future periods. ASU 2015-14, "Deferral of the effective date" amended the effective date of ASU 2014-09 for public companies to annual reporting periods beginning after December 15, 2017. Early adoption is permitted, but only beginning afterDecember 15, 2016. Management will continue to evaluate the impact of this standard as it evolves.
Accounting Standards Update (ASU) 2015-05, "Customer's Accounting for Fees Paid in a Cloud Computing Arrangement"
ASU 2015-05 provides guidance to customers about whether a cloud computing arrangement includes a software license. If a cloud computingarrangement includes a software license, then the customer should account for the software license element of the arrangement consistent with theacquisition of other software licenses. If a cloud computing arrangement does not include a software license, then the customer should account forthe arrangement as a service contract. For public companies, the guidance in ASU 2015-05 is effective for annual periods beginning after December15, 2015, and interim periods within those annual periods. Early adoption is permitted. Management does not expect ASU 2015-05 to have amaterial impact on the Company's financial statements and disclosures.
Accounting Standards Update (ASU) 2015-11, "Inventory - Simplifying the Measurement of Inventory"
ASU 2015-11 requires companies to measure most inventory at the lower of cost and net realizable value, thereby simplifying the current guidanceunder which a company must measure inventory at the lower of cost or market. This ASU eliminates the need to determine replacement cost andevaluate whether said cost is within a quantitative range. This ASU also further aligns U.S. GAAP and international accounting standards. For publiccompanies, the guidance in ASU 2015-11 is effective for annual periods beginning after December 15, 2016, and interim periods within those annualperiods. Early adoption is permitted. Management does not expect ASU 2015-11 to have a material impact on the Company's financial statementsand disclosures.
Accounting Standards Update (ASU) 2015-16, "Business Combinations - Simplifying the Accounting for Measurement-Period Adjustments"
ASU 2015-16 simplifies the requirements to retrospectively account for adjustments made to provisional amounts recognized in a businesscombination. This ASU applies to all entities that have reported provisional amounts for items in a business combination for which the accounting isincomplete by the end of the reporting period in which the combination occurs and that have recognized an adjustment to provisional amountsduring the measurement period. For public companies, the guidance in ASU 2015-16 is effective for annual periods beginning after December 15,2015, and interim periods within those annual periods. This ASU should be applied prospectively to adjustments to provisional
45

Table of Contents
COGNEX CORPORATION - NOTES TO CONSOLIDATED FINANCIAL STATEMENTS
amounts that occur after the effective date. Management does not expect ASU 2015-16 to have a material impact on the Company's financialstatements and disclosures.
Accounting Standard Update (ASU) 2015-17, "Income Taxes - Balance Sheet Classification of Deferred Taxes”
ASU 2015-17 simplifies the presentation of deferred income taxes to require that deferred tax assets and liabilities be classified as non-current in aclassified balance sheet. Current U.S. GAAP requires an entity to separate deferred income tax assets and liabilities into current and non-currentamounts in a classified balance sheet. The current requirement that deferred tax assets and liabilities of a tax-paying component of an entity beoffset and presented as a single amount is not affected by the amendments of this Update. For public companies, the guidance in ASC 2015-17 iseffective for annual periods beginning after December 15, 2016, and interim periods within those annual periods. Earlier adoption is permitted.Management will comply with the presentation and disclosure requirements of ASU-2017 for the year ended December 31, 2016.
NOTE 3: Fair Value MeasurementsFinancial Assets and Liabilities that are Measured at Fair Value on a Recurring BasisThe following table summarizes the financial assets and liabilities measured at fair value on a recurring basis as of December 31, 2015 (inthousands):
Quoted Prices inActive Markets
for IdenticalAssets (Level 1)
Significant OtherObservable
Inputs (Level 2)Unobservable Inputs (Level
3)Assets:
Money market instruments $ 6,024 $ — $ —Corporate bonds — 230,951 —Treasury bills — 153,797 —Asset-backed securities — 86,576 —Euro liquidity fund — 47,730 —Sovereign bonds — 34,943 —Agency bonds — 9,158 —Municipal bonds — 5,459 —Cash flow hedge forward contracts — 441 —Economic hedge forward contracts — 9 —
Liabilities: Cash flow hedge forward contracts — (201) —Economic hedge forward contracts — (43) —Contingent consideration liability (Note 20) — — (3,000)
The Company’s money market instruments are reported at fair value based upon the daily market price for identical assets in active markets, andare therefore classified as Level 1.
The Company’s debt securities and forward contracts are reported at fair value based upon model-driven valuations in which all significant inputsare observable or can be derived from or corroborated by observable market data for substantially the full term of the asset or liability, and aretherefore classified as Level 2. Management is responsible for estimating the fair value of these financial assets and liabilities, and in doing so,considers valuations provided by a large, third-party pricing service. For debt securities, this service maintains regular contact with market makers,brokers, dealers, and analysts to gather information on market movement, direction, trends, and other specific data. They use this information tostructure yield curves for various types of debt securities and arrive at the daily valuations. The Company's forward contracts are typically traded orexecuted in over-the-counter markets with a high degree of pricing transparency. The market participants are generally large commercial banks.
The Company's contingent consideration liability is reported at fair value based upon probability-adjusted present values of the considerationexpected to be transferred using significant inputs that are not observable in the market, and are therefore classified as Level 3. Key assumptionsused in these estimates include probability assessments with respect to the likelihood of achieving the revenue milestones and discount ratesconsistent with the level of risk of achievement.
46
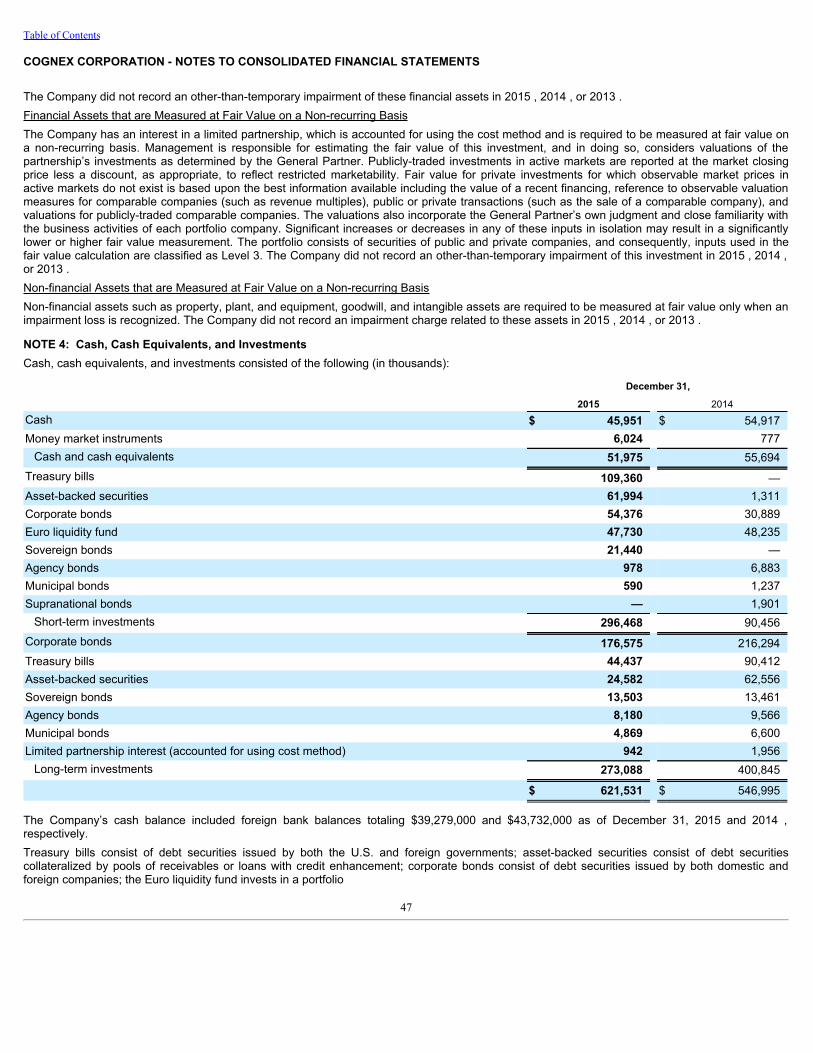
Table of Contents
COGNEX CORPORATION - NOTES TO CONSOLIDATED FINANCIAL STATEMENTS
The Company did not record an other-than-temporary impairment of these financial assets in 2015 , 2014 , or 2013 .Financial Assets that are Measured at Fair Value on a Non-recurring BasisThe Company has an interest in a limited partnership, which is accounted for using the cost method and is required to be measured at fair value ona non-recurring basis. Management is responsible for estimating the fair value of this investment, and in doing so, considers valuations of thepartnership’s investments as determined by the General Partner. Publicly-traded investments in active markets are reported at the market closingprice less a discount, as appropriate, to reflect restricted marketability. Fair value for private investments for which observable market prices inactive markets do not exist is based upon the best information available including the value of a recent financing, reference to observable valuationmeasures for comparable companies (such as revenue multiples), public or private transactions (such as the sale of a comparable company), andvaluations for publicly-traded comparable companies. The valuations also incorporate the General Partner’s own judgment and close familiarity withthe business activities of each portfolio company. Significant increases or decreases in any of these inputs in isolation may result in a significantlylower or higher fair value measurement. The portfolio consists of securities of public and private companies, and consequently, inputs used in thefair value calculation are classified as Level 3. The Company did not record an other-than-temporary impairment of this investment in 2015 , 2014 ,or 2013 .Non-financial Assets that are Measured at Fair Value on a Non-recurring BasisNon-financial assets such as property, plant, and equipment, goodwill, and intangible assets are required to be measured at fair value only when animpairment loss is recognized. The Company did not record an impairment charge related to these assets in 2015 , 2014 , or 2013 .
NOTE 4: Cash, Cash Equivalents, and InvestmentsCash, cash equivalents, and investments consisted of the following (in thousands):
December 31,
2015 2014Cash $ 45,951 $ 54,917Money market instruments 6,024 777
Cash and cash equivalents 51,975 55,694Treasury bills 109,360 —Asset-backed securities 61,994 1,311Corporate bonds 54,376 30,889Euro liquidity fund 47,730 48,235Sovereign bonds 21,440 —Agency bonds 978 6,883Municipal bonds 590 1,237Supranational bonds — 1,901
Short-term investments 296,468 90,456Corporate bonds 176,575 216,294Treasury bills 44,437 90,412Asset-backed securities 24,582 62,556Sovereign bonds 13,503 13,461Agency bonds 8,180 9,566Municipal bonds 4,869 6,600Limited partnership interest (accounted for using cost method) 942 1,956
Long-term investments 273,088 400,845
$ 621,531 $ 546,995
The Company’s cash balance included foreign bank balances totaling $39,279,000 and $43,732,000 as of December 31, 2015 and 2014 ,respectively.Treasury bills consist of debt securities issued by both the U.S. and foreign governments; asset-backed securities consist of debt securitiescollateralized by pools of receivables or loans with credit enhancement; corporate bonds consist of debt securities issued by both domestic andforeign companies; the Euro liquidity fund invests in a portfolio
47
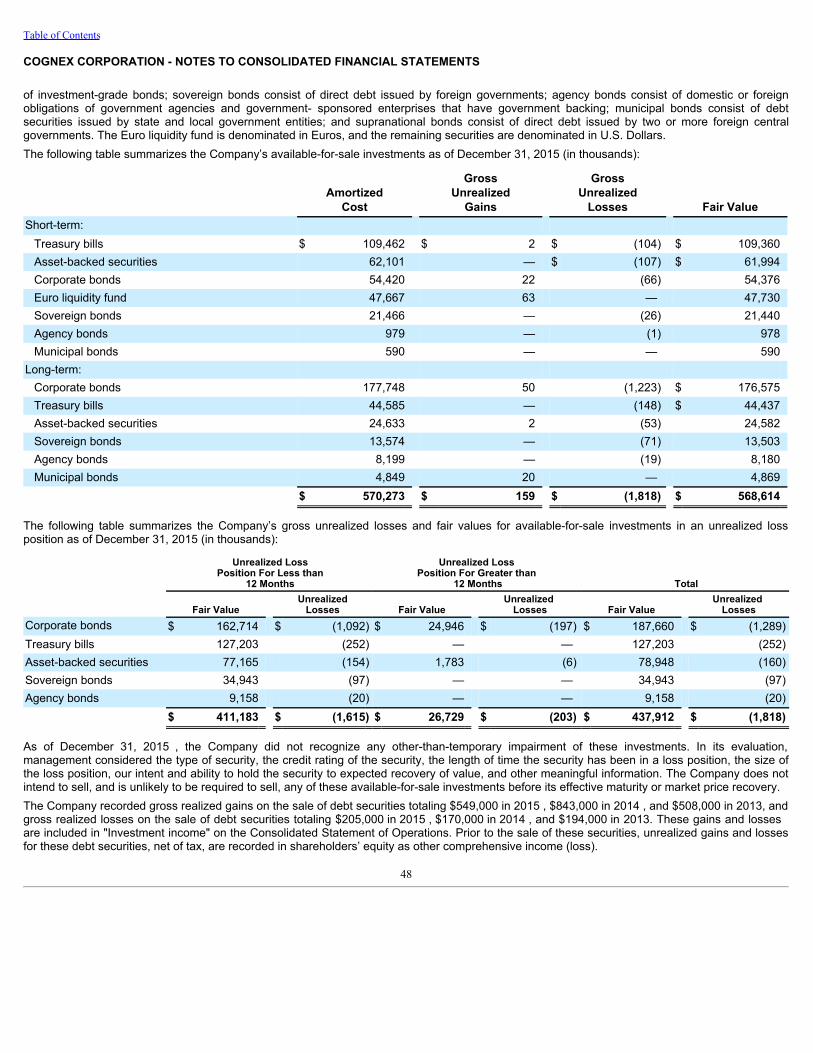
Table of Contents
COGNEX CORPORATION - NOTES TO CONSOLIDATED FINANCIAL STATEMENTS
of investment-grade bonds; sovereign bonds consist of direct debt issued by foreign governments; agency bonds consist of domestic or foreignobligations of government agencies and government- sponsored enterprises that have government backing; municipal bonds consist of debtsecurities issued by state and local government entities; and supranational bonds consist of direct debt issued by two or more foreign centralgovernments. The Euro liquidity fund is denominated in Euros, and the remaining securities are denominated in U.S. Dollars.The following table summarizes the Company’s available-for-sale investments as of December 31, 2015 (in thousands):
Amortized
Cost
GrossUnrealized
Gains
GrossUnrealized
Losses Fair ValueShort-term:
Treasury bills $ 109,462 $ 2 $ (104) $ 109,360Asset-backed securities 62,101 — $ (107) $ 61,994Corporate bonds 54,420 22 (66) 54,376Euro liquidity fund 47,667 63 — 47,730Sovereign bonds 21,466 — (26) 21,440Agency bonds 979 — (1) 978Municipal bonds 590 — — 590
Long-term: Corporate bonds 177,748 50 (1,223) $ 176,575Treasury bills 44,585 — (148) $ 44,437Asset-backed securities 24,633 2 (53) 24,582Sovereign bonds 13,574 — (71) 13,503Agency bonds 8,199 — (19) 8,180Municipal bonds 4,849 20 — 4,869
$ 570,273 $ 159 $ (1,818) $ 568,614
The following table summarizes the Company’s gross unrealized losses and fair values for available-for-sale investments in an unrealized lossposition as of December 31, 2015 (in thousands):
Unrealized LossPosition For Less than
12 Months
Unrealized Loss Position For Greater than
12 Months Total
Fair Value Unrealized
Losses Fair Value Unrealized
Losses Fair Value Unrealized
LossesCorporate bonds $ 162,714 $ (1,092) $ 24,946 $ (197) $ 187,660 $ (1,289)Treasury bills 127,203 (252) — — 127,203 (252)Asset-backed securities 77,165 (154) 1,783 (6) 78,948 (160)Sovereign bonds 34,943 (97) — — 34,943 (97)Agency bonds 9,158 (20) — — 9,158 (20) $ 411,183 $ (1,615) $ 26,729 $ (203) $ 437,912 $ (1,818)
As of December 31, 2015 , the Company did not recognize any other-than-temporary impairment of these investments. In its evaluation,management considered the type of security, the credit rating of the security, the length of time the security has been in a loss position, the size ofthe loss position, our intent and ability to hold the security to expected recovery of value, and other meaningful information. The Company does notintend to sell, and is unlikely to be required to sell, any of these available-for-sale investments before its effective maturity or market price recovery.The Company recorded gross realized gains on the sale of debt securities totaling $549,000 in 2015 , $843,000 in 2014 , and $508,000 in 2013, andgross realized losses on the sale of debt securities totaling $205,000 in 2015 , $170,000 in 2014 , and $194,000 in 2013. These gains and lossesare included in "Investment income" on the Consolidated Statement of Operations. Prior to the sale of these securities, unrealized gains and lossesfor these debt securities, net of tax, are recorded in shareholders’ equity as other comprehensive income (loss).
48

Table of Contents
COGNEX CORPORATION - NOTES TO CONSOLIDATED FINANCIAL STATEMENTS
The following table presents the effective maturity dates of the Company’s available-for-sale investments as of December 31, 2015 (in thousands):
<1 Year 1-2 Years 2-3 Years 3-4 Years 4-5 Years 5-7 Years TotalCorporate bonds $ 54,376 $ 87,025 $ 74,069 $ 13,280 $ 2,201 $ — $ 230,951Treasury bills 109,360 19,489 24,948 — — — 153,797Asset-backed securities 61,994 2,491 14,443 3,294 3,960 394 86,576Euro liquidity fund 47,730 — — — — — 47,730Sovereign bonds 21,440 11,026 2,477 — — — 34,943Agency bonds 978 4,894 3,286 — — — 9,158Municipal bonds 590 4,869 — — — — 5,459 $ 296,468 $ 129,794 $ 119,223 $ 16,574 $ 6,161 $ 394 $ 568,614
The Company is a Limited Partner in Venrock Associates III, L.P. (Venrock), a venture capital fund. The Company has committed to a totalinvestment in the limited partnership of up to $20,500,000 . During the fourth quarter of 2015, an amendment to the partnership agreement extendedthe commitment period by two years to December 31, 2017. The Company does not have the right to withdraw from the partnership prior to thisdate. As of December 31, 2015 , the Company contributed $19,886,000 to the partnership. The remaining commitment of $614,000 can be called byVenrock at any time before December 31, 2017. Contributions and distributions are at the discretion of Venrock’s management. No contributionswere made in 2015. The Company received a cash distribution of $1,014,000 in 2015, which was accounted for as a return of capital. As ofDecember 31, 2015 , the carrying value of this investment was $942,000 compared to an estimated fair value of $5,600,000 .
NOTE 5: InventoriesInventories consisted of the following (in thousands):
December 31,
2015 2014Raw materials $ 27,301 $ 18,223Work-in-process 3,136 5,054Finished goods 6,897 5,946 $ 37,334 $ 29,223
NOTE 6: Property, Plant, and EquipmentProperty, plant, and equipment consisted of the following (in thousands):
December 31,
2015 2014Land $ 3,951 $ 3,951Buildings 23,439 23,815Building improvements 25,741 20,929Leasehold improvements 4,999 4,502Computer hardware and software 35,350 29,867Manufacturing test equipment 16,201 14,007Furniture and fixtures 4,401 3,680 114,082 100,751Less: accumulated depreciation (60,797) (54,788) $ 53,285 $ 45,963
The cost of property, plant, and equipment totaling $2,285,000 and $2,620,000 was removed from both the asset and accumulated depreciationbalances in 2015 and 2014 , respectively. Losses on these disposals were immaterial in both periods.Buildings include rental property with a cost basis of $5,750,000 as of December 31, 2015 and 2014 , and accumulated depreciation of $2,775,000and $2,627,000 as of December 31, 2015 and 2014 , respectively.
49
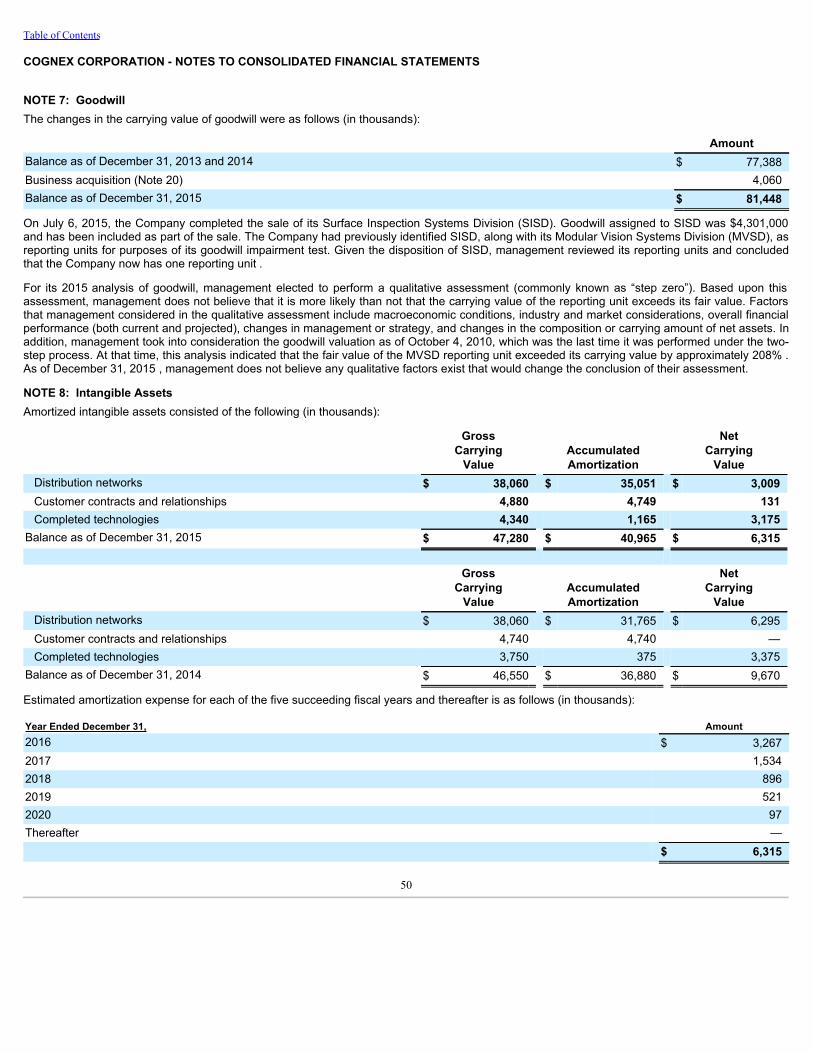
Table of Contents
COGNEX CORPORATION - NOTES TO CONSOLIDATED FINANCIAL STATEMENTS
NOTE 7: GoodwillThe changes in the carrying value of goodwill were as follows (in thousands):
AmountBalance as of December 31, 2013 and 2014 $ 77,388Business acquisition (Note 20) 4,060Balance as of December 31, 2015 $ 81,448
On July 6, 2015, the Company completed the sale of its Surface Inspection Systems Division (SISD). Goodwill assigned to SISD was $4,301,000and has been included as part of the sale. The Company had previously identified SISD, along with its Modular Vision Systems Division (MVSD), asreporting units for purposes of its goodwill impairment test. Given the disposition of SISD, management reviewed its reporting units and concludedthat the Company now has one reporting unit .
For its 2015 analysis of goodwill, management elected to perform a qualitative assessment (commonly known as “step zero”). Based upon thisassessment, management does not believe that it is more likely than not that the carrying value of the reporting unit exceeds its fair value. Factorsthat management considered in the qualitative assessment include macroeconomic conditions, industry and market considerations, overall financialperformance (both current and projected), changes in management or strategy, and changes in the composition or carrying amount of net assets. Inaddition, management took into consideration the goodwill valuation as of October 4, 2010, which was the last time it was performed under the two-step process. At that time, this analysis indicated that the fair value of the MVSD reporting unit exceeded its carrying value by approximately 208% .As of December 31, 2015 , management does not believe any qualitative factors exist that would change the conclusion of their assessment.
NOTE 8: Intangible AssetsAmortized intangible assets consisted of the following (in thousands):
GrossCarrying
Value AccumulatedAmortization
NetCarrying
ValueDistribution networks $ 38,060 $ 35,051 $ 3,009Customer contracts and relationships 4,880 4,749 131Completed technologies 4,340 1,165 3,175
Balance as of December 31, 2015 $ 47,280 $ 40,965 $ 6,315
GrossCarrying
Value AccumulatedAmortization
NetCarrying
ValueDistribution networks $ 38,060 $ 31,765 $ 6,295Customer contracts and relationships 4,740 4,740 —Completed technologies 3,750 375 3,375
Balance as of December 31, 2014 $ 46,550 $ 36,880 $ 9,670
Estimated amortization expense for each of the five succeeding fiscal years and thereafter is as follows (in thousands):
Year Ended December 31, Amount2016 $ 3,2672017 1,5342018 8962019 5212020 97Thereafter — $ 6,315
50

Table of Contents
COGNEX CORPORATION - NOTES TO CONSOLIDATED FINANCIAL STATEMENTS
NOTE 9: Accrued ExpensesAccrued expenses consisted of the following (in thousands):
December 31, 2015 2014Company bonuses $ 4,895 $ 8,238Salaries, commissions, and payroll taxes 4,859 5,081Vacation 4,482 4,328Warranty obligations 4,174 4,086Foreign retirement obligations 3,249 3,233Japanese consumption taxes 412 2,148Other 11,201 8,500 $ 33,272 $ 35,614
The changes in the warranty obligation were as follows (in thousands):
Balance as of December 31, 2013 $ 2,684Provisions for warranties issued during the period 5,126Fulfillment of warranty obligations (3,306)Foreign exchange rate changes (418)Balance as of December 31, 2014 4,086Provisions for warranties issued during the period 4,383Fulfillment of warranty obligations (3,873)Foreign exchange rate changes (422)Balance as of December 31, 2015 $ 4,174
NOTE 10: Commitments and ContingenciesCommitmentsAs of December 31, 2015 , the Company had outstanding purchase orders totaling $543,000 to purchase inventory from various vendors. Certain ofthese purchase orders may be canceled by the Company, subject to cancellation penalties. These purchase commitments relate to expected salesin 2016.The Company conducts certain of its operations in leased facilities. These lease agreements expire at various dates through 2023 and areaccounted for as operating leases. Certain of these leases contain renewal options, retirement obligations, escalation clauses, rent holidays, andleasehold improvement incentives. Annual rental expense totaled $5,778,000 in 2015 , $5,560,000 in 2014 , and $5,378,000 in 2013 .Future minimum rental payments under these agreements are as follows (in thousands):
Year Ended December 31, 2016 $ 4,1102017 2,7392018 2,1972019 1,5712020 1,308
Thereafter 2,453 $ 14,378
51
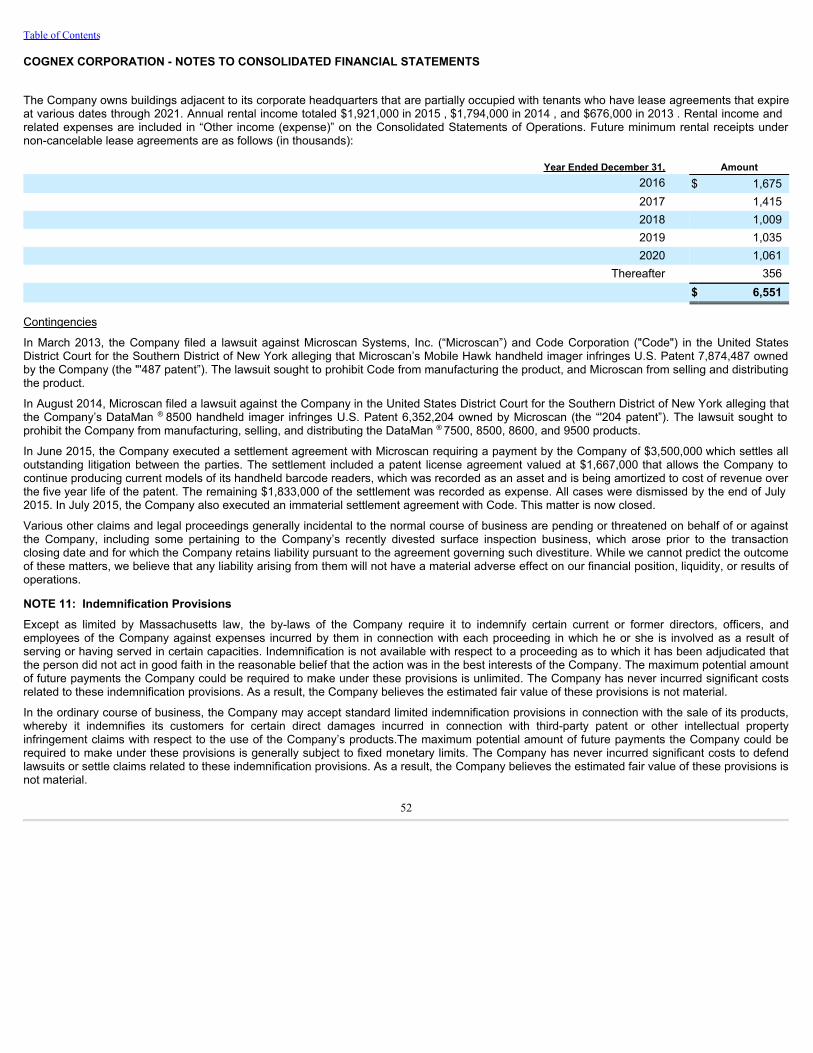
Table of Contents
COGNEX CORPORATION - NOTES TO CONSOLIDATED FINANCIAL STATEMENTS
The Company owns buildings adjacent to its corporate headquarters that are partially occupied with tenants who have lease agreements that expireat various dates through 2021. Annual rental income totaled $1,921,000 in 2015 , $1,794,000 in 2014 , and $676,000 in 2013 . Rental income andrelated expenses are included in “Other income (expense)” on the Consolidated Statements of Operations. Future minimum rental receipts undernon-cancelable lease agreements are as follows (in thousands):
Year Ended December 31, Amount2016 $ 1,6752017 1,4152018 1,0092019 1,0352020 1,061
Thereafter 356 $ 6,551
Contingencies
In March 2013, the Company filed a lawsuit against Microscan Systems, Inc. (“Microscan”) and Code Corporation ("Code") in the United StatesDistrict Court for the Southern District of New York alleging that Microscan’s Mobile Hawk handheld imager infringes U.S. Patent 7,874,487 ownedby the Company (the "'487 patent”). The lawsuit sought to prohibit Code from manufacturing the product, and Microscan from selling and distributingthe product.
In August 2014, Microscan filed a lawsuit against the Company in the United States District Court for the Southern District of New York alleging thatthe Company’s DataMan ® 8500 handheld imager infringes U.S. Patent 6,352,204 owned by Microscan (the “'204 patent”). The lawsuit sought toprohibit the Company from manufacturing, selling, and distributing the DataMan ® 7500, 8500, 8600, and 9500 products.
In June 2015, the Company executed a settlement agreement with Microscan requiring a payment by the Company of $3,500,000 which settles alloutstanding litigation between the parties. The settlement included a patent license agreement valued at $1,667,000 that allows the Company tocontinue producing current models of its handheld barcode readers, which was recorded as an asset and is being amortized to cost of revenue overthe five year life of the patent. The remaining $1,833,000 of the settlement was recorded as expense. All cases were dismissed by the end of July2015. In July 2015, the Company also executed an immaterial settlement agreement with Code. This matter is now closed.
Various other claims and legal proceedings generally incidental to the normal course of business are pending or threatened on behalf of or againstthe Company, including some pertaining to the Company’s recently divested surface inspection business, which arose prior to the transactionclosing date and for which the Company retains liability pursuant to the agreement governing such divestiture. While we cannot predict the outcomeof these matters, we believe that any liability arising from them will not have a material adverse effect on our financial position, liquidity, or results ofoperations.
NOTE 11: Indemnification ProvisionsExcept as limited by Massachusetts law, the by-laws of the Company require it to indemnify certain current or former directors, officers, andemployees of the Company against expenses incurred by them in connection with each proceeding in which he or she is involved as a result ofserving or having served in certain capacities. Indemnification is not available with respect to a proceeding as to which it has been adjudicated thatthe person did not act in good faith in the reasonable belief that the action was in the best interests of the Company. The maximum potential amountof future payments the Company could be required to make under these provisions is unlimited. The Company has never incurred significant costsrelated to these indemnification provisions. As a result, the Company believes the estimated fair value of these provisions is not material.
In the ordinary course of business, the Company may accept standard limited indemnification provisions in connection with the sale of its products,whereby it indemnifies its customers for certain direct damages incurred in connection with third-party patent or other intellectual propertyinfringement claims with respect to the use of the Company’s products.The maximum potential amount of future payments the Company could berequired to make under these provisions is generally subject to fixed monetary limits. The Company has never incurred significant costs to defendlawsuits or settle claims related to these indemnification provisions. As a result, the Company believes the estimated fair value of these provisions isnot material.
52

Table of Contents
COGNEX CORPORATION - NOTES TO CONSOLIDATED FINANCIAL STATEMENTS
In the ordinary course of business, the Company also accepts limited indemnification provisions from time to time, whereby it indemnifies customersfor certain direct damages incurred in connection with bodily injury and property damage arising from the use of the Company’s products.Themaximum potential amount of future payments the Company could be required to make under these provisions is generally limited and is likelyrecoverable under the Company’s insurance policies. As a result of this coverage, and the fact that the Company has never incurred significantcosts to defend lawsuits or settle claims related to these indemnification provisions, the Company believes the estimated fair value of theseprovisions is not material.
Under the terms of the Company’s sale of its Surface Inspection Systems Division to AMETEK, Inc., the Company has agreed to retain certainliabilities in connection with its business dealings occurring prior to the transaction closing date of July 6, 2015, and to indemnify AMETEK, Inc. inconnection with these retained liabilities and for any breach of the representations and warranties made by the Company to AMETEK, Inc. inconnection with the sales agreement itself, as is usual and customary in such transactions. As of the date of this report, the Company believes theestimated fair value of these provisions is not material.
NOTE 12: Derivative InstrumentsThe Company’s foreign currency risk management strategy is principally designed to mitigate the potential financial impact of changes in the valueof transactions and balances denominated in foreign currencies resulting from changes in foreign currency exchange rates. Currently, the Companyenters into two types of hedges to manage this risk. The first are economic hedges which utilize foreign currency forward contracts with maturities ofup to 45 days to manage the exposure to fluctuations in foreign currency exchange rates arising primarily from foreign-denominated receivables andpayables. The gains and losses on these derivatives are intended to be offset by the changes in the fair value of the assets and liabilities beinghedged. These economic hedges are not designated as hedging instruments for hedge accounting treatment. The second are cash flow hedgeswhich utilize foreign currency forward contracts with maturities of up to 18 months to hedge specific forecasted transactions of the Company'sforeign subsidiaries with the goal of protecting our budgeted revenues and expenses against foreign currency exchange rate changes compared toour budgeted rates. These cash flow hedges are designated as hedging instruments for hedge accounting treatment.
The Company had the following outstanding forward contracts (in thousands):
December 31, 2015 December 31, 2014Currency Notional Value USD Equivalent Notional Value USD Equivalent DerivativesDesignatedasHedgingInstruments: United States Dollar 16,720 $ 16,720 — $ —Japanese Yen 942,500 7,605 1,225,000 10,211Hungarian Forint 547,000 1,893 803,000 3,099Singapore Dollar 2,063 1,425 3,515 2,564Canadian Dollar 41 37 758 688British Pound 25 34 491 732DerivativesNotDesignatedasHedgingInstruments:Japanese Yen 700,000 $ 5,800 345,000 $ 2,878British Pound 1,650 2,441 1,400 2,183Korean Won 1,400,000 1,187 940,000 858Singapore Dollar 1,525 1,074 1,225 922Hungarian Forint 250,000 857 410,000 1,569Taiwanese Dollar 26,425 800 28,000 883
53

Table of Contents
COGNEX CORPORATION - NOTES TO CONSOLIDATED FINANCIAL STATEMENTS
Information regarding the fair value of the outstanding forward contracts was as follows (in thousands):
Asset Derivatives Liability Derivatives Balance
SheetLocation
Fair Value BalanceSheet
Location
Fair Value
December 31,
2015 December 31,
2014 December 31,
2015 December 31, 2014DerivativesDesignatedasHedgingInstruments:
Cash flow hedge forwardcontracts
Prepaidexpenses andother currentassets $ 441 $ 108
Accruedexpenses $ 201 $ 84
DerivativesNotDesignatedasHedgingInstruments:
Economic hedge forwardcontracts
Prepaid expensesand other currentassets $ 9 $ 5 Accrued expenses $ 43 $ 13
The following table presents the gross activity for all derivative assets and liabilities which were presented on a net basis on the ConsolidatedBalance Sheets due to the right of offset with each counterparty (in thousands):
Asset Derivatives Liability Derivatives December 31, 2015 December 31, 2014 December 31, 2015 December 31, 2014Gross amounts ofrecognized assets $ 479 $ 187
Gross amounts ofrecognized liabilities $ 279 $ 149
Gross amounts offset (29) (74) Gross amounts offset (35) (52)Net amount of assetspresented $ 450 $ 113
Net amount of liabilitiespresented $ 244 $ 97
54

Table of Contents
COGNEX CORPORATION - NOTES TO CONSOLIDATED FINANCIAL STATEMENTS
Information regarding the effect of derivative instruments, net of the underlying exposure, on the consolidated financial statements was as follows (inthousands):
Location in Financial Statements Year Ended December 31,
2015 2014 2013DerivativesDesignatedasHedgingInstruments:Gains (losses) recorded inshareholders' equity (effectiveportion)
Accumulated othercomprehensive income (loss), netof tax $ 206 $ 32 $ 104
Gains (losses) reclassified fromaccumulated othercomprehensive income (loss)into current operations(effective portion) Revenue $ (387) $ (14) $ —
Research, development, andengineering expenses 14 (42) —
Selling, general, andadministrative expenses 172 10 —
Total gains (losses) reclassifiedfrom accumulated othercomprehensive income (loss) intocurrent operations $ (201) $ (46) $ —
Gains (losses) recognized incurrent operations (ineffectiveportion and discontinuedderivatives) Foreign currency gain (loss) $ — $ — $ —
DerivativesNotDesignatedasHedgingInstruments:Gains (losses) recognized incurrent operations Foreign currency gain (loss) $ (13) $ 247 $ (316)
The following table presents the changes in accumulated other comprehensive income (loss), net of tax, related to derivative instruments (inthousands):
Balance as of December 31, 2014 $ 32Net unrealized loss on cash flow hedges (27)Reclassification of net realized loss on cash flow hedges into current operations 201Balance as of December 31, 2015 $ 206
Net gains expected to be reclassified from accumulated other comprehensive income (loss), net of tax, into current operations within the next twelvemonths are $210,000 .
NOTE 13: Shareholders’ EquityPreferred StockThe Company has 400,000 shares of authorized but unissued $.01 par value preferred stock.
Common StockEach outstanding share of common stock entitles the record holder to one vote on all matters submitted to a vote of the Company’s shareholders.Common shareholders are also entitled to dividends when and if declared by the Company’s Board of Directors.
55

Table of Contents
COGNEX CORPORATION - NOTES TO CONSOLIDATED FINANCIAL STATEMENTS
Shareholder Rights PlanThe Company has adopted a Shareholder Rights Plan, the purpose of which is, among other things, to enhance the Board of Directors’ ability toprotect shareholder interests and to ensure that shareholders receive fair treatment in the event any coercive takeover attempt of the Company ismade in the future. The Shareholder Rights Plan could make it more difficult for a third party to acquire, or could discourage a third party fromacquiring, the Company or a large block of the Company’s common stock. The following summary description of the Shareholder Rights Plan doesnot purport to be complete and is qualified in its entirety by reference to the Company’s Shareholder Rights Plan, which has been previously filed bythe Company with the Securities and Exchange Commission as an exhibit to a Registration Statement on Form 8-A filed on December 5, 2008.In connection with the adoption of the Shareholder Rights Plan, the Board of Directors of the Company declared a dividend distribution of onepurchase right (a “Right”) for each outstanding share of common stock to shareholders of record as of the close of business on December 5, 2008.The Rights currently are not exercisable and are attached to and trade with the outstanding shares of common stock. Under the Shareholder RightsPlan, the Rights become exercisable if a person becomes an “acquiring person” by acquiring 15% or more of the outstanding shares of commonstock or if a person commences a tender offer that would result in that person owning 15% or more of the common stock. If a person becomes an“acquiring person,” each holder of a Right (other than the acquiring person) would be entitled to purchase, at the then-current exercise price, suchnumber of shares of the Company’s preferred stock which are equivalent to shares of common stock having twice the exercise price of the Right. Ifthe Company is acquired in a merger or other business combination transaction after any such event, each holder of a Right would then be entitledto purchase, at the then-current exercise price, shares of the acquiring company’s common stock having a value of twice the exercise price of theRight.
Stock RepurchasesIn April 2014, the Company's Board of Directors authorized the repurchase of $50,000,000 of the Company's common stock. As of December 31,2015, the Company repurchased 1,079,000 shares at a cost of $50,000,000 under this program, including 895,000 shares at a cost of $42,415,000in 2015. Stock repurchases under this 2014 program are now complete. In August 2015, the Company's Board of Directors authorized therepurchase of an additional $100,000,000 of the Company's common stock. Purchases under this 2015 program began in the third quarter of 2015upon completion of the 2014 program. As of December 31, 2015, the Company repurchased 2,311,000 shares at a cost of $83,936,000 under thisprogram. Total stock repurchases in 2015 amounted to $126,351,000 . In November, 2015, the Company's Board of Directors authorized therepurchase of an additional $100,000,000 of the Company's common stock. Purchases under this November 2015 program will commence uponcompletion of the August 2015 program. The Company may repurchase shares under these programs in future periods depending on a variety offactors, including, among other things, the impact of dilution from employee stock options, stock price, share availability, and cash requirements.
DividendsThe Company’s Board of Directors declared and paid cash dividends of $0.07 per share in the second, third, and fourth quarters of 2015. Total cashdividends paid in 2015 amounted to $18,062,000 . The cash dividend in the second quarter of 2015 was the first dividend declared and paid sincethe fourth quarter of 2012 when the Company’s Board of Directors accelerated dividends in advance of an increase in the federal tax on dividendspaid after December 31, 2012. Due to these accelerated payments, no cash dividends were declared or paid in 2013, 2014, or the first quarter of2015. Future dividends will be declared at the discretion of the Company's Board of Directors and will depend upon such factors as the Boarddeems relevant, including, among other things, the Company's ability to generate positive cash flow from operations.
NOTE 14: Stock-Based CompensationStock Option PlansThe Company’s share-based payments that result in compensation expense consist of stock option grants and restricted stock awards. As ofDecember 31, 2015 , the Company had 9,844,051 shares available for grant. Stock options are granted with an exercise price equal to the marketvalue of the Company’s common stock at the grant date and generally vest over four years based upon continuous service and expire ten yearsfrom the grant date. Conditions of restricted stock awards may be based upon continuing employment and/or achievement of pre-establishedperformance goals and objectives. Vesting for performance-based restricted stock awards and time-based restricted stock awards must be greaterthan one year and three years, respectively.
56

Table of Contents
COGNEX CORPORATION - NOTES TO CONSOLIDATED FINANCIAL STATEMENTS
The following table summarizes the Company’s stock option activity for the year ended December 31, 2015 :
Shares
(in thousands)
Weighted-AverageExercise
Price
Weighted-Average
RemainingContractual
Term(in years)
AggregateIntrinsic Value(in thousands)
Outstanding as of December 31, 2014 6,812 $ 23.26 Granted 1,519 41.00 Exercised (1,520) 18.14 Forfeited or expired (167) 31.94
Outstanding as of December 31, 2015 6,644 $ 28.27 7.11 $ 57,955Exercisable as of December 31, 2015 2,596 $ 17.69 5.31 $ 43,597Options vested or expected to vest at December 31, 2015 (1) 6,065 $ 27.29 6.96 $ 57,291
(1) In addition to the vested options, the Company expects a portion of the unvested options to vest at some point in the future. Optionsexpected to vest are calculated by applying an estimated forfeiture rate to the unvested options.
The fair values of stock options granted in each period presented were estimated using the following weighted-average assumptions:
Year Ended December 31,
2015 2014 2013Risk-free rate 2.1% 2.6% 2.0%Expected dividend yield 1.25% —% —%Expected volatility 40% 41% 42%Expected term (in years) 5.4 5.4 5.8
Risk-free rateThe risk-free rate was based upon a treasury instrument whose term was consistent with the contractual term of the option.
Expected dividend yieldGenerally, the current dividend yield is calculated by annualizing the cash dividend declared by the Company’s Board of Directors and dividing thatresult by the closing stock price on the grant date. However, in the fourth quarter of 2012, the Company paid the full annual dividends for 2013 and2014 in advance, and therefore, the dividend yield for those years was adjusted to zero. A dividend yield of 1.25% was estimated for future periodsfrom 2015 through the expected life of the option.
Expected volatilityThe expected volatility was based upon a combination of historical volatility of the Company’s common stock over the contractual term of the optionand implied volatility for traded options of the Company’s stock.
Expected termThe expected term was derived from the binomial lattice model from the impact of events that trigger exercises over time.The Company stratifies its employee population into two groups: one consisting of senior management and another consisting of all otheremployees. The Company currently expects that approximately 74% of its stock options granted to senior management and 73% of its optionsgranted to all other employees will actually vest. Therefore, the Company currently applies an estimated forfeiture rate of 10% to all unvestedoptions for senior management and a rate of 11% for all other employees. The Company revised its estimated forfeiture rates in the first quarter of2015 , 2014 and 2013 , resulting in an increase to compensation expense of $461,000 , $288,000 , and $300,000 in 2015 , 2014 , and 2013 ,respectively.
57

Table of Contents
COGNEX CORPORATION - NOTES TO CONSOLIDATED FINANCIAL STATEMENTS
The weighted-average grant-date fair value of stock options granted was $14.35 in 2015 , $15.97 in 2014 , and $8.21 in 2013 .
The total intrinsic value of stock options exercised was $43,987,000 in 2015 , $31,884,000 in 2014 , and $32,096,000 in 2013 . The total fair value ofstock options vested was $16,227,000 in 2015 , $11,627,000 in 2014 , and $9,717,000 in 2013 .As of December 31, 2015 , total unrecognized compensation expense related to non-vested stock options was $18,785,000 , which is expected tobe recognized over a weighted-average period of 1.54 years.
The following table summarizes the Company's restricted stock activity for the year ended December 31, 2015:
Shares (in thousands) Weighted-AverageGrant Fair Value
Aggregate IntrinsicValue (in thousands) (1)
Nonvested as of December 31, 2014 20 $ 34.05 Granted — — Vested — — Forfeited or expired — —
Nonvested as of December 31, 2015 20 $ 34.05 $ 675
(1) Fair market value as of December 31, 2015.
The fair values of restricted stock awards granted were determined based upon the market value of the Company's common stock at the time ofgrant. The initial cost is then amortized over the period of vesting until the restrictions lapse. These restricted shares will be fully vested in 2018.Participants are entitled to dividends on restricted stock awards, but only receive those amounts if the shares vest. The sale or transfer of theseshares is restricted during the vesting period.The total stock-based compensation expense and the related income tax benefit recognized was $21,274,000 and $7,127,000 , respectively, in2015 , $15,158,000 and $4,977,000 , respectively, in 2014 , and $10,620,000 and $3,482,000 , respectively, in 2013 . No compensation expensewas capitalized in 2015 , 2014 , or 2013 .The following table presents the stock-based compensation expense by caption for each period presented on the Consolidated Statements ofOperations (in thousands):
Year Ended December 31,
2015 2014 2013Cost of revenue $ 1,515 $ 1,116 $ 820Research, development, and engineering 5,194 3,709 2,502Selling, general, and administrative 13,032 9,234 6,461Discontinued operations 1,533 1,099 837
$ 21,274 $ 15,158 $ 10,620
Upon the sale of the Company's Surface Inspection Systems Division, completed on July 6, 2015, the Company accelerated the vesting of stockoptions with respect to 190,000 underlying shares, resulting in an additional $1,106,000 of stock option expense recorded in the third quarter of2015.
NOTE 15: Employee Savings PlanUnder the Company’s Employee Savings Plan, a defined contribution plan, U.S. employees who have attained age 21 may contribute up to 25% oftheir pay on a pre-tax basis subject to the annual dollar limitations established by the Internal Revenue Service. The Company currently matches50% of the first 6% of pay an employee contributes. Company contributions vest 20% , 40% , 60% , and 100% after two, three, four, and five yearsof continuous employment with the Company, respectively. Company contributions totaled $1,845,000 in 2015 , $1,555,000 in 2014 , and$1,423,000 in 2013 . Cognex stock is not an investment alternative and Company contributions are not made in the form of Cognex stock.
58

Table of Contents
COGNEX CORPORATION - NOTES TO CONSOLIDATED FINANCIAL STATEMENTS
NOTE 16: TaxesDomestic income from continuing operations before taxes was $11,637,000 in 2015 , $25,585,000 in 2014 , and $20,146,000 in 2013 . Foreignincome from continuing operations before taxes was $115,325,000 in 2015 , $106,171,000 in 2014 , and $58,310,000 in 2013 .Income tax expense on continuing operations consisted of the following (in thousands):
Year Ended December 31,
2015 2014 2013Current:
Federal $ 16,430 $ 18,852 $ 5,935State 378 608 466Foreign 4,946 4,854 3,167
21,754 24,314 9,568Deferred:
Federal (2,541) (2,569) 1,580State (165) 7 119Foreign 250 (837) 6
(2,456) (3,399) 1,705 $ 19,298 $ 20,915 $ 11,273
A reconciliation of the United States federal statutory corporate tax rate to the Company’s income tax expense on continuing operations, or effectivetax rate, was as follows:
Year Ended December 31,
2015 2014 2013Income tax provision at federal statutory corporate tax rate 35 % 35 % 35 %State income taxes, net of federal benefit — — 1Foreign tax rate differential (19) (19) (19)Tax credit — — (1)Discrete tax events (2) (1) (3)Other 1 1 1Income tax provision on continuing operations 15 % 16 % 14 %
The effective tax rate for 2015 included the impact of the following discrete tax events: (1) a decrease in tax expense of $1,105,000 from the finaltrue-up of the prior year’s tax accrual upon filing the actual tax returns, (2) a decrease in tax expense of $975,000 from the expiration of statutes oflimitations for certain reserves for income tax uncertainties, (3) a decrease in tax expense, net of reserves, of $910,000 from the retroactiveapplication of the 2015 research and development tax credit passed by Congress in December 2015 and applied retroactively to January 1, 2015,and (4) an increase in tax expense of $65,000 from the write down of a deferred tax asset. Interest and penalties included in these amounts was adecrease to tax expense of $148,000 .The effective tax rate for 2014 included the impact of the following discrete tax events: (1) a decrease in tax expense of $652,000 from the final true-up on the prior year’s tax accrual upon filing the actual tax returns, (2) a decrease in tax expense, net of reserves, of $645,000 from the retroactiveapplication of the 2014 research and development tax credit passed by Congress in December 2014 and applied retroactively to January 1, 2014,(3) a decrease in tax expense of $418,000 from the closing of the Internal Revenue Service audit of the Company for tax years 2010 and 2011, and(4) a decrease in tax expense of $217,000 from the expiration of the statutes of limitations for certain reserves for income tax uncertainties. Interestand penalties included in these amounts was a decrease to tax expense of $46,000 .The effective tax rate for 2013 included the impact of the following discrete tax events: (1) a decrease in tax expense of $1,790,000 from theexpiration of statutes of limitations for certain reserves for income tax uncertainties, (2) a decrease in tax expense of $428,000 from the applicationof the 2012 research and development credit passed by Congress on January 1, 2013, and (3) an increase in tax expense of $267,000 from the finaltrue-up of the prior year's tax accrual upon filing the actual tax returns. Interest and penalties included in these amounts was a decrease to taxexpense of $854,000 .
59

Table of Contents
COGNEX CORPORATION - NOTES TO CONSOLIDATED FINANCIAL STATEMENTS
The changes in the reserve for income taxes, excluding gross interest and penalties, were as follows (in thousands):
Balance of reserve for income taxes as of December 31, 2013 $ 4,408Gross amounts of decreases in unrecognized tax benefits as a result of tax positions taken in prior periods (226)Gross amounts of increases in unrecognized tax benefits as a result of tax positions taken in the current period 1,095Gross amounts of decreases in unrecognized tax benefits relating to settlements with taxing authorities (15)Gross amounts of decreases in unrecognized tax benefits as a result of the expiration of the applicable statutes oflimitations (135)Balance of reserve for income taxes as of December 31, 2014 5,127Gross amounts of decreases in unrecognized tax benefits as a result of tax positions taken in prior periods (56)Gross amounts of increases in unrecognized tax benefits as a result of tax positions taken in the current period 1,291Gross amounts of decreases in unrecognized tax benefits relating to settlements with taxing authorities —Gross amounts of decreases in unrecognized tax benefits as a result of the expiration of the applicable statutes oflimitations (1,066)Balance of reserve for income taxes as of December 31, 2015 $ 5,296
The Company’s reserve for income taxes, including gross interest and penalties, was $5,858,000 as of December 31, 2015, which included$4,830,000 classified as a non-current liability and $1,028,000 recorded as a reduction to non-current deferred tax assets. The Company's reservefor income taxes, including gross interest and penalties, was $5,651,000 as of December 31, 2014, which included $4,623,000 classified as a non-current liability and $1,028,000 recorded as a reduction to non-current deferred tax assets. The amount of gross interest and penalties included inthese balances was $562,000 and $524,000 as of December 31, 2015 and December 31, 2014, respectively. If the Company’s tax positions weresustained or the statutes of limitations related to certain positions expired, these reserves would be released and income tax expense would bereduced in a future period, less $701,000 and $664,000 , as of December 31, 2015 and December 31, 2014, respectively, that would be recordedthrough additional paid-in capital. As a result of the expiration of certain statutes of limitations, there is a potential that a portion of these reservescould be released, which would decrease income tax expense by approximately $750,000 to $850,000 over the next twelve months.The Company has defined its major tax jurisdictions as the United States, Ireland, China, and Japan, and within the United States, Massachusettsand California. Within the United States, the tax years 2012 through 2014 remain open to examination by the Internal Revenue Service, while thetax years 2011 through 2014 remain open to various state taxing authorities, and the tax years 2011 through 2014 remain open to examination byvarious taxing authorities in other jurisdictions in which the Company operates.In 2011, the Company finalized an Advanced Pricing Agreement (APA) with Japan that will cover tax years 2006 through 2011, with a requestedextension to 2012. The Company has concluded negotiations for an APA between Japan and Ireland that will cover tax years 2014 through 2018with retroactive application to 2013. The Company believes it is adequately reserved for these open years.
60

Table of Contents
COGNEX CORPORATION - NOTES TO CONSOLIDATED FINANCIAL STATEMENTS
Deferred tax assets and liabilities consisted of the following (in thousands):
December 31,
2015 2014Current deferred tax assets:
Inventory and revenue related $ 2,985 $ 4,911Bonuses, commissions, and other compensation 2,500 2,280Other 1,619 1,794
Net current deferred tax assets $ 7,104 $ 8,985
Non-current deferred tax assets: Stock-based compensation expense $ 13,895 $ 10,290Federal and state tax credit carryforwards 5,091 4,547Depreciation 2,328 1,945Other 2,556 2,583
Gross non-current deferred tax assets 23,870 19,365Non-current deferred tax liabilities:
Nondeductible intangible assets (1,198) (2,430)Gross non-current deferred tax liabilities (1,198) (2,430)Valuation allowance (3,259) (2,483)Net non-current deferred tax assets $ 19,413 $ 14,452
Current deferred tax liabilities: Other $ (319) $ —Net current deferred tax liabilities $ (319) $ —
In 2015, the Company recorded a valuation allowance of $776,000 for state research and development tax credits that were not considered to berealizable. Should these credits be utilized in a future period, the reserve associated with these credits would be reversed in the period when it isdetermined that the credits can be utilized to offset future state income tax liabilities. In addition, the Company had $6,119,000 of state research anddevelopment tax credit carryforwards, net of federal tax, as of December 31, 2015 , which will begin to expire in 2017.The Company recorded certain intangible assets as a result of the acquisition of DVT Corporation in 2005. The amortization of these intangibleassets is not deductible for U.S. tax purposes. A deferred tax liability was established to reflect the federal and state liability associated with notdeducting the acquisition-related amortization expenses. The balance of this liability was $1,198,000 as of December 31, 2015 .While the deferred tax assets, net of valuation allowance, are not assured of realization, management has evaluated the realizability of thesedeferred tax assets and has determined that it is more likely than not that these assets will be realized. In reaching this conclusion, we haveevaluated certain relevant criteria including the Company’s historical profitability, current projections of future profitability, and the lives of tax credits,net operating losses, and other carryforwards. Should the Company fail to generate sufficient pre-tax profits in future periods, we may be required toestablish valuation allowances against these deferred tax assets, resulting in a charge to current operations in the period of determination.The Company does not provide U.S. income taxes on its foreign subsidiaries’ undistributed earnings, as they are deemed to be permanentlyreinvested outside the United States. Upon repatriation, the Company would provide the appropriate U.S. income taxes on these earnings, net ofapplicable foreign tax credits. It is not practicable to determine the income tax liability that might be incurred if the earnings were to be distributed.The Company recorded $354,000 of other income in 2013 upon the expiration of the statutes of limitations relating to tax holidays, during which timethe Company collected value-added taxes from customers that were not required to be remitted to the government authority.
On July 6, 2015, the Company completed the sale of its Surface Inspection Systems Division (SISD). A pre-tax gain of $125,357,000 and associatedincome tax expense of $47,175,000 was recorded in 2015.
61

Table of Contents
COGNEX CORPORATION - NOTES TO CONSOLIDATED FINANCIAL STATEMENTS
Cash paid for income taxes totaled $58,280,000 in 2015 , $17,549,000 in 2014 , and $8,831,000 in 2013 . The 2015 income tax payments includedremittances related to the sale of SISD.
NOTE 17: Weighted Average SharesWeighted-average shares were calculated as follows (in thousands):
Year Ended December 31, 2015 2014 2013Basic weighted-average common shares outstanding 86,296 86,858 86,946Effect of dilutive stock options 1,695 2,213 1,955Diluted weighted-average common and common-equivalent shares outstanding 87,991 89,071 88,901
Stock options to purchase 3,035,078 , 1,286,403 , and 1,385,901 shares of common stock, on a weighted-average basis, were outstanding in 2015 ,2014 , and 2013 , respectively, but were not included in the calculation of dilutive net income per share because they were anti-dilutive.
NOTE 18: Segment and Geographic InformationOn July 6, 2015, the Company completed the sale of its Surface Inspection Systems Division (SISD). Prior to this date, the Company had reportedSISD as one of its two segments. Given the disposition of the SISD segment, management reviewed its segment reporting and concluded that theCompany now operates in one segment, machine vision technology. Operating segments were not aggregated in reaching this conclusion. TheCompany’s chief operating decision maker is the chief executive officer, who makes decisions to allocate resources and assesses performance atthe corporate level. The Company offers a variety of machine vision products that have similar economic characteristics, have the same productionprocesses, and are distributed by the same sales channels to the same types of customers.The following table summarizes information about geographic areas (in thousands):
United States Europe Greater China Other TotalYear Ended December 31, 2015
Revenue $ 119,781 $ 199,127 $ 54,137 $ 77,512 $ 450,557Long-lived assets 120,808 12,498 873 9,478 $ 143,657
Year Ended December 31, 2014 Revenue $ 120,523 $ 195,214 $ 38,184 $ 72,528 $ 426,449Long-lived assets 114,892 10,941 858 7,835 $ 134,526
Year Ended December 31, 2013 Revenue $ 97,727 $ 113,126 $ 29,453 $ 67,345 $ 307,651Long-lived assets 111,488 5,059 865 11,143 $ 128,555
Revenue is presented geographically based upon the customer’s country of domicile. In 2013, approximately $10,000,000 of indirect revenue fromcustomers in Greater China has been presented geographically based upon the end customer's country of domicile in Europe. Greater Chinaincludes Mainland China, Hong Kong, and Taiwan.Revenue from a single customer accounted for 18% and 16% of total revenue in 2015 and 2014, respectively. In 2013, no customer accounted forgreater than 10% of total revenue.
NOTE 19: Discontinued OperationsOn July 6, 2015, the Company completed the sale of its Surface Inspection Systems Division (SISD) to AMETEK, Inc. (AMETEK) for $155,655,000in cash. Transaction costs totaled $5,198,000 and included $ 1,106,000 of stock option expense from the accelerated vesting of stock options inconnection with the sale.
62

Table of Contents
Carrying amounts of major assets and liabilities included as part of the disposal group were as follows (in thousands):
December 31, 2014Accounts receivable, net $ 10,885Inventories, net 6,313Unbilled revenue 2,356Prepaid expenses and other current assets 2,955Property, plant, and equipment, net 1,944Goodwill 4,301Intangible assets, net 1,029Other assets 31
Held for sale assets $ 29,814
Accounts payable $ 1,891Accrued expenses 4,335Deferred revenue 5,965
Held for sale liabilities $ 12,191
The financial results of SISD are reported as a discontinued operation for all periods presented. A pre-tax gain of $125,357,000 and associatedincome tax expense of $47,175,000 was recorded in "Net income from discontinued operations" on the Consolidated Statements of Operations.
The major classes of revenue and expense included in discontinued operations were as follows (in thousands):
Year Ended December 31, 2015 2014 2013Revenue $ 23,248 $ 59,821 $ 46,235Cost of revenue (11,291) (26,953) (21,191)Research, development, and engineering expenses (2,126) (4,089) (3,772)Selling, general, and administrative expenses (7,800) (12,968) (11,842)Foreign currency loss (177) (170) —Operating income from discontinued business 1,854 15,641 9,430Gain on sale of discontinued business 125,357 — —Income from discontinued operations before income tax expense 127,211 15,641 9,430Income tax expense on discontinued operations 47,801 4,997 3,040Net income from discontinued operations $ 79,410 $ 10,644 $ 6,390
Significant non-cash items related to the discontinued business were as follows (in thousands):
Year Ended December 31, 2015 2014 2013Stock-based compensation expense $ 1,533 $ 1,099 $ 837Depreciation expense 401 777 703Amortization expense 165 364 376Capital expenditures 482 631 749
The Company also entered into a Transition Services Agreement (TSA) with AMETEK to ensure an orderly and effective transition of SISD. Underthe terms of the TSA, the Company agreed to continue to perform certain administrative activities related to SISD; however, AMETEK is responsiblefor monitoring the business and making all strategic decisions. Activities under this TSA were completed as of December 31, 2015. The incomeassociated with this TSA was not material in 2015.
63

Table of Contents
NOTE 20: Acquisition of Selected Assets of Manatee Works, Inc.On August 21, 2015, the Company acquired selected assets of Manatee Works, Inc. (Manatee), a privately-held U.S.-based developer of barcodescanning software development kits (SDKs). The Company plans to leverage Manatee's current developer network and business model of attractingnew developers to drive leads for its ID products. Under this transaction, the Company also acquired technology for use in mobile devices.
The Company paid $1,023,000 in cash upon closing and may pay additional contingent cash consideration over the next three years based uponcertain milestone revenue levels. The undiscounted potential outcomes related to the contingent consideration range from $0 to approximately$5,000,000 . The fair value of the contingent consideration as of the acquisition date was $3,790,000 , resulting in a total purchase price of$4,813,000 .
The contingent consideration is remeasured each reporting period with changes in fair value recorded in "Other income (expense)" on theConsolidated Statements of Operations. The fair value as of December 31, 2015 was $3,000,000 , and accordingly, the liability was reduced by$790,000 and this benefit was recorded in other income. As of December 31, 2015, the current portion of contingent consideration expected to bepaid within the next year was $600,000 and was recorded in “Accrued expenses,” and the non-current portion expected to be paid beyond one yearwas $2,400,000 and was recorded in “Other non-current liabilities” on the Consolidated Balance Sheets.
The purchase price was allocated as follows (in thousands):
Prepaid expenses $ 23Customer relationships 140Completed technology 590Goodwill 4,060
Purchase price $ 4,813
The customer relationships and completed technology are included in "Intangible assets" on the Consolidated Balance Sheets. The customerrelationships is being amortized on a straight-line basis to selling, general, and administrative expenses over five years. The completed technologyis being amortized on a straight-line basis to cost of revenue over five years. The goodwill is expected to be deductible for tax purposes. Transactioncosts were immaterial and were expensed as incurred in the third quarter of 2015.
Manatee financial results are immaterial with respect to the inclusion of supplemental pro-forma information.
NOTE 21: Subsequent EventsOn February 9, 2016, the Company's Board of Directors declared a cash dividend of $0.07 per share. The dividend is payable March 18, 2016 to allshareholders of record as of the close of business on March 4, 2016 .
64

COGNEX CORPORATION - SELECTED QUARTERLY FINANCIAL DATA (UNAUDITED)
Quarter Ended
April 5, 2015 July 5, 2015 October 4, 2015 December 31, 2015
(In thousands, except per share amounts)Revenue $ 101,373 $ 143,829 $ 107,587 $ 97,768Gross margin 79,029 113,321 81,268 74,368Operating income 22,110 51,778 28,485 19,148 Net income from continuing operations $ 19,472 $ 43,516 $ 25,822 $ 18,854Net income from discontinued operations 1,030 198 78,290 (108)Net income $ 20,502 $ 43,714 $ 104,112 $ 18,746
Basic net income per share from continuing operations $ 0.22 $ 0.50 $ 0.30 $ 0.22Basic net income per share from discontinued operations 0.02 0.00 0.91 0.00Basic net income per share $ 0.24 $ 0.50 $ 1.21 $ 0.22
Diluted net income per share from continuing operations $ 0.22 $ 0.49 $ 0.29 $ 0.22Diluted net income per share from discontinued operations 0.01 0.00 0.90 0.00Diluted net income per share $ 0.23 $ 0.49 $ 1.19 $ 0.22
Quarter Ended
March 30, 2014 June 29, 2014 September 28,
2014 December 31, 2014
(In thousands, except per share amounts)Revenue $ 81,316 $ 92,276 $ 154,356 $ 98,501Gross margin 64,763 74,086 116,644 76,889Operating income 21,402 26,024 55,339 25,087 Net income from continuing operations $ 17,816 $ 22,675 $ 47,681 $ 22,669Net income from discontinued operations 690 3,273 2,719 3,962Net income $ 18,506 $ 25,948 $ 50,400 $ 26,631
Basic net income per share from continuing operations $ 0.21 $ 0.26 $ 0.55 $ 0.26Basic net income per share from discontinued operations 0.00 0.04 0.03 0.05Basic net income per share $ 0.21 $ 0.30 $ 0.58 $ 0.31
Diluted net income per share from continuing operations $ 0.20 $ 0.25 $ 0.53 $ 0.26Diluted net income per share from discontinued operations 0.01 0.04 0.04 0.04Diluted net income per share $ 0.21 $ 0.29 $ 0.57 $ 0.30
65

Table of Contents
REPORT OF INDEPENDENT REGISTERED PUBLIC ACCOUNTING FIRM
To the Board of Directors and Shareholders of Cognex Corporation:We have audited in accordance with the standards of the Public Company Accounting Oversight Board (United States) the consolidated financialstatements of Cognex Corporation and subsidiaries (the “Company”) referred to in our report dated February 10, 2016 , which is included in the2015 Annual Report on Form 10-K of Cognex Corporation. Our audits of the basic consolidated financial statements included the financial statementschedule listed in the index appearing under Item 15(2) of this Form 10-K, which is the responsibility of the Company’s management. In our opinion,this financial statement schedule, when considered in relation to the basic consolidated financial statements taken as a whole, presents fairly, in allmaterial respects, the information set forth therein.
/s/ GRANT THORNTON LLP
Boston, MassachusettsFebruary 10, 2016
66

Table of Contents
COGNEX CORPORATION – SCHEDULE II – VALUATION AND QUALIFYING ACCOUNTS
Additions
Description
Balance atBeginningof Period
Charged toCosts andExpenses
Chargedto Other
Accounts Deductions Other
Balance atEnd ofPeriod
(In thousands)Reserve for Uncollectible AccountsReceivable:
2015 $ 820 $ — $ — $ (44) (a) $ (40) (b) $ 7362014 $ 909 $ — $ — $ (32) (a) $ (57) (b) $ 8202013 $ 751 $ 199 $ — $ (56) (a) $ 15 (b) $ 909
Reserve for Excess andObsolete Inventory:
2015 $ 5,058 $ 1,562 $ — $ (2,443) (a) $ (374) (c) $ 3,8032014 $ 4,301 $ 3,204 $ — $ (1,978) (a) $ (469) (c) $ 5,0582013 $ 3,030 $ 1,985 $ — $ (834) (a) $ 120 (c) $ 4,301
Deferred Tax Valuation Allowance: 2015 $ 2,483 $ 817 $ — $ — $ (41) $ 3,2592014 $ 1,758 $ 725 $ — $ — $ — $ 2,4832013 $ 1,489 $ 642 $ — $ (373) $ — $ 1,758
(a) Specific write-offs(b) Collections of previously written-off accounts and foreign currency exchange rate changes(c) Foreign currency exchange rate changes
67

Table of Contents
ITEM 9: CHANGES IN AND DISAGREEMENTS WITH ACCOUNTANTS ON ACCOUNTING AND FINANCIAL DISCLOSUREThere were no disagreements with accountants on accounting or financial disclosure during 2015 or 2014 .
ITEM 9A: CONTROLS AND PROCEDURESDisclosure Controls and ProceduresAs required by Rules 13a-15 and 15d-15 of the Securities Exchange Act of 1934, the Company has evaluated, with the participation ofmanagement, including the Chief Executive Officer and the Chief Financial Officer, the effectiveness of its disclosure controls and procedures (asdefined in such rules) as of the end of the period covered by this report. Based on such evaluation, the Chief Executive Officer and Chief FinancialOfficer concluded that such disclosure controls and procedures were effective as of that date.
Management’s Report on Internal Control over Financial ReportingManagement is responsible for establishing and maintaining adequate internal control over financial reporting. Management has evaluated theeffectiveness of the Company’s internal control over financial reporting based upon the framework in Internal Control – Integrated Framework issuedin 2013 by the Committee of Sponsoring Organizations of the Treadway Commission (COSO).Based upon our evaluation, management has concluded that the Company’s internal control over financial reporting was effective as ofDecember 31, 2015 .
Attestation Report of the Registered Public Accounting Firm on Internal Control over Financial ReportingThe Company’s internal control over financial reporting as of December 31, 2015 has been audited by Grant Thornton LLP, an independentregistered public accounting firm, as stated in their report which is included herein.
Changes in Internal Control over Financial ReportingThere have been no changes in the Company’s internal control over financial reporting that occurred during the fourth quarter of the year endedDecember 31, 2015 that have materially affected, or are reasonably likely to materially affect, the Company’s internal control over financial reporting.The Company continues to review its disclosure controls and procedures, including its internal control over financial reporting, and may from time totime make changes aimed at enhancing their effectiveness and to ensure that the Company’s systems evolve with its business.
68

Table of Contents
REPORT OF INDEPENDENT REGISTERED PUBLIC ACCOUNTING FIRM
To the Board of Directors and Shareholders of Cognex Corporation:
We have audited the internal control over financial reporting of Cognex Corporation (a Massachusetts corporation) and subsidiaries (the “Company”)as of December 31, 2015 , based on criteria established in the 2013 Internal Control—Integrated Framework issued by the Committee ofSponsoring Organizations of the Treadway Commission (COSO). The Company’s management is responsible for maintaining effective internalcontrol over financial reporting and for its assessment of the effectiveness of internal control over financial reporting, included in the accompanyingmanagement’s report on internal control over financial reporting. Our responsibility is to express an opinion on the Company’s internal control overfinancial reporting based on our audit.We conducted our audit in accordance with the standards of the Public Company Accounting Oversight Board (United States). Those standardsrequire that we plan and perform the audit to obtain reasonable assurance about whether effective internal control over financial reporting wasmaintained in all material respects. Our audit included obtaining an understanding of internal control over financial reporting, assessing the risk thata material weakness exists, testing and evaluating the design and operating effectiveness of internal control based on the assessed risk, andperforming such other procedures as we considered necessary in the circumstances. We believe that our audit provides a reasonable basis for ouropinion.A company’s internal control over financial reporting is a process designed to provide reasonable assurance regarding the reliability of financialreporting and the preparation of financial statements for external purposes in accordance with generally accepted accounting principles. Acompany’s internal control over financial reporting includes those policies and procedures that (1) pertain to the maintenance of records that, inreasonable detail, accurately and fairly reflect the transactions and dispositions of the assets of the company; (2) provide reasonable assurance thattransactions are recorded as necessary to permit preparation of financial statements in accordance with generally accepted accounting principles,and that receipts and expenditures of the company are being made only in accordance with authorizations of management and directors of thecompany; and (3) provide reasonable assurance regarding prevention or timely detection of unauthorized acquisition, use, or disposition of thecompany’s assets that could have a material effect on the financial statements.Because of its inherent limitations, internal control over financial reporting may not prevent or detect misstatements. Also, projections of anyevaluation of effectiveness to future periods are subject to the risk that controls may become inadequate because of changes in conditions, or thatthe degree of compliance with the policies or procedures may deteriorate.In our opinion, the Company maintained, in all material respects, effective internal control over financial reporting as of December 31, 2015 , basedon criteria established in the 2013 InternalControl—IntegratedFrameworkissued by COSO.We also have audited, in accordance with the standards of the Public Company Accounting Oversight Board (United States), the consolidatedfinancial statements of the Company as of and for the year ended December 31, 2015 , and our report dated February 10, 2016 expressed anunqualified opinion on those financial statements.
/s/ GRANT THORNTON LLP
Boston, MassachusettsFebruary 10, 2016
69

Table of Contents
ITEM 9B: OTHER INFORMATIONNone
PART III
ITEM 10: DIRECTORS, EXECUTIVE OFFICERS, AND CORPORATE GOVERNANCEInformation with respect to Directors and Executive Officers of the Company and the other matters required by Item 10 shall be included in theCompany’s definitive Proxy Statement for the Annual Meeting of Shareholders to be held on April 28, 2016 and is incorporated herein by reference.In addition, certain information with respect to Executive Officers of the Company may be found in the section captioned “Executive Officers of theRegistrant,” appearing in Part I – Item 4A of this Annual Report on Form 10-K.The Company has adopted a Code of Business Conduct and Ethics covering all employees, which is available, free of charge, on the Company’swebsite, www.cognex.com under "Company-Investor Information-Governance". The Company intends to disclose on its website any amendments toor waivers of the Code of Business Conduct and Ethics on behalf of the Company’s directors and executive officers that would otherwise berequired to be disclosed under the rules of the SEC or The NASDAQ Stock Market LLC.
ITEM 11: EXECUTIVE COMPENSATIONInformation with respect to executive compensation and the other matters required by Item 11 shall be included in the Company’s definitive ProxyStatement for the Annual Meeting of Shareholders to be held on April 28, 2016 and is incorporated herein by reference.
ITEM 12: SECURITY OWNERSHIP OF CERTAIN BENEFICIAL OWNERS AND MANAGEMENT AND RELATED STOCKHOLDER MATTERSInformation with respect to security ownership and the other matters required by Item 12 shall be included in the Company’s definitive ProxyStatement for the Annual Meeting of Shareholders to be held on April 28, 2016 and is incorporated herein by reference.The following table provides information as of December 31, 2015 regarding shares of common stock that may be issued under the Company’sexisting equity compensation plans:
Plan Category
Number of securities to beissued upon exercise of
outstanding options,warrants, and rights
Weighted-average exerciseprice of outstanding options,
warrants, and rights
Number of securitiesremaining available for future
issuance under equitycompensation plans
(excluding securities reflectedin column (a))
(a) Equity compensation plans approved byshareholders (4) 5,641,860 (1) $ 30.7102 9,844,051 (2)Equity compensation plans not approved byshareholders (4) 1,022,272 (3) 14.9087 —
6,664,132 $ 28.2863 9,844,051
(1) Includes shares to be issued upon exercise of outstanding options under the Company’s 1998 Stock Incentive Plan, 2007 Stock Option and Incentive Plan, andsubsequent to shareholder approval, the 2001 General Stock Option Plan, as amended and restated.
(2) Includes shares remaining available for future issuance under the Company’s 2007 Stock Option and Incentive Plan and 2001 General Stock Option Plan, asamended and restated.
(3) Includes shares to be issued upon the exercise of outstanding options granted prior to shareholder approval under the 2001 General Stock Option Plan, as amendedand restated.
(4) All references made to share or per share amounts have been adjusted to reflect the two-for-one stock split which occurred in the third quarter of 2013.
The 2001 General Stock Option Plan was originally adopted by the Board of Directors in December 2001 without shareholder approval. InDecember 2011, this plan received shareholder approval for an amendment and restatement of the plan, extending the plan until September 2021.This plan provides for the granting of nonqualified stock options and incentive stock options to any employee who is actively employed by theCompany and is not an officer or director of the Company. The maximum number of shares of common stock available for grant under this plan is14,220,000 shares. All option grants must have an exercise price per share that is no less than the fair market value per share of the Company’scommon stock on the grant date and must have a term that is no longer than ten years from the grant date. 8,874,770 stock options have beengranted under the 2001 General Stock Option Plan.
70

Table of Contents
ITEM 13: CERTAIN RELATIONSHIPS AND RELATED TRANSACTIONS, AND DIRECTOR INDEPENDENCEInformation with respect to certain relationships and related transactions and the other matters required by Item 13 shall be included in theCompany’s definitive Proxy Statement for the Annual Meeting of Shareholders to be held on April 28, 2016 and is incorporated herein by reference.
ITEM 14: PRINCIPAL ACCOUNTING FEES AND SERVICESInformation with respect to principal accounting fees and services and the other matters required by Item 14 shall be included in the Company’sdefinitive Proxy Statement for the Annual Meeting of Shareholders to be held on April 28, 2016 and is incorporated herein by reference.
PART IV
ITEM 15: EXHIBITS AND FINANCIAL STATEMENT SCHEDULES(1) Financial Statements
The financial statements are included in Part II – Item 8 of this Annual Report on Form 10-K.(2) Financial Statement Schedule
Financial Statement Schedule II is included in Part II – Item 8 of this Annual Report on Form 10-K.Other schedules are omitted because of the absence of conditions under which they are required or because the requiredinformation is given in the consolidated financial statements or notes thereto.
(3) ExhibitsThe Exhibits filed as part of this Annual Report on Form 10-K are listed in the Exhibit Index, immediately preceding suchExhibits.
71

Table of Contents
SIGNATURESPursuant to the requirements of Section 13 or 15(d) of the Securities Exchange Act of 1934, the registrant has duly caused this report to be signedon its behalf by the undersigned, thereunto duly authorized.
COGNEX CORPORATION By: /s/ Robert J. Willett Robert J. Willett President and Chief Executive Officer
Pursuant to the requirements of the Securities Exchange Act of 1934, this report has been signed below by the following persons on behalf of theregistrant and in the capacities and on the dates indicated.
Signature Title Date /s/ Robert J. Shillman Chairman of the Board of Directors and Chief Culture Officer February 10, 2016Robert J. Shillman /s/ Robert J. Willett President, Chief Executive Officer, and Director (principal executive
officer) February 10, 2016
Robert J. Willett /s/ Richard A. Morin Executive Vice President of Finance and Administration and Chief
Financial Officer(principal financial and accounting officer)
February 10, 2016
Richard A. Morin /s/ Patrick Alias
Director February 10, 2016
Patrick Alias /s/ Eugene Banucci Director February 10, 2016Eugene Banucci /s/ Theodor Krantz
Director February 10, 2016
Theodor Krantz /s/ Jeffrey Miller
Director February 10, 2016
Jeffrey Miller /s/ J. Bruce Robinson
Director February 10, 2016
J. Bruce Robinson /s/ Anthony Sun
Director February 10, 2016
Anthony Sun /s/ Reuben Wasserman
Director February 10, 2016
Reuben Wasserman
72

Table of Contents
EXHIBIT INDEX
EXHIBIT NUMBER 3A
Restated Articles of Organization of Cognex Corporation effective June 27, 1989, as amended April 30, 1991, April 21,1992, April 25, 1995, April 23, 1996, and May 8, 2000 (incorporated by reference to Exhibit 3A of Cognex's Annual Reporton Form 10-K for the year ended December 31, 2012 [File No. 1-34218])
3B
Articles of Amendment to the Articles of Organization of Cognex Corporation establishing Series E Junior ParticipatingPreferred Stock (incorporated by reference to Exhibit 3.1 to Cognex's Registration Statement on Form 8-A filed onDecember 5, 2008 [File No. 1-34218])
3C
By-laws of Cognex Corporation, as amended and restated through December 5, 2013 (incorporated by reference to Exhibit3.1 of Cognex’s Current Report on Form 8-K filed on December 10, 2013 [File No. 1-34218])
4A
Specimen Certificate for Shares of Common Stock (incorporated by reference to Exhibit 4 to the Registration Statement onForm S-1 [Registration No. 33-29020])
4B
Shareholder Rights Agreement, dated December 4, 2008, between Cognex Corporation and National City Bank(incorporated by reference to Exhibit 4.1 to Cognex's Registration Statement on Form 8-A filed on December 5, 2008 [FileNo. 1-34218])
10A *
Cognex Corporation 1998 Non-Employee Director Stock Option Plan (incorporated by reference to Exhibit 4.1 to theRegistration Statement on Form S-8 [Registration No. 333-60807])
10B *
Amendment to Cognex Corporation 1998 Non-Employee Director Stock Option Plan, effective as of July 26, 2007(incorporated by reference to Exhibit 10C of Cognex's Annual Report on Form 10-K for the year ended December 31, 2012[File No. 1-34218])
10C *
Cognex Corporation 1998 Stock Incentive Plan (incorporated by reference to Exhibit 4.2 to the Registration Statement onForm S-8 [Registration No. 333-60807])
10D *
First Amendment to the Cognex Corporation 1998 Stock Incentive Plan (incorporated by reference to Exhibit 4.3 to theRegistration Statement on Form S-8 [Registration No. 333-60807])
10E *
Second Amendment to the Cognex Corporation 1998 Stock Incentive Plan (incorporated by reference to Exhibit 10F ofCognex’s Annual Report on Form 10-K for the year ended December 31, 2011 [File No. 1-34218])
10F *
Amendment to Cognex Corporation 1998 Stock Incentive Plan, effective as of July 26, 2007 (incorporated by reference toExhibit 10G of Cognex's Annual Report on Form 10-K for the year ended December 31, 2012 [File No. 1-34218])
10G *
Cognex Corporation 2001 General Stock Option Plan, as amended and restated (incorporated by reference to Exhibit 10Hof Cognex's Annual Report on Form 10-K for the year ended December 31, 2014 [File No. 1-34218])
10H *
Cognex Corporation 2007 Stock Option and Incentive Plan, as amended and restated (incorporated by reference to Exhibit10.1 of Cognex's Quarterly Report on Form 10-Q for the quarter ended July 5, 2015 [File No. 1-34218])
10I *
Form of Letter Agreement between Cognex Corporation and each of Robert J. Shillman, Patrick A. Alias, Anthony Sun andReuben Wasserman (incorporated by reference to Exhibit 10K of Cognex's Annual Report on Form 10-K for the year endedDecember 31, 2012 [File No. 1-34218])
10J *
Form of Stock Option Agreement (Non-Qualified) under 1998 Stock Incentive Plan (incorporated by reference to Exhibit 10Lof Cognex's Annual Report on Form 10-K for the year ended December 31, 2012 [File No. 1-34218])
10K *
Form of Indemnification Agreement with each of the Directors of Cognex Corporation (incorporated by reference to Exhibit10R of Cognex's Annual Report on Form 10-K for the year ended December 31, 2013 [File No. 1-34218])
10L *
Employment Agreement, dated June 17, 2008, by and between Cognex Corporation and Robert Willett (incorporated byreference to Exhibit 10S of Cognex's Annual Report on Form 10-K for the year ended December 31, 2013 [File No. 1-34218])
10M *
Amendment to Employment Agreement with Robert Willett, dated November 14, 2008 (incorporated by reference to Exhibit10T of Cognex's Annual Report on Form 10-K for the year ended December 31, 2013 [File No. 1-34218])
73

Table of Contents
10N *
Form of Stock Option Agreement (Non-Qualified) under 2007 Stock Option and Incentive Plan (incorporated by reference toExhibit 10U of Cognex's Annual Report on Form 10-K for the year ended December 31, 2013 [File No. 1-34218])
10O *
Letter from the Company to Richard A. Morin regarding Stock Option Agreements (incorporated by reference to Exhibit 10Vof Cognex's Annual Report on Form 10-K for the year ended December 31, 2013 [File No. 1-34218])
10P *
Summary of Annual Bonus Program (incorporated by reference to Exhibit 10R of Cognex’s Annual Report on Form 10-K forthe year ended December 31, 2014 [File No. 1-34218])
10Q *
Stock Option Agreements with Robert Willett dated November 3, 2014 (incorporated by reference to Exhibit 10S ofCognex's Annual Report on Form 10-K for the year ended December 31, 2014 [File No. 1-34218])
14
Code of Business Conduct and Ethics as amended March 12, 2004 (incorporated by reference to Exhibit 14 of Cognex'sAnnual Report on Form 10-K for the year ended December 31, 2009 [File No. 001-34218])
21 Subsidiaries of the registrant (filed herewith)23.1 Consent of Grant Thornton LLP (filed herewith)31.1 Certification of Chief Executive Officer (filed herewith)31.2 Certification of Chief Financial Officer (filed herewith)32.1 Certification pursuant to Section 906 of the Sarbanes-Oxley Act of 2002 (CEO) (furnished herewith)32.2 Certification pursuant to Section 906 of the Sarbanes-Oxley Act of 2002 (CFO) (furnished herewith)101 xBRL (Extensible Business Reporting Language)
The following materials from Cognex Corporation's Annual Report on Form 10-K for the period ended December 31, 2015,formatted in xBRL: (i) Consolidated Statements of Operations for the years ended December 31, 2015, December 31, 2014,and December 31, 2013; (ii) Consolidated Statements of Comprehensive Income for the years ended December 31,2015, December 31, 2014, and December 31, 2013; (iii) Consolidated Balance Sheets as of December 31, 2015 andDecember 31, 2014; (iv) Consolidated Statements of Cash Flows for the years ended December 31, 2015, December 31,2014, and December 31, 2013; (v) Consolidated Statements of Shareholders’ Equity for the years ended December 31,2015, December 31, 2014, and December 31, 2013; and (vi) Notes to Consolidated Financial Statements. * Indicates management contract or compensatory plan or arrangement
74

EXHIBIT 21
COGNEX CORPORATIONSUBSIDIARIES OF THE REGISTRANT
As of December 31, 2015, the registrant had the following subsidiaries, the financial statements of which are all included in the consolidated financialstatements of the registrant:
NAME OF SUBSIDIARY STATE/COUNTRY OF INCORPORATIONPERCENT
OWNERSHIP
Cognex Asia, Inc. (formerly Cognex China, Inc.) Delaware 100%
Cognex Canada, Inc. Delaware 100%
Cognex Canada Technology, Inc. California 100%
Cognex Europe, B.V. Netherlands 100%
Cognex Europe, Inc. Delaware 100%
Cognex Foreign Sales Corporation Barbados 100%
Cognex Germany, Inc. Massachusetts 100%
Cognex Germany Aachen GmbH Germany 100%
Cognex Goruntu Sistemleri Satis ve Ticaret Limited Sirketi Turkey 100%
Cognex Hungary Kft. Hungary 100%
Cognex International, Inc. Delaware 100%
Cognex Ireland Ltd. Ireland 100%
Cognex K.K. Japan 100%
Cognex Korea, Inc. Delaware 100%
Cognex, Ltd. Ireland 100%
Cognex Representacao Comercial E Participacoes Ltda. Brazil 100%
Cognex Sensors India Private Limited India 100%
Cognex Service, Inc Delaware 100%
Cognex Service Ltd. Ireland 100%
Cognex Singapore, Inc. Delaware 100%
Cognex Taiwan, Inc. Delaware 100%
Cognex Technology and Investment LLC California 100%
Cognex UK Ltd. United Kingdom 100%
Cognex Vision Inspection System (Shanghai) Co., Ltd. China 100%
Vision Drive, Inc. Delaware 100%
One Vision Drive LLC (formerly Vision Drive Retail LLC) Massachusetts 100%

EXHIBIT 23.1
CONSENT OF INDEPENDENT REGISTERED PUBLIC ACCOUNTING FIRM
We have issued our reports dated February 10, 2016, with respect to the consolidated financial statements, schedule, and internal control overfinancial reporting included in the Annual Report of Cognex Corporation on Form 10-K for the year ended December 31, 2015. We hereby consentto the incorporation by reference of said reports in the Registration Statements of Cognex Corporation on Forms S-8 (File Nos. 333-02151; 333-60807; 33-96961; 333-100709; 333-126787; 333-150315 and 333-206081).
/s/ GRANT THORNTON LLP
Boston, MassachusettsFebruary 10, 2016

EXHIBIT 31.1
CERTIFICATION
I, Robert J. Willett, certify that:
1 I have reviewed this Annual Report on Form 10-K of Cognex Corporation;
2 Based on my knowledge, this report does not contain any untrue statement of a material fact or omit to state a material fact necessaryto make the statements made, in light of the circumstances under which such statements were made, not misleading with respect tothe period covered by this report;
3 Based on my knowledge, the financial statements, and other financial information included in this report, fairly present in all material
respects the financial condition, results of operations and cash flows of the registrant as of, and for, the periods presented in this report;
4 The registrant’s other certifying officer(s) and I are responsible for establishing and maintaining disclosure controls and procedures (asdefined in Exchange Act Rules 13a-15(e) and 15d-15(e)) and internal control over financial reporting (as defined in Exchange Act Rules13a-15(f) and 15d-15(f)) for the registrant and have:
(a) Designed such disclosure controls and procedures, or caused such disclosure controls and procedures to be designed under oursupervision, to ensure that material information relating to the registrant, including its consolidated subsidiaries, is made known tous by others within those entities, particularly during the period in which this report is being prepared;
(b) Designed such internal control over financial reporting, or caused such internal control over financial reporting to be designedunder our supervision, to provide reasonable assurance regarding the reliability of financial reporting and the preparation offinancial statements for external purposes in accordance with generally accepted accounting principles;
(c) Evaluated the effectiveness of the registrant’s disclosure controls and procedures and presented in this report our conclusionsabout the effectiveness of the disclosure controls and procedures, as of the end of the period covered by this report based onsuch evaluation; and
(d) Disclosed in this report any change in the registrant’s internal control over financial reporting that occurred during the registrant’smost recent fiscal quarter (the registrant’s fourth fiscal quarter in the case of an annual report) that has materially affected, or isreasonably likely to materially affect, the registrant’s internal control over financial reporting; and
5 The registrant’s other certifying officer(s) and I have disclosed, based on our most recent evaluation of internal control over financialreporting, to the registrant’s auditors and the audit committee of the registrant’s board of directors (or persons performing theequivalent functions):
(a) All significant deficiencies and material weaknesses in the design or operation of internal control over financial reporting which
are reasonably likely to adversely affect the registrant’s ability to record, process, summarize and report financial information; and
(b) Any fraud, whether or not material, that involves management or other employees who have a significant role in the registrant’s
internal control over financial reporting.
Date: February 10, 2016 By: /s/ Robert J. Willett Robert J. Willett President and Chief Executive Officer

EXHIBIT 31.2
CERTIFICATION
I, Richard A. Morin, certify that:
1 I have reviewed this Annual Report on Form 10-K of Cognex Corporation;
2 Based on my knowledge, this report does not contain any untrue statement of a material fact or omit to state a material fact necessaryto make the statements made, in light of the circumstances under which such statements were made, not misleading with respect tothe period covered by this report;
3 Based on my knowledge, the financial statements, and other financial information included in this report, fairly present in all material
respects the financial condition, results of operations and cash flows of the registrant as of, and for, the periods presented in this report;
4 The registrant’s other certifying officer(s) and I are responsible for establishing and maintaining disclosure controls and procedures (asdefined in Exchange Act Rules 13a-15(e) and 15d-15(e)) and internal control over financial reporting (as defined in Exchange Act Rules13a-15(f) and 15d-15(f)) for the registrant and have:
(a) Designed such disclosure controls and procedures, or caused such disclosure controls and procedures to be designed under oursupervision, to ensure that material information relating to the registrant, including its consolidated subsidiaries, is made known tous by others within those entities, particularly during the period in which this report is being prepared;
(b) Designed such internal control over financial reporting, or caused such internal control over financial reporting to be designedunder our supervision, to provide reasonable assurance regarding the reliability of financial reporting and the preparation offinancial statements for external purposes in accordance with generally accepted accounting principles;
(c) Evaluated the effectiveness of the registrant’s disclosure controls and procedures and presented in this report our conclusionsabout the effectiveness of the disclosure controls and procedures, as of the end of the period covered by this report based onsuch evaluation; and
(d) Disclosed in this report any change in the registrant’s internal control over financial reporting that occurred during the registrant’smost recent fiscal quarter (the registrant’s fourth fiscal quarter in the case of an annual report) that has materially affected, or isreasonably likely to materially affect, the registrant’s internal control over financial reporting; and
5 The registrant’s other certifying officer(s) and I have disclosed, based on our most recent evaluation of internal control over financialreporting, to the registrant’s auditors and the audit committee of the registrant’s board of directors (or persons performing theequivalent functions):
(a) All significant deficiencies and material weaknesses in the design or operation of internal control over financial reporting which
are reasonably likely to adversely affect the registrant’s ability to record, process, summarize and report financial information; and
(b) Any fraud, whether or not material, that involves management or other employees who have a significant role in the registrant’s
internal control over financial reporting.
Date: February 10, 2016 By: /s/ Richard A. Morin Richard A. Morin
Executive Vice President of Finance and Administrationand Chief Financial Officer

EXHIBIT 32.1*
CERTIFICATION PURSUANT TO18 U.S.C. 1350,
AS ADOPTED PURSUANT TOSECTION 906 OF THE SARBANES-OXLEY ACT OF 2002
The undersigned officer of Cognex Corporation (the “Company”) hereby certifies to his knowledge that the Company’s Annual Report on Form 10-Kfor the year ended December 31, 2015 (the “Report”), as filed with the Securities and Exchange Commission on the date hereof, fully complies withthe requirements of Section 13(a) or 15(d), as applicable, of the Securities Exchange Act of 1934, as amended, and that the information contained inthe Report fairly presents, in all material respects, the financial condition and results of operations of the Company.
Date: February 10, 2016 By: /s/ Robert J. Willett Robert J. Willett
President and Chief Executive Officer (principalexecutive officer)
* This certification shall not be deemed “filed” for purposes of Section 18 of the Securities Exchange Act of 1934, or otherwise subject to theliability of that section, nor shall it be deemed to be incorporated by reference into any filing under the Securities Act of 1933 or the SecuritiesExchange Act of 1934.

EXHIBIT 32.2*
CERTIFICATION PURSUANT TO18 U.S.C. 1350,
AS ADOPTED PURSUANT TOSECTION 906 OF THE SARBANES-OXLEY ACT OF 2002
The undersigned officer of Cognex Corporation (the “Company”) hereby certifies to his knowledge that the Company’s Annual Report on Form 10-Kfor the year ended December 31, 2015 (the “Report”), as filed with the Securities and Exchange Commission on the date hereof, fully complies withthe requirements of Section 13(a) or 15(d), as applicable, of the Securities Exchange Act of 1934, as amended, and that the information contained inthe Report fairly presents, in all material respects, the financial condition and results of operations of the Company.
Date: February 10, 2016 By: /s/ Richard A. Morin Richard A. Morin
Executive Vice President of Finance and Administrationand Chief Financial Officer
(principal financial officer)
* This certification shall not be deemed “filed” for purposes of Section 18 of the Securities Exchange Act of 1934, or otherwise subject to theliability of that section, nor shall it be deemed to be incorporated by reference into any filing under the Securities Act of 1933 or the SecuritiesExchange Act of 1934.