code writing vs code completion puzzles: analyzing
TRANSCRIPT
XXX-X-XXXX-XXXX-X/XX/$XX.00 ©20XX IEEE
Code Writing vs Code Completion Puzzles: Analyzing Questions in an E-exam
Guttorm Sindre Dept. of Computer Science
Norwegian University of Science and Technology (NTNU) Trondheim, Norway
ORCID: 0000-0001-5739-8265
Abstract—This Research Full Paper investigates the relationship between code writing tasks and other tasks like program comprehension and completion. In the context of exams, it is interesting to know whether auto-gradable comprehension and completion tasks can to some extent replace harder-to-grade code writing tasks and still test the same learning outcomes. This paper reports on the post mortem analysis of the 2019 e-exam in a university level programming course. Questions were analyzed for difficulty level, correlation, and discrimination. Program puzzles were found to correlate well with code writing, which is in line with previous findings by others. On average, code writing questions had higher difficulty, discrimination, and correlation with the total score than the other question formats – but not uniformly so. A more fine granular analysis of performance on individual interaction items sheds light on reasons why some questions worked better than others, with implications for future question design.
Keywords—programming, e-exam, question types, item analysis
I. INTRODUCTION There has been much research on the
relationship between code writing tasks and other tasks like program comprehension and completion e.g., [1,2,3,4]. Code writing tends to be the dominant exam question type in Introductory courses in computer science (often called “CS1”) [5], and perceived as more authentic vs. work-life tasks. However, they may be tedious to grade reliably, and often require students to master several concepts at once [6]. Comprehension and completion tasks may better allow for items testing the understanding of single concepts [7].
This paper reports on the post mortem analysis of the Autumn 2019 e-exam in a university level course in Programming and Numerical Analysis, taken by near 250 students. The programming part was introductory Python. Manually graded code writing tasks made up for only 30% of the exam weight. The rest utilized various question formats that could be auto-graded in the e-exam tool used at the university, such as multiple choice questions (MCQs), pair matching, and various program completion puzzles, using formats like inline choice, fill-in-blank, and drag and drop. The latter
are often called Parsons’ problems [8] in computing education.
There are many different aspects of this exam that could be interesting to investigate. The research in this paper focuses on the relationship between code completion tasks and code writing tasks, our research questions (RQ) being as follows:
RQ1: Do code completion and code writing tasks have equal difficulty, item-rest correlation, discrimination, and time spent relative to grading weight?
RQ2: What is the correlation between code completion and code writing tasks?
RQ3: What guidelines for task improvement can be elicited from analysis of the interaction items within code completion tasks?
The rest of this paper is structured as follows: Section II explains the research method. Section III describes how the exam was designed. Section IV then presents the results, and section V provides a discussion and some concluding remarks.
II. RESEARCH METHOD The exam itself was not designed primarily for
the purpose of research, but for assessing whether the students had achieved the learning outcomes, and to give valid and reliable grades. With a pure research focus, we might have designed the test in a more sophisticated way, such as having two or more groups of students getting different variations of the same task (e.g., some getting Task 4 as code writing, others getting it as code completion, and then opposite for Task 5). This was considered infeasible here, both for technical reasons and risks to exam fairness, should one version of the test turn out to be more difficult than the other.
Hence, the research reported in this paper is a post hoc study of results from a test designed for another purpose, which must be acknowledged as a weakness. However, the exam did have a mixture of various question genres that allows analysis related to the RQs stated above. Also, whereas an The research for this paper was done at the Excited Centre for
Excellent IT Education, funded by DIKU.
ungraded controlled experiment would allow increased freedom of test design, an exam has some advantages, too: There is no challenge in recruiting participants, and most have a strong (albeit extrinsic) motivation to do their best, which is not necessarily the case for ungraded experiments. Previous research has also indicated that analysis of exam results can give interesting findings [4,9,10].
After grading was finished, answer data were extracted from the e-exam system as a JSON-file, anonymized by removing anything that could link back to students, and flattened into a spreadsheet for further analysis. Since the statistical analyses were fairly simple, Excel was used (Office 365 Excel for Mac, v16.35), rather than a more sophisticated statistics tool. The following analyses were performed:
• Simple descriptive statistics for scores and time spent, i.e. means, standard deviations.
• Reliability of the exam as a whole, Cronbach’s Alpha [11].
• Correlations between scores on items and the sum of all other items, i.e., the item-rest correlation [12], and correlation between task genres, using Pearson correlation [13].
• Discrimination of tasks, i.e., how well they separate between strong and weak students. Here, we used the metric by Kelley [14], comparing p-values for the top 27% and bottom 27% of the students.
For code writing tasks, which were manually graded, scores, correlations, and discrimination were calculated only for the task as a whole. For auto-graded tasks, with several interaction items within the task, analyses could be made both for the task as a whole, and for each single interaction item.
III. DESIGN OF THE EXAM Our university uses the e-exam system Inspera
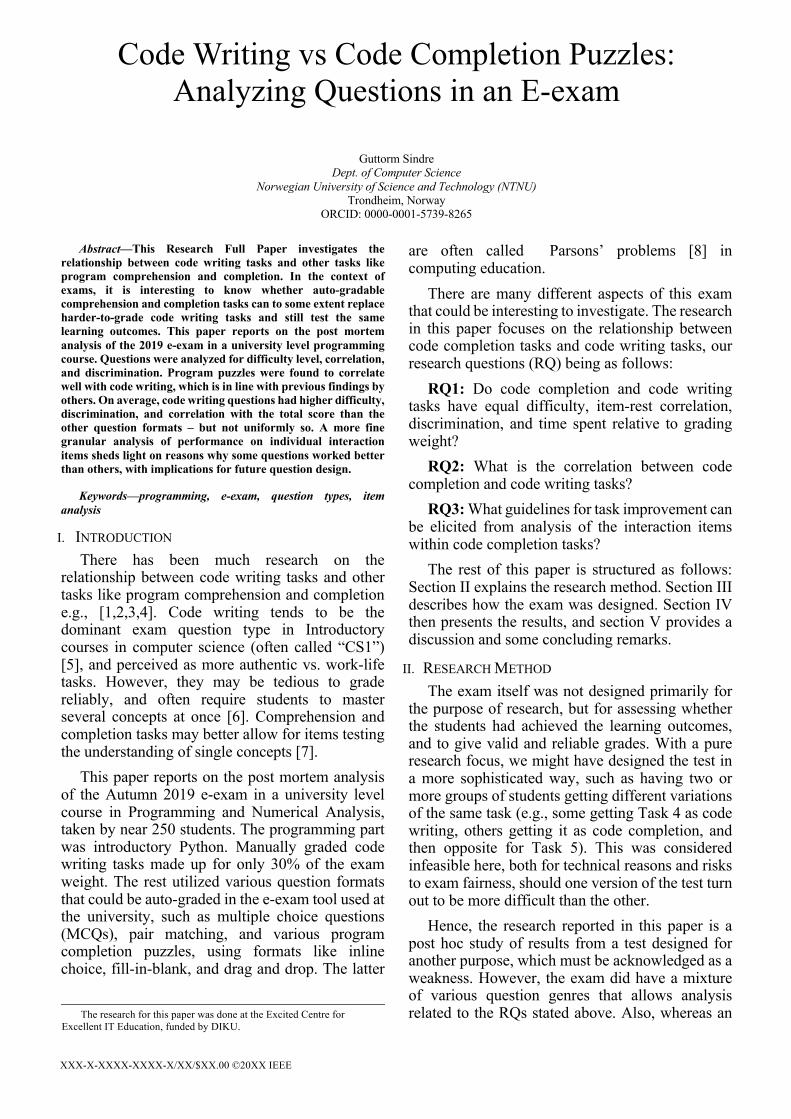
Assessment (henceforth IA), supporting question authoring, exam execution, and the subsequent grading process. It offers 18 different question types, whereof 8 were used in our exam, as shown in Table I. The column Qno is the question label (order of appearance in the exam set), and W% indicates percentage weight towards the total grade. The column #it gives the number of interaction items within each question. For code writing questions (pink) this was just 1, for others several. For instance, Q8 had 10 different fill-in fields, each of which could be filled correctly or incorrectly, and
Q14 had 10 different MCQs. The exam had a 68/32 split between general programming and numerical analysis, and a 70/30 split between tasks that were auto-scored and manually scored (code writing).
TABLE I. TASKS IN THE EXAM, IN ORDER OF APPEARANCE
The column Qtype gives the question type used
in IA, and color indicates the genre: Pink for code writing, purple for code completion, blue for code tracing and error identification, and green for theoretical knowledge. Finally, Topic indicates curricular coverage, though not exhaustively, as most questions include many basic programming constructs. In the following, we focus mainly on the tasks with code writing (pink) and code completion (purple), as these are the most relevant for our research questions.
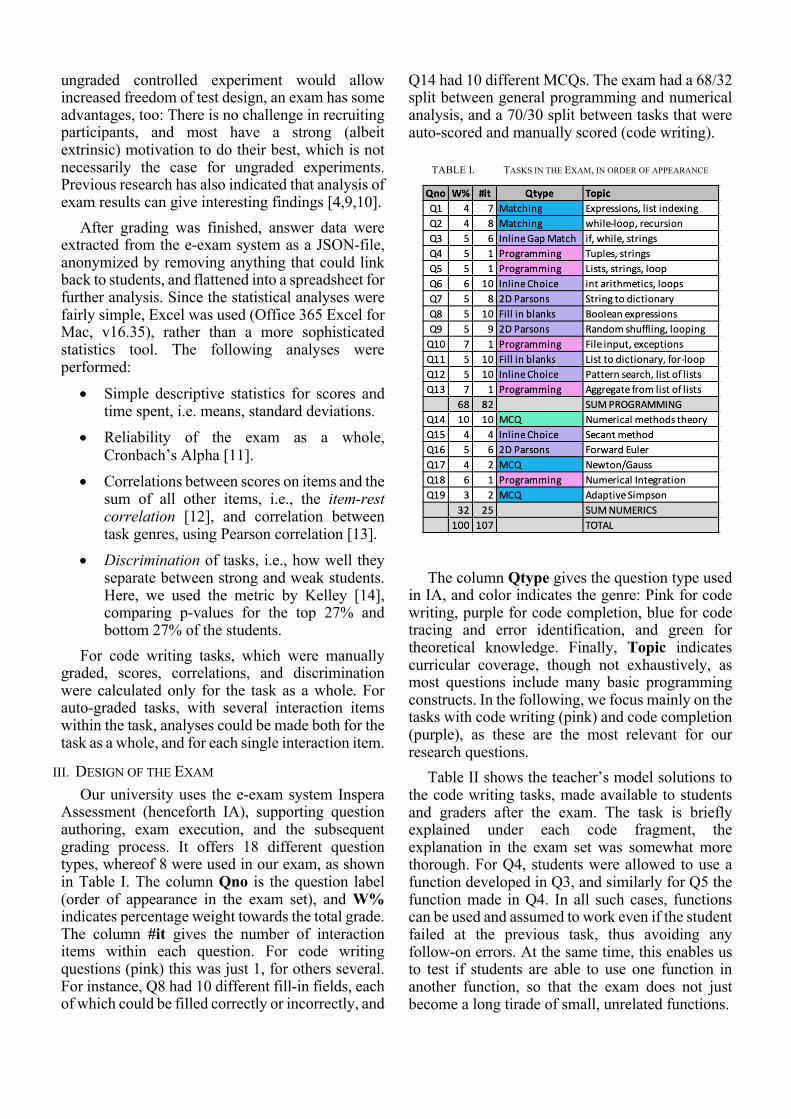
Table II shows the teacher’s model solutions to the code writing tasks, made available to students and graders after the exam. The task is briefly explained under each code fragment, the explanation in the exam set was somewhat more thorough. For Q4, students were allowed to use a function developed in Q3, and similarly for Q5 the function made in Q4. In all such cases, functions can be used and assumed to work even if the student failed at the previous task, thus avoiding any follow-on errors. At the same time, this enables us to test if students are able to use one function in another function, so that the exam does not just become a long tirade of small, unrelated functions.
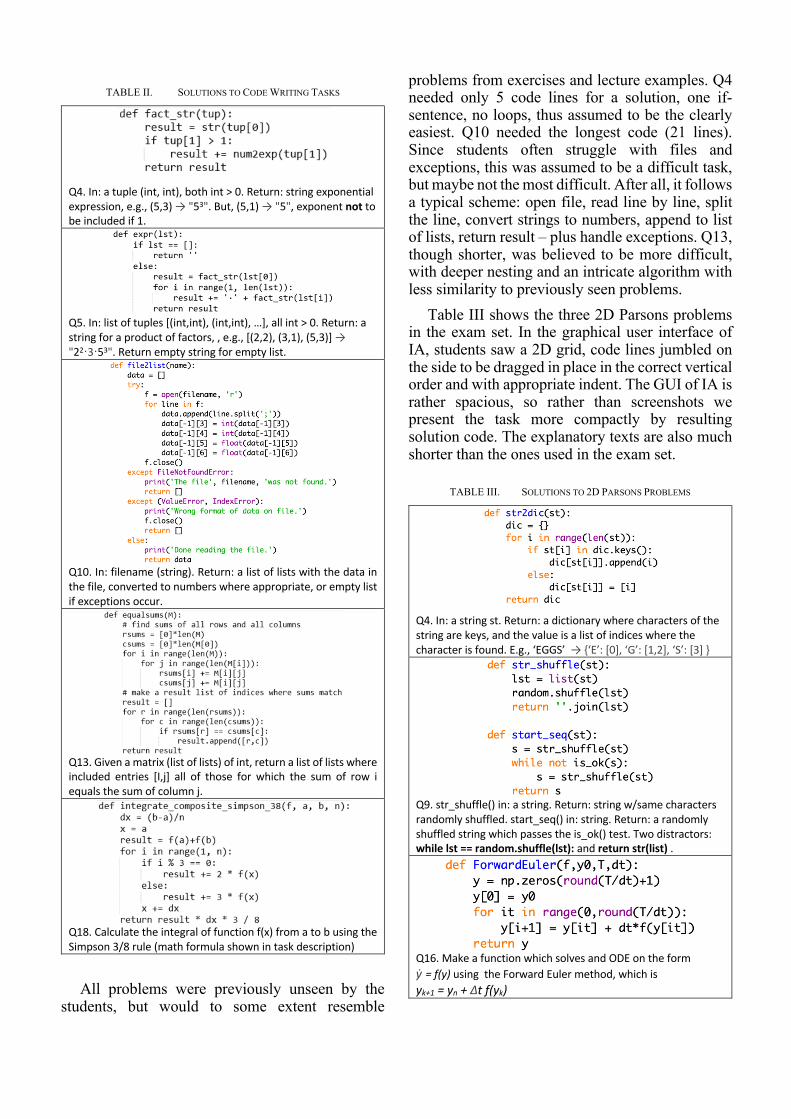
TABLE II. SOLUTIONS TO CODE WRITING TASKS
Q4. In: a tuple (int, int), both int > 0. Return: string exponential expression, e.g., (5,3) → "53". But, (5,1) → "5", exponent not to be included if 1.
Q5. In: list of tuples [(int,int), (int,int), …], all int > 0. Return: a string for a product of factors, , e.g., [(2,2), (3,1), (5,3)] → "22·3·53". Return empty string for empty list.
Q10. In: filename (string). Return: a list of lists with the data in the file, converted to numbers where appropriate, or empty list if exceptions occur.
Q13. Given a matrix (list of lists) of int, return a list of lists where included entries [I,j] all of those for which the sum of row i equals the sum of column j.
Q18. Calculate the integral of function f(x) from a to b using the Simpson 3/8 rule (math formula shown in task description)
All problems were previously unseen by the
students, but would to some extent resemble
problems from exercises and lecture examples. Q4 needed only 5 code lines for a solution, one if-sentence, no loops, thus assumed to be the clearly easiest. Q10 needed the longest code (21 lines). Since students often struggle with files and exceptions, this was assumed to be a difficult task, but maybe not the most difficult. After all, it follows a typical scheme: open file, read line by line, split the line, convert strings to numbers, append to list of lists, return result – plus handle exceptions. Q13, though shorter, was believed to be more difficult, with deeper nesting and an intricate algorithm with less similarity to previously seen problems.
Table III shows the three 2D Parsons problems in the exam set. In the graphical user interface of IA, students saw a 2D grid, code lines jumbled on the side to be dragged in place in the correct vertical order and with appropriate indent. The GUI of IA is rather spacious, so rather than screenshots we present the task more compactly by resulting solution code. The explanatory texts are also much shorter than the ones used in the exam set.
TABLE III. SOLUTIONS TO 2D PARSONS PROBLEMS
Q4. In: a string st. Return: a dictionary where characters of the string are keys, and the value is a list of indices where the character is found. E.g., ‘EGGS’ → {‘E’: [0], ‘G’: [1,2], ‘S’: [3] }
Q9. str_shuffle() in: a string. Return: string w/same characters randomly shuffled. start_seq() in: string. Return: a randomly shuffled string which passes the is_ok() test. Two distractors: while lst == random.shuffle(lst): and return str(list) .
Q16. Make a function which solves and ODE on the form ẏ = f(y) using the Forward Euler method, which is yk+1 = yn + Δt f(yk)
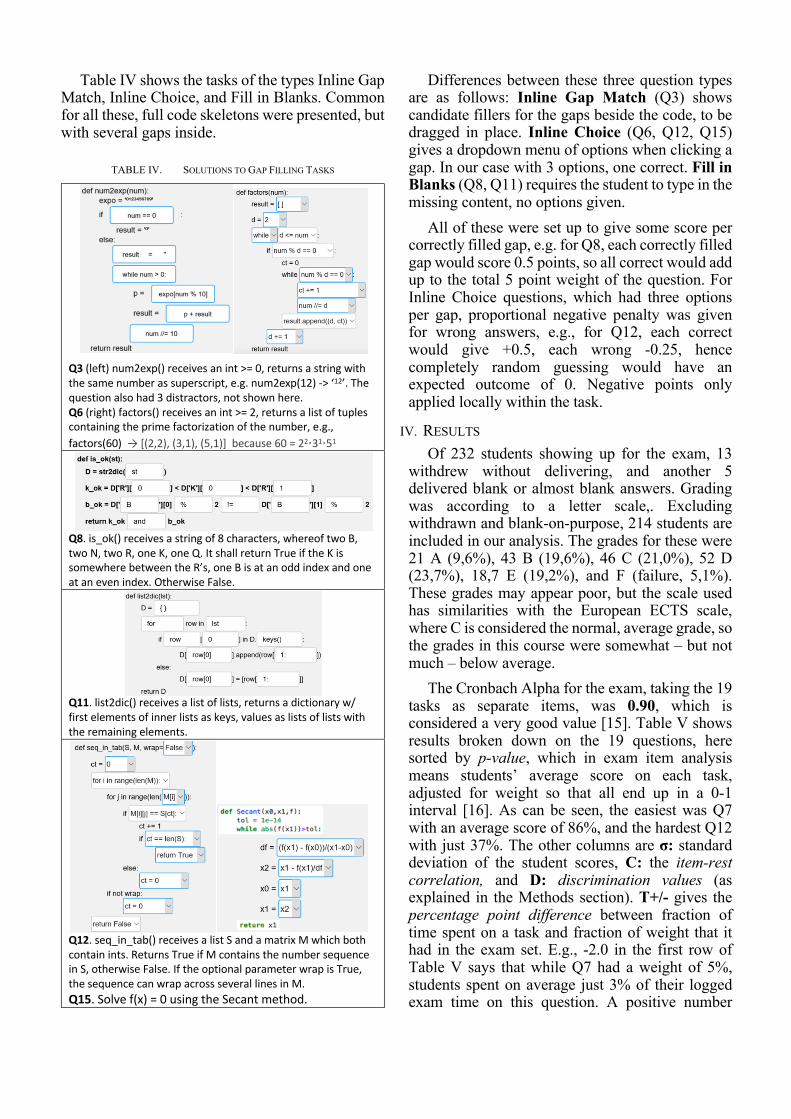
Table IV shows the tasks of the types Inline Gap Match, Inline Choice, and Fill in Blanks. Common for all these, full code skeletons were presented, but with several gaps inside.
TABLE IV. SOLUTIONS TO GAP FILLING TASKS
Q3 (left) num2exp() receives an int >= 0, returns a string with the same number as superscript, e.g. num2exp(12) -> ‘12’. The question also had 3 distractors, not shown here. Q6 (right) factors() receives an int >= 2, returns a list of tuples containing the prime factorization of the number, e.g., factors(60) → [(2,2), (3,1), (5,1)] because 60 = 22⋅31⋅51
Q8. is_ok() receives a string of 8 characters, whereof two B, two N, two R, one K, one Q. It shall return True if the K is somewhere between the R’s, one B is at an odd index and one at an even index. Otherwise False.
Q11. list2dic() receives a list of lists, returns a dictionary w/ first elements of inner lists as keys, values as lists of lists with the remaining elements.
Q12. seq_in_tab() receives a list S and a matrix M which both contain ints. Returns True if M contains the number sequence in S, otherwise False. If the optional parameter wrap is True, the sequence can wrap across several lines in M. Q15. Solve f(x) = 0 using the Secant method.
Differences between these three question types are as follows: Inline Gap Match (Q3) shows candidate fillers for the gaps beside the code, to be dragged in place. Inline Choice (Q6, Q12, Q15) gives a dropdown menu of options when clicking a gap. In our case with 3 options, one correct. Fill in Blanks (Q8, Q11) requires the student to type in the missing content, no options given.
All of these were set up to give some score per correctly filled gap, e.g. for Q8, each correctly filled gap would score 0.5 points, so all correct would add up to the total 5 point weight of the question. For Inline Choice questions, which had three options per gap, proportional negative penalty was given for wrong answers, e.g., for Q12, each correct would give +0.5, each wrong -0.25, hence completely random guessing would have an expected outcome of 0. Negative points only applied locally within the task.
IV. RESULTS Of 232 students showing up for the exam, 13
withdrew without delivering, and another 5 delivered blank or almost blank answers. Grading was according to a letter scale,. Excluding withdrawn and blank-on-purpose, 214 students are included in our analysis. The grades for these were 21 A (9,6%), 43 B (19,6%), 46 C (21,0%), 52 D (23,7%), 18,7 E (19,2%), and F (failure, 5,1%). These grades may appear poor, but the scale used has similarities with the European ECTS scale, where C is considered the normal, average grade, so the grades in this course were somewhat – but not much – below average.
The Cronbach Alpha for the exam, taking the 19 tasks as separate items, was 0.90, which is considered a very good value [15]. Table V shows results broken down on the 19 questions, here sorted by p-value, which in exam item analysis means students’ average score on each task, adjusted for weight so that all end up in a 0-1 interval [16]. As can be seen, the easiest was Q7 with an average score of 86%, and the hardest Q12 with just 37%. The other columns are σ: standard deviation of the student scores, C: the item-rest correlation, and D: discrimination values (as explained in the Methods section). T+/- gives the percentage point difference between fraction of time spent on a task and fraction of weight that it had in the exam set. E.g., -2.0 in the first row of Table V says that while Q7 had a weight of 5%, students spent on average just 3% of their logged exam time on this question. A positive number
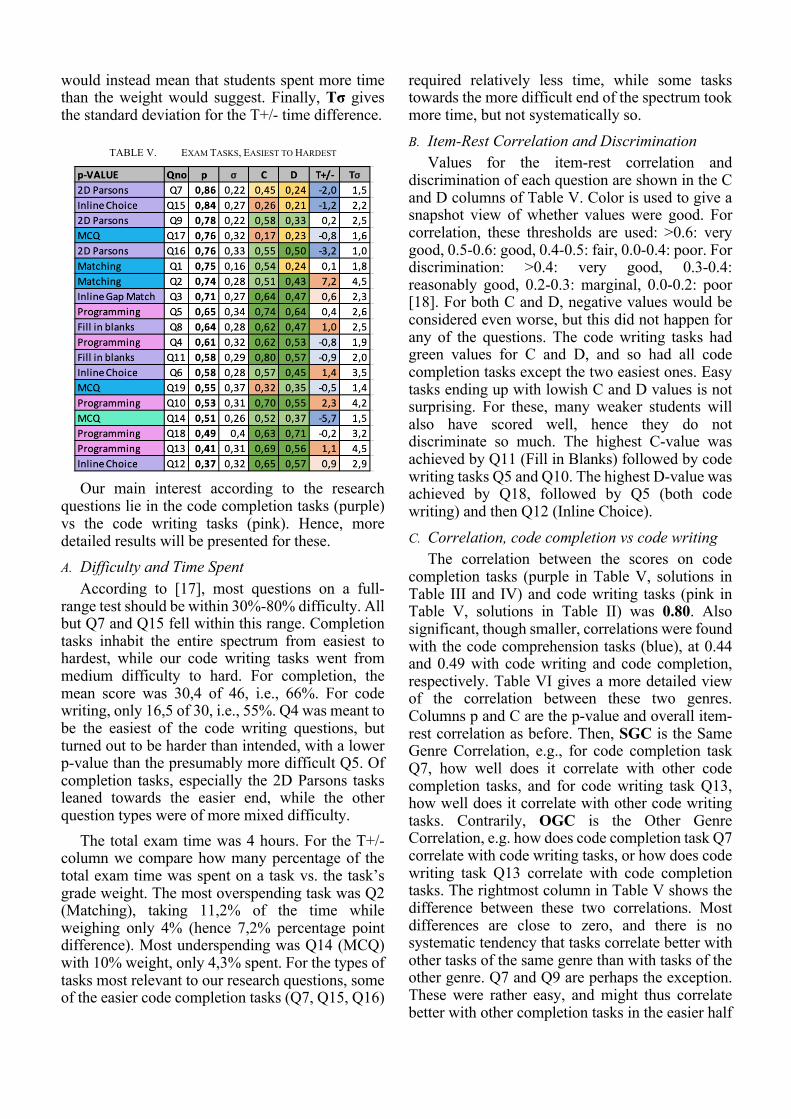
would instead mean that students spent more time than the weight would suggest. Finally, Tσ gives the standard deviation for the T+/- time difference.
TABLE V. EXAM TASKS, EASIEST TO HARDEST
Our main interest according to the research
questions lie in the code completion tasks (purple) vs the code writing tasks (pink). Hence, more detailed results will be presented for these. A. Difficulty and Time Spent
According to [17], most questions on a full-range test should be within 30%-80% difficulty. All but Q7 and Q15 fell within this range. Completion tasks inhabit the entire spectrum from easiest to hardest, while our code writing tasks went from medium difficulty to hard. For completion, the mean score was 30,4 of 46, i.e., 66%. For code writing, only 16,5 of 30, i.e., 55%. Q4 was meant to be the easiest of the code writing questions, but turned out to be harder than intended, with a lower p-value than the presumably more difficult Q5. Of completion tasks, especially the 2D Parsons tasks leaned towards the easier end, while the other question types were of more mixed difficulty.
The total exam time was 4 hours. For the T+/- column we compare how many percentage of the total exam time was spent on a task vs. the task’s grade weight. The most overspending task was Q2 (Matching), taking 11,2% of the time while weighing only 4% (hence 7,2% percentage point difference). Most underspending was Q14 (MCQ) with 10% weight, only 4,3% spent. For the types of tasks most relevant to our research questions, some of the easier code completion tasks (Q7, Q15, Q16)
required relatively less time, while some tasks towards the more difficult end of the spectrum took more time, but not systematically so. B. Item-Rest Correlation and Discrimination
Values for the item-rest correlation and discrimination of each question are shown in the C and D columns of Table V. Color is used to give a snapshot view of whether values were good. For correlation, these thresholds are used: >0.6: very good, 0.5-0.6: good, 0.4-0.5: fair, 0.0-0.4: poor. For discrimination: >0.4: very good, 0.3-0.4: reasonably good, 0.2-0.3: marginal, 0.0-0.2: poor [18]. For both C and D, negative values would be considered even worse, but this did not happen for any of the questions. The code writing tasks had green values for C and D, and so had all code completion tasks except the two easiest ones. Easy tasks ending up with lowish C and D values is not surprising. For these, many weaker students will also have scored well, hence they do not discriminate so much. The highest C-value was achieved by Q11 (Fill in Blanks) followed by code writing tasks Q5 and Q10. The highest D-value was achieved by Q18, followed by Q5 (both code writing) and then Q12 (Inline Choice). C. Correlation, code completion vs code writing
The correlation between the scores on code completion tasks (purple in Table V, solutions in Table III and IV) and code writing tasks (pink in Table V, solutions in Table II) was 0.80. Also significant, though smaller, correlations were found with the code comprehension tasks (blue), at 0.44 and 0.49 with code writing and code completion, respectively. Table VI gives a more detailed view of the correlation between these two genres. Columns p and C are the p-value and overall item-rest correlation as before. Then, SGC is the Same Genre Correlation, e.g., for code completion task Q7, how well does it correlate with other code completion tasks, and for code writing task Q13, how well does it correlate with other code writing tasks. Contrarily, OGC is the Other Genre Correlation, e.g. how does code completion task Q7 correlate with code writing tasks, or how does code writing task Q13 correlate with code completion tasks. The rightmost column in Table V shows the difference between these two correlations. Most differences are close to zero, and there is no systematic tendency that tasks correlate better with other tasks of the same genre than with tasks of the other genre. Q7 and Q9 are perhaps the exception. These were rather easy, and might thus correlate better with other completion tasks in the easier half
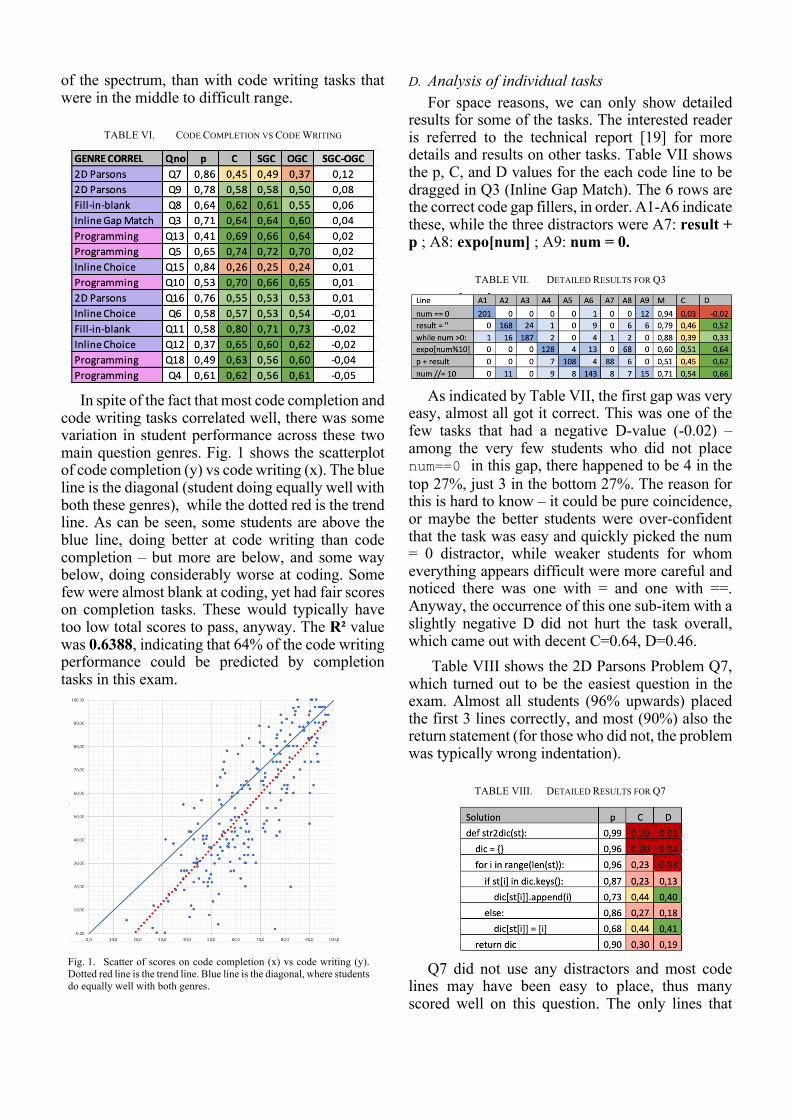
of the spectrum, than with code writing tasks that were in the middle to difficult range.
TABLE VI. CODE COMPLETION VS CODE WRITING
In spite of the fact that most code completion and
code writing tasks correlated well, there was some variation in student performance across these two main question genres. Fig. 1 shows the scatterplot of code completion (y) vs code writing (x). The blue line is the diagonal (student doing equally well with both these genres), while the dotted red is the trend line. As can be seen, some students are above the blue line, doing better at code writing than code completion – but more are below, and some way below, doing considerably worse at coding. Some few were almost blank at coding, yet had fair scores on completion tasks. These would typically have too low total scores to pass, anyway. The R² value was 0.6388, indicating that 64% of the code writing performance could be predicted by completion tasks in this exam.
Fig. 1. Scatter of scores on code completion (x) vs code writing (y). Dotted red line is the trend line. Blue line is the diagonal, where students do equally well with both genres.
D. Analysis of individual tasks For space reasons, we can only show detailed
results for some of the tasks. The interested reader is referred to the technical report [19] for more details and results on other tasks. Table VII shows the p, C, and D values for the each code line to be dragged in Q3 (Inline Gap Match). The 6 rows are the correct code gap fillers, in order. A1-A6 indicate these, while the three distractors were A7: result + p ; A8: expo[num] ; A9: num = 0.
TABLE VII. DETAILED RESULTS FOR Q3
As indicated by Table VII, the first gap was very
easy, almost all got it correct. This was one of the few tasks that had a negative D-value (-0.02) – among the very few students who did not place num==0 in this gap, there happened to be 4 in the top 27%, just 3 in the bottom 27%. The reason for this is hard to know – it could be pure coincidence, or maybe the better students were over-confident that the task was easy and quickly picked the num = 0 distractor, while weaker students for whom everything appears difficult were more careful and noticed there was one with = and one with ==. Anyway, the occurrence of this one sub-item with a slightly negative D did not hurt the task overall, which came out with decent C=0.64, D=0.46.
Table VIII shows the 2D Parsons Problem Q7, which turned out to be the easiest question in the exam. Almost all students (96% upwards) placed the first 3 lines correctly, and most (90%) also the return statement (for those who did not, the problem was typically wrong indentation).
TABLE VIII. DETAILED RESULTS FOR Q7
Q7 did not use any distractors and most code
lines may have been easy to place, thus many scored well on this question. The only lines that
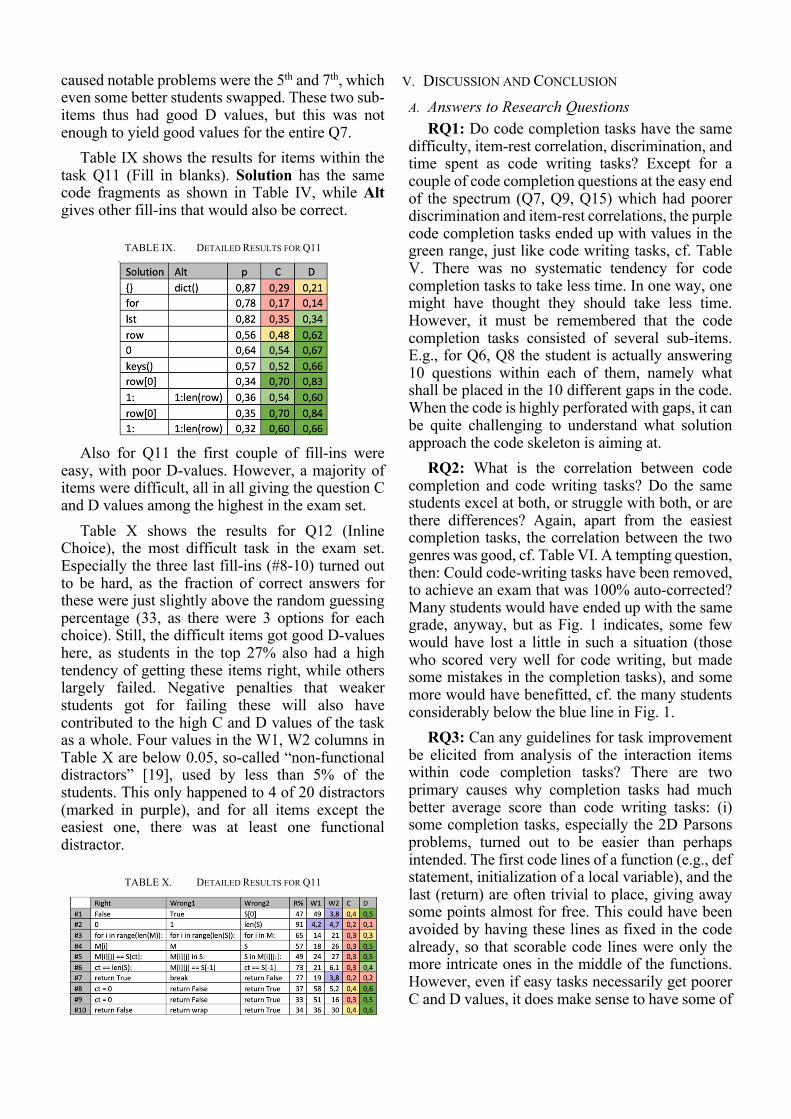
caused notable problems were the 5th and 7th, which even some better students swapped. These two sub-items thus had good D values, but this was not enough to yield good values for the entire Q7.
Table IX shows the results for items within the task Q11 (Fill in blanks). Solution has the same code fragments as shown in Table IV, while Alt gives other fill-ins that would also be correct.
TABLE IX. DETAILED RESULTS FOR Q11
Also for Q11 the first couple of fill-ins were
easy, with poor D-values. However, a majority of items were difficult, all in all giving the question C and D values among the highest in the exam set.
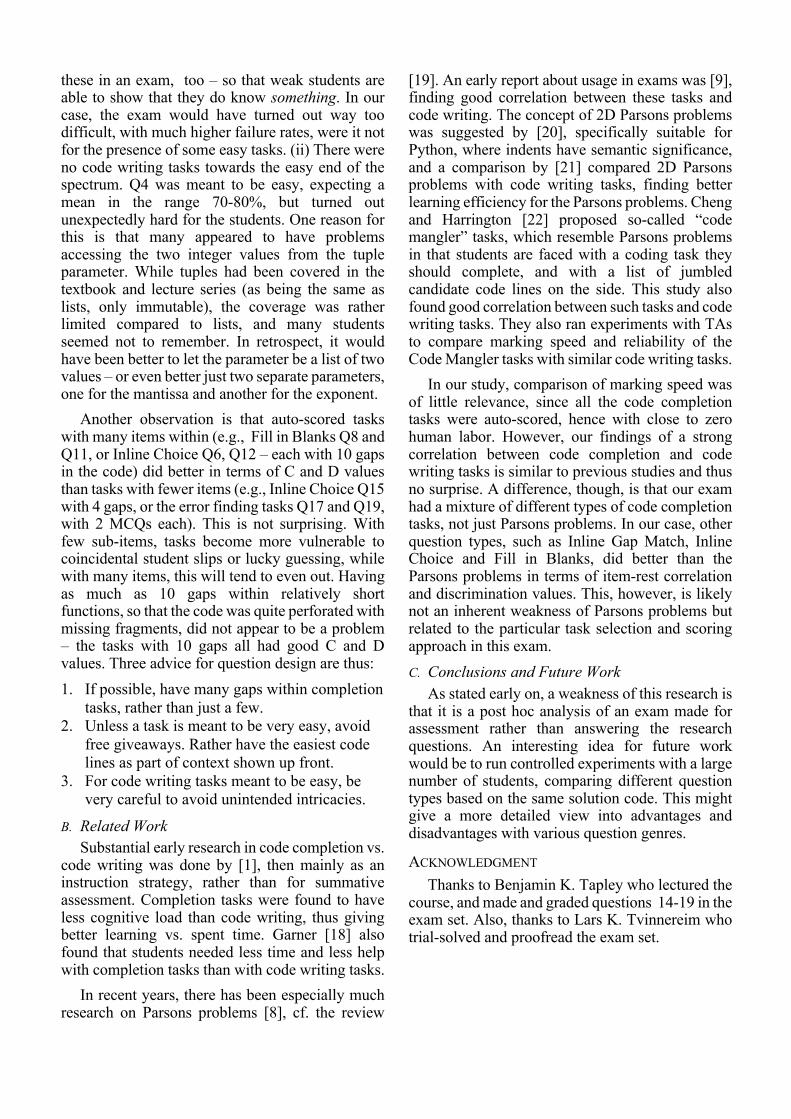
Table X shows the results for Q12 (Inline Choice), the most difficult task in the exam set. Especially the three last fill-ins (#8-10) turned out to be hard, as the fraction of correct answers for these were just slightly above the random guessing percentage (33, as there were 3 options for each choice). Still, the difficult items got good D-values here, as students in the top 27% also had a high tendency of getting these items right, while others largely failed. Negative penalties that weaker students got for failing these will also have contributed to the high C and D values of the task as a whole. Four values in the W1, W2 columns in Table X are below 0.05, so-called “non-functional distractors” [19], used by less than 5% of the students. This only happened to 4 of 20 distractors (marked in purple), and for all items except the easiest one, there was at least one functional distractor.
TABLE X. DETAILED RESULTS FOR Q11
V. DISCUSSION AND CONCLUSION A. Answers to Research Questions
RQ1: Do code completion tasks have the same difficulty, item-rest correlation, discrimination, and time spent as code writing tasks? Except for a couple of code completion questions at the easy end of the spectrum (Q7, Q9, Q15) which had poorer discrimination and item-rest correlations, the purple code completion tasks ended up with values in the green range, just like code writing tasks, cf. Table V. There was no systematic tendency for code completion tasks to take less time. In one way, one might have thought they should take less time. However, it must be remembered that the code completion tasks consisted of several sub-items. E.g., for Q6, Q8 the student is actually answering 10 questions within each of them, namely what shall be placed in the 10 different gaps in the code. When the code is highly perforated with gaps, it can be quite challenging to understand what solution approach the code skeleton is aiming at.
RQ2: What is the correlation between code completion and code writing tasks? Do the same students excel at both, or struggle with both, or are there differences? Again, apart from the easiest completion tasks, the correlation between the two genres was good, cf. Table VI. A tempting question, then: Could code-writing tasks have been removed, to achieve an exam that was 100% auto-corrected? Many students would have ended up with the same grade, anyway, but as Fig. 1 indicates, some few would have lost a little in such a situation (those who scored very well for code writing, but made some mistakes in the completion tasks), and some more would have benefitted, cf. the many students considerably below the blue line in Fig. 1.
RQ3: Can any guidelines for task improvement be elicited from analysis of the interaction items within code completion tasks? There are two primary causes why completion tasks had much better average score than code writing tasks: (i) some completion tasks, especially the 2D Parsons problems, turned out to be easier than perhaps intended. The first code lines of a function (e.g., def statement, initialization of a local variable), and the last (return) are often trivial to place, giving away some points almost for free. This could have been avoided by having these lines as fixed in the code already, so that scorable code lines were only the more intricate ones in the middle of the functions. However, even if easy tasks necessarily get poorer C and D values, it does make sense to have some of
these in an exam, too – so that weak students are able to show that they do know something. In our case, the exam would have turned out way too difficult, with much higher failure rates, were it not for the presence of some easy tasks. (ii) There were no code writing tasks towards the easy end of the spectrum. Q4 was meant to be easy, expecting a mean in the range 70-80%, but turned out unexpectedly hard for the students. One reason for this is that many appeared to have problems accessing the two integer values from the tuple parameter. While tuples had been covered in the textbook and lecture series (as being the same as lists, only immutable), the coverage was rather limited compared to lists, and many students seemed not to remember. In retrospect, it would have been better to let the parameter be a list of two values – or even better just two separate parameters, one for the mantissa and another for the exponent.
Another observation is that auto-scored tasks with many items within (e.g., Fill in Blanks Q8 and Q11, or Inline Choice Q6, Q12 – each with 10 gaps in the code) did better in terms of C and D values than tasks with fewer items (e.g., Inline Choice Q15 with 4 gaps, or the error finding tasks Q17 and Q19, with 2 MCQs each). This is not surprising. With few sub-items, tasks become more vulnerable to coincidental student slips or lucky guessing, while with many items, this will tend to even out. Having as much as 10 gaps within relatively short functions, so that the code was quite perforated with missing fragments, did not appear to be a problem – the tasks with 10 gaps all had good C and D values. Three advice for question design are thus: 1. If possible, have many gaps within completion
tasks, rather than just a few. 2. Unless a task is meant to be very easy, avoid
free giveaways. Rather have the easiest code lines as part of context shown up front.
3. For code writing tasks meant to be easy, be very careful to avoid unintended intricacies.
B. Related Work Substantial early research in code completion vs.
code writing was done by [1], then mainly as an instruction strategy, rather than for summative assessment. Completion tasks were found to have less cognitive load than code writing, thus giving better learning vs. spent time. Garner [18] also found that students needed less time and less help with completion tasks than with code writing tasks.
In recent years, there has been especially much research on Parsons problems [8], cf. the review
[19]. An early report about usage in exams was [9], finding good correlation between these tasks and code writing. The concept of 2D Parsons problems was suggested by [20], specifically suitable for Python, where indents have semantic significance, and a comparison by [21] compared 2D Parsons problems with code writing tasks, finding better learning efficiency for the Parsons problems. Cheng and Harrington [22] proposed so-called “code mangler” tasks, which resemble Parsons problems in that students are faced with a coding task they should complete, and with a list of jumbled candidate code lines on the side. This study also found good correlation between such tasks and code writing tasks. They also ran experiments with TAs to compare marking speed and reliability of the Code Mangler tasks with similar code writing tasks.
In our study, comparison of marking speed was of little relevance, since all the code completion tasks were auto-scored, hence with close to zero human labor. However, our findings of a strong correlation between code completion and code writing tasks is similar to previous studies and thus no surprise. A difference, though, is that our exam had a mixture of different types of code completion tasks, not just Parsons problems. In our case, other question types, such as Inline Gap Match, Inline Choice and Fill in Blanks, did better than the Parsons problems in terms of item-rest correlation and discrimination values. This, however, is likely not an inherent weakness of Parsons problems but related to the particular task selection and scoring approach in this exam. C. Conclusions and Future Work
As stated early on, a weakness of this research is that it is a post hoc analysis of an exam made for assessment rather than answering the research questions. An interesting idea for future work would be to run controlled experiments with a large number of students, comparing different question types based on the same solution code. This might give a more detailed view into advantages and disadvantages with various question genres.
ACKNOWLEDGMENT Thanks to Benjamin K. Tapley who lectured the
course, and made and graded questions 14-19 in the exam set. Also, thanks to Lars K. Tvinnereim who trial-solved and proofread the exam set.
REFERENCES [1] J. J. Van Merriënboer and M. B. De Croock, “Strategies for computer-
based programming instruction: Program completion vs. program generation”. Journal of Educational Computing Research, 8(3), 365-394, 1992.
[2] M. Lopez, J. Whalley, P. Robbins, and R. Lister, “Relationships between reading, tracing and writing skills in introductory programming”. In Proceedings of the fourth international workshop on computing education research, pp. 101-112, September 2008.
[3] S. Shuhidan, M. Hamilton, and D. D'Souza, “A taxonomic study of novice programming summative assessment”. In Proceedings of the Eleventh Australasian Conference on Computing Education-Volume 95 (pp. 147-156), 2009.
[4] R. Lister, et al., “Naturally occurring data as research instrument: analyzing examination responses to study the novice programmer”. ACM SIGCSE Bulletin, 41(4), pp. 156-173, 2010.
[5] J. Sheard, et al., “Exploring programming assessment instruments: a classification scheme for examination questions”. In Proceedings of the seventh international workshop on Computing education research, pp. 33-38), August 2011.
[6] A. Luxton-Reilly and A. Petersen, “The compound nature of novice programming assessments”. In Proceedings of the Nineteenth Australasian Computing Education Conference, pp. 26-35, January 2017.
[7] D. Zingaro, A. Petersen, and M. Craig, “Stepping up to integrative questions on CS1 exams”. In Proceedings of the 43rd ACM technical symposium on Computer Science Education, pp. 253-258, February 2012.
[8] D. Parsons and P. Haden, “Parson's programming puzzles: a fun and effective learning tool for first programming courses”. In Proceedings of the 8th Australasian Conference on Computing Education-Volume 52 , pp. 157-163, January 2006.
[9] P. Denny, A. Luxton-Reilly, and B. Simon, “Evaluating a new exam question: Parsons problems”. In Proceedings of the fourth international workshop on computing education research, pp. 113-124, September, 2008.
[10] J. Harland, D. D'Souza, and M. Hamilton, “A comparative analysis of results on programming exams”. In Proceedings of the Fifteenth
Australasian Computing Education Conference-Volume 136, pp. 117-126, January 2013.
[11] L. J. Cronbach, “Coefficient alpha and the internal structure of tests”. Psychometrika. 16, 297-334, 1951.
[12] T. M. Bechger, G. Maris, H. H. Verstralen, and A. A. Béguin, “Using classical test theory in combination with item response theory”. Applied psychological measurement, 27(5), 319-334, 2003.
[13] E. S. Pearson, “The test of significance for the correlation coefficient”. Journal of the American Statistical Association, 26, 128-134, 1931.
[14] T. L. Kelley, “The selection of upper and lower groups for validation of test items”. J Educ Psychol 30: 17-24, 1939.
[15] J. C. Nunnally, “Psychometric Theory”, New York: McGraw-Hill, 1978.
[16] R. K. Hambleton, H. Swaminathan, and H. J. Rogers, “Fundamentals of item response theory”, Newbury Park, CA: Sage, 1991.
[17] J. Kehoe, “Basic item analysis for multiple-choice tests”. Practical Assessment, Research, and Evaluation, 4(1), 10, 1994.
[18] R. L. Ebel and D. A. Frisbie, “Essentials of Educational Measurement”, 5th Ed. Englewood Cliffs, NJ: Prentice-Hall, 1991.
[19] J. M. Kilgour and S. Tayyaba, “An investigation into the optimal number of distractors in single-best answer exams”. Advances in Health Sciences Education, 21(3), 571-585, 2016.
[20] S. Garner, “An Exploration of How a Technology-Facilitated Part-Complete Solution Method Supports the Learning of Computer Programming”. Issues in Informing Science & Information Technology, 4, 2007
[21] Y. Du, A. Luxton-Reilly, and P. Denny, “A Review of Research on Parsons Problems”. In Proceedings of the Twenty-Second Australasian Computing Education Conference, pp. 195-202, February 2020.
[22] P. Ihantola and V. Karavirta, “Two-dimensional Parson’s puzzles: The concept, tools, and first observations”. Journal of Information Technology Education, 10(2), 119-132, 2011.
[23] Ericson, B. J., Margulieux, L. E., & Rick, J. (2017, November). Solving parsons problems versus fixing and writing code. In Proceedings of the 17th Koli Calling International Conference on Computing Education Research (pp. 20-29).
[24] Cheng & Harrington. "The Code Mangler: Evaluating Coding Ability Without Writing any Code." Proceedings of the 2017 SIGCSE 2017.