cochlear annual report 2006 · ... the financial year were prof bdo anderson, ... dividends paid or...
TRANSCRIPT

Cochlear Annual Report 2006

Financial ReportCOCHLEAR LIMITED AND ITS CONTROLLED ENTITIES FINANCIAL REPORT FOR THE YEAR ENDED 30 JUNE 2006
Contents 36 Directors’ Report
49 Income statements
50 Statements of recognised income and expense
51 Balance sheets
52 Statements of cash flows
53 Notes to the financial statements
104 Directors’ Declaration
105 Independent Audit Report
106 Additional information


36
COCHLEAR ANNUAL REPORT 2006
The directors present their report, together with the Financial Report of Cochlear Limited (Company) and the Consolidated Financial Report of the Consolidated Entity (Cochlear), being the Company and its controlled entities, for the year ended 30 June 2006, and the Auditors’ Report thereon.
DirectorsThe directors of the Company in office at any time during the financial year were Prof BDO Anderson, AO, Mr PR Bell, Mr TCE Bergman, Prof E Byrne, AO, Mr R Holliday-Smith, Mr PJ North, AM, Mr DP O’Dwyer, Dr JL Parker, Dr CG Roberts and Mr JH Veeneklaas. Information on the directors is presented on page 26 of the Annual Report.
Directors’ meetings
The number of directors’ meetings (including meetings of committees of directors) and number of meetings attended by each of the directors of the Company during the financial year are:
Board of directors Audit Committee Medical ScienceCommittee
NominationsCommittee
RemunerationCommittee
Technology andInnovation
Committee
Held(i) Attended(ii) Held(i) Attended(ii) Held(i) Attended(ii) Held(i) Attended(ii) Held(i) Attended(ii) Held(i) Attended(ii)
Mr TCE Bergman 8 8 5 5 - - 2 2 5 5 - -
Prof BDO Anderson, AO(iii) 4 3 - - 1 1 1 1 - - 2 2
Mr PR Bell(iv) 7 6 - - - - 1 1 4 4 3 2
Prof E Byrne, AO 8 8 - - 2 2 2 2 - - 4 4
Mr R Holliday-Smith 8 8 5 5 - - 2 2 5 5 - -
Mr PJ North, AM 8 8 5 5 - - 2 2 - - 4 4
Mr DP O’Dwyer(iv) 7 7 - - 1 1 1 1 - - 3 3
Dr JL Parker 8 8 - - - - - - - - 4 4
Dr CG Roberts 8 8 - - 2 2 - - - - 4 4
Mr JH Veeneklaas 8 6 - - - - 2 2 5 3 4 2
(i) Number of meetings held while in office.
(ii) Number of meetings attended.
(iii) Prof BDO Anderson, AO retired on 20 October 2005.
(iv) Mr PR Bell and Mr DP O’Dwyer were appointed on 1 August 2005.
Principal activities and review of operations and resultsThe principal activities and a review of the operations of the Consolidated Entity during the year ended 30 June 2006, and the results of these operations are set out in the CEO/President’s Report and the Financial discussion and analysis.
Other than as discussed in the CEO/President’s Report and the Financial discussion and analysis, there were no significant changes in the nature of those activities during the year ended 30 June 2006 and the results of those operations are set out in the above-mentioned reports.
Consolidated results
The consolidated results for the financial year are:
2006 2005
$000 $000
Revenue 452,260 348,966
Profit before tax 108,835 82,307
Net profit attributable to equity holders of the parent 80,032 59,642
Basic earnings per share (cents) 146.8 110.1
Diluted earnings per share (cents) 145.2 109.7
Directors’ Report Cochlear Limited for the year ended 30 June 2006

37
Dividends
Dividends paid or declared by the Company to members since the end of the previous financial year are:
Type Cents per share Total amount $000
Date of payment Tax rate for franking credit
In respect of the previous financial year :Final – ordinary shares 45.0 24,430 22 September 2005 30%
In respect of the current financial year :Interim – ordinary shares 45.0 24,666 14 March 2006 30%
All the dividends paid or declared by the Company since the end of the previous financial year were 100% franked.
The final dividend in respect of the current financial year has not been provided for in the Financial Report as it was not declared until after 30 June 2006. Since the end of the financial year, the directors declared a final 55.0 cents per share dividend 100% franked at the tax rate of 30% amounting to a total of $30,147,062.
Environmental regulations
The Consolidated Entity’s operations are not subject to any significant environmental regulations under either Commonwealth of Australia or State/Territory legislation. However, the Board believes that the Consolidated Entity has adequate systems in place to manage its environmental obligations and is not aware of any breach of those environmental requirements as they apply to the Consolidated Entity.
Non-audit services
During the year, KPMG, the Company’s auditor, has performed certain other services in addition to its statutory duties. The Board has considered the non-audit services provided during the year by the auditor and in accordance with written advice provided by resolution of the Audit Committee, and is satisfied that the provision of those non-audit services during the year by the auditor is compatible with, and did not compromise, the auditor independence requirements of the Corporations Act 2001 for the following reasons:
• all non-audit services were subject to the corporate governance procedures adopted by the Company and have been reviewed by the Audit Committee to ensure that they do not impact the integrity and objectivity of the auditor ; and
• the non-audit services provided do not undermine the general principles relating to auditor independence.
A copy of the auditor’s independence declaration as required under section 307C of the Corporations Act 2001 is included in this Report. Refer to Note 5 of the financial statements for the detail and amount of both audit and non-audit services.
State of affairs
The significant changes to the state of affairs of the Consolidated Entity during the financial year were as follows:
• on 21 September 2005, the Company issued 14,170 ordinary shares to eligible employees of the Consolidated Entity under the Employee Share Plan for nil consideration;
• on 21 September 2005, the Company issued 453,500 ordinary shares to eligible employees of the Consolidated Entity under the Executive Share Option Plan (ESOP) for $38.12 per share consideration;
• on 16 December 2005, the Company issued 55,693 shares in trust to eligible employees of the Consolidated Entity under the Cochlear Executive Long Term Incentive Plan (CELTIP) for nil consideration;
• on 5 May 2006, a $270 million order was placed by a major healthcare organisation based in Taipei to supply Nucleus cochlear implants in Taiwan and China over approximately the next six years;
• the Consolidated Entity incurred capital expenditure of $15.0 million. This comprised of leasehold improvements of $1.8 million, plant and equipment of $12.5 million and the enterprise resource planning system of $0.7 million; and
• from the financial year beginning 1 July 2005, the Consolidated Entity has complied with Australian equivalents to International Financial Reporting Standards (AIFRS) as issued by the Australian Accounting Standards Board.
Likely developments
Further information as to likely developments in the operations of the Consolidated Entity and the expected results of those operations in subsequent financial years has not been included in this Directors’ Report because the directors believe, on reasonable grounds, that to include such information would be likely to result in unreasonable prejudice to the Consolidated Entity.

38
COCHLEAR ANNUAL REPORT 2006
Remuneration Report
Remuneration Committee
The Remuneration Committee operates under delegated authority of the Board. The Remuneration Committee approves the Remuneration Policy and structure for executives and executive directors (senior executives) and makes recommendations to the Board on the total remuneration packages of each senior executive.
External advice on remuneration matters is obtained and is made available for the Remuneration Committee.
Remuneration policies – audited
The Board recognises that Cochlear’s performance is dependent on the quality of its people. To successfully achieve its financial and operating objectives in a complex and global environment, Cochlear must be able to attract, motivate and retain highly skilled senior executives who are dedicated to the interests of shareholders. Cochlear adopts a total remuneration approach for senior executives. The key principles that underpin Cochlear’s Remuneration Policy include:
• a competitive Total Remuneration Strategy provided to attract, motivate and retain senior executive talent;
• a significant proportion (up to 50% of total fixed remuneration) of total senior executive remuneration linked to financial performance and business objectives, under the Cochlear Management Short Term Incentive Plan (CMSTIP); and
• a significant proportion (up to 40% of total fixed remuneration) of total senior executive remuneration linked to the creation of long-term value for shareholders under the CELTIP.
The Remuneration Policy assists Cochlear to achieve its business strategy and objectives. The Remuneration Committee recognises that, while remuneration is a key factor in recruiting the right people, it is not the only factor. Cochlear’s corporate reputation, its ethical culture and values and its ability to provide interesting and challenging career opportunities, also play an important role.
Remuneration structure
Senior executives – auditedRemuneration of the senior executives is comprised of policies and programs under the following categories:
• total fixed remuneration made up of base salary and superannuation, retirement benefits and other incidental benefits; and
• variable remuneration made up of an annual short-term incentive plan and long-term incentives.
The remuneration structure is designed to strike a balance between fixed and variable remuneration. Variable remuneration is tied to performance and is at risk.
Service contracts – auditedCochlear does not enter into service contracts for senior executives, other than the CEO/President. Senior executives operate under standard termination and redundancy conditions with the following exceptions. The President, Asia Pacific Region has a notice period of three months and the President, European Region has a notice period of six months. The President, European Region will receive a maximum of CHF 30,000 for repatriation costs in the case of termination or resignation.
The CEO/President’s conditions are set out separately in this Remuneration Report.
Base salary and benefits – auditedBase salaries are determined by reference to appropriate benchmark information, taking into account an individual’s responsibilities, performance, qualifications, experience and geographical location.
In addition to base salary, selected overseas based executives receive additional benefits including health insurance, a car allowance and a relocation allowance. In Australia, retirement benefits are paid in line with the statutory Superannuation Guarantee legislation levels. In July 2005, members of the legacy defined benefit plan (Plan) were given the opportunity to transfer to the accumulation fund with ongoing contributions based on the estimated required Company contributions under the Plan actuarial assessments to ensure that employees are not adversely prejudiced by the move. The transfer of all members was completed in the first half of the 2006 financial year.
Globally, retirement benefits are paid in line with local legislation and practice.
Directors’ Report Cochlear Limited for the year ended 30 June 2006

39
Variable remuneration – unaudited
The Board believes that well designed and managed short-term and long-term incentive plans are important elements of employee remuneration, providing tangible incentives for senior executives to achieve Cochlear’s short-term and long-term performance goals. Participation in these plans encourages greater involvement by senior executives to share in the future growth, prosperity and profitability of Cochlear in a way that gives them a community of interest with shareholders.
The proportions of variable remuneration opportunity vary for senior executives within Cochlear, reflecting an individual’s responsibilities, performance and experience.
Cochlear Management Short Term Incentive Plan – auditedShort-term incentives for senior executives are determined under the CMSTIP. The short-term incentive is structured in such a way that a significant part of the senior executive’s package depends upon achievement of individual performance goals linked to the business objectives and the financial performance of Cochlear. Financial measures include revenue and earnings before interest and taxes targets. Short-term incentives are paid on both the half and full year results.
The percentage of total remuneration that is allocated to short-term incentives varies according to the senior executive’s position and the range is 30% – 50% of total fixed remuneration for achieving all budgeted targets. In years of exceptional performance, the short-term incentives could increase to 100% of total fixed remuneration.
The process of determining relevant performance measures and whether they are met is as follows:
• at the beginning of the financial year, the Remuneration Committee recommends to the Board the targets for the CEO/President and the other senior executives. These are dependent on financial objectives and agreement between the CEO/President and the senior executive on individual performance goals; and
• the CEO/President and the other senior executives and then the CEO/President and Chairman assess progress towards the financial and individual performance goals. The Remuneration Committee reviews, and the Board approves, these assessments prior to any payment.
The Remuneration Committee also evaluates the proposed short-term incentive awards in aggregate and determines their appropriateness having regard to Cochlear’s overall financial results. After this assessment, the Remuneration Committee makes its recommendation to the Board for payment.
Once approved by the Board, the short-term incentive awards are paid to participants. This occurs on a half and full year basis.
Cochlear Executive Long Term Incentive Plan – auditedThe CELTIP was approved by shareholders at the 2003 Annual General Meeting (AGM). The CELTIP is designed to reward senior executives for achieving long-term growth in shareholder value.
Senior executives are offered a mixture of options (being options to acquire ordinary shares in Cochlear Limited) and performance shares (being units of fully paid ordinary shares in Cochlear Limited).
The number of options and performance shares offered to a senior executive depends on their fixed remuneration and Cochlear’s target remuneration package for the senior executive’s position. The mixture of options and performance shares is determined at the discretion of the Board, having regard to the senior executive’s role.
The exercise price of the options is based on the weighted average price of Cochlear Limited’s shares traded during the five business days following the date of the provision of the final preliminary report to the Australian Stock Exchange (ASX) in August each year. All options refer to options over ordinary shares of Cochlear Limited. Each option is convertible to one ordinary share. All performance shares are ordinary shares of Cochlear Limited. Each performance share equates to one ordinary share.
40
COCHLEAR ANNUAL REPORT 2006
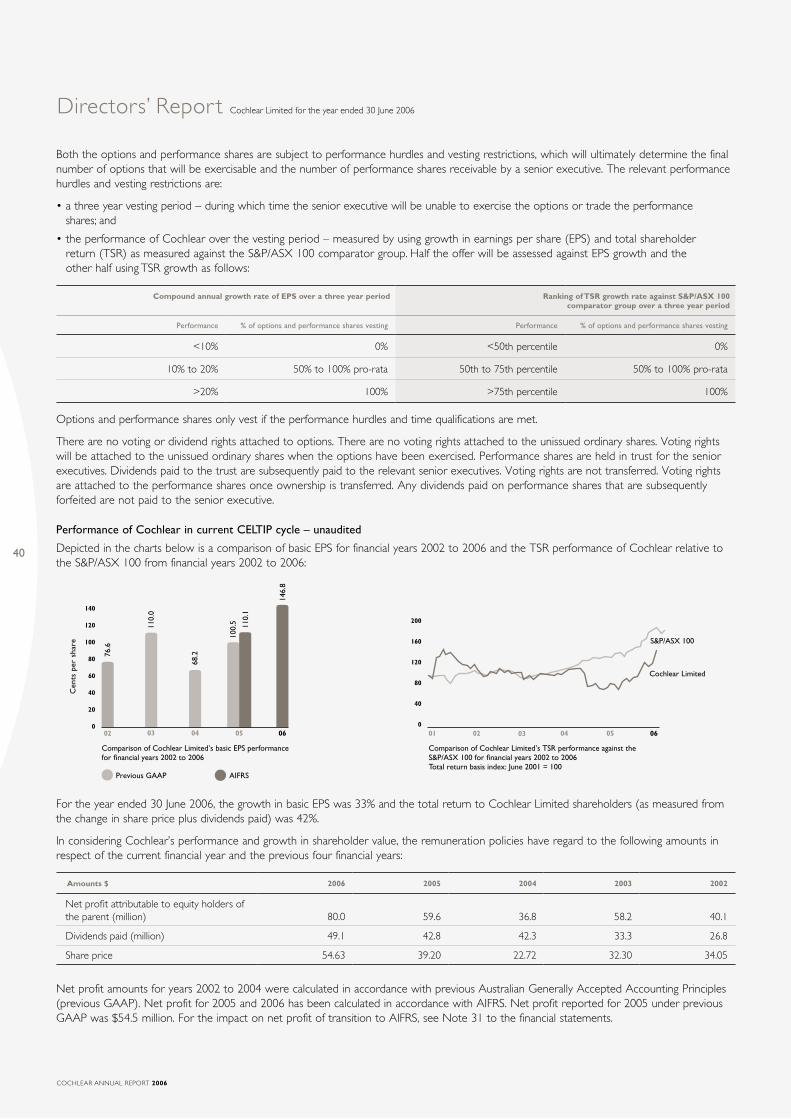
Both the options and performance shares are subject to performance hurdles and vesting restrictions, which will ultimately determine the final number of options that will be exercisable and the number of performance shares receivable by a senior executive. The relevant performance hurdles and vesting restrictions are:
• a three year vesting period – during which time the senior executive will be unable to exercise the options or trade the performance shares; and
• the performance of Cochlear over the vesting period – measured by using growth in earnings per share (EPS) and total shareholder return (TSR) as measured against the S&P/ASX 100 comparator group. Half the offer will be assessed against EPS growth and the other half using TSR growth as follows:
Compound annual growth rate of EPS over a three year period Ranking of TSR growth rate against S&P/ASX 100 comparator group over a three year period
Performance % of options and performance shares vesting Performance % of options and performance shares vesting
<10% 0% <50th percentile 0%
10% to 20% 50% to 100% pro-rata 50th to 75th percentile 50% to 100% pro-rata
>20% 100% >75th percentile 100%
Options and performance shares only vest if the performance hurdles and time qualifications are met.
There are no voting or dividend rights attached to options. There are no voting rights attached to the unissued ordinary shares. Voting rights will be attached to the unissued ordinary shares when the options have been exercised. Performance shares are held in trust for the senior executives. Dividends paid to the trust are subsequently paid to the relevant senior executives. Voting rights are not transferred. Voting rights are attached to the performance shares once ownership is transferred. Any dividends paid on performance shares that are subsequently forfeited are not paid to the senior executive.
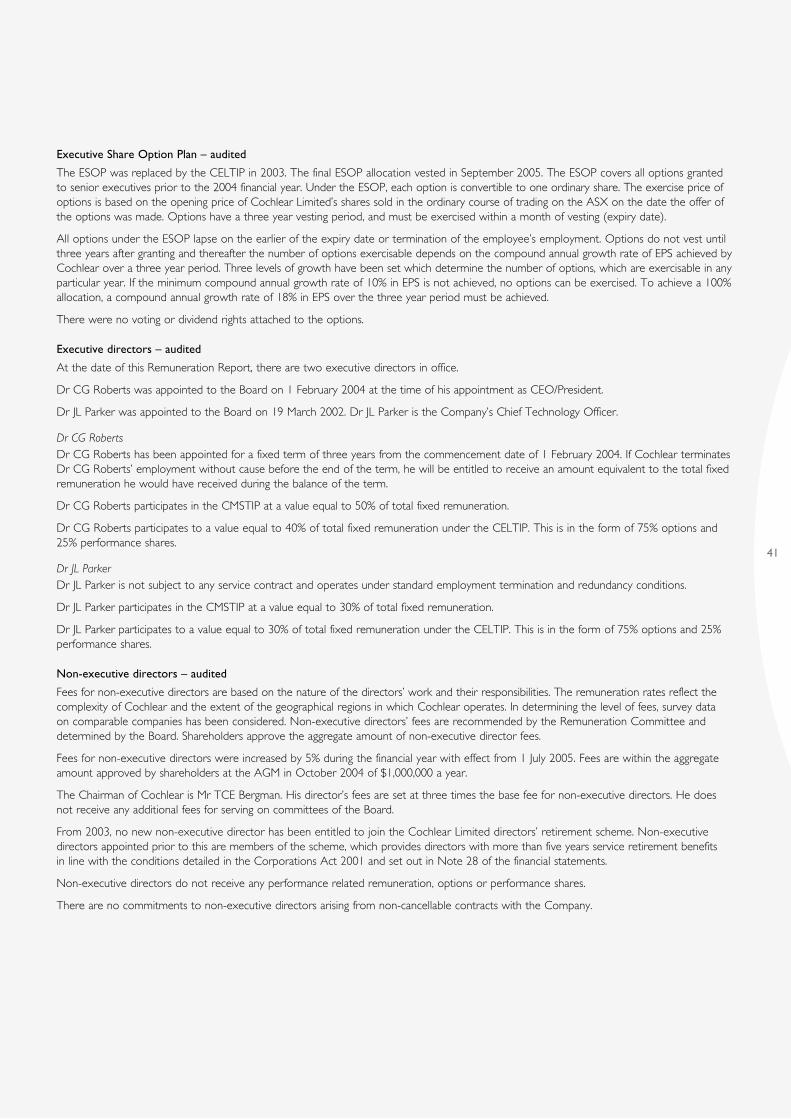
Performance of Cochlear in current CELTIP cycle – unaudited
Depicted in the charts below is a comparison of basic EPS for financial years 2002 to 2006 and the TSR performance of Cochlear relative to the S&P/ASX 100 from financial years 2002 to 2006:
For the year ended 30 June 2006, the growth in basic EPS was 33% and the total return to Cochlear Limited shareholders (as measured from the change in share price plus dividends paid) was 42%.
In considering Cochlear’s performance and growth in shareholder value, the remuneration policies have regard to the following amounts in respect of the current financial year and the previous four financial years:
Amounts $ 2006 2005 2004 2003 2002
Net profit attributable to equity holders of the parent (million) 80.0 59.6 36.8 58.2 40.1
Dividends paid (million) 49.1 42.8 42.3 33.3 26.8
Share price 54.63 39.20 22.72 32.30 34.05
Net profit amounts for years 2002 to 2004 were calculated in accordance with previous Australian Generally Accepted Accounting Principles (previous GAAP). Net profit for 2005 and 2006 has been calculated in accordance with AIFRS. Net profit reported for 2005 under previous GAAP was $54.5 million. For the impact on net profit of transition to AIFRS, see Note 31 to the financial statements.
Directors’ Report Cochlear Limited for the year ended 30 June 2006
0302 0604 0501
Comparison of Cochlear Limited’s TSR performance against the S&P/ASX 100 for financial years 2002 to 2006Total return basis index: June 2001 = 100
0
40
80
120
160
200
Cochlear Limited
S&P/ASX 100
20
40
60
80
100
120 110.
0
Comparison of Cochlear Limited’s basic EPS performance for financial years 2002 to 2006
04 0605
76.6
02 030
Cen
ts p
er s
hare
146.
8
Previous GAAP AIFRS
68.2
100.
5 110.
1140
41
Executive Share Option Plan – audited
The ESOP was replaced by the CELTIP in 2003. The final ESOP allocation vested in September 2005. The ESOP covers all options granted to senior executives prior to the 2004 financial year. Under the ESOP, each option is convertible to one ordinary share. The exercise price of options is based on the opening price of Cochlear Limited’s shares sold in the ordinary course of trading on the ASX on the date the offer of the options was made. Options have a three year vesting period, and must be exercised within a month of vesting (expiry date).
All options under the ESOP lapse on the earlier of the expiry date or termination of the employee’s employment. Options do not vest until three years after granting and thereafter the number of options exercisable depends on the compound annual growth rate of EPS achieved by Cochlear over a three year period. Three levels of growth have been set which determine the number of options, which are exercisable in any particular year. If the minimum compound annual growth rate of 10% in EPS is not achieved, no options can be exercised. To achieve a 100% allocation, a compound annual growth rate of 18% in EPS over the three year period must be achieved.
There were no voting or dividend rights attached to the options.
Executive directors – audited
At the date of this Remuneration Report, there are two executive directors in office.
Dr CG Roberts was appointed to the Board on 1 February 2004 at the time of his appointment as CEO/President.
Dr JL Parker was appointed to the Board on 19 March 2002. Dr JL Parker is the Company’s Chief Technology Officer.
Dr CG RobertsDr CG Roberts has been appointed for a fixed term of three years from the commencement date of 1 February 2004. If Cochlear terminates Dr CG Roberts’ employment without cause before the end of the term, he will be entitled to receive an amount equivalent to the total fixed remuneration he would have received during the balance of the term.
Dr CG Roberts participates in the CMSTIP at a value equal to 50% of total fixed remuneration.
Dr CG Roberts participates to a value equal to 40% of total fixed remuneration under the CELTIP. This is in the form of 75% options and 25% performance shares.
Dr JL ParkerDr JL Parker is not subject to any service contract and operates under standard employment termination and redundancy conditions.
Dr JL Parker participates in the CMSTIP at a value equal to 30% of total fixed remuneration.
Dr JL Parker participates to a value equal to 30% of total fixed remuneration under the CELTIP. This is in the form of 75% options and 25% performance shares.
Non-executive directors – audited
Fees for non-executive directors are based on the nature of the directors’ work and their responsibilities. The remuneration rates reflect the complexity of Cochlear and the extent of the geographical regions in which Cochlear operates. In determining the level of fees, survey data on comparable companies has been considered. Non-executive directors’ fees are recommended by the Remuneration Committee and determined by the Board. Shareholders approve the aggregate amount of non-executive director fees.
Fees for non-executive directors were increased by 5% during the financial year with effect from 1 July 2005. Fees are within the aggregate amount approved by shareholders at the AGM in October 2004 of $1,000,000 a year.
The Chairman of Cochlear is Mr TCE Bergman. His director’s fees are set at three times the base fee for non-executive directors. He does not receive any additional fees for serving on committees of the Board.
From 2003, no new non-executive director has been entitled to join the Cochlear Limited directors’ retirement scheme. Non-executive directors appointed prior to this are members of the scheme, which provides directors with more than five years service retirement benefits in line with the conditions detailed in the Corporations Act 2001 and set out in Note 28 of the financial statements.
Non-executive directors do not receive any performance related remuneration, options or performance shares.
There are no commitments to non-executive directors arising from non-cancellable contracts with the Company.

42
COCHLEAR ANNUAL REPORT 2006
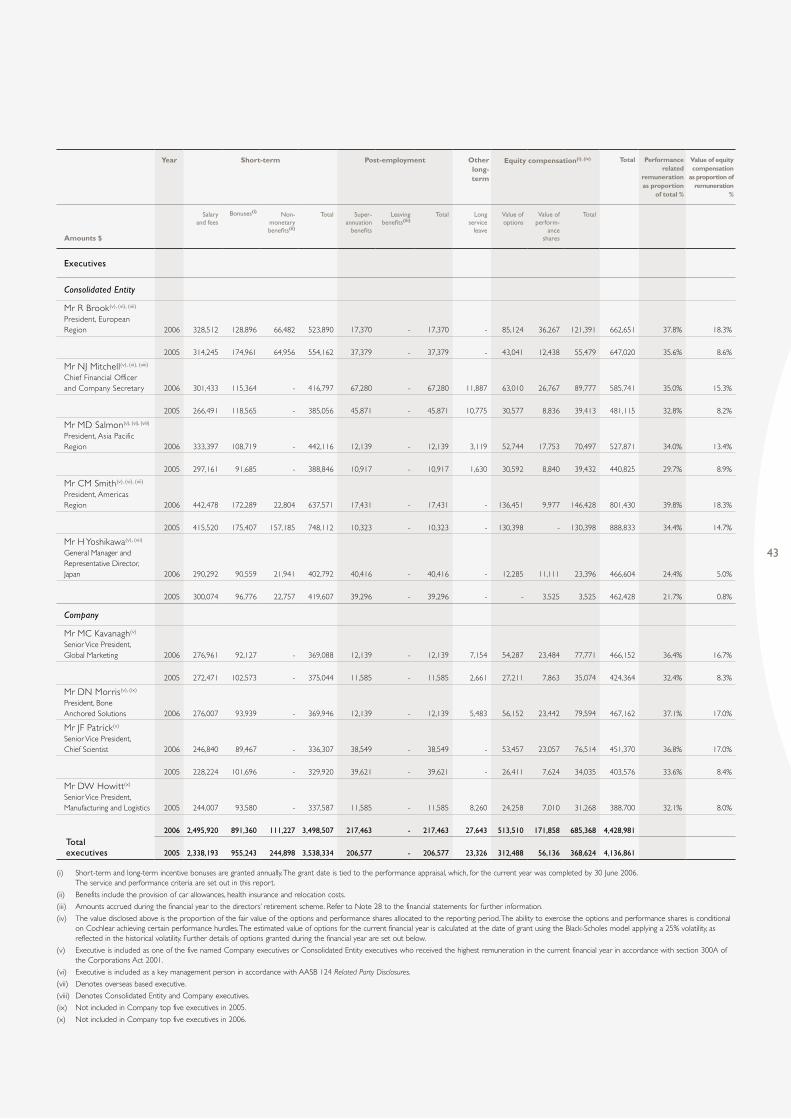
Directors’ and senior executives’ remuneration details – audited
The following table provides the details of all directors and the executives of Cochlear with the greatest authority (key management personnel), and each of the five named officers of the Company and Consolidated Entity receiving the highest remuneration. Comparatives are disclosed in the 2005 Remuneration Report.
Details of the nature and amount of each major element of remuneration are:
Year Short-term Post-employment Other long-term
Equity compensation(i), (iv) Total Performance related
remuneration as proportion
of total %
Value of equity compensation
as proportion of remuneration
%
Amounts $
Salary and fees
Bonuses(i) Non-monetary benefits(ii)
Total Super- annuation
benefits
Leaving benefits(iii)
Total Long service
leave
Value of options
Value of perform-
ance shares
Total
Directors
Non-executive
Mr TCE BergmanChairman 2006 252,000 - - 252,000 12,139 257,365 269,504 - - - - 521,504 - -
2005 240,000 - - 240,000 11,585 202,037 213,622 - - - - 453,622 - -
Mr PR Bell(appointed 1 August 2005) 2006 115,073 - - 115,073 10,356 - 10,356 - - - - 125,429 - -
Prof E Byrne, AO 2006 100,000 - - 100,000 9,000 65,561 74,561 - - - - 174,561 - -
2005 96,000 - - 96,000 8,640 79,131 87,771 - - - - 183,771 - -
Mr R Holliday-Smith 2006 128,000 - - 128,000 11,520 - 11,520 - - - - 139,520 - -
2005 39,738 - - 39,738 3,576 - 3,576 - - - - 43,314 - -
Mr PJ North, AM 2006 109,000 - - 109,000 9,810 24,000 33,810 - - - - 142,810 - -
2005 105,000 - - 105,000 9,450 42,000 51,450 - - - - 156,450 - -
Mr DP O’Dwyer(appointed 1 August 2005) 2006 109,365 - - 109,365 9,843 - 9,843 - - - - 119,208 - -
Mr JH Veeneklaas 2006 100,000 - - 100,000 9,000 26,500 35,500 - - - - 135,500 - -
2005 96,000 - - 96,000 8,640 40,875 49,515 - - - - 145,515 - -
Prof BDO Anderson, AO (retired 20 October 2005) 2006 32,308 - - 32,308 2,908 8,492 11,400 - - - - 43,708 - -
2005 96,000 - - 96,000 8,640 40,875 49,515 - - - - 145,515 - -
Executive
Dr CG RobertsCEO/President 2006 750,750 403,155 - 1,153,905 12,139 - 12,139 8,842 186,988 62,699 249,687 1,424,573 45.8% 17.5%
2005 719,313 648,359 - 1,367,672 11,585 - 11,585 5,290 129,212 37,343 166,555 1,551,102 52.5% 10.7%
Dr JL ParkerChief Technology Officer 2006 346,653 117,421 181,992 646,066 12,139 - 12,139 11,660 66,441 28,383 94,824 764,689 27.8% 12.4%
2005 323,250 128,512 - 451,762 11,585 - 11,585 10,475 33,143 9,576 42,719 516,541 33.1% 8.3%
Total directors
2006 2,043,149 520,576 181,992 2,745,717 98,854 381,918 480,772 20,502 253,429 91,082 344,511 3,591,502
2005 1,715,301 776,871 - 2,492,172 73,701 404,918 478,619 15,765 162,355 46,919 209,274 3,195,830
Directors’ Report Cochlear Limited for the year ended 30 June 2006
43
Year Short-term Post-employment Other long-term
Equity compensation(i), (iv) Total Performance related
remuneration as proportion
of total %
Value of equity compensation
as proportion of remuneration
%
Amounts $
Salary and fees
Bonuses(i) Non-monetary benefits(ii)
Total Super- annuation
benefits
Leaving benefits(iii)
Total Long service
leave
Value of options
Value of perform-
ance shares
Total
Executives
Consolidated Entity
Mr R Brook(v), (vi), (vii)
President, European Region 2006 328,512 128,896 66,482 523,890 17,370 - 17,370 - 85,124 36,267 121,391 662,651 37.8% 18.3%
2005 314,245 174,961 64,956 554,162 37,379 - 37,379 - 43,041 12,438 55,479 647,020 35.6% 8.6%
Mr NJ Mitchell(v), (vi), (viii)
Chief Financial Officer and Company Secretary 2006 301,433 115,364 - 416,797 67,280 - 67,280 11,887 63,010 26,767 89,777 585,741 35.0% 15.3%
2005 266,491 118,565 - 385,056 45,871 - 45,871 10,775 30,577 8,836 39,413 481,115 32.8% 8.2%
Mr MD Salmon(v), (vi), (viii)
President, Asia Pacific Region 2006 333,397 108,719 - 442,116 12,139 - 12,139 3,119 52,744 17,753 70,497 527,871 34.0% 13.4%
2005 297,161 91,685 - 388,846 10,917 - 10,917 1,630 30,592 8,840 39,432 440,825 29.7% 8.9%
Mr CM Smith(v), (vi), (vii)
President, Americas Region 2006 442,478 172,289 22,804 637,571 17,431 - 17,431 - 136,451 9,977 146,428 801,430 39.8% 18.3%
2005 415,520 175,407 157,185 748,112 10,323 - 10,323 - 130,398 - 130,398 888,833 34.4% 14.7%
Mr H Yoshikawa(v), (vii)
General Manager and Representative Director, Japan 2006 290,292 90,559 21,941 402,792 40,416 - 40,416 - 12,285 11,111 23,396 466,604 24.4% 5.0%
2005 300,074 96,776 22,757 419,607 39,296 - 39,296 - - 3,525 3,525 462,428 21.7% 0.8%
Company
Mr MC Kavanagh(v)
Senior Vice President, Global Marketing 2006 276,961 92,127 - 369,088 12,139 - 12,139 7,154 54,287 23,484 77,771 466,152 36.4% 16.7%
2005 272,471 102,573 - 375,044 11,585 - 11,585 2,661 27,211 7,863 35,074 424,364 32.4% 8.3%
Mr DN Morris(v), (ix)
President, Bone Anchored Solutions 2006 276,007 93,939 - 369,946 12,139 - 12,139 5,483 56,152 23,442 79,594 467,162 37.1% 17.0%
Mr JF Patrick(v)
Senior Vice President, Chief Scientist 2006 246,840 89,467 - 336,307 38,549 - 38,549 - 53,457 23,057 76,514 451,370 36.8% 17.0%
2005 228,224 101,696 - 329,920 39,621 - 39,621 - 26,411 7,624 34,035 403,576 33.6% 8.4%
Mr DW Howitt(x)
Senior Vice President, Manufacturing and Logistics 2005 244,007 93,580 - 337,587 11,585 - 11,585 8,260 24,258 7,010 31,268 388,700 32.1% 8.0%
Total executives
2006 2,495,920 891,360 111,227 3,498,507 217,463 - 217,463 27,643 513,510 171,858 685,368 4,428,981
2005 2,338,193 955,243 244,898 3,538,334 206,577 - 206,577 23,326 312,488 56,136 368,624 4,136,861
(i) Short-term and long-term incentive bonuses are granted annually. The grant date is tied to the performance appraisal, which, for the current year was completed by 30 June 2006. The service and performance criteria are set out in this report.
(ii) Benefits include the provision of car allowances, health insurance and relocation costs.
(iii) Amounts accrued during the financial year to the directors’ retirement scheme. Refer to Note 28 to the financial statements for further information.
(iv) The value disclosed above is the proportion of the fair value of the options and performance shares allocated to the reporting period. The ability to exercise the options and performance shares is conditional on Cochlear achieving certain performance hurdles. The estimated value of options for the current financial year is calculated at the date of grant using the Black-Scholes model applying a 25% volatility, as reflected in the historical volatility. Further details of options granted during the financial year are set out below.
(v) Executive is included as one of the five named Company executives or Consolidated Entity executives who received the highest remuneration in the current financial year in accordance with section 300A of the Corporations Act 2001.
(vi) Executive is included as a key management person in accordance with AASB 124 Related Party Disclosures.
(vii) Denotes overseas based executive.
(viii) Denotes Consolidated Entity and Company executives.
(ix) Not included in Company top five executives in 2005.
(x) Not included in Company top five executives in 2006.

44
COCHLEAR ANNUAL REPORT 2006
Exercise of options granted as remuneration – audited
During the reporting period, the following shares were issued on the exercise of options previously granted as compensation:
Number of shares Amount paid $/share
Executive director
Dr JL Parker 25,000 38.12
Executives
Mr NJ Mitchell 25,000 38.12
Mr JF Patrick 25,000 38.12
Mr H Yoshikawa 5,000 38.12
During the previous financial year, nil options were exercised as the relevant EPS and TSR hurdles were not achieved. There are no amounts unpaid on the shares issued as a result of the exercise of the options in 2005 or 2006.
Analysis of bonuses included in remuneration – unaudited
Details of the vesting profile of the short-term incentive bonuses awarded as remuneration to each executive director of the Company and each of the five named Company executives and relevant Consolidated Entity executives are detailed below:
Short-term incentive bonus
Amounts $ Included in remuneration % vested in the financial year(i) % forfeited during the financial year(ii)
Executive directors
Dr CG Roberts 403,155 105.7% -
Dr JL Parker 117,421 107.5% -
Executives
Consolidated Entity
Mr R Brook 128,896 98.1% 1.9%
Mr NJ Mitchell 115,364 107.5% -
Mr MD Salmon 108,719 104.0% -
Mr CM Smith 172,289 130.3% -
Mr H Yoshikawa 90,559 104.0% -
Company
Mr MC Kavanagh 92,127 106.0% -
Mr DN Morris 93,939 107.1% -
Mr JF Patrick 89,467 107.5% -
(i) Amounts included in vested short-term incentives for the financial year represent the amounts that vested in the financial year based on achievement of personal goals and specified financial goals. Amounts exceeding 100% indicate performance above target. No amounts vest in future financial years in respect of the CMSTIP for the financial year.
(ii) The amounts forfeited in short-term incentives are due to personal and financial goals not being met in the financial year.
Directors’ Report Cochlear Limited for the year ended 30 June 2006
45
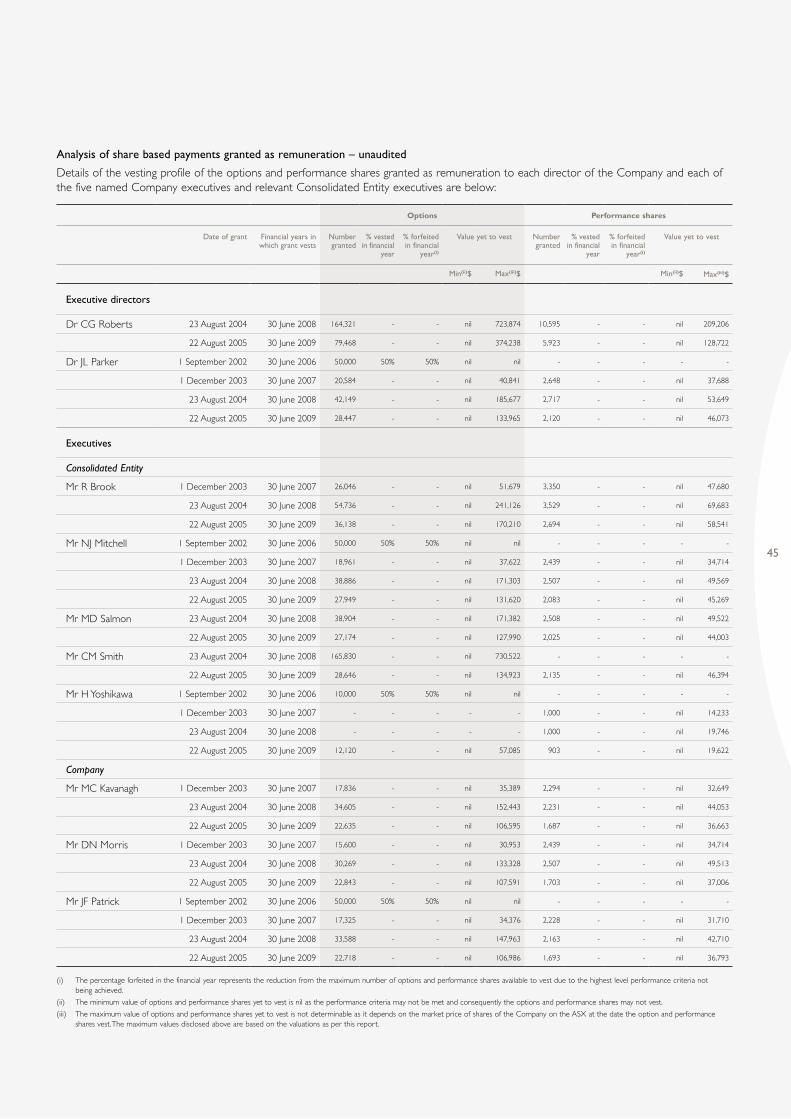
Analysis of share based payments granted as remuneration – unaudited
Details of the vesting profile of the options and performance shares granted as remuneration to each director of the Company and each of the five named Company executives and relevant Consolidated Entity executives are below:
Options Performance shares
Date of grant Financial years in which grant vests
Number granted
% vested in financial
year
% forfeited in financial
year(i)
Value yet to vest Number granted
% vested in financial
year
% forfeited in financial
year(i)
Value yet to vest
Min(ii)$ Max(iii)$ Min(ii)$ Max(iii)$
Executive directors
Dr CG Roberts 23 August 2004 30 June 2008 164,321 - - nil 723,874 10,595 - - nil 209,206
22 August 2005 30 June 2009 79,468 - - nil 374,238 5,923 - - nil 128,722
Dr JL Parker 1 September 2002 30 June 2006 50,000 50% 50% nil nil - - - - -
1 December 2003 30 June 2007 20,584 - - nil 40,841 2,648 - - nil 37,688
23 August 2004 30 June 2008 42,149 - - nil 185,677 2,717 - - nil 53,649
22 August 2005 30 June 2009 28,447 - - nil 133,965 2,120 - - nil 46,073
Executives
Consolidated Entity
Mr R Brook 1 December 2003 30 June 2007 26,046 - - nil 51,679 3,350 - - nil 47,680
23 August 2004 30 June 2008 54,736 - - nil 241,126 3,529 - - nil 69,683
22 August 2005 30 June 2009 36,138 - - nil 170,210 2,694 - - nil 58,541
Mr NJ Mitchell 1 September 2002 30 June 2006 50,000 50% 50% nil nil - - - - -
1 December 2003 30 June 2007 18,961 - - nil 37,622 2,439 - - nil 34,714
23 August 2004 30 June 2008 38,886 - - nil 171,303 2,507 - - nil 49,569
22 August 2005 30 June 2009 27,949 - - nil 131,620 2,083 - - nil 45,269
Mr MD Salmon 23 August 2004 30 June 2008 38,904 - - nil 171,382 2,508 - - nil 49,522
22 August 2005 30 June 2009 27,174 - - nil 127,990 2,025 - - nil 44,003
Mr CM Smith 23 August 2004 30 June 2008 165,830 - - nil 730,522 - - - - -
22 August 2005 30 June 2009 28,646 - - nil 134,923 2,135 - - nil 46,394
Mr H Yoshikawa 1 September 2002 30 June 2006 10,000 50% 50% nil nil - - - - -
1 December 2003 30 June 2007 - - - - - 1,000 - - nil 14,233
23 August 2004 30 June 2008 - - - - - 1,000 - - nil 19,746
22 August 2005 30 June 2009 12,120 - - nil 57,085 903 - - nil 19,622
Company
Mr MC Kavanagh 1 December 2003 30 June 2007 17,836 - - nil 35,389 2,294 - - nil 32,649
23 August 2004 30 June 2008 34,605 - - nil 152,443 2,231 - - nil 44,053
22 August 2005 30 June 2009 22,635 - - nil 106,595 1,687 - - nil 36,663
Mr DN Morris 1 December 2003 30 June 2007 15,600 - - nil 30,953 2,439 - - nil 34,714
23 August 2004 30 June 2008 30,269 - - nil 133,328 2,507 - - nil 49,513
22 August 2005 30 June 2009 22,843 - - nil 107,591 1,703 - - nil 37,006
Mr JF Patrick 1 September 2002 30 June 2006 50,000 50% 50% nil nil - - - - -
1 December 2003 30 June 2007 17,325 - - nil 34,376 2,228 - - nil 31,710
23 August 2004 30 June 2008 33,588 - - nil 147,963 2,163 - - nil 42,710
22 August 2005 30 June 2009 22,718 - - nil 106,986 1,693 - - nil 36,793
(i) The percentage forfeited in the financial year represents the reduction from the maximum number of options and performance shares available to vest due to the highest level performance criteria not being achieved.
(ii) The minimum value of options and performance shares yet to vest is nil as the performance criteria may not be met and consequently the options and performance shares may not vest.
(iii) The maximum value of options and performance shares yet to vest is not determinable as it depends on the market price of shares of the Company on the ASX at the date the option and performance shares vest. The maximum values disclosed above are based on the valuations as per this report.

46
COCHLEAR ANNUAL REPORT 2006
Analysis of movements in options – unaudited
The movement of values during the reporting period of options over ordinary shares of Cochlear Limited held by each Company director and each of the five named Company executives and relevant Consolidated Entity executives is detailed below:
Value of options
Amounts $ Granted in year(i) Exercised in year(ii) Forfeited in year(ii) Total option value in year
Executive directors
Dr CG Roberts 374,238 - - 374,238
Dr JL Parker 133,965 68,000 68,000 269,965
Executives
Consolidated Entity
Mr R Brook 170,210 - - 170,210
Mr NJ Mitchell 131,620 68,000 68,000 267,620
Mr MD Salmon 127,990 - - 127,990
Mr CM Smith 134,923 - - 134,923
Mr H Yoshikawa 57,085 13,600 13,600 84,285
Company
Mr DN Morris 107,591 - - 107,591
Mr MC Kavanagh 106,595 - - 106,595
Mr JF Patrick 106,986 68,000 68,000 242,986
(i) The value of options granted in the year is the fair value of options calculated at grant date using a Black-Scholes model. The total value of the options granted is included in the table above. This amount is allocated to remuneration over the vesting period (i.e. in years 30 June 2006 to 30 June 2009).
(ii) The value of options exercised and forfeited during the year is calculated as the market price of shares of the Company on the ASX as at close of trading on the date the options were exercised or forfeited after deducting the price paid or payable to exercise the option.
Other items – unaudited
Unissued shares under option
As at the date of this report, unissued ordinary shares of the Company under options are:
Number of options Plan Exercise price per share Exercise period
192,761 CELTIP $34.19 August 2006 – September 2008
715,540 CELTIP $18.97 August 2007 – September 2009
725,903 CELTIP $39.93 August 2008 – September 2010
The closing share price at 30 June 2006 was $54.63.
During the financial year, the Company granted 725,903 options over ordinary shares to employees under the CELTIP. The options are exercisable in the two years following lodgement with the ASX of the Company’s preliminary financial report for the year ending 30 June 2008. The number of options which will be exercisable is dependent on the performance measures and retention requirements set out in this Remuneration Report.
During the year, 513,500 options granted by the Company were forfeited.
Directors’ Report Cochlear Limited for the year ended 30 June 2006

47
Directors’ interests
The relevant interest of each director in the share capital of the Company, as notified by the directors to the ASX in accordance with section 205G(1) of the Corporations Act 2001, at the date of this report is as follows:
Cochlear Limited ordinary shares Options over ordinary shares
Mr PR Bell 1,500 -
Mr TCE Bergman 12,000 -
Prof E Byrne, AO 1,000 -
Mr R Holliday-Smith 1,000 -
Mr PJ North, AM 13,000 -
Mr DP O’Dwyer 2,450 -
Dr JL Parker 25,000 91,180
Dr CG Roberts 237,000 243,789
Mr JH Veeneklaas 1,000 -
Indemnification of officers
Under the terms of Article 35 of the Company’s Constitution, and to the extent permitted by law, the Company has indemnified the directors of the Company named in this Directors’ Report, the Company Secretary, Mr NJ Mitchell, and other persons concerned in or taking part in the management of the Consolidated Entity. The indemnity applies when persons are acting in their capacity as officers of the Company in respect of:
• liability to third parties (other than the Company or related bodies corporate), if the relevant officer has acted in good faith; and
• cost and expenses of successfully defending legal proceedings in which relief under the Corporations Act 2001 is granted to the relevant officer.
Insurance for directors and officers
During the financial year, the Company paid a premium for a Directors’ and Officers’ Liability Insurance policy and a Supplementary Legal Expenses Insurance policy. The insurance provides cover for the directors named in this Directors’ Report, the Company Secretary, and officers and former directors and officers of the Company. The insurance also provides cover for present and former directors and officers of other companies in the Consolidated Entity. The directors have not included details of the nature of the liabilities covered and the amount of the premium paid in respect of the Directors’ and Officers’ Liability and Supplementary Legal Expenses Insurance policies, as such disclosure is prohibited under the terms of the contract.
Events subsequent to reporting date
Other than the matter noted below, there has not arisen in the interval between the end of the financial year and the date of this Directors’ Report, any item, transaction or event of a material and unusual nature likely, in the opinion of the directors of the Company, to affect significantly the operations of the Consolidated Entity the results of those operations, or the state of affairs of the Consolidated Entity, in future financial years.
DividendsFor dividends declared after 30 June 2006, see Note 7 of the financial statements.
Rounding off
The Company is of a kind referred to in Australian Securities and Investments Commission Class Order 98/100 dated 10 July 1998 and in accordance with that Class Order, amounts in the Financial Report and Directors’ Report have been rounded off to the nearest one thousand dollars, unless otherwise indicated.
Dated at Sydney this 15th day of August 2006.
Signed in accordance with a resolution of the directors:
Director Director

48
COCHLEAR ANNUAL REPORT 2006
Lead Auditor’s Independence Declaration under section 307C of the Corporation Act 2001
I declare that, to the best of my knowledge and belief, in relation to the audit for the year ended 30 June 2006 there have been:
(i) no contraventions of the auditor independence requirements as set out in the Corporations Act 2001 in relation to the audit; and
(ii) no contraventions of any applicable code of professional conduct in relation to the audit.
KPMG John Wigglesworth, Partner
Sydney, 15 August 2006
Auditor’s Independence Declaration

49
Consolidated Company
2006 2005 2006 2005
Note $000 $000 $000 $000
Revenue 3(a) 452,260 348,966 285,653 235,194
Cost of sales 3(b) (130,962) (99,699) (110,771) (91,886)
Gross profit 321,298 249,267 174,882 143,308
Other income 3(c) 884 618 379 5,946
Distribution, marketing and field technical expenses (124,808) (100,968) (25,706) (15,211)
Administration expenses (29,951) (25,262) (23,314) (20,203)
Research and development expenses 3(b) (58,926) (41,465) (42,798) (33,719)
Operating profit before net financing income 108,497 82,190 83,443 80,121
Financial income 4 6,729 3,045 10,454 2,658
Financial expenses 4 (6,391) (2,928) (16) (1,244)
Net financing income 338 117 10,438 1,414
Profit before tax 108,835 82,307 93,881 81,535
Income tax expense 6 (30,610) (23,833) (26,522) (20,347)
Net profit (including minority interest) 78,225 58,474 67,359 61,188
Attributable to:
Equity holders of the parent 80,032 59,642 67,359 61,188
Minority interest (1,807) (1,168) - -
Net profit (including minority interest) 78,225 58,474 67,359 61,188
Basic earnings per share (cents)
Ordinary shares 9 146.8 110.1
Diluted earnings per share (cents)
Ordinary shares 9 145.2 109.7
The income statements are to be read in conjunction with the notes to the financial statements set out on pages 53 to 103.
Income statements Cochlear Limited and its controlled entities for the year ended 30 June 2006

50
COCHLEAR ANNUAL REPORT 2006
Consolidated Company
2006 2005 2006 2005
Note $000 $000 $000 $000
Foreign exchange translation differences 2,636 (2,708) (391) 385
Movement in general reserve 2 (10) - -
Defined benefit plan revaluation - (98) - (98)
Cash flow hedges:
Effective portion of changes in fair value (1,021) - (1,021) -
Losses taken to the income statement (14,485) - (14,485) -
Net income recognised directly in equity (12,868) (2,816) (15,897) 287
Net profit (including minority interest) 78,225 58,474 67,359 61,188
Total recognised income and expense for the period 65,357 55,658 51,462 61,475
Attributable to:
Equity holders of the parent 67,857 57,428 51,462 61,475
Minority interest (2,500) (1,770) - -
Total recognised income and expense for the period 65,357 55,658 51,462 61,475
Effect of change in accounting policy – financial instruments (with 2005 not restated)
Hedging reserve 19,102 - 19,102 -
Attributable to:
Equity holders of the parent 19,102 - 19,102 -
Minority interest - - - -
19,102 - 19,102 -
Other movements in equity arising from transactions with equity participants as equity participants are set out in Note 24. The statements of recognised income and expense are to be read in conjunction with the notes to the financial statements set out on pages 53 to 103.
Statements of recognised income and expense Cochlear Limited and its controlled entities for the year ended 30 June 2006

51
Consolidated Company
2006 2005 2006 2005
Note $000 $000 $000 $000
Current assets
Cash and cash equivalents 25(a) 87,073 106,077 27,458 72,191
Receivables 10 109,388 91,373 109,770 59,238
Inventories 11 76,822 49,518 47,209 25,726
Other 12 5,920 4,186 2,349 2,117
Total current assets 279,203 251,154 186,786 159,272
Non-current assets
Receivables 10 - 9,938 - 9,938
Other financial assets 13 383 187 33,994 18,521
Plant and equipment 14 30,833 24,624 21,381 19,884
Intangible assets 15 205,238 194,329 4,126 8,263
Deferred tax assets 16 30,267 22,464 5,072 7,749
Total non-current assets 266,721 251,542 64,573 64,355
Total assets 545,924 502,696 251,359 223,627
Current liabilities
Payables 17 57,345 46,539 28,337 18,914
Interest bearing liabilities 19 70,547 64,107 - 1,273
Current tax liabilities 24,981 12,455 14,407 8,380
Provisions 21 27,058 24,541 15,642 16,829
Other 18 23,525 45,396 857 18,322
Total current liabilities 203,456 193,038 59,243 63,718
Non-current liabilities
Interest bearing liabilities 19 125,493 138,951 - -
Provisions 21 6,433 6,108 5,655 4,703
Other 18 764 9,938 764 9,938
Total non-current liabilities 132,690 154,997 6,419 14,641
Total liabilities 336,146 348,035 65,662 78,359
Net assets 209,778 154,661 185,697 145,268
Equity
Issued capital 23 66,663 49,375 66,663 49,375
Reserves 24 3,010 (3,917) 3,077 (128)
Retained earnings 24 137,864 104,462 115,957 96,021
Total equity attributable to equity holders of the parent 207,537 149,920 185,697 145,268
Minority interest 24 2,241 4,741 - -
Total equity 24 209,778 154,661 185,697 145,268
The balance sheets are to be read in conjunction with the notes to the financial statements set out on pages 53 to 103.
Balance sheets Cochlear Limited and its controlled entities as at 30 June 2006

52
COCHLEAR ANNUAL REPORT 2006
Statements of cash flows Cochlear Limited and its controlled entities for the year ended 30 June 2006
Consolidated Company
2006 2005 2006 2005
Note $000 $000 $000 $000
Cash flows from operating activities
Cash receipts in the course of operations 432,838 338,705 234,073 223,459
Cash payments in the course of operations (352,164) (216,649) (209,038) (142,865)
Dividends received - - - 5,131
Grant and other income received 884 618 379 815
Interest received 3,816 2,634 5,896 2,592
Interest paid (6,391) (2,928) (16) (282)
Income taxes paid (27,428) (19,370) (19,358) (12,811)
Net cash provided by operating activities 25(b) 51,555 103,010 11,936 76,039
Cash flows from investing activities
Payment for plant and equipment (14,329) (4,992) (6,968) (3,569)
Payment for enterprise resource planning system (706) (3,044) - (5)
Proceeds from sale of non-current assets 572 27 197 1,279
Investment in controlled entities - - (15,380) (12,045)
Payment for acquisition of cochlear implant distribution businesses - (3,405) - -
Payment for controlled entities (net of cash acquired) - (192,208) - -
Development expenditure (179) (4,375) (179) (4,375)
Net cash used in investing activites (14,642) (207,997) (22,330) (18,715)
Cash flows from financing activities
Repayment of borrowings (29,787) (2,100) (1,273) (2,100)
Proceeds from borrowings 3,678 178,812 - -
Proceeds from issue of shares 17,288 - 17,288 -
Dividends paid by the parent (49,096) (42,832) (49,096) (42,832)
Net cash (used in)/provided by financing activities (57,917) 133,880 (33,081) (44,932)
Net (decrease)/increase in cash and cash equivalents (21,004) 28,893 (43,475) 12,392
Cash and cash equivalents at 1 July 103,627 74,091 70,918 58,526
Effects of exchange fluctuation on the balances of cash held in foreign currencies 2,703 643 15 -
Cash and cash equivalents at 30 June 25(a) 85,326 103,627 27,458 70,918
The statements of cash flows are to be read in conjunction with the notes to the financial statements set out on pages 53 to 103.
53
1. Statement of significant accounting policies
This Financial Report was authorised for issue by the directors on 15 August 2006.
The significant policies which have been adopted in the preparation of this Financial Report are:
(a) Statement of compliance
The Financial Report is a general purpose financial report which has been prepared in accordance with Australian Accounting Standards adopted by the Australian Accounting Standards Board (AASB) and the Corporations Act 2001.
International Financial Reporting Standards (IFRS) form the basis of Australian Accounting Standards adopted by the AASB, and for the purpose of this report are called Australian equivalents to IFRS (AIFRS), to distinguish from previous Australian Generally Accepted Accounting Principles (previous GAAP). The financial report of the Consolidated Entity also complies with IFRS and interpretations adopted by the International Accounting Standards Board.
This is the Consolidated Entity’s first AIFRS financial report prepared in accordance with Australian Accounting Standards, being AIFRS, and AASB 1 First-time Adoption of Australian Equivalents to International Financial Reporting Standards (AASB 1) has been applied.
An explanation of how the transition to AIFRS has affected the reported financial position, financial performance and cash flows of the Consolidated Entity is provided in Note 31. This note includes reconciliations of equity and profit for comparative periods reported under previous GAAP to those reported for those periods under AIFRS.
(b) Basis of preparation
The Financial Report is presented in Australian dollars, rounded off to the nearest one thousand, unless otherwise stated.
The Financial Report is prepared on the historical cost basis except that the following assets and liabilities are stated at their fair value: derivative financial instruments, and financial instruments classified as available for sale.
The entity has elected to early adopt the following revised accounting standards:
• AASB 119 Employee Benefits (December 2004);
• AASB 2004-3 Amendments to Australian Accounting Standards (December 2004) amending AASB 1 First-time Adoption of Australian Equivalents to International Financial Reporting Standards (July 2004), AASB 101 Presentation of Financial Statements and AASB 124 Related Party Disclosures;
• AASB 2005-3 Amendments to Australian Accounting Standards (June 2005) amending AASB 119 Employee Benefits (either July or December 2004);
• AASB 2005-4 Amendments to Australian Accounting Standards (June 2005) amending AASB 139 Financial Instruments: Recognition and Measurement, AASB 132 Financial Instruments: Disclosure and Presentation, AASB 1 First-time Adoption of Australian Equivalents to International Financial Reporting Standards (July 2004), AASB 1023 General Insurance Contracts and AASB 1038 Life Insurance Contracts;
• AASB 2005-5 Amendments to Australian Accounting Standards (June 2005) amending AASB 1 First-time Adoption of Australian Equivalents to International Financial Reporting Standards (July 2004) and AASB 139 Financial Instruments: Recognition and Measurement;
• AASB 2005-6 Amendments to Australian Accounting Standards (June 2005) amending AASB 3 Business Combinations;
• AASB 2005-7 Amendments to Australian Accounting Standards (June 2005) amending AASB 134 Interim Financial Reporting;
• AASB 2005-8 Amendments to Australian Accounting Standards (June 2005) amending AASB 1 First-time Adoption of Australian Equivalents to International Financial Reporting Standards (July 2004); and
• AASB 2006-1 Amendments to Australian Accounting Standards (January 2006) amending AASB 121 The Effects of Changes in Foreign Exchange Rates.
The following accounting standards and amendments were available for early adoption but have not been applied by the Consolidated Entity in these financial statements:
• AASB 2005-1 Amendments to Australian Accounting Standards (May 2005) amending AASB 139 Financial Instruments: Recognition and Measurement;
• AASB 2005-9 Amendments to Australian Accounting Standards (September 2005) amending AASB 4 Insurance Contracts;
• AASB 2005-10 Amendments to Australian Accounting Standards (September 2005) amending AASB 132 Financial Instruments: Disclosure and Presentation, AASB 101 Presentation of Financial Statements, AASB 114 Segment Reporting, AASB 117 Leases, AASB 133 Earnings per Share, AASB 139 Financial Instruments: Recognition and Measurement, AASB 1 First-time adoption of Australian Equivalents to International Financial Reporting Standards, AASB 4 Insurance Contracts, AASB 1023 General Insurance Contracts and AASB 1038 Life Insurance Contracts; and
• AASB 7 Financial Instruments: Disclosures (August 2005).
The impact of these standards is yet to be determined but they will be applied by the Consolidated Entity on the relevant application date.
Notes to the financial statements Cochlear Limited and its controlled entities for the year ended 30 June 2006

54
COCHLEAR ANNUAL REPORT 2006
The preparation of a financial report in conformity with the Australian Accounting Standards requires management to make judgements, estimates and assumptions that affect the application of policies and reported amounts of assets, liabilities, revenue and expenses. These estimates and associated assumptions are based on historical experience and various other factors that are believed to be reasonable under the circumstances, the results of which form the basis of making the judgements about carrying values of assets and liabilities that are not readily apparent from other sources. Actual results may differ from these estimates.
The estimates and underlying assumptions are reviewed on an ongoing basis. Revisions to accounting estimates are recognised in the period in which the estimate is revised if the revision affects only that period, or in the period of the revision and future periods if the revision affects both current and future periods.
Judgements made by management in the application of Australian Accounting Standards that have significant effect on the Financial Report and estimates with a significant risk of material adjustment in the next year are discussed in this Note 1.
(c) Basis of consolidation
Controlled entitiesControlled entities are entities controlled by the Company. Control exits when the Company has the power, directly or indirectly, to govern the financial and operating policies of an entity so as to obtain benefits from its activities. In assessing control, potential voting rights that presently are exercisable or convertible are taken into account. The financial statements of controlled entities are included in the consolidated financial statements from the date that control commences until the date that control ceases.
Investments in controlled entities are carried at their cost of acquisition in the Company’s financial statements.
AssociatesAssociates are those entities in which the Consolidated Entity has significant influence, but not control, over the financial and operating policies. The consolidated financial statements include the Consolidated Entity’s share of the total recognised gains and losses of associates on an equity accounted basis, from the date that significant influence commences until the date that significant influence ceases. When the Consolidated Entity’s share of losses exceeds its interest in an associate, the Consolidated Entity’s carrying amount is reduced to nil and recognition of further losses is discontinued except to the extent that the Consolidated Entity has incurred legal or constructive obligations or made payments on behalf of an associate.
In the Company’s financial statements, investments in associates are carried at the cost of acquisition, less any impairment losses.
Transactions eliminated on consolidationIntra-group balances and any unrealised gains and losses or income and expenses arising from intra-group transactions, are eliminated in preparing the consolidated financial statements.
Unrealised gains arising from transactions with associates are eliminated to the extent of the Consolidated Entity’s interest in the entity with adjustments made to the investment in associates and share of associates net profit accounts.
(d) Revenue recognition
Revenues are recognised at fair value of the consideration received net of the amount of goods and services tax (GST).
Sales revenueSales revenue comprises revenue earned (net of returns, discounts and allowances) from the provision of products or services. Revenue from the sale of goods is recognised in the income statement when the significant risks and rewards of ownership have been transferred to the buyer. No revenue is recognised if there are significant uncertainties regarding recovery of the consideration due, the costs incurred or to be incurred cannot be measured reliably, there is a risk of return of goods or there is continuing management involvement with the goods. Revenue from the sale of services is recognised when the service has been provided to the customer and where there are no continuing unfulfilled service obligations.
The accounting policy for foreign exchange gains/losses arising from hedges of forecast sales transactions is set out in accounting policy (h).
Other incomeOther revenue, including government grants, is recognised on a systematic basis as income over the periods necessary to match it with the related costs for which it is intended to compensate or if the costs have already been incurred in the period in which it becomes receivable which is when the entitlement is confirmed.
Sales of non-current assetsThe gain or loss on disposal of non-current assets is recognised as other operating income at the date control of the asset passes to the buyer, usually when an unconditional contract of sale is signed.
The gain or loss on disposal is calculated as the difference between the carrying amount of the asset at the time of disposal and the net proceeds on disposal (including incidental costs).
Notes to the financial statements Cochlear Limited and its controlled entities for the year ended 30 June 2006

55
(e) Goods and services tax
Revenue, expenses and assets are recognised net of the amount of GST, except where the amount of GST incurred is not recoverable from the taxation authority. In these circumstances, the GST is recognised as part of the cost of acquisition of the asset or as part of the expense.
Receivables and payables are stated with the amount of GST included. The net amount of GST recoverable from, or payable to, the relevant taxation authority is included as a current asset or liability in the balance sheet.
Cash flows are included in the statement of cash flows on a gross basis. The GST components of cash flows arising from investing and financing activities which are recoverable from, or payable to, the relevant taxation authority are classified as operating cash flows.
(f) Foreign currency
Foreign currency transactionsTransactions in foreign currencies are translated at the foreign exchange rate ruling at the date of the transaction. Monetary assets and liabilities denominated in foreign currencies at reporting date are translated to Australian dollars at the foreign exchange rate ruling at that date. Foreign exchange differences arising on translation are recognised in the income statement. Non-monetary assets and liabilities that are measured in terms of historical cost in a foreign currency are translated using the exchange rate at the date of the transaction. Non-monetary assets and liabilities denominated in foreign currencies that are stated at fair value are translated to Australian dollars at foreign exchange rates ruling at the dates the fair values were determined.
Financial statements of foreign operationsThe assets and liabilities of foreign operations, including goodwill and fair value adjustments arising on consolidation, generally are translated to Australian dollars at foreign exchange rates ruling at that date. The revenues and expenses of foreign operations are translated to Australian dollars at rates approximating the foreign exchange rates ruling at the dates of transactions.
Net investment in foreign operationsExchange differences arising from the translation of the net investment in foreign operations, and of related hedges are taken to the foreign currency translation reserve. They are released into the income statement upon disposal.
The AASB 1 election to reset the existing foreign currency translation reserve balance to nil on conversion has not been adopted.
(g) Derivative financial instruments
The Consolidated Entity uses derivative financial instruments to hedge its exposure to foreign exchange arising from operating, investing and financing activities. In accordance with its treasury policy, the Consolidated Entity does not hold or issue derivative financial instruments for trading purposes. However, derivatives that do not qualify for hedge accounting are accounted for as trading instruments.
Derivative financial instruments are recognised initially at fair value. Subsequent to initial recognition, derivative financial instruments are stated at fair value. The gain or loss on re-measurement to fair value is recognised immediately in the income statement. However, where derivatives qualify for hedge accounting, recognition of any resultant gain or loss depends on the nature of the item being hedged (see accounting policy (h)).
(h) Hedges
Cash flow hedges
Current period policyWhere a derivative financial instrument is designated as a hedge of the variability in cash flows of a recognised asset or liability, or a highly probable forecast transaction, the effective part of any gain or loss on the derivative financial instrument is recognised directly in equity. When the forecast transaction subsequently results in the recognition of a non-financial asset or non-financial liability, the associated cumulative gain or loss is removed from equity and included in the initial cost or other carrying amount of the non-financial asset or liability. If a hedge of a forecast transaction subsequently results in the recognition of a financial asset or a financial liability, then the associated gains and losses that were recognised directly in equity are reclassified into the income statement in the same period or periods during which the asset acquired or liability assumed affects the income statement.
For cash flow hedges, other than those covered by the preceding statement, the associated cumulative gain or loss is removed from equity and recognised in the income statement in the same period or periods during which the hedged forecast transaction affects the income statement. The ineffective part of any gain or loss is recognised immediately in the income statement.
When a hedging instrument expires or is sold, terminated or exercised, or the Company revokes designation of the hedge relationship but the hedged forecast transaction still is expected to occur, the cumulative gain or loss at that point remains in equity and is recognised in accordance with the above policy when the transaction occurs. If the hedged transaction is no longer expected to take place, then the cumulative unrealised gain or loss recognised in equity is recognised immediately in the income statement.
56
COCHLEAR ANNUAL REPORT 2006
Comparative period policy For the year ended 30 June 2005, the following accounting treatment was applied: transactions were designated as a hedge of the anticipated specific purchase or sale of goods or services, purchase of qualifying assets, or an anticipated interest transaction, only when they were expected to reduce exposure to the risks being hedged and were designated prospectively so that it was clear when an anticipated transaction had or had not occurred and it was probable the anticipated transaction would occur as designated. Gains or losses on the hedge arising up to the date of the anticipated transaction, together with any other costs or gains arising at the time of entering into the hedge, were deferred and included in the measurement of the anticipated transaction when the transaction had occurred as designated. Any gains or losses on the hedged transaction after that date were included in the income statement.
The net amounts receivable or payable under forward foreign exchange contracts and the associated deferred gains or losses were recorded on the balance sheet from the date of inception of the hedge transaction. When recognised, the net receivables or payables were revalued using the foreign currency exchange rate current at the reporting date.
When the anticipated transaction was no longer expected to occur as designated, the deferred gain or loss relating to the hedged transaction was recognised immediately in the income statement.
Where a hedge transaction was terminated early and the anticipated transaction was still expected to occur as designated, deferred gains and losses that arose on the foreign currency hedge prior to its termination continued to be deferred and were included in the measurement of the purchase or sale when it occurred. Where a hedge transaction was terminated early because the anticipated transaction was no longer expected to occur as designated, deferred gains and losses that arose on the foreign currency hedge prior to its termination were included in the income statement for the financial period.
Gains or losses that arose prior to and upon the maturity of transactions entered into under hedge rollover strategies were deferred and included in the measurement of the hedged anticipated transaction if the transaction was still expected to occur as designated. If the anticipated transaction was no longer expected to occur as designated, gains or losses were recognised immediately in the income statement.
Hedge of monetary assets and liabilitiesWhen a derivative financial instrument is used to hedge economically the foreign exchange exposure of a recognised monetary asset or liability, hedge accounting is not applied and any gain or loss on the hedging instrument is recognised in the income statement.
Hedge of net investment in foreign operationsThe portion of the gain or loss on an instrument used to hedge a net investment in a foreign operation that is determined to be an effective hedge is recognised directly in equity. The ineffective portion is recognised immediately in the income statement.
(i) Cash and cash equivalents
Cash and cash equivalents comprise cash balances and call deposits with an original maturity of three months or less. Bank overdrafts that are repayable on demand and form an integral part of the Consolidated Entity’s cash management are included as a component of cash and cash equivalents for the purpose of the statement of cash flows.
(j) Provisions
A provision is recognised in the balance sheet when the Consolidated Entity has a present legal or constructive obligation as a result of a past event, and it is probable that an outflow of economic benefits will be required to settle the obligation.
WarrantiesProvisions for warranty claims are made for claims in relation to sales made prior to the reporting date, based on historical claim rates and respective product populations. The provision is determined on a discounted cash flow basis. Warranty periods on hardware products extend for three to 10 years. The Consolidated Entity is expected to incur the majority of the liability over the next three to 10 years.
DividendsA provision for dividends payable is recognised in the financial period in which the dividends are declared.
Restructuring, employee termination benefits and surplus lease spaceProvisions for restructuring or termination benefits are only recognised when a detailed plan has been approved and the restructuring or termination has either commenced or been publicly announced, or firm contracts related to the restructuring or termination benefits have been entered into. Costs related to ongoing activities are not provided for. The liabilities for termination benefits that will be paid as a result of these restructurings have been included in the provision for employee benefits.
Provision is made for non-cancellable operating lease rentals payable on surplus leased premises when it is determined that no substantive future benefit will be obtained from their occupancy and sub-lease rentals are less than the lease rentals paid. The estimate is calculated based on discounted net future cash flows, using the interest rate implicit in the lease or an estimate thereof.
Self-insuranceThe Company self-insures to manage certain risks associated with operating in its line of business. Outstanding claims are recognised when an incident occurs that may give rise to a claim and are measured at the cost that the entity expects to incur in settling the claims, discounted using a rate that reflects current market assessments of the time value of money and the risks specific to the liability.
Notes to the financial statements Cochlear Limited and its controlled entities for the year ended 30 June 2006

57
Make good lease costsThe Consolidated Entity has a number of operating leases over its offices that require the asset to be returned to the lessor in its original condition. The operating lease payments do not include an element for the repairs/overhauls.
A provision for make good lease costs is recognised at the time it is determined that it is probable that such costs will be incurred in a future period, measured at the expected cost of returning the asset to the lessor in its original condition. The Consolidated Entity is expected to incur the liability within the next 12 years. An offsetting asset of the same value is also recognised and is classified in plant and equipment. This asset is amortised to the income statement over the life of the lease.
(k) Intangible assets
GoodwillAll business combinations are accounted for by applying the purchase method. Goodwill represents the difference between the cost of the acquisition and the fair value of the net identifiable assets acquired.
Goodwill is stated at cost less any accumulated impairment losses. Goodwill is allocated to cash generating units and is no longer amortised but is tested annually for impairment (see accounting policy (l)).
Negative goodwill arising on an acquisition is recognised directly in the income statement.
Enterprise resource planning systemThe external expenditure incurred on hardware and software and the external costs necessary for the implementation of the system are recognised as an intangible asset, to the extent that the Company controls future economic benefits as a result of the costs incurred, and is stated at cost less accumulated amortisation. All internal development, licence and support costs attributable to feasibility, alternative approach assessment and implementation are expensed as incurred.
Research and development expenditureExpenditure on research activities, undertaken with the prospect of gaining new scientific or technical knowledge and understanding, is recognised in the income statement as an expense as incurred.
Expenditure on development activities, whereby research findings are applied to a plan or design for the production of new or substantially improved products and processes, is capitalised if the product or process is technically and commercially feasible and the Consolidated Entity has sufficient resources to complete development.
The expenditure capitalised includes the cost of materials, direct labour and an appropriate proportion of overheads. Other development expenditure is recognised in the income statement as an expense as incurred. Capitalised development expenditure is stated at cost less accumulated amortisation (see below) and impairment losses (see accounting policy (l)).
Other intangible assetsOther intangible assets, principally comprising of technology acquired, customer relationships and intellectual property, are acquired individually or through business combinations and are stated at cost less accumulated amortisation (see below) and impairment losses (see accounting policy (l)).
Expenditure on internally generated goodwill and brands is recognised in the income statement as an expense as incurred.
Subsequent expenditureSubsequent expenditure on capitalised intangible assets is capitalised only when it increases the future economic benefits embodied in the specific asset to which it relates. All other expenditure is expensed as incurred.
AmortisationAmortisation is charged to the income statement on a straight-line basis over the estimated useful lives of the intangible assets unless such lives are indefinite. Goodwill and intangible assets with an indefinite useful life are systematically tested for impairment annually. Other intangible assets are amortised from the date that they are available for use. The estimated useful lives for the current and comparative periods are as follows:
Acquired technology 4 years
Enterprise resource planning system 2.5 – 4 years
Customer relationships 4 years
Intellectual property 3 years
Capitalised development expenditure 1 – 3 years.

58
COCHLEAR ANNUAL REPORT 2006
(l) Impairment
The carrying amounts of the Consolidated Entity’s assets, other than inventories (see accounting policy (n)), employee benefit assets (see accounting policy (o)), and deferred tax assets (see accounting policy (q)), are reviewed at each reporting date to determine whether there is any indication of impairment. If any such indication exists, the asset’s recoverable amount is estimated (see below).
For goodwill, assets that have an indefinite useful life and intangible assets that are not yet available for use, the recoverable amount is estimated at each balance sheet date.
An impairment loss is recognised whenever the carrying amount of an asset or its cash generating unit exceeds its recoverable amount. Impairment losses are recognised in the income statement unless the asset has previously been revalued, in which case the impairment loss is recognised as a reversal to the extent of that previous revaluation with any excess recognised through the income statement.
Impairment losses recognised in respect of cash generating units are allocated first to reduce the carrying amount of any goodwill allocated to the cash generating unit or a group of units and then, to reduce the carrying amount of the other assets in the unit or a group of units on a pro-rata basis.
Goodwill and indefinite-lived intangible assets were tested for impairment at 1 July 2004, the date of transition to AIFRS, even though no indication of impairment existed.
Calculation of recoverable amount
ReceivablesThe recoverable amount of the Consolidated Entity’s investments in held-to-maturity receivables carried at amortised cost is calculated as the present value of estimated future cash flows, discounted at the original effective interest rate (that is, the effective interest rate computed at initial recognition of these financial assets). Receivables with a short duration are not discounted.
Impairment of receivables is not recognised until objective evidence is available that a loss event has occurred. Significant receivables are individually assessed for impairment. Impairment testing of significant receivables that are not assessed as impaired individually is performed by placing them into portfolios of significant receivables with similar risk profiles and undertaking a collective assessment of impairment. Non-significant receivables are not individually assessed. Instead, impairment testing is performed by placing non-significant receivables in portfolios of similar risk profiles, based on objective evidence from historical experience adjusted for any effects of conditions existing at each balance date.
The allowance for impairment is calculated with reference to the profile of debtors in the Consolidated Entity’s sales and marketing regions.
Other assetsThe recoverable amount of other assets is the greater of their fair value less costs to sell, and value in use. In assessing value in use, the estimated future cash flows are discounted to their present value using a pre-tax discount rate that reflects current market assessments of the time value of money and the risks specific to the asset. For an asset that does not generate largely independent cash inflows, the recoverable amount is determined for the cash generating unit to which the asset belongs.
Reversals of impairmentAn impairment loss in respect of a receivable carried at amortised cost is reversed if the subsequent increase in recoverable amount can be related objectively to an event occurring after the impairment loss was recognised.
An impairment loss in respect of goodwill is not reversed.
In respect of other assets, an impairment loss is reversed when there is an indication that the impairment loss may no longer exist and there has been a change in the estimates used to determine the recoverable amount.
An impairment loss is reversed only to the extent that the asset’s carrying amount does not exceed the carrying amount that would have been determined, net of depreciation or amortisation, if no impairment loss had been recognised.
(m) Plant and equipment
Owned assetsItems of plant and equipment are stated at cost or deemed cost less accumulated depreciation (see below) and impairment losses (see accounting policy (l)). An asset’s cost is determined as consideration provided plus incidental costs directly attributable to the acquisition.
The cost of self-constructed assets includes the cost of material and direct labour, an appropriate proportion of fixed and variable overheads, and capitalised interest.
Subsequent costs in relation to replacing a part of plant and equipment are recognised in the carrying amount if it is possible that future economic benefits embodied within the item will flow to the Consolidated Entity and the cost of the item can be measured reliably. All other costs are recognised in the income statement as incurred.
Notes to the financial statements Cochlear Limited and its controlled entities for the year ended 30 June 2006

59
Leased assets
Operating leasesPayments made under operating leases are expensed on a straight-line basis over the term of the lease, except where an alternative basis is more representative of the pattern of benefits to be derived from the leased property. Minimum lease payments include fixed rate step-ups.
Depreciation Items of plant and equipment, including leasehold assets, are depreciated using the straight-line method over their estimated useful lives, taking into account estimated residual values. Assets are depreciated from the date of acquisition or, in respect of internally constructed assets, from the time an asset is completed and held ready for use.
Depreciation rates and methods and residual values are reviewed annually for appropriateness. When changes are made, adjustments are reflected prospectively in current and future financial periods only.
The estimated useful lives in the current and comparative periods are as follows:
Leasehold improvements 5 – 9 years
Plant and equipment 3 – 8 years.
(n) Inventories
Inventories are carried at the lower of cost and net realisable value. Net realisable value is the estimated selling price in the ordinary course of business less estimated costs of completion and selling, marketing and distribution expenses.
Cost is based on the first-in-first-out principle and includes expenditure incurred in acquiring the inventories and bringing them to their existing condition and location. In the case of manufactured inventories and work in progress, cost includes an appropriate share of both variable and fixed overhead costs. Fixed overhead costs are allocated on the basis of normal operating capacity.
(o) Employee benefits
Defined contribution plansObligations for contributions to defined contribution pension plans are recognised as an expense in the income statement as incurred.
Defined benefit plansThe Consolidated Entity has early adopted the revised AASB 119 Employee Benefits (December 2004) (AASB 119).
A liability or asset in respect of defined benefit superannuation plans is recognised in the balance sheet, and is measured as the present value of the defined benefit obligation as at the reporting date plus unrecognised actuarial gains or losses less the fair value of the plan’s assets at that date and any unrecognised past service cost. The present value of the defined benefit obligation is based on expected future payments which arise from membership of the plan to the reporting date, calculated annually by independent actuaries using the projected unit credit method.
When the calculation results in plan assets exceeding liabilities to the Consolidated Entity, the recognised asset is limited to the net total of any unrecognised actuarial losses and past service costs and the present value of any future refunds from the plan or reductions in future contributions to the plan.
Past service cost is the increase in the present value of the defined benefit obligation for employee services in prior periods, resulting in the current period from the introduction of, or changes to, post-employment benefits or other long-term employee benefits. Past service costs may either be positive (where benefits are introduced or improved) or negative (where existing benefits are reduced).
Expected future payments are discounted using market yields at the reporting date on national government bonds with terms to maturity and currency that match the estimated future cash flows.
When the benefits of a plan are improved, the portion of the increased benefit relating to past service by employees is recognised as an expense in the income statement on a straight-line basis over the average period until the benefits become vested. To the extent that the benefits vest immediately, the expense is recognised immediately in the income statement.
The full amount of actuarial gains and losses that arise subsequent to transition date will be recognised directly in retained earnings.
Wages, salaries and annual leaveLiabilities for employee benefits for wages, salaries and annual leave expected to settle within 12 months of the year end represent present obligations resulting from employees’ services provided up to reporting date, calculated at undiscounted amounts based on remuneration wage and salary rates that the Consolidated Entity expects to pay as at reporting date including related on-costs, such as workers’ compensation insurance and payroll tax.

60
COCHLEAR ANNUAL REPORT 2006
Long service leaveThe provision for employee benefits to long service leave represents the present value of the estimated future cash outflows to be made by the employer resulting from employees’ services provided up to reporting date.
The provision is calculated using expected future increases in remuneration rates, including related on-costs and expected settlement dates based on turnover history, and is discounted using the rates attaching to national government securities at reporting date, which most closely match the terms of maturity of the related liabilities. The unwinding of the discount is treated as a long service leave expense.
Share based payment transactionsThe Company has granted options and performance shares to certain employees under an Executive Share Option Plan (ESOP) and the Cochlear Executive Long Term Incentive Plan (CELTIP).
The fair value of options and shares granted is recognised as an employee benefits expense with a corresponding increase in equity. The fair value is measured at the date the options or shares are granted taking into account market and non-market based criteria and expensed over the vesting period after which the employees become unconditionally entitled to the options and shares. The fair value of the options granted is measured using the Black-Scholes method, taking into account the terms and conditions attached to the options. The fair value of the performance shares granted is measured using the weighted average share price of ordinary shares in the Company, taking into account the terms and conditions attached to the shares. The amount recognised as an expense is adjusted to reflect the actual number of options and shares that vest except where forfeiture is due to market related conditions.
The exemption under AASB 1 has been applied, resulting in no adjustment being made for options granted prior to 7 November 2002 which had vested before 1 July 2004. Options granted after 7 November 2002 and remaining unvested at 1 January 2004 have been recognised through the opening balance sheet.
Treasury sharesThe Company operates the Cochlear Executive Long Term Incentive Plan (Performance Shares) Trust (Trust). The main purpose of the Trust is to hold unvested performance shares as part of the CELTIP. Under AIFRS, the Trust qualifies as an equity compensation plan special purpose entity and its results are included in those for the Consolidated Entity.
At transition date, the Trust held shares of the Company. The shares are accounted for as treasury shares and treated as a reduction in the share capital of the Company and the Consolidated Entity.
(p) Receivables
Trade and other receivables are stated at amortised cost less impairment losses (see accounting policy (l)).
(q) Taxation
Income tax on the income statement for the periods presented comprises current and deferred tax. Income tax is recognised in the income statement except to the extent that it relates to items recognised directly in equity, in which case it is recognised in equity.
Current tax is the expected tax payable on the taxable income for the year, using tax rates enacted or substantially enacted at reporting date, and any adjustment to tax payable in respect of previous years.
Deferred tax is provided using the balance sheet liability method, providing for temporary differences between the carrying amounts of assets and liabilities for financial reporting purposes and the amounts used for taxation purposes. The following temporary differences are not provided for: the initial recognition of goodwill and other assets or liabilities that affect neither accounting nor taxable profit, and differences relating to investments in subsidiaries to the extent that they will probably not reverse in the foreseeable future. The amount of deferred tax provided is based on the expected manner of realisation or settlement of the carrying amount of assets and liabilities, using tax rates enacted or substantively enacted at reporting date.
A deferred tax asset is recognised only to the extent that it is probable that future taxable profits will be available against which the asset can be utilised. Deferred tax assets are reduced to the extent that it is no longer probable that the related tax benefit will be realised.
(r) Payables
Trade and other payables are stated at amortised cost.
(s) Interest bearing liabilities
Effective 1 July 2005, interest bearing liabilities are recognised initially at fair value less attributable transaction costs. Subsequent to initial recognition, interest bearing liabilities are stated at amortised cost with any difference between cost and redemption value being recognised in the income statement over the period of the borrowings on an effective interest rate basis.
Until 30 June 2005, bank loans were carried in the balance sheet at their principal amount. Interest expense was accrued at the contracted rate and included in payables.
Notes to the financial statements Cochlear Limited and its controlled entities for the year ended 30 June 2006

61
(t) Net financing income
Financial costs include interest, finance charges in respect of finance leases. Debt establishment costs are capitalised and recognised as a reduction in interest bearing liabilities. They are calculated based on the effective interest rate method and are amortised over the period of the loan.
Interest income is recognised as it accrues. Dividend income from subsidiaries is recognised by the parent when the dividends are declared by the subsidiary. Foreign exchange differences net of the effect of hedges on borrowings are recognised in net financing income.
(u) Earnings per share
Basic earnings per share (EPS) is calculated by dividing the net profit attributable to equity holders of the parent for the financial period, after excluding any costs of servicing equity (other than ordinary shares) by the weighted average number of ordinary shares of the Company, adjusted for any bonus issue.
Diluted EPS is calculated by dividing the basic EPS earnings, adjusted by the after-tax effect of financing costs associated with the dilutive potential ordinary shares and the effect on revenues and expenses of conversion to ordinary shares associated with dilutive potential ordinary shares, by the weighted average number of ordinary shares and dilutive potential ordinary shares of the Company adjusted for any bonus issue.
(v) Segment reporting
A segment is a distinguishable component of the Consolidated Entity that is engaged either in providing products or services within a particular economic environment (geographical segment), or in providing products or services (business segment), which is subject to risks and rewards that are different from those of other segments.
(w) Accounting estimates and judgements
Management discussed with the Audit Committee the development, selection and disclosure of the Consolidated Entity’s critical accounting policies and estimates and the application of these policies and estimates.
Key sources of estimation uncertainty
US Department of Justice InquiryThe Company was informed by the US Department of Justice that Cochlear America’s, a wholly-owned subsidiary, is subject to an inquiry. For further details, refer to Note 22.
2. Changes in accounting policies
In the current financial year, the Company adopted AASB 132 Financial Instruments: Disclosure and Presentation (AASB 132) and AASB 139 Financial Instruments: Recognition and Measurement (AASB 139). This change in accounting policy has been adopted in accordance with the transition rules contained in AASB 1, which does not require the restatement of comparative information for financial instruments within the scope of AASB 132 and AASB 139.
The adoption of AASB 139 has resulted in the Company recognising all derivative financial instruments as assets or liabilities at fair value. This change has been accounted for by adjusting the opening balance of the hedging reserve at 1 July 2005.
The impact on the balance sheet in the comparative period is set out below as an adjustment to the opening balance sheet at 1 July 2005. The impact on the income statement of the comparative period is nil.
Reconciliation of opening balances affected by AASB 132 and AASB 139 at 1 July 2005:
Consolidated Company
Amounts $000
Note Previous GAAP Effect of transition to
AIFRS
AIFRS Previous GAAP Effect of transition to
AIFRS
AIFRS
Deferred tax liabilities - 8,186 8,186 - 8,186 8,186
Deferred gain on hedges (a) 27,288 (27,288) - 27,288 (27,288) -
Hedging reserve (a) - 19,102 19,102 - 19,102 19,102
(a) Under previous GAAP, the Consolidated Entity did not recognise any derivatives at fair value on the balance sheet. Instead, it had translated the forward exchange contracts in accordance with previous GAAP giving rise to an accumulated deferred gain of $27,288,000. In accordance with AIFRS, all derivatives would be recognised at fair value. At 1 July 2005, the fair value of the forward exchange contracts was $27,288,000. The effect in the Consolidated Entity and the Company is to increase the hedging reserve by $27,288,000 less deferred tax of $8,186,000, and to decrease the deferred gain on hedges previously recorded as a liability by $27,288,000 at 1 July 2005.

62
COCHLEAR ANNUAL REPORT 2006
Consolidated Company
2006 2005 2006 2005
Note $000 $000 $000 $000
3. Revenue and expenses
(a) Revenue
Sale of goods revenue before hedging 428,516 320,444 264,802 208,285
Foreign exchange gains on hedged sales 20,693 26,791 20,693 26,791
Revenue from the sale of goods 449,209 347,235 285,495 235,076
Rendering of services revenue 3,051 1,731 158 118
Total revenue 452,260 348,966 285,653 235,194
(b) Expenses
Cost of sales:
Carrying amount of inventories recognised as an expense 128,028 96,409 110,665 89,883
Other 2,681 1,056 106 78
Write-down in value of inventories 253 2,234 - 1,925
Total cost of sales 130,962 99,699 110,771 91,886
Research and development expenses:
Research and development expenditure 56,703 44,579 40,575 36,833
Development expenditure capitalised (179) (4,375) (179) (4,375)
Capitalised development expenditure – amortisation expense 2,402 1,261 2,402 1,261
Total research and development expenses 58,926 41,465 42,798 33,719
(c) Other income
Dividends from controlled entities - - - 5,131
Grant received or due and receivable 233 221 233 221
Other income 651 397 146 594
Total other income 884 618 379 5,946
(d) Other expenses
Costs resulting from integration of acquired entity 1,524 2,778 - -
Total other expenses 1,524 2,778 - -
(e) Profit before tax has been arrived at after charging/(crediting) the following items:
Impairment loss/(gain) on trade receivables 127 (632) - (19)
Increase in provisions 10,550 6,651 7,335 2,025
Employee benefits expense 117,312 95,098 58,853 53,271
Operating lease rental expense 6,647 6,597 2,687 2,838
Loss/(gain) on disposal of plant and equipment 20 7 (177) -
Notes to the financial statements Cochlear Limited and its controlled entities for the year ended 30 June 2006

63
Consolidated Company
2006 2005 2006 2005
Note $000 $000 $000 $000
4. Net financing income
Interest income 3,683 2,700 5,762 2,658
Net foreign exchange gain 3,046 345 4,692 -
Financial income 6,729 3,045 10,454 2,658
Interest expense 6,391 2,928 16 282
Net foreign exchange loss - - - 962
Financial expenses 6,391 2,928 16 1,244
Net financing income 338 117 10,438 1,414
Consolidated Company
2006 2005 2006 2005
Note $ $ $ $
5. Auditors’ remuneration
Audit services
Auditors of the Company:
KPMG Australia:
- audit and review of financial reports 350,000 274,600 335,500 274,600
- other regulatory audit services 6,400 5,500 6,400 5,500
Overseas KPMG firms:
- audit and review of financial reports 443,796 359,772 25,876 24,644
- other regulatory audit services - 10,891 - -
Other auditor - 37,994 - -
800,196 688,757 367,776 304,744
Other services
Auditors of the Company:
KPMG Australia:
- international taxation services 423,792 257,529 387,720 257,529
- other assurance services 17,250 47,495 17,250 47,495
- other taxation services 185,698 235,789 150,962 235,786
Overseas KPMG firms:
- taxation services 218,217 112,050 16,350 40,292
- international taxation services 118,717 85,552 7,580 47,642
- other assurance services 9,700 - - -
973,374 738,415 579,862 628,744

64
COCHLEAR ANNUAL REPORT 2006
Consolidated Company
2006 2005 2006 2005
Note $000 $000 $000 $000
6. Income tax expense
Recognised in the income statement
Current tax expense
Current year 21,549 22,958 28,064 18,968
Overprovided in prior years (283) (638) (406) (286)
21,266 22,320 27,658 18,682
Deferred tax expense
Origination and reversal of temporary differences 5,777 (887) (1,136) 1,665
Benefits of tax losses 3,567 2,400 - -
16 9,344 1,513 (1,136) 1,665
Total income tax expense in the income statement 30,610 23,833 26,522 20,347
Numerical reconciliation between income tax expense and profit before tax
Profit before tax 108,835 82,307 93,881 81,535
Income tax expense using the domestic corporate rate of 30% (2005: 30%) 32,651 24,692 28,164 24,461
Increase in income tax expense due to:
Non-deductible expenses 764 1,647 617 153
Effect of tax rate in foreign jurisdictions - 440 151 -
Decrease in income tax expense due to:
Research and development allowance (2,004) (2,308) (2,004) (2,308)
Non-assessable dividends from controlled entities - - - (1,539)
Effect of tax rate in foreign jurisdictions (518) - - (134)
30,893 24,471 26,928 20,633
Overprovided in prior years (283) (638) (406) (286)
Income tax expense on profit before tax 30,610 23,833 26,522 20,347
Deferred tax recognised directly in equity
Relating to derivative financial instruments 16 (6,645) - (6,645) -
Notes to the financial statements Cochlear Limited and its controlled entities for the year ended 30 June 2006
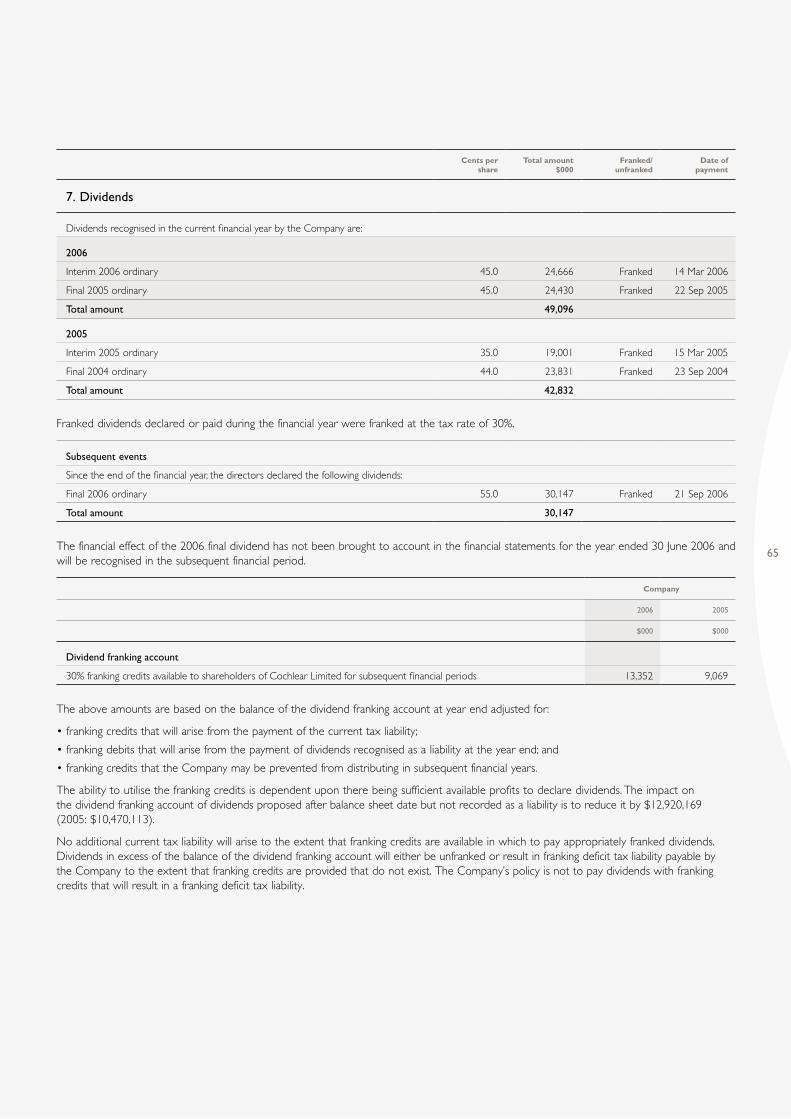
65
Cents per share
Total amount $000
Franked/unfranked
Date of payment
7. Dividends
Dividends recognised in the current financial year by the Company are:
2006
Interim 2006 ordinary 45.0 24,666 Franked 14 Mar 2006
Final 2005 ordinary 45.0 24,430 Franked 22 Sep 2005
Total amount 49,096
2005
Interim 2005 ordinary 35.0 19,001 Franked 15 Mar 2005
Final 2004 ordinary 44.0 23,831 Franked 23 Sep 2004
Total amount 42,832
Franked dividends declared or paid during the financial year were franked at the tax rate of 30%.
Subsequent events
Since the end of the financial year, the directors declared the following dividends:
Final 2006 ordinary 55.0 30,147 Franked 21 Sep 2006
Total amount 30,147
The financial effect of the 2006 final dividend has not been brought to account in the financial statements for the year ended 30 June 2006 and will be recognised in the subsequent financial period.
Company
2006 2005
$000 $000
Dividend franking account
30% franking credits available to shareholders of Cochlear Limited for subsequent financial periods 13,352 9,069
The above amounts are based on the balance of the dividend franking account at year end adjusted for:
• franking credits that will arise from the payment of the current tax liability;
• franking debits that will arise from the payment of dividends recognised as a liability at the year end; and
• franking credits that the Company may be prevented from distributing in subsequent financial years.
The ability to utilise the franking credits is dependent upon there being sufficient available profits to declare dividends. The impact on the dividend franking account of dividends proposed after balance sheet date but not recorded as a liability is to reduce it by $12,920,169 (2005: $10,470,113).
No additional current tax liability will arise to the extent that franking credits are available in which to pay appropriately franked dividends. Dividends in excess of the balance of the dividend franking account will either be unfranked or result in franking deficit tax liability payable by the Company to the extent that franking credits are provided that do not exist. The Company’s policy is not to pay dividends with franking credits that will result in a franking deficit tax liability.

66
COCHLEAR ANNUAL REPORT 2006
8. Segment reporting
Inter-segment pricing is on an arms length basis and is determined in accordance with transfer pricing arrangements.
Segment results, assets and liabilities include items directly attributable to a segment, as well as those that can be allocated on a reasonable basis. Unallocated items mainly comprise corporate expenses and assets associated with the manufacturing process.
In presenting information on the basis of geographical segments, segment revenue is based on the geographical location of customers. Segment assets are based on the geographical location of the assets.
The Consolidated Entity’s business segments operate geographically as follows:
Americas Europe Asia Pacific Eliminations Consolidated
2006 2005 2006 2005 2006 2005 2006 2005 2006 2005
$000 $000 $000 $000 $000 $000 $000 $000 $000 $000
Revenue
Revenue outside the Consolidated Entity 198,188 131,163 173,722 133,021 59,657 57,991 - - 431,567 322,175
Inter-segment sales revenue - - - - 229,657 175,333 (229,657) (175,333) - -
Foreign exchange gains on hedged sales 20,693 26,791
Total revenue 452,260 348,966
Segment result 52,065 24,850 45,721 37,783 12,048 11,728 - - 109,834 74,361
Unallocated (loss)/profit (1,337) 7,829
Net financing income 338 117
Profit before tax 108,835 82,307
Income tax expense (30,610) (23,833)
Net profit (including minority interest) 78,225 58,474
Segment depreciation and amortisation 4,953 463 2,954 1,213 892 246 - - 8,799 1,922
Unallocated depreciation and amortisation 7,276 9,749
Total depreciation and amortisation 16,075 11,671
Segment non-cash expenses other than depreciation and amortisation 1,775 (1,989) 479 769 278 294 - - 2,532 (926)
Unallocated non-cash expenses other than depreciation and amortisation (812) 4,070
Total non-cash expenses other than depreciation and amortisation 1,720 3,144
Inventory write-down 203 923 15 942 35 369 - - 253 2,234
Segment assets 164,697 132,871 231,758 198,335 40,560 33,336 (57,840) (70,039) 379,175 294,503
Unallocated assets 166,749 208,193
Total assets 545,924 502,696
Segment liabilities 85,570 65,129 66,116 64,299 9,699 11,563 (89,226) (52,915) 72,159 88,076
Unallocated liabilities 263,987 259,959
Total liabilities 336,146 348,035
Segment acquisition of non-current assets 2,129 3,440 5,444 1,850 360 54 - - 7,933 5,344
Unallocated acquisition of non-current assets 7,102 2,692
Total acquisition of non-current assets 15,035 8,036
Secondary reporting
The Consolidated Entity operates in a single business segment, being the implantable hearing device industry.
Notes to the financial statements Cochlear Limited and its controlled entities for the year ended 30 June 2006
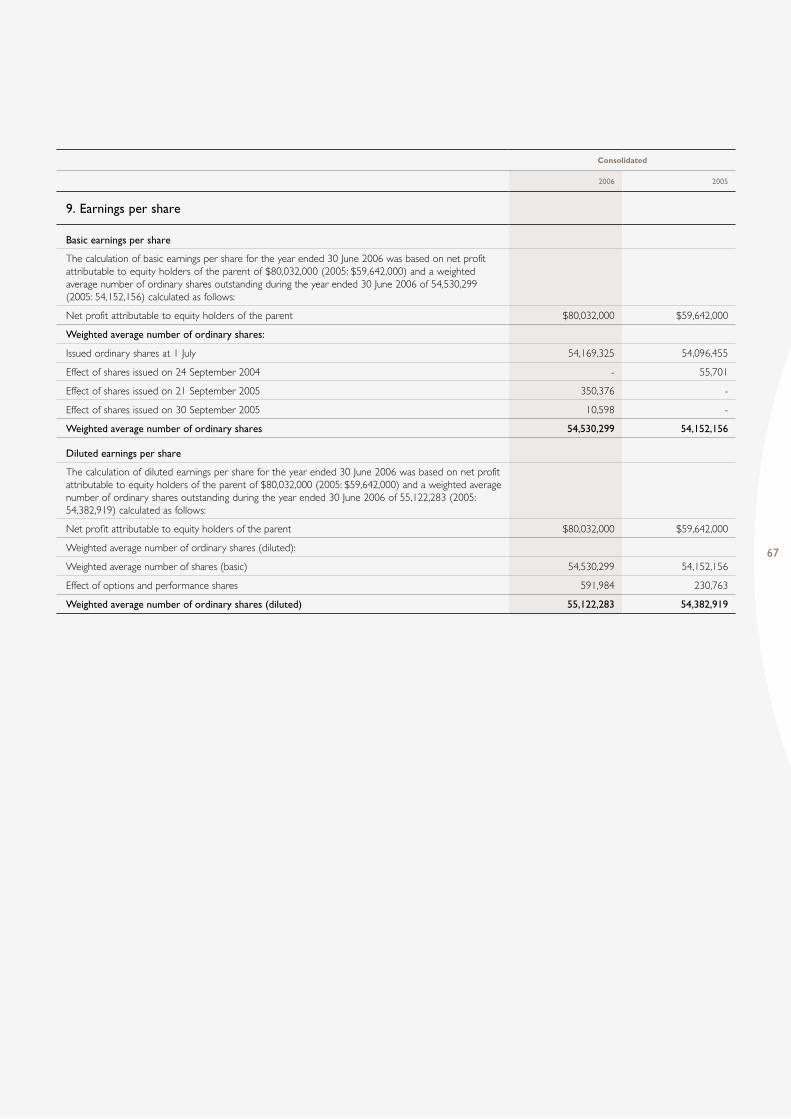
67
Consolidated
2006 2005
9. Earnings per share
Basic earnings per share
The calculation of basic earnings per share for the year ended 30 June 2006 was based on net profit attributable to equity holders of the parent of $80,032,000 (2005: $59,642,000) and a weighted average number of ordinary shares outstanding during the year ended 30 June 2006 of 54,530,299 (2005: 54,152,156) calculated as follows:
Net profit attributable to equity holders of the parent $80,032,000 $59,642,000
Weighted average number of ordinary shares:
Issued ordinary shares at 1 July 54,169,325 54,096,455
Effect of shares issued on 24 September 2004 - 55,701
Effect of shares issued on 21 September 2005 350,376 -
Effect of shares issued on 30 September 2005 10,598 -
Weighted average number of ordinary shares 54,530,299 54,152,156
Diluted earnings per share
The calculation of diluted earnings per share for the year ended 30 June 2006 was based on net profit attributable to equity holders of the parent of $80,032,000 (2005: $59,642,000) and a weighted average number of ordinary shares outstanding during the year ended 30 June 2006 of 55,122,283 (2005: 54,382,919) calculated as follows:
Net profit attributable to equity holders of the parent $80,032,000 $59,642,000
Weighted average number of ordinary shares (diluted):
Weighted average number of shares (basic) 54,530,299 54,152,156
Effect of options and performance shares 591,984 230,763
Weighted average number of ordinary shares (diluted) 55,122,283 54,382,919

68
COCHLEAR ANNUAL REPORT 2006
Consolidated Company
2006 2005 2006 2005
Note $000 $000 $000 $000
10. Receivables
Current
Trade receivables net of allowance for impairment loss 96,060 65,611 10,987 8,605
Other receivables 7,427 8,412 4,100 2,741
Amount receivable from controlled entities 29 - - 88,782 30,542
Forward exchange contracts 5,901 17,350 5,901 17,350
Total current receivables 109,388 91,373 109,770 59,238
Non-current
Forward exchange contracts - 9,938 - 9,938
Total non-current receivables - 9,938 - 9,938
11. Inventories
Raw materials and stores 28,975 20,526 26,900 18,973
Work in progress 7,835 6,172 6,578 5,836
Finished goods 40,012 22,820 13,731 917
Total inventories 76,822 49,518 47,209 25,726
12. Other current assets
Prepayments 5,920 4,186 2,349 2,117
13. Other financial assets
Shares in controlled entities, unlisted, at cost 26 - - 33,868 18,489
Other amounts receivable 383 187 126 32
Total financial assets 383 187 33,994 18,521
Notes to the financial statements Cochlear Limited and its controlled entities for the year ended 30 June 2006

69
Consolidated Company
2006 2005 2006 2005
Note $000 $000 $000 $000
14. Plant and equipment
Leasehold improvements
At cost 21,973 20,550 19,572 18,960
Accumulated amortisation (10,309) (7,601) (9,757) (7,163)
11,664 12,949 9,815 11,797
Plant and equipment
At cost 50,716 38,302 33,087 27,130
Accumulated depreciation (31,547) (26,627) (21,521) (19,043)
19,169 11,675 11,566 8,087
Total plant and equipment, at net book value 30,833 24,624 21,381 19,884
Reconciliations
Reconciliations of the carrying amounts of each class of plant and equipment are set out below:
Leasehold improvements
Carrying amount at beginning of financial year 12,949 15,222 11,797 14,706
Additions 1,796 593 684 624
Disposals (323) (27) - (743)
Amortisation (2,782) (2,855) (2,670) (2,790)
Effect of movements in foreign exchange 24 16 4 -
Carrying amount at end of financial year 11,664 12,949 9,815 11,797
Plant and equipment
Carrying amount at beginning of financial year 11,675 10,812 8,087 8,703
Additions 12,533 4,399 6,284 2,945
Disposals (269) (7) (20) (536)
Depreciation (5,245) (4,160) (2,938) (3,025)
Acquisitions through business combinations - 1,042 - -
Effect of movements in foreign exchange 475 (411) 153 -
Carrying amount at end of financial year 19,169 11,675 11,566 8,087

70
COCHLEAR ANNUAL REPORT 2006
Consolidated Company
2006 2005 2006 2005
Note $000 $000 $000 $000
15. Intangible assets
Goodwill at cost 185,352 168,002 - -
Acquired technology
At cost 3,702 3,334 - -
Accumulated amortisation (1,234) (278) - -
2,468 3,056 - -
Enterprise resource planning system
At cost 13,091 12,217 9,179 9,179
Accumulated amortisation (10,545) (7,178) (9,093) (7,179)
2,546 5,039 86 2,000
Customer relationships
At cost 5,433 5,002 - -
Accumulated amortisation (1,826) (417) - -
3,607 4,585 - -
Intellectual property capitalised, at cost(i) 6,788 6,825 - -
Capitalised development expenditure
At cost 7,385 7,524 7,385 7,524
Accumulated amortisation (3,345) (1,261) (3,345) (1,261)
4,040 6,263 4,040 6,263
Other intangible assets
At cost 583 590 - -
Accumulated amortisation (146) (31) - -
437 559 - -
Total intangible assets 205,238 194,329 4,126 8,263
(i) Intellectual property is not amortised on the basis that it has not yet reached the condition necessary for it to be capable of operating in the manner intended by the Consolidated Entity.
Notes to the financial statements Cochlear Limited and its controlled entities for the year ended 30 June 2006

71
Consolidated Company
2006 2005 2006 2005
Note $000 $000 $000 $000
Reconciliations
Reconciliations of the carrying amounts of each class of intangible assets are set out below:
Goodwill
Carrying amount at beginning of financial year 168,002 - - -
Acquisitions through business combinations - 181,922 - -
Effect of movements in foreign exchange 17,350 (13,920) - -
Carrying amount at end of financial year 185,352 168,002 - -
Acquired technology
Carrying amount at beginning of financial year 3,056 - - -
Acquisitions through business combinations - 3,334 - -
Amortisation (926) (278) - -
Effects of movements in foreign exchange 338 - - -
Carrying amount at end of financial year 2,468 3,056 - -
Enterprise resource planning system
Carrying amount at beginning of financial year 5,039 4,664 2,000 4,664
Other acquisitions 706 3,044 - 5
Amortisation (3,366) (2,669) (1,914) (2,669)
Effect of movements in foreign exchange 167 - - -
Carrying amount at end of financial year 2,546 5,039 86 2,000
Customer relationships
Carrying amount at beginning of financial year 4,585 - - -
Acquisitions through business combinations - 5,002 - -
Amortisation (1,238) (417) - -
Effect of movements in foreign exchange 260 - - -
Carrying amount at end of financial year 3,607 4,585 - -
Intellectual property capitalised, at cost
Carrying amount at beginning of financial year 6,825 6,825 - -
Acquisitions through business combinations - - - -
Amortisation - - - -
Effect of movements in foreign exchange (37) - - -
Carrying amount at end of financial year 6,788 6,825 - -
Capitalised development expenditure
Carrying amount at beginning of financial year 6,263 3,149 6,263 3,149
Development phase expenditure 179 4,375 179 4,375
Amortisation (2,402) (1,261) (2,402) (1,261)
Effect of movements in foreign exchange - - - -
Carrying amount at end of financial year 4,040 6,263 4,040 6,263

72
COCHLEAR ANNUAL REPORT 2006
Consolidated Company
2006 2005 2006 2005
Note $000 $000 $000 $000
Other intangible assets
Carrying amount at beginning of financial year 559 - - -
Acquisitions through business combinations - 590 - -
Amortisation (116) (31) - -
Effect of movements in foreign exchange (6) - - -
Carrying amount at end of financial year 437 559 - -
Amortisation charge
The amortisation charge is recognised in the administration expenses line except for amortisation of capitalised development expenditure which is recognised in the research and development expenses line in the income statement.
Impairment tests for cash generating units containing goodwill
The following units have significant carrying amounts of goodwill:
Consolidated Company
2006 2005 2006 2005
Note $000 $000 $000 $000
Americas 69,721 63,104 - -
Europe 109,518 99,344 - -
Asia Pacific 6,113 5,554 - -
185,352 168,002 - -
The recoverable amount of each cash generating unit is based on value-in-use calculations. Those calculations use cash flow projections based on actual operating results and the three year business plan. Cash flows for a further two year period are extrapolated using a 3.5% per annum growth rate and are appropriate because the related acquisitions are long-term businesses. This growth rate is consistent with the long-term average growth rate for the industry. A post-tax discount rate of 9.5% per annum has been used in discounting the projected cash flows.
The key assumptions and the approach to determining their value in the current period are:
Assumption How determined
Discount rate Based on weighted average cost of capital
Sales volume growth rate Based on a three year forecast taking into account historical growth rates and product lifecycle
Terminal value growth rate Based on a three year forecast taking into account historical growth rates and product lifecycle.
The recoverable amount of each cash generating unit including unallocated corporate assets is in excess of their carrying amounts and therefore no impairment charge was required. Any adverse change in assumptions could reduce the recoverable amount below the carrying amount.
Notes to the financial statements Cochlear Limited and its controlled entities for the year ended 30 June 2006

73
Assets Liabilities Net
2006 2005 2006 2005 2006 2005
$000 $000 $000 $000 $000 $000
16. Deferred tax assets and liabilities
Recognised deferred tax assets and liabilities
Consolidated
Plant and equipment 1,793 683 - (302) 1,793 381
Intangible assets - - (3,072) (4,339) (3,072) (4,339)
Inventories 9,682 6,936 - (1,686) 9,682 5,250
Prepayments - - (101) (75) (101) (75)
Employee benefits 754 780 - (3) 754 777
Provisions 8,535 13,138 - - 8,535 13,138
Deferred revenue 7,396 5,404 - - 7,396 5,404
Forward exchange contracts - - (1,541) (374) (1,541) (374)
Other 977 - (123) (98) 854 (98)
Tax value of loss carry-forwards recognised 5,967 2,400 - - 5,967 2,400
Net deferred tax assets/(liabilities) 35,104 29,341 (4,837) (6,877) 30,267 22,464
Company
Plant and equipment 1,103 485 - - 1,103 485
Intangible assets - - (1,212) (1,879) (1,212) (1,879)
Inventories 854 1,289 - - 854 1,289
Provisions 5,983 8,055 - - 5,983 8,055
Forward exchange contracts - - (1,541) (104) (1,541) (104)
Other - - (115) (97) (115) (97)
Net deferred tax assets/(liabilities) 7,940 9,829 (2,868) (2,080) 5,072 7,749
At 30 June 2006, a deferred tax liability of $14,282,667 (2005: $5,151,203) relating to an investment in a subsidiary has not been recognised because the Company controls whether the liability will be incurred and it is satisfied that it will not be incurred in the foreseeable future.

74
COCHLEAR ANNUAL REPORT 2006
Movement in temporary differences during the year
Consolidated Company
Amounts $000Balance at 1 July Recognised in
incomeRecognised in
equityBalance at 30
JuneBalance at 1 July Recognised in
incomeRecognised in
equityBalance at 30
June
2005
Plant and equipment 342 39 - 381 652 (167) - 485
Intangible assets (945) (3,394) - (4,339) (945) (934) - (1,879)
Inventories 3,645 1,605 - 5,250 866 423 - 1,289
Prepayments (72) (3) - (75) - - - -
Employee benefits 722 55 - 777 - - - -
Provisions 12,519 619 - 13,138 5,892 2,163 - 8,055
Deferred revenue 5,373 31 - 5,404 275 (275) - -
Foreign exchange movement (355) (19) - (374) (378) 274 - (104)
Other (278) 180 - (98) (278) 181 - (97)
Tax value of loss carry- forwards recognised - 2,400 - 2,400 - - - -
20,951 1,513 - 22,464 6,084 1,665 - 7,749
2006
Plant and equipment 381 1,412 - 1,793 485 618 - 1,103
Intangible assets (4,339) 1,267 - (3,072) (1,879) 667 - (1,212)
Inventories 5,250 4,432 - 9,682 1,289 (435) - 854
Prepayments (75) (26) - (101) - - - -
Employee benefits 777 (23) - 754 - - - -
Provisions 13,138 (4,603) - 8,535 8,055 (2,072) - 5,983
Deferred revenue 5,404 1,992 - 7,396 - - - -
Foreign exchange movement(i) (8,560) 374 6,645 (1,541) (8,290) 104 6,645 (1,541)
Other (98) 952 - 854 (97) (18) - (115)
Tax value of loss carry- forwards recognised 2,400 3,567 - 5,967 - - - -
14,278 9,344 6,645 30,267 (437) (1,136) 6,645 5,072
(i) Foreign exchange movement includes $8,186,000 of opening balance adjustment for the deferred tax liabilities on deferred gain on hedges as set out in Note 2.
Notes to the financial statements Cochlear Limited and its controlled entities for the year ended 30 June 2006

75
Consolidated Company
2006 2005 2006 2005
Note $000 $000 $000 $000
17. Payables
Trade creditors and other creditors 57,345 46,539 28,337 18,914
18. Other liabilities
Current
Deferred foreign exchange hedge gain - 17,350 - 17,350
Deferred revenue 23,525 28,046 857 972
Total current other liabilities 23,525 45,396 857 18,322
Non-current
Deferred foreign exchange hedge gain - 9,938 - 9,938
Forward exchange contracts 764 - 764 -
Total non-current other liabilities 764 9,938 764 9,938
19. Interest bearing liabilities
Current
Bank overdrafts 1,747 2,450 - 1,273
Bank loans, secured 68,800 61,657 - -
Total current interest bearing liabilities 70,547 64,107 - 1,273
Non-current
Bank loans, secured 125,493 138,951 - -
Financing arrangements
The Consolidated Entity has access to the following lines of credit at reporting date:
Bank overdrafts 3,747 3,177 2,000 2,000
Bank loans 200,309 237,056 5,000 5,000
Standby letters of credit 3,004 227 227 227
Bank guarantee facility 292 280 280 280
207,352 240,740 7,507 7,507
Facilities utilised at reporting date
Bank overdrafts 1,747 2,450 - 1,273
Bank loans 194,293 200,608 - -
Standby letters of credit 191 191 191 191
Bank guarantee facility 279 279 279 279
196,510 203,528 470 1,743
Facilities not utilised at reporting date
Bank overdrafts 2,000 727 2,000 727
Bank loans 6,016 36,448 5,000 5,000
Standby letters of credit 2,813 36 36 36
Bank guarantee facility 13 1 1 1
10,842 37,212 7,037 5,764

76
COCHLEAR ANNUAL REPORT 2006
Bank overdrafts
The bank overdrafts are payable on demand and are subject to annual review. Interest on bank overdrafts is variable and is charged at prevailing market rates.
Bank loans
The bank loans are secured by a letter of guarantee provided by the Company and are payable within one to five years. Refer to Note 30 for details.
Consolidated Company
2006 2005 2006 2005
Note $000 $000 $000 $000
20. Commitments
Operating lease commitments
Future non-cancellable operating lease rentals not provided for in the financial statements are payable as follows:
Not later than one year 5,886 5,165 2,323 1,995
Later than one year but not later than five years 12,881 15,979 5,076 6,221
Later than five years 2,647 3,161 - -
Total commitments 21,414 24,305 7,399 8,216
Capital expenditure commitments
Contracted but not provided for and payable:
Not later than one year 1,294 584 1,294 584
The Consolidated Entity leases property under non-cancellable operating leases expiring from one to seven years. Leases generally provide the Consolidated Entity with a right of renewal at which time all terms are renegotiated. Lease payments comprise a base amount plus an incremental contingent rental. Contingent rentals are based on movements in the Consumer Price Index.
Notes to the financial statements Cochlear Limited and its controlled entities for the year ended 30 June 2006

77
Consolidated Company
2006 2005 2006 2005
Note $000 $000 $000 $000
21. Provisions
Current
Employee benefits 28 14,633 10,949 8,020 7,253
Warranty 7,010 6,206 6,122 5,580
Other and legal 5,415 7,386 1,500 3,996
Total current provisions 27,058 24,541 15,642 16,829
Non-current
Employee benefits 2,007 2,377 1,292 1,158
Warranty 1,673 1,076 1,673 985
Directors’ retirement scheme 1,457 1,327 1,457 1,327
Make good lease costs 1,296 1,328 1,233 1,233
Total non-current provisions 6,433 6,108 5,655 4,703
Reconciliations
Reconciliations of the carrying amounts of each class of provision, except for the employee benefits provision, are set out below:
Warranty
Carrying amount at beginning of financial year 7,282 6,616 6,565 6,565
Provisions made during financial year 7,635 6,214 7,352 871
Acquisitions through business combinations - 658 - -
Provisions used during financial year (6,312) (6,206) (6,122) (871)
Effects of movements in foreign exchange 78 - - -
Carrying amount at end of financial year 8,683 7,282 7,795 6,565
Other and legal
Carrying amount at beginning of financial year 7,386 9,731 3,996 3,000
Provisions made during financial year 1,505 437 - 1,154
Acquisitions through business combinations - 375 - -
Provisions used during financial year (3,612) (3,157) (2,496) (158)
Effects of movements in foreign exchange 136 - - -
Carrying amount at end of financial year 5,415 7,386 1,500 3,996
Directors’ retirement scheme
Carrying amount at beginning of financial year 1,327 1,173 1,327 1,173
Provisions made during financial year 216 411 216 411
Provisions used during financial year (251) (257) (251) (257)
Unwind of discount 165 - 165 -
Carrying amount at end of financial year 1,457 1,327 1,457 1,327
Make good lease costs
Carrying amount at beginning of financial year 1,328 1,328 1,233 1,233
Provisions made during financial year 63 - - -
Provisions used during financial year (95) - - -
Carrying amount at end of financial year 1,296 1,328 1,233 1,233
78
COCHLEAR ANNUAL REPORT 2006
Employee benefits
Employee benefits include entitlements measured at present values of future amounts expected to be paid, based on a 5% per annum projected weighted average increase in remuneration rates over an average period of eight years. Present values are calculated using a weighted average rate of 6% per annum based on national government securities with similar maturity terms.
Warranties
Refer to Note 1(j) for details of how the provision balance is determined.
Other and legal .
For details of legal costs relating to the US Department of Justice Inquiry, refer Note 22. For details on the self-insurance provision, refer to Note 1(j).
Directors’ retirement scheme
Refer to Note 28.
Make good lease costs
Refer to Note 1(j) for details of how the provision balance is determined.
22. Contingent liabilities
The detail and estimated maximum amounts of contingent liabilities are set out below. The directors are of the opinion that provisions are either adequate or are not required in respect of these matters, as it is either not probable that a future sacrifice of economic benefits will be required, or the amount is not capable of reliable measurement.
US Department of Justice Inquiry
In March 2004, the Company was informed by the US Department of Justice (DOJ) that Cochlear Americas, a wholly-owned subsidiary, is subject to an inquiry under federal healthcare laws in the US that deal with the Medicare and Medicaid programs, including some with potential criminal and civil sanctions. Discussions with the DOJ are ongoing, but at the date of this report, no specific claims have been made. The Company is cooperating fully with the inquiry and has engaged a nationally recognised law firm with specialised expertise in US healthcare law.
In prior years, the Company has recorded a provision in respect of estimated cost of responding to the investigation.
Based on the information available at the date of this report, the financial impact of the investigation has been adequately provided for.
In the directors’ opinion, disclosure of any further information of the above matter would be prejudicial to the interests of the Company.
Guarantees
Cochlear Limited has provided guarantees to Westpac Institutional Bank for loan facilities provided to Cochlear Sweden Holdings, Cochlear Americas and Cochlear Europe Limited, all wholly-owned subsidiaries.
The Cochlear Sweden Holdings facility is a multi currency facility with a limit of euro 94.4 million, or equivalent thereof. The outstanding balance of the loan at reporting date was SEK 866.5 million (euro 94.4 million).
The Cochlear Americas facility is for USD 12.0 million. The outstanding balance of the loan at reporting date was USD 12.0 million.
The Cochlear Europe Limited facility is for GBP 7.5 million. The outstanding balance of the loan at reporting date was GBP 7.1 million.
Notes to the financial statements Cochlear Limited and its controlled entities for the year ended 30 June 2006

79
Consolidated Company
2006 2005 2006 2005
Note $000 $000 $000 $000
23. Issued capital
Share capital
54,636,995 (2005: 54,169,325) ordinary shares fully paid(i) 66,663 49,375 66,663 49,375
Issued share capital
54,812,840 (2005: 54,289,477) ordinary shares fully paid(i)
Movements in issued share capital
Balance at beginning of financial year 50,746 50,746 50,746 50,746
14,170 (2005: 72,870) shares issued for nil consideration under the Employee Share Plan(ii) - - - -
453,500 (2005: nil) shares issued from the exercise of options(iii) 17,288 - 17,288 -
55,693 (2005: 54,917) shares issued for nil consideration under the CELTIP(iv) - - - -
Balance at end of financial year 68,034 50,746 68,034 50,746
Treasury reserve
175,845 (2005: 120,152) ordinary shares fully paid(i)
Movements in treasury reserve
Balance at beginning of financial year (1,371) (1,371) (1,371) (1,371)
55,693 (2005: 54,917) shares issued for nil consideration under the CELTIP(iv) - - - -
Balance at end of financial year (1,371) (1,371) (1,371) (1,371)
Net share capital 66,663 49,375 66,663 49,375
(i) Holders of ordinary shares are entitled to receive dividends as declared from time to time and are entitled to one vote per share at shareholders’ meetings. Ordinary shares have no par value.
(ii) On 21 September 2005, the Company issued 14,170 shares to eligible employees of the Consolidated Entity under the Employee Share Plan for nil consideration.
(iii) On 21 September 2005, the Company issued 453,500 ordinary shares issued from the exercise of options granted under the ESOP.
(iv) On 16 December 2005, the Company issued 55,693 shares to eligible employees of the Consolidated Entity under the CELTIP for nil consideration.

80
COCHLEAR ANNUAL REPORT 2006
24. Reconciliation of movement in capital and reserves attributable to equity holders of the parent
Consolidated
Amounts $000Issued capital Treasury
reserveTranslation
reserveGeneral reserve
Hedging reserve
Retained earnings
Total Minority interest
Total equity
2005
Balance as at 1 July 2004 50,746 (1,371) (1,885) 84 - 86,154 133,728 6,511 140,239
Total recognised income and expense - - (2,106) (10) - 59,544 57,428 (1,770) 55,658
Crystallisation of foreign currency translation reserve - - - - - (996) (996) - (996)
Equity settled transactions - - - - - 2,592 2,592 - 2,592
Dividends to shareholders - - - - - (42,832) (42,832) - (42,832)
Balance at 30 June 2005 50,746 (1,371) (3,991) 74 - 104,462 149,920 4,741 154,661
2006
Balance as at 1 July 2005 50,746 (1,371) (3,991) 74 - 104,462 149,920 4,741 154,661
Effect of change in accounting policy - - - - 19,102 - 19,102 - 19,102
Opening balance at 1 July 2005 – restated 50,746 (1,371) (3,991) 74 19,102 104,462 169,022 4,741 173,763
Total recognised income and expense - - 3,329 2 (15,506) 80,032 67,857 (2,500) 65,357
Shares issued 17,288 - - - - - 17,288 - 17,288
Equity settled transactions - - - - - 2,466 2,466 - 2,466
Dividends to shareholders - - - - - (49,096) (49,096) - (49,096)
Balance at 30 June 2006 68,034 (1,371) (662) 76 3,596 137,864 207,537 2,241 209,778
Notes to the financial statements Cochlear Limited and its controlled entities for the year ended 30 June 2006

81
Company
Amounts $000Issued capital Treasury
reserveTranslation
reserveGeneral reserve
Hedging reserve
Retained earnings
Total Minority interest
Total equity
2005
Balance as at 1 July 2004 50,746 (1,371) (513) - - 75,952 124,814 - 124,814
Total recognised income and expense - - 385 - - 61,090 61,475 - 61,475
Shares issued - - - - - - - - -
Equity settled transactions - - - - - 1,811 1,811 - 1,811
Dividends to shareholders - - - - - (42,832) (42,832) - (42,832)
Balance at 30 June 2005 50,746 (1,371) (128) - - 96,021 145,268 - 145,268
2006
Balance as at 1 July 2005 50,746 (1,371) (128) - - 96,021 145,268 - 145,268
Effect of change in accounting policy - - - - 19,102 - 19,102 - 19,102
Opening balance at 1 July 2005 – restated 50,746 (1,371) (128) - 19,102 96,021 164,370 - 164,370
Total recognised income and expense - - (391) - (15,506) 67,359 51,462 - 51,462
Shares issued 17,288 - - - - - 17,288 - 17,288
Equity settled transactions - - - - - 1,673 1,673 - 1,673
Dividends to shareholders - - - - - (49,096) (49,096) - (49,096)
Balance at 30 June 2006 68,034 (1,371) (519) - 3,596 115,957 185,697 - 185,697
Treasury reserve
The treasury reserve comprises the on market value of shares acquired by the Trust.
Foreign currency translation reserve
The foreign currency translation reserve records the foreign currency differences arising from the translation of the financial statements of foreign operations where their functional currency is different to the presentation currency of the reporting entity. Refer to Note 1(f) for further details.
Hedging reserve
The hedging reserve comprises the effective portion of the cumulative net change in the fair value of cash flow hedging instruments related to hedged transactions that have not yet occurred.

82
COCHLEAR ANNUAL REPORT 2006
25. Notes to the statements of cash flows
Cash assets
The operating account received an average interest rate of:
• Company 4.8% (2005: 4.8%) per annum; and
• Consolidated 2.4% (2005: 1.3%) per annum.
Cash held on deposit for periods not exceeding 90 days received an average interest rate of:
• Company 5.6% (2005: 5.4%) per annum; and
• Consolidated 5.6% (2005: 5.4%) per annum.
(a) Reconciliation of cash and cash equivalents
For the purposes of the statements of cash flows, cash includes cash on hand and at bank and term deposits, net of outstanding bank overdrafts. Cash and cash equivalents as at reporting date as shown in the statements of cash flows is reconciled to the related items in the balance sheets as follows:
Consolidated Company
2006 2005 2006 2005
Note $000 $000 $000 $000
Cash on hand 62,778 33,299 3,163 64
Cash on deposit 24,295 72,778 24,295 72,127
87,073 106,077 27,458 72,191
Bank overdrafts 19 (1,747) (2,450) - (1,273)
85,326 103,627 27,458 70,918
(b) Reconciliation of net profit to net cash provided by operating activities
Net profit (including minority interest) 78,225 58,474 67,359 61,188
Add items classified as investing activities
Loss/(gain) on disposal of non-current assets 20 7 (177) -
Add non-cash items
Amounts set aside to provisions 18,681 10,243 11,179 7,493
Depreciation and amortisation 16,075 11,671 9,924 9,745
Share based payments 2,466 2,592 1,673 1,811
Net cash provided by operating activities before changes in assets and liabilities 115,467 82,987 89,958 80,237
Changes in assets and liabilities
Increase in receivables (29,464) (1,488) (61,981) (18,034)
(Increase)/decrease in inventories (27,304) 2,342 (21,483) 7,703
(Increase)/decrease in prepayments (1,930) 4,402 (326) (591)
(Increase)/decrease in deferred tax assets (7,803) (4,673) 2,677 (749)
Increase/(decrease) in payables 10,806 (1,252) 9,423 1,758
Increase in current tax liabilities 12,526 8,879 6,027 9,020
Decrease in provisions (15,840) (3,567) (11,414) (4,149)
(Decrease)/increase in deferred revenue (4,521) 19,071 (115) 972
Effects of movements in foreign exchange (382) (3,691) (830) (128)
Net cash provided by operating activities 51,555 103,010 11,936 76,039
Notes to the financial statements Cochlear Limited and its controlled entities for the year ended 30 June 2006
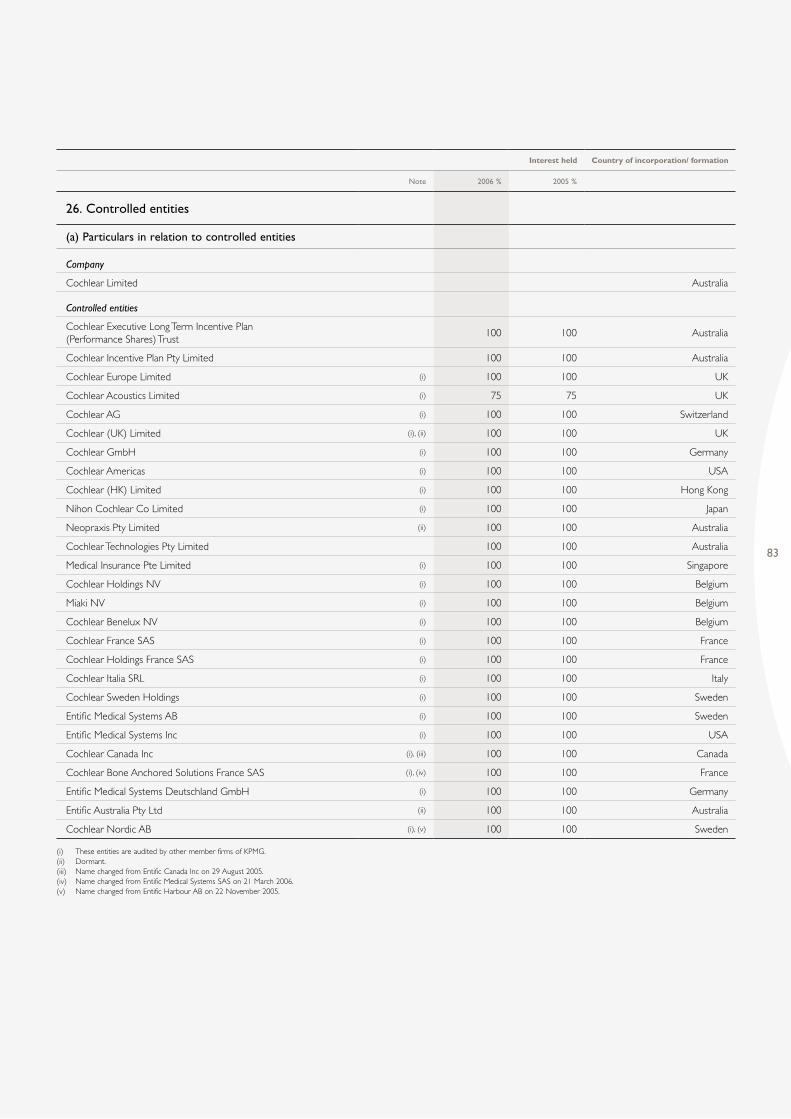
83
Interest held Country of incorporation/ formation
Note 2006 % 2005 %
26. Controlled entities
(a) Particulars in relation to controlled entities
Company
Cochlear Limited Australia
Controlled entities
Cochlear Executive Long Term Incentive Plan (Performance Shares) Trust
100 100 Australia
Cochlear Incentive Plan Pty Limited 100 100 Australia
Cochlear Europe Limited (i) 100 100 UK
Cochlear Acoustics Limited (i) 75 75 UK
Cochlear AG (i) 100 100 Switzerland
Cochlear (UK) Limited (i), (ii) 100 100 UK
Cochlear GmbH (i) 100 100 Germany
Cochlear Americas (i) 100 100 USA
Cochlear (HK) Limited (i) 100 100 Hong Kong
Nihon Cochlear Co Limited (i) 100 100 Japan
Neopraxis Pty Limited (ii) 100 100 Australia
Cochlear Technologies Pty Limited 100 100 Australia
Medical Insurance Pte Limited (i) 100 100 Singapore
Cochlear Holdings NV (i) 100 100 Belgium
Miaki NV (i) 100 100 Belgium
Cochlear Benelux NV (i) 100 100 Belgium
Cochlear France SAS (i) 100 100 France
Cochlear Holdings France SAS (i) 100 100 France
Cochlear Italia SRL (i) 100 100 Italy
Cochlear Sweden Holdings (i) 100 100 Sweden
Entific Medical Systems AB (i) 100 100 Sweden
Entific Medical Systems Inc (i) 100 100 USA
Cochlear Canada Inc (i), (iii) 100 100 Canada
Cochlear Bone Anchored Solutions France SAS (i), (iv) 100 100 France
Entific Medical Systems Deutschland GmbH (i) 100 100 Germany
Entific Australia Pty Ltd (ii) 100 100 Australia
Cochlear Nordic AB (i), (v) 100 100 Sweden
(i) These entities are audited by other member firms of KPMG. (ii) Dormant. (iii) Name changed from Entific Canada Inc on 29 August 2005. (iv) Name changed from Entific Medical Systems SAS on 21 March 2006. (v) Name changed from Entific Harbour AB on 22 November 2005.
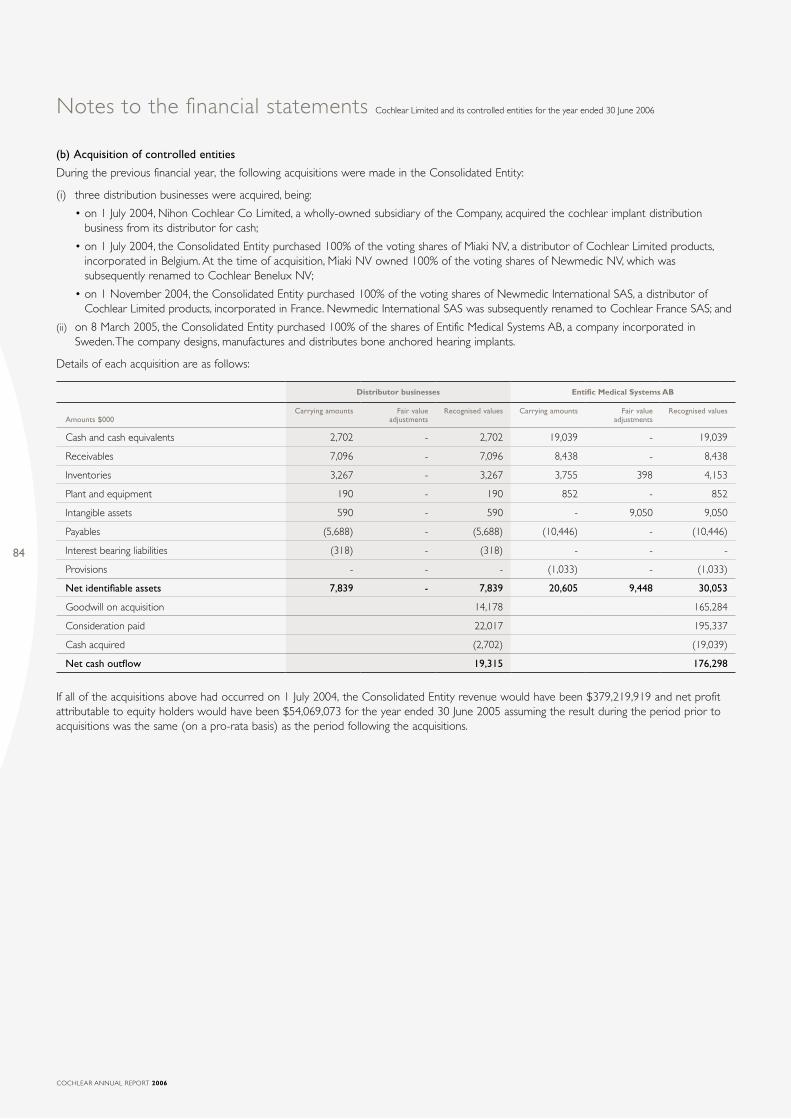
84
COCHLEAR ANNUAL REPORT 2006
(b) Acquisition of controlled entities
During the previous financial year, the following acquisitions were made in the Consolidated Entity:
(i) three distribution businesses were acquired, being:
• on 1 July 2004, Nihon Cochlear Co Limited, a wholly-owned subsidiary of the Company, acquired the cochlear implant distribution business from its distributor for cash;
• on 1 July 2004, the Consolidated Entity purchased 100% of the voting shares of Miaki NV, a distributor of Cochlear Limited products, incorporated in Belgium. At the time of acquisition, Miaki NV owned 100% of the voting shares of Newmedic NV, which was subsequently renamed to Cochlear Benelux NV;
• on 1 November 2004, the Consolidated Entity purchased 100% of the voting shares of Newmedic International SAS, a distributor of Cochlear Limited products, incorporated in France. Newmedic International SAS was subsequently renamed to Cochlear France SAS; and
(ii) on 8 March 2005, the Consolidated Entity purchased 100% of the shares of Entific Medical Systems AB, a company incorporated in Sweden. The company designs, manufactures and distributes bone anchored hearing implants.
Details of each acquisition are as follows:
Distributor businesses Entific Medical Systems AB
Amounts $000Carrying amounts Fair value
adjustmentsRecognised values Carrying amounts Fair value
adjustmentsRecognised values
Cash and cash equivalents 2,702 - 2,702 19,039 - 19,039
Receivables 7,096 - 7,096 8,438 - 8,438
Inventories 3,267 - 3,267 3,755 398 4,153
Plant and equipment 190 - 190 852 - 852
Intangible assets 590 - 590 - 9,050 9,050
Payables (5,688) - (5,688) (10,446) - (10,446)
Interest bearing liabilities (318) - (318) - - -
Provisions - - - (1,033) - (1,033)
Net identifiable assets 7,839 - 7,839 20,605 9,448 30,053
Goodwill on acquisition 14,178 165,284
Consideration paid 22,017 195,337
Cash acquired (2,702) (19,039)
Net cash outflow 19,315 176,298
If all of the acquisitions above had occurred on 1 July 2004, the Consolidated Entity revenue would have been $379,219,919 and net profit attributable to equity holders would have been $54,069,073 for the year ended 30 June 2005 assuming the result during the period prior to acquisitions was the same (on a pro-rata basis) as the period following the acquisitions.
Notes to the financial statements Cochlear Limited and its controlled entities for the year ended 30 June 2006

85
27. Key management personnel disclosures
The following were key management personnel of the Consolidated Entity at any time during the reporting period and unless otherwise indicated were key management personnel for the entire period:
Non-executive directorsMr TCE Bergman (Chairman)
Prof BDO Anderson, AO (resigned 20 October 2005)
Mr PR Bell (appointed 1 August 2005)
Prof E Byrne, AO
Mr R Holliday-Smith
Mr PJ North, AM
Mr DP O’Dwyer (appointed 1 August 2005)
Mr J H Veeneklaas
Executive directorsDr CG Roberts
Dr JL Parker
ExecutivesMr R Brook
Mr NJ Mitchell
Mr MD Salmon
Mr CM Smith.
Key management personnel disclosures
The key management personnel compensation is included in employee benefits expense as follows:
Consolidated Company
2006 2005 2006 2005
Note $000 $000 $000 $000
Short-term employee benefits 4,766 4,568 3,604 3,266
Post-employment benefits 595 583 560 535
Other long-term benefits 36 28 36 28
Equity compensation benefits 773 474 505 288
6,170 5,653 4,705 4,117
Information regarding individual directors and executives remuneration is provided in the Remuneration Report in the Directors’ Report on pages 38 to 46.

86
COCHLEAR ANNUAL REPORT 2006
Options and performance shares granted as compensationThe movement during the financial year in the number of options and performance shares over ordinary shares of Cochlear Limited held, directly, indirectly or beneficially, by each key management person, including their personally related entities, is as follows:
Held at 1 July 2005 Granted as remuneration
Vested and exercised
Forfeited Held at 30 June 2006
Vested and exercisable at 30
June 2006
Option holdings
Executive directors
Dr CG Roberts 164,321 79,468 - - 243,789 -
Dr JL Parker 112,733 28,447 (25,000) (25,000) 91,180 -
Executives
Mr R Brook 80,782 36,138 - - 116,920 -
Mr NJ Mitchell 107,847 27,949 (25,000) (25,000) 85,796 -
Mr MD Salmon 38,904 27,174 - - 66,078 -
Mr CM Smith 165,830 28,646 - - 194,476 -
Performance share holdings
Executive directors
Dr CG Roberts 10,595 5,923 - - 16,518 -
Dr JL Parker 5,365 2,120 - - 7,485 -
Executives
Mr R Brook 6,879 2,694 - - 9,573 -
Mr NJ Mitchell 4,946 2,083 - - 7,029 -
Mr MD Salmon 2,508 2,025 - - 4,533 -
Mr CM Smith - 2,135 - - 2,135 -
No options held by key management personnel are vested but not exercisable.
All options and performance shares granted in the 2006 financial year were granted on 22 August 2005 and vest in August 2008. Options have an expiration date of 30 September 2010. No options or performance shares have been granted since the end of the financial year. The options and performance shares were provided at no cost to the recipients.
All options granted during the financial year have an exercise price of $39.93 per share and a fair value of $4.63 per share at grant date for options with performance based conditions and $3.48 per share at grant date for options with market based conditions. The performance shares granted during the financial year had a fair value at grant date of $21.36 per share for performance shares with performance based conditions and $16.02 per share at grant date for performance shares with market based conditions.
Notes to the financial statements Cochlear Limited and its controlled entities for the year ended 30 June 2006

87
Held at 1 July 2004 Granted as remuneration
Vested and exercised
Forfeited Held at 30 June 2005
Vested and exercisable at 30
June 2005
Option holdings
Executive directors
Dr CG Roberts - 164,321 - - 164,321 -
Dr JL Parker 70,584 42,149 - - 112,733 -
Executives
Mr R Brook 26,046 54,736 - - 80,782 -
Mr NJ Mitchell 68,961 38,886 - - 107,847 -
Mr MD Salmon - 38,904 - - 38,904 -
Mr CM Smith - 165,830 - - 165,830 -
Performance share holdings
Executive directors
Dr CG Roberts - 10,595 - - 10,595 -
Dr JL Parker 2,648 2,717 - - 5,365 -
Executives
Mr R Brook 3,350 3,529 - - 6,879 -
Mr NJ Mitchell 2,439 2,507 - - 4,946 -
Mr MD Salmon - 2,508 - - 2,508 -
Mr CM Smith - - - - - -

88
COCHLEAR ANNUAL REPORT 2006
Movement in shares
The movement during the financial year in the number of ordinary shares of Cochlear Limited held, directly, indirectly or beneficially, by each key management person, including their personally related entities, is as follows:
Held at 1 July 2005 Purchases Received on exercise of options
Sales Held at 30 June 2006
Directors
Non-executive
Mr TCE Bergman 12,000 - - - 12,000
Mr PR Bell - 1,500 - - 1,500
Prof E Byrne, AO 1,000 - - - 1,000
Mr R Holliday-Smith 1,000 - - - 1,000
Mr PJ North, AM 13,000 - - - 13,000
Mr DP O’Dwyer - 2,450 - - 2,450
Mr JH Veeneklaas 1,000 - - - 1,000
Executive
Dr CG Roberts 237,000 - - - 237,000
Dr JL Parker 25,000 - 25,000 (25,000) 25,000
Executives
Mr R Brook - - - - -
Mr NJ Mitchell 35,000 - 25,000 (25,000) 35,000
Mr MD Salmon 1,457 1,000 - - 2,457
Mr CM Smith - - - - -
Held at 1 July 2004 Purchases Received on exercise of options
Sales Held at 30 June 2005
Directors
Non-executive
Mr TCE Bergman 12,000 - - - 12,000
Mr PR Bell(i) n/a n/a n/a n/a n/a
Prof E Byrne, AO 1,000 - - - 1,000
Mr R Holliday-Smith - 1,000 - - 1,000
Mr PJ North, AM 13,000 - - - 13,000
Mr DP O’Dwyer(i) n/a n/a n/a n/a n/a
Mr JH Veeneklaas 1,000 - - - 1,000
Non-executive
Dr CG Roberts 162,000 75,000 - - 237,000
Dr JL Parker 25,000 - - - 25,000
Executives
Mr R Brook - - - - -
Mr NJ Mitchell 15,000 20,000 - - 35,000
Mr MD Salmon - 1,457 - - 1,457
Mr CM Smith - - - - -
(i) Appointed director on 1 August 2005.
Notes to the financial statements Cochlear Limited and its controlled entities for the year ended 30 June 2006

89
Consolidated Company
2006 2005 2006 2005
Note $000 $000 $000 $000
28. Employee benefits
Current
Liability for long service leave 2,586 1,381 1,731 1,381
Liability for annual leave 6,565 5,138 4,346 3,643
Liability for short-term incentives 5,482 4,440 1,943 2,229
21 14,633 10,959 8,020 7,253
Salary and wages accrued 2,664 1,500 1,122 710
Total current employee benefits 17,297 12,459 9,142 7,963
Non-current
Present value of funded defined benefit obligation 3,293 4,089 3,293 4,089
Fair value of plan assets – funded (3,647) (4,891) (3,647) (4,891)
Present value of net obligations (354) (802) (354) (802)
Adjustment for asset ceiling 30 478 30 478
Recognised liability for defined benefit obligation(i) (324) (324) (324) (324)
Liability for long service leave 21 2,007 2,377 1,292 1,158
Directors’ retirement scheme(ii) 21 1,457 1,327 1,457 1,327
Total employee benefits 3,140 3,380 2,425 2,161
(i) Recognised in other assets.
(ii) The Cochlear Limited directors’ retirement scheme provides retiring non-executive directors with more than five years service the benefit of up to three times their average annual remuneration over the previous three years. The directors’ retirement scheme was closed to new directors effective from 2003.
(a) Liability for defined benefit obligation
The Consolidated Entity and the Company make contributions to defined benefit plans that provide pension benefits for employees upon retirement.
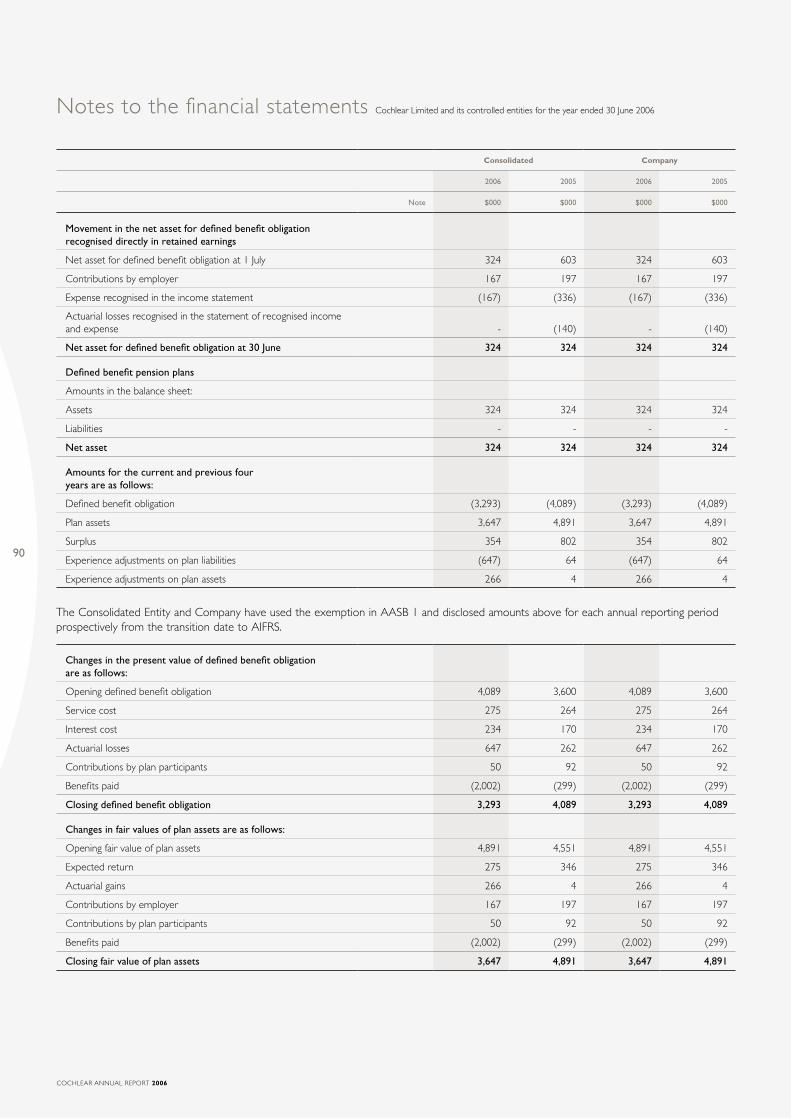
90
COCHLEAR ANNUAL REPORT 2006
Consolidated Company
2006 2005 2006 2005
Note $000 $000 $000 $000
Movement in the net asset for defined benefit obligation recognised directly in retained earnings
Net asset for defined benefit obligation at 1 July 324 603 324 603
Contributions by employer 167 197 167 197
Expense recognised in the income statement (167) (336) (167) (336)
Actuarial losses recognised in the statement of recognised income and expense - (140) - (140)
Net asset for defined benefit obligation at 30 June 324 324 324 324
Defined benefit pension plans
Amounts in the balance sheet:
Assets 324 324 324 324
Liabilities - - - -
Net asset 324 324 324 324
Amounts for the current and previous four years are as follows:
Defined benefit obligation (3,293) (4,089) (3,293) (4,089)
Plan assets 3,647 4,891 3,647 4,891
Surplus 354 802 354 802
Experience adjustments on plan liabilities (647) 64 (647) 64
Experience adjustments on plan assets 266 4 266 4
The Consolidated Entity and Company have used the exemption in AASB 1 and disclosed amounts above for each annual reporting period prospectively from the transition date to AIFRS.
Changes in the present value of defined benefit obligation are as follows:
Opening defined benefit obligation 4,089 3,600 4,089 3,600
Service cost 275 264 275 264
Interest cost 234 170 234 170
Actuarial losses 647 262 647 262
Contributions by plan participants 50 92 50 92
Benefits paid (2,002) (299) (2,002) (299)
Closing defined benefit obligation 3,293 4,089 3,293 4,089
Changes in fair values of plan assets are as follows:
Opening fair value of plan assets 4,891 4,551 4,891 4,551
Expected return 275 346 275 346
Actuarial gains 266 4 266 4
Contributions by employer 167 197 167 197
Contributions by plan participants 50 92 50 92
Benefits paid (2,002) (299) (2,002) (299)
Closing fair value of plan assets 3,647 4,891 3,647 4,891
Notes to the financial statements Cochlear Limited and its controlled entities for the year ended 30 June 2006

91
The major categories of plan assets as a percentage of total plan assets are as follows:
Consolidated Company
2006 2005 2006 2005
Australian equities 23.5% 24.5% 23.5% 24.5%
Australian fixed interest 25.7% 15.0% 25.7% 15.0%
International fixed interest 9.2% 10.0% 9.2% 10.0%
Property 4.3% 2.8% 4.3% 2.8%
Cash 16.5% 26.0% 16.5% 26.0%
The Consolidated Entity’s investment policies and strategies for the pension benefits do not use target allocations for the individual asset categories. The Consolidated Entity’s investment goals are to maximise returns subject to specific risk management policies. The Consolidated Entity addresses diversification by the use of mutual fund investments whose underlying investments are in a balanced portfolio of growth and defensive assets. These mutual fund investments are readily marketable and can be sold to fund benefit payment obligations as they become payable.
Consolidated Company
2006 2005 2006 2005
Expense recognised in the income statement
Service cost 275 264 275 264
Interest cost 234 170 234 170
Expected return (275) (346) (275) (346)
Adjustment for asset ceiling (67) 248 (67) 248
167 336 167 336
Expenses are recognised in the administration expenses line of the income statement.
The actual return on plan assets for the year ended 30 June 2006 was $416,000 (2005: $350,000).
The Consolidated Entity expects to contribute $370,014 to its defined benefit plans in the 2007 financial year.
Principal actuarial assumptions
Principal actuarial assumptions at the reporting date (expressed as weighted averages per annum):
Consolidated Company
2006 2005 2006 2005
Discount rate at 30 June 5.7% 5.2% 5.7% 5.2%
Expected return on plan assets at 30 June 7.7% 7.3% 7.7% 7.3%
Future salary increases 4.0% 4.0% 4.0% 4.0%
The overall expected long-term rate of return on assets is 7.7% per annum.The expected long-term rate of return is based on the portfolio as a whole and not on the sum of the returns on individual asset categories.The return is based exclusively on historical returns, without adjustments.

92
COCHLEAR ANNUAL REPORT 2006
Notes to the financial statements Cochlear Limited and its controlled entities for the year ended 30 June 2006
(b) Surplus for each defined benefit plan on a funding basis
Consolidated
2006(i) 2005(ii)
Amounts $000
Plan assets Accrued benefit(iii)
Plan surplus/(deficit)
Contribution recommendations
(per year)(iv)
Plan assets Accrued benefits(iii)
Plan surplus/(deficit)
Contribution recommendations
(per year)(iv)
Cochlear superannuation plans 27,667 27,313 354 4,131 19,714 18,566 1,148 3,934
(i) Plan assets at net market value, and accrued benefits have been calculated at 30 June 2006, being the date of the most recent financial statements of the plans.
(ii) Plan assets at net market value and accrued benefits were calculated at 30 June 2005, being the date of the most recent financial statements of the plans.
(iii) Accrued benefits are benefits which the plans are presently obliged to pay at some future date, as a result of membership of the plans and calculated in accordance with AAS 25 Financial Reporting by Superannuation Plans. Accordingly, the surplus does not always equal the defined benefit obligation.The Consolidated Entity has a legal liability to make up a deficit in the funds but no legal right to benefit from any surplus in the funds other than by way of contribution holiday.
(iv) Contribution recommendations are based on a funding methodology that will result in adequate funding for payments expected to be made over the next five years. The levels of the contributions to the plans are reassessed annually.
The principal economic assumptions used in making these recommendations include (on a per annum basis):
Consolidate
2006 2005
Expected return on plan assets 7.7% 7.3%
Future salary increases 4.0% 4.0%
(c) Defined contribution superannuation plan
The Consolidated Entity makes contributions to defined contribution superannuation plans. The amount recognised as expense was $5,607,060 for the year ended 30 June 2006 (2005: $4,442,242).
(d) Share based payments
The Company’s Employee Share Plan was approved by special resolution at the Annual General Meeting held on 19 October 1999. Under this plan, the directors can at their discretion, allocate at nil consideration up to a maximum of $2,000 worth of shares per eligible employee in any one year. The fair value of shares issued during the reporting period is the market price of the Company’s shares on the ASX as at the start of trading on the issue date. Shares under the plan vest with the employee immediately but are non-transferable for a period of up to three years.
The CELTIP was approved and adopted at the Annual General Meeting on 20 October 2003 and replaced the ESOP. The CELTIP offers a mixture of options over unissued shares and performance shares. Both the options and the performance shares are subject to a three year vesting period. The number of options and shares exercisable by the executives will depend on the performance of the Consolidated Entity over the vesting period. Half of the offer will be assessed against the compound annual growth rate of the earnings per share achieved by the Consolidated Entity, and the other half against the total shareholder return (TSR) as measured against the S&P/ASX 100. If the minimum compound annual growth rate in earnings per share of 10% is not achieved, 50% of shares will not be issued or released to the executives. If the Consolidated Entity is below the 50th percentile against the S&P/ASX 100 over the three years, the remaining 50% of shares will not be issued or released.
To achieve a 100% allocation of options and shares, compound annual growth rate in earnings per share of 20% must be achieved and the TSR of the Consolidated Entity must be in at least the 75th percentile against the S&P/ASX 100.

93
At the date of this report, unissued ordinary shares of the Company under option and issued shares held in the Trust are:
Grant date Number of instruments
Conditions for minimum vesting Contractual life of options
Option grant in December 2003
96,380 Three years of service, a minimum compound annual growth rate in earnings per share of 10%.
5 years
96,381 The Consolidated Entity is above the 50th percentile against the S&P/ASX 100 over three years.
5 years
Option grant in August 2004
357,770 Three years of service, a minimum compound annual growth rate in earnings per share of 10%.
5 years
357,770 The Consolidated Entity is above the 50th percentile against the S&P/ASX 100 over three years.
5 years
Option grant in August 2005
362,952 Three years of service, a minimum compound annual growth rate in earnings per share of 10%.
5 years
362,951 The Consolidated Entity is above the 50th percentile against the S&P/ASX 100 over three years.
5 years
Total options 1,634,204Contractual life of shares in the Trust
Performance shares issued in December 2003
27,122 Three years of service, a minimum compound annual growth rate in earnings per share of 10%.
5 years
27,122 The Consolidated Entity is above the 50th percentile against the S&P/ASX 100 over three years.
5 years
Performance shares issued in August 2004
29,214 Three years of service, a minimum compound annual growth rate in earnings per share of 10%.
5 years
29,215 The Consolidated Entity is above the 50th percentile against the S&P/ASX 100 over three years.
5 years
Performance shares issued in August 2005
31,086 Three years of service, a minimum compound annual growth rate in earnings per share of 10%.
5 years
31,086 The Consolidated Entity is above the 50th percentile against the S&P/ASX 100 over three years.
5 years
Total performance shares 174,845
Weighted average
exercise price $
Number of options
Weighted average
exercise price $
Number of options
2006 2006 2005 2005
Outstanding at beginning of financial year 30.27 1,898,251 37.55 2,148,761
Forfeited during financial year 18.97 (22,950) 37.66 (989,000)
Exercised/forfeited during financial year(i) 38.12 (967,000) - -
Granted during financial year 39.93 725,903 18.97 738,490
Outstanding at end of financial year 30.10 1,634,204 30.27 1,898,251
Exercisable at end of financial year 34.19 192,761 38.12 967,000
(i) Weighted average share price at date of exercise was $40.84.
The estimated value of options for the current financial year is calculated at the date of grant using the Black-Scholes model, applying a 25% volatility, as reflected in the historical volatility.
For options outstanding at the end of the year, 715,540 options have an exercise price of $18.97 with the remaining balance falling within the range of $34.19 – $39.93 (2005: 738,490 options at $18.97 and the remainder falling within the range of $34.19 – $38.12). The weighted average remaining contractual life of options outstanding at the end of the year is three years (2005: two years).

94
COCHLEAR ANNUAL REPORT 2006
Notes to the financial statements Cochlear Limited and its controlled entities for the year ended 30 June 2006
29. Related parties
Non-director related parties
The Company engages in purchases and sales of goods with its controlled entities and pays a licence fee for the use of intellectual property. These transactions are in the ordinary course of business on a transfer pricing basis and 45 day terms apply.
The aggregate amounts included in the profit before tax for the Company that resulted from transactions with non-director related parties are:
Company
2006 2005
$000 $000
Revenue from the sale of goods 229,657 175,333
Distribution, marketing and field technical expenses 7,600 -
Interest income 3,126 175
Dividends from controlled entities - 5,131
Interest expense 365 270
The aggregate amounts receivable from wholly-owned controlled entities by the Company at reporting date are:
Current receivables 88,782 30,542
30. Financial instruments
Exposure to credit, foreign exchange and interest rate risks arises in the normal course of the Consolidated Entity’s business. Derivative financial instruments are used to hedge exposure to fluctuations in foreign exchange rates.
Credit risk
At the balance sheet date, there was no significant concentrations of credit risk. The maximum exposure to credit risk is represented by the carrying amount of each financial asset, including derivative financial instruments, in the balance sheet.
Foreign exchange risk
The Consolidated Entity and the Company are exposed to changes in foreign exchange rates from their activities. It is the Consolidated Entity’s and the Company’s policy to use forward exchange contracts to hedge these risks. The Consolidated Entity and the Company do not enter, hold or issue derivative financial instruments for trading purposes.
The Company enters into forward exchange contracts to hedge anticipated sales and purchases in US dollars, euro, Japanese yen, Hong Kong dollars and Swedish kroner.
The amounts of forward cover taken are in accordance with approved policy and internal forecasts.

95
The following table sets out the gross value to be received under forward exchange contracts and the weighted average contracted exchange rates of outstanding contracts:
Foreign exchange rates Consolidated
2006 2005 2006 2005
Note $000 $000
Sell United States dollar
Not later than one year 95,937 67,346
Later than one year but not later than two years 45,802 37,842
Later than two years but not later than three years 5,956 4,052
Weighted average exchange rates contracted 0.72 0.67
Sell euro
Not later than one year 104,656 62,031
Later than one year but not later than two years 56,251 37,496
Later than two years but not later than three years 6,070 3,479
Weighted average exchange rates contracted 0.57 0.56
Sell Japanese yen
Not later than one year 8,962 9,204
Later than one year but not later than two years 3,893 4,536
Later than two years but not later than three years 503 -
Weighted average exchange rates contracted 68.43 50.03
Sell Hong Kong dollar
Not later than one year - 10,160
Later than one year but not later than two years - 5,107
Later than two years but not later than three years - -
Weighted average exchange rates contracted - 4.87
Buy Sweden kroner
Not later than one year 24,986 -
Later than one year but not later than two years 36,056 -
Later than two years but not later than three years - -
Weighted average exchange rates contracted 5.29 -
Forecast transactions
The Consolidated Entity classifies its forward exchange contracts hedging forecast transactions as cash flow hedges and states them at fair value. The fair value of forward exchange contracts at 1 July 2005 was adjusted against the opening balance of the hedging reserve at that date.
The net fair value of forward exchange contracts used as hedges of forecast transactions at 30 June 2006 was $5.1 million (2005: $27.3 million).

96
COCHLEAR ANNUAL REPORT 2006
Notes to the financial statements Cochlear Limited and its controlled entities for the year ended 30 June 2006
Interest rate risk
Effective interest rates, repayment and repricing analysis In respect of interest bearing financial liabilities, the following table indicates their effective interest rates at the reporting date. As the liabilities are subject to variable interest rates, they reprice within six months. The repayment schedule is as follows:
Consolidated 2006 2005
Amounts $000
Effective interest rate
per annum
12 months or less
1 – 2 years 2 – 5 years More than 5 years
Total Effective interest rate
per annum
12 months or less
1 – 2 years 2 – 5 years More than 5 years
Total
Secured bank loans:
GBP floating rate loan
5.1% 17,511 - - - 17,511 3.9% 15,060 - - - 15,060
SEK floating rate loan 3.2% 34,902 34,902 90,591 - 160,395 2.6% 32,361 31,439 107,512 - 171,312
USD floating rate loan
5.7% 16,387 - - - 16,387 3.5% 14,236 - - - 14,236
JPY bank overdraft 1.7% 1,747 - - - 1,747 1.7% 1,177 - - - 1,177
AUD bank overdraft - - - - - - 8.8% 1,273 - - - 1,273
70,547 34,902 90,591 - 196,040 64,107 31,439 107,512 - 203,058
Company 2006 2005
Amounts $000
Effective interest rate
per annum
12 months or less
1 – 2 years 2 – 5 years More than 5 years
Total Effective interest rate
per annum
12 months or less
1 – 2 years 2 – 5 years More than 5 years
Total
AUD bank overdraft - - - - - - 8.8% 1,273 - - - 1,273
Trade receivables and trade payables are not interest bearing and the related cash flows are not subject to interest rate risk.
31. Impact of adopting Australian equivalents to International Financial Reporting Standards
Impact of transition to AIFRS
As stated in Note 1(a), these are the Consolidated Entity’s and the Company’s first consolidated financial statements prepared in accordance with AIFRS.
The policies set out in Note 1(a) have been applied in preparing the financial statements for the year ended 30 June 2006 and the comparative information presented in these financial statements for the year ended 30 June 2005 and in the preparation of an opening AIFRS balance sheet at 1 July 2004 (the Consolidated Entity’s date of transition).
In preparing their opening AIFRS balance sheet, the Consolidated Entity and the Company have adjusted amounts reported previously in financial statements prepared in accordance with previous GAAP. An explanation of how the transition from previous GAAP to AIFRS has affected the Consolidated Entity’s and the Company’s financial position, financial performance and cash flows is set out in the following tables and the notes that accompany the tables.
(a) Reclassifications
Under AIFRS, financial income consisting of interest income and foreign exchange gains has been transferred from the revenue line to the net financing income line in the income statement for the year ended 30 June 2005, resulting in a reduction in revenue of $2,700,000 for the Consolidated Entity (Company: $2,658,000).
In addition, other income has been reclassified from revenue to form part of operating profit before net financing income. This resulted in a reduction to revenue of $963,000 for the year ended 30 June 2005 for the Consolidated Entity (Company: $5,946,000).
Under previous GAAP, enterprise resource planning system development costs were classified as plant and equipment in the financial statements. Under AIFRS, these costs have been reclassified as intangible assets. For the Consolidated Entity and the Company, this resulted in $3,899,000 being reclassified from plant and equipment to intangible assets at 1 July 2004 and $5,039,000 for the Consolidated Entity (Company: $2,000,000) at 30 June 2005.
Other debtor balances have been reclassified from other assets to receivables. This resulted in an increase in receivables in the Consolidated Entity of $9,164,000 (Company: $3,275,000) at 1 July 2004 and $8,686,000 for the Consolidated Entity (Company: $2,916,000) at 30 June 2005.
Other non-current receivables have been reclassified from non-current receivables to non-current other financial assets. This resulted in an increase in non-current other financial assets in the Consolidated Entity of $175,000 (Company: nil) at 1 July 2004 and $187,000 for the Consolidated Entity (Company: $32,000) at 30 June 2005.

97
(b) Business combinations
As permitted by the election available under AASB 1, the classification and accounting treatment of business combinations that occurred prior to transition date have not been restated in preparing the transition date AIFRS balance sheet. The assets and liabilities are subject to the other requirements of AASB 1, as discussed below.
Under AIFRS, inventories acquired as part of a business combination are recognised at fair value rather than historical cost. The impact of this change at the transition date is nil. For the year ended 30 June 2005, the value of inventories increased by $398,000 with a corresponding decrease to goodwill for the Consolidated Entity.
This fair value adjustment was recognised as an expense during the year ended 30 June 2006 following the sale of inventories in the normal course of business.
Business combinations that occurred on or after 1 July 2004 must be accounted for by applying the purchase method. There were no adjustments for either the Consolidated Entity or the Company as a result of transition to AIFRS as there were no contingent liabilities or restructuring provisions at the respective acquisition dates.
(c) Intangible assets
GoodwillGoodwill represents the difference between the cost of a business combination over the net fair value of the identifiable assets, liabilities and contingent liabilities acquired.
Goodwill is stated at cost less any accumulated impairment losses. Goodwill is allocated to cash generating units and tested annually for impairment (refer to (d) for further details on impairment testing).
Research and development expenditureUnder AIFRS, expenditure on development activities is capitalised if the product or process is technically and commercially feasible and the Consolidated Entity has sufficient resources to complete the development. Capitalised development expenditure is stated at cost less accumulated amortisation and impairment losses. Under previous GAAP, the Consolidated Entity expensed all development expenditure as incurred.
Development expenditure incurred which meet the criteria for deferral was capitalised and an adjustment of $3,149,000 was made as an increase to retained earnings for both the Consolidated Entity and the Company at 1 July 2004. For the year ended 30 June 2005, a further $4,377,000 of expenditure was deferred. The research and development expenses of the Consolidated Entity and the Company decreased by $4,377,000 for the year ended 30 June 2005 as a result of this capitalisation.
Capitalised development expenditure was tested for impairment. No impairment losses were required.
Other intangible assetsOther intangible assets acquired are stated at cost less accumulated amortisation and impairment losses. On transition and at each subsequent reporting date, other intangible assets are reviewed to ensure they can be recognised under AASB 138 Intangible Assets and tested for impairment. No reclassifications or impairment losses were required.
AmortisationAmortisation is recognised on a straight-line basis over the estimated useful lives of the intangible assets. Amortisation commences from the date the intangible asset is available for use. Changes in useful life on transition to AIFRS were accounted for prospectively. Goodwill is not subject to amortisation but tested for impairment annually. The estimated useful lives are as follows:
AIFRS Previous GAAP
Goodwill Indefinite 20 years
Acquired technology 4 years 4 years
Enterprise resource planning system 2.5 – 4 years 2.5 – 4 years
Customer relationships 4 years 4 years
Intellectual property 3 years 3 years
Capitalised development expenditure 1 – 3 years Expensed
The impact on the value of intangible assets and retained earnings of the Consolidated Entity at transition date is nil and at 30 June 2005 was an increase of $1,858,000. The impact on the results of the Consolidated Entity for the year ended 30 June 2005 is a decrease in distribution, marketing and field technical expenses of $577,000 (Company: nil) and in administration expenses of $2,544,000 (Company: nil) from the reversal of the goodwill amortisation offset by an increase to research and development expenses due to the amortisation of $1,263,000 (Company: $1,263,000) of capitalised development expenditure.

98
COCHLEAR ANNUAL REPORT 2006
(d) Impairment
Under previous GAAP, the carrying amounts of non-current assets valued on a cost basis were reviewed at reporting date to determine whether they were in excess of their recoverable amount. If the carrying amount of a non-current asset was in excess of its recoverable amount, the asset was written down to the lower amount and the write-down was recognised in the income statement in the period in which it occurred. In assessing recoverable amounts, the relevant cash flows were not discounted to their present value.
Under AIFRS, the carrying amount of non-current assets, excluding goodwill and deferred tax assets, is reviewed at each reporting date to determine whether there is any indication of impairment. Goodwill is tested annually for impairment regardless of whether there are indicators of impairment.
If there is any indication that an asset is impaired, the recoverable amount is estimated for the individual asset, or if not possible, for the smallest identifiable cash generating unit to which the asset belongs. An impairment loss, represented by the excess of carrying amount over recoverable amount, is recognised in the income statement as an impairment loss.
No impairment write-downs were recorded either at transition date or at 30 June 2005.
(e) Employee benefits
Defined benefit plansUnder previous GAAP, defined benefit plans were accounted for on a funding basis. For the year ended 30 June 2004, an actuarial assessment of the Company’s defined benefit plan revealed that plan assets were less than vested benefits by $325,778 and this amount was accrued in the financial statements.
Under AIFRS, a liability or asset in respect of defined benefit superannuation plans is recognised in the balance sheet, and is measured as the present value of the defined benefit obligation as at the reporting date plus unrecognised actuarial gains or losses less the fair value of the plan’s assets at that date and any unrecognised past service cost. The present value of the defined benefit obligation is based on expected future payments which arise from membership of the plans to the reporting date, calculated annually by independent actuaries using the projected unit credit method.
Expected future payments are discounted using market yields at the reporting date on national government bonds with terms to maturity and currency that match the estimated future cash flows. The full amount of actuarial gains and losses that arise subsequent to transition date are recognised directly in retained earnings in accordance with AASB 119 which was early adopted.
The AASB 1 election to recognise full actuarial gains and losses at transition date through retained earnings was adopted. At the date of transition, an amount of $603,000 was recognised as an asset of the Consolidated Entity and the Company with a corresponding increase in retained earnings, in addition to a reduction in provisions by $324,000 relating to the reversal of a defined benefit obligation.
For the year ended 30 June 2005, an actuarial assessment resulted in a reduction of the net asset position of the plans in the Consolidated Entity and the Company by $324,000. This has been recognised as an increase in administration expenses in the income statement.
Share based paymentsUnder previous GAAP, no expense was recognised for options or performance shares issued to employees.
Under AIFRS, the fair value of options and performance shares granted is recognised as an employee benefits expense with a corresponding increase in equity. The fair value is measured at the date the options or performance shares are granted taking into account market and non-market based performance conditions and expensed over the vesting period after which the employees become unconditionally entitled to the options or performance shares.
The fair value of the options granted has been measured using the Black-Scholes method, taking into account the terms and conditions attached to the options. The fair value of the performance shares granted is measured using the weighted average share price of ordinary shares in the Company, taking into account the terms and conditions attached to the shares. The amount recognised as an expense is adjusted to reflect the actual number of options and shares that vest except where forfeiture is due to market related conditions.
No adjustment has been made for options granted prior to 7 November 2002 which vested before 1 July 2004. Options granted after 7 November 2002 and remaining unvested at 1 July 2004 have been recognised in the opening balance sheet through retained earnings, resulting in a nil impact on transition.
For the year ended 30 June 2005, employee benefits expense and retained earnings for the Consolidated Entity increased by $2,592,000 (Company: $1,809,000) representing the share based payments expense for the period. This was made up of $789,000 (Company: $195,000) relating to distribution, marketing and field technical expenses, $1,369,000 (Company: $1,180,000) relating to administration expenses and $434,000 (Company: $434,000) relating to research and development expenses.
(f) Leased assets – make good provisions
The Consolidated Entity has a number of operating leases over its offices that require the asset to be returned to the lessor in its original condition. The operating lease payments do not include an element for the repairs/overhauls.
Under previous GAAP, the costs of returning the asset to the lessor in its original condition were not recognised until the expenditure was
Notes to the financial statements Cochlear Limited and its controlled entities for the year ended 30 June 2006

99
incurred, whereas under AIFRS a provision for make good lease costs is recognised at the time it is determined that it is probable that such costs will be incurred in a future period, measured at the expected cost of returning the asset to the lessor in its original condition. The Consolidated Entity is expected to incur the liability within the next 12 years. An offsetting asset of the same value is also recognised and it classified in plant and equipment. This asset is amortised to the income statement over the life of the lease.
In the Consolidated Entity, at transition date a provision for make good lease costs associated with these operating leases of $1,328,000 (Company: $1,233,000) was made along with an increase in plant and equipment of $1,175,000 (Company: $1,126,000) and a decrease in retained earnings of $153,000 (Company: $107,000).
During the year ended 30 June 2005, $103,000 of the initial amount recorded was expensed, increasing distribution, marketing and field technical expenses in the Consolidated Entity by $21,000 (Company: nil) and administration expenses by $82,000 (Company: $82,000).
(g) Foreign operations
Under previous GAAP, the assets and liabilities of self-sustaining foreign operations were translated at the rates of exchange ruling at reporting date. Equity items and goodwill were translated at historical rates. The income statements were translated at the average exchange rates. Exchange differences on translation were recognised directly in the foreign currency translation reserve.
The assets and liabilities of integrated operations were translated using the temporal method. Monetary assets and liabilities were translated at exchange rates prevailing at reporting date while non-monetary assets and liabilities and revenue and expense items were translated at the average exchange rates on the dates of the relevant transactions. Exchange differences arising on translation were recorded in the income statement.
Under AIFRS, each entity in the Consolidated Entity maintains its accounts in its functional currency, being the currency of the primary economic environment in which the entity operates.
The assets and liabilities of foreign operations, including goodwill and fair value adjustments arising on consolidation, are translated from the entity’s functional currency to the Consolidated Entity’s presentation currency of Australian dollars at exchange rates prevailing at reporting date, while revenue and expenses are translated to Australian dollars at average exchange rates. Foreign exchange differences arising on translation are recognised in the foreign currency translation reserve.
The AASB 1 election to reset the existing foreign currency translation reserve balance to nil has not been adopted.
The impact on the transition balance sheet of the Consolidated Entity was to reduce reserves and to increase retained earnings by $513,000, representing the reclassification of foreign exchange translation losses from a foreign controlled branch to the foreign currency translation reserve.
The impact to the Consolidated Entity and Company for the year ended 30 June 2005 was an increase in research and development expenses by $385,000 and a like increase to reserves. In addition, the value of goodwill for the Consolidated Entity decreased by $13,920,000 (Company: nil) with a corresponding decrease to the foreign currency translation reserve as a result of valuing goodwill at exchange rates prevailing at reporting date rather than at historical rates.
(h) Financial instruments
The Consolidated Entity has taken the election in AASB 1 to not restate comparatives for AASB 132 and AASB 139. As such, there are no adjustments in relation to financial instruments at transition date or for the year ended 30 June 2005 as previous GAAP continued to apply.
At 1 July 2005, the Consolidated Entity has complied with the requirements of AASB 139 in order to qualify for hedge accounting. Consequently, no adjustments have been made to retained earnings. See Note 2 for the impact of this change in accounting policy at 1 July 2005.
Debt establishment costs capitalised and amortised over the term of the borrowing under previous GAAP were recalculated based on the effective interest rate method and recognised as a reduction in interest bearing liabilities rather than as a separate asset.
This resulted in a decrease in receivables of $434,000 and a decrease in current interest bearing liabilities of $99,000 and in non-current interest bearing liabilities of $335,000 in the Consolidated Entity as at 30 June 2005 (Company: nil).
(i) Revenue recognition
Under previous GAAP, revenue from the sale of goods was recognised when the selling entity transferred control of an asset to the buyer whereas under AIFRS, revenue from the sale of goods is only recognised when the significant risks and rewards of ownership have transferred from the seller to the buyer with no continuing managerial involvement over the goods to the degree normally associated with ownership.
Specifically under AIFRS, the amount of revenue recognised under certain marketing programs differs to that recognised under previous GAAP.
The impact of this change in accounting policy at transition date resulted in a reduction to retained earnings of $11,083,000 for the Consolidated Entity (Company: $917,000), an increase in deferred revenue of $11,376,000 (Company: $917,000) and a decrease in reserves of $293,000 for the Consolidated Entity (Company: nil) from the deferral of revenue that had been recognised under previous GAAP. For the year ended 30 June 2005, revenue increased by $4,112,000 (Company: $917,000) resulting from a release of deferred revenue of $6,006,000 (Company: $917,000) offset by the deferral of revenue of $1,894,000 (Company: nil).

100
COCHLEAR ANNUAL REPORT 2006
(j) Treasury shares
The Company operates the CELTIP. The main purpose of the Trust is to hold unvested performance shares as part of the CELTIP. Under previous GAAP, the Trust was not included in the results of the Consolidated Entity as the consolidation rules did not apply to such special purpose entities. Under AIFRS, the Trust qualifies as an equity compensation plan special purpose entity and its results are included in those for the Consolidated Entity.
At transition date, the Trust held shares of the Company. Under AIFRS, the shares are accounted for as treasury shares and treated as a reduction in the issued capital of the Consolidated Entity and the Company. The impact on the Consolidated Entity and the Company at transition date is a decrease in issued capital of $1,371,000. No further adjustment is required for the year ended 30 June 2005.
At transition date, the Consolidated Entity and the Company had an unamortised balance of $997,000 as a deferred asset on the balance sheet, representing the amount paid to the Trust in order for it to purchase shares of the Company. Under AIFRS, this deferred asset is not amortised. The impact at transition date was to increase retained earnings by $374,000 representing the amortisation of the asset to that date, and a decrease to the deferred asset of $997,000 for the Consolidated Entity and the Company. The impact for the year ended 30 June 2005 was a decrease to administration expenses of $499,000 and a decrease to the deferred asset of $499,000 for the Consolidated Entity and the Company.
(k) Taxation
Previous GAAP required the application of the income statement liability method of tax effect accounting, whilst AIFRS requires the balance sheet method, whereby income tax expense comprises current and deferred taxes. Income tax is recognised in the income statement except to the extent that it relates to items recognised directly in equity, in which case it is recognised in equity.
There were no changes to retained earnings or the deferred tax balances for the Consolidated Entity at transition date or for the year ended 30 June 2005 as a result of the change in basis of accounting for income tax.
The tax impact on the Consolidated Entity of the transition adjustments on the deferred tax balances was an increase in deferred tax assets of $3,160,000 and a decrease of $916,000 in the Company. This resulted in an increase in retained earnings in the Consolidated Entity of $3,160,000 and a decrease of $916,000 in the Company.
The impact of the AIFRS adjustments for the year ended 30 June 2005 was an increase in the income tax expense of the Consolidated Entity of $2,321,000 (Company: $1,185,000) and a decrease in deferred tax assets of $1,440,000 (Company: $1,920,000).
The recognition of a deferred tax liability was not required in relation to non-amortising intangible assets acquired in a business combination under previous GAAP, whereas under AIFRS, a deferred tax liability is recognised in relation to non-amortised intangible assets acquired in a business combination.
The effect of this difference was to increase goodwill by $2,460,000 in the Consolidated Entity and to decrease the deferred tax asset amount by $2,460,000. The adjustment to deferred tax asset is reflected in the commentary above.
Notes to the financial statements Cochlear Limited and its controlled entities for the year ended 30 June 2006

101
Summary of transitional adjustmentsThe following table sets out the adjustments to the balance sheets of the Company and the Consolidated Entity at transition to AIFRS as at 1 July 2004 and for the AIFRS comparative period balance sheet as at 30 June 2005:
Consolidated 1 July 2004
Consolidated 30 June 2005
Company 1 July 2004
Company 30 June 2005
Amounts $000
Note Previous GAAP
Transition impact
AIFRS
Previous GAAP
Transition impact
AIFRS
Previous GAAP
Transition impact
AIFRS
Previous GAAP
Transition impact
AIFRS
Current assets
Cash and cash equivalents 75,946 - 75,946 106,077 - 106,077 58,526 - 58,526 72,191 - 72,191
Receivables (a), (e), (h), (j) 66,656 8,770 75,426 82,961 8,412 91,373 34,674 2,881 37,555 56,497 2,741 59,238
Inventories (b) 44,837 - 44,837 49,120 398 49,518 33,429 - 33,429 25,726 - 25,726
Other (a) 12,963 (9,164) 3,799 12,872 (8,686) 4,186 5,048 (3,275) 1,773 5,033 (2,916) 2,117
Total current assets 200,402 (394) 200,008 251,030 124 251,154 131,677 (394) 131,283 159,447 (175) 159,272
Non-current assets
Receivables 9,633 (175) 9,458 10,125 (187) 9,938 9,458 - 9,458 9,970 (32) 9,938
Other financial assets (a), (h) - 175 175 335 (148) 187 6,444 - 6,444 18,489 32 18,521
Plant and equipment (a), (f) 29,523 (2,724) 26,799 28,589 (3,965) 24,624 26,947 (2,773) 24,174 20,838 (954) 19,884
Intangible assets(a), (b), (c),
(g), (k) 7,190 7,048 14,238 191,764 2,565 194,329 - 7,048 7,048 - 8,263 8,263
Deferred tax assets (k) 17,791 3,160 20,951 23,904 (1,440) 22,464 7,000 (916) 6,084 9,669 (1,920) 7,749
Total non-current assets 64,137 7,484 71,621 254,717 (3,175) 251,542 49,849 3,359 53,208 58,966 5,389 64,355
Total assets 264,539 7,090 271,629 505,747 (3,051) 502,696 181,526 2,965 184,491 218,413 5,214 223,627
Current liabilities
Payables 31,657 - 31,657 46,539 - 46,539 17,156 - 17,156 18,914 - 18,914
Interest bearing liabilities (h) 25,867 - 25,867 64,206 (99) 64,107 2,100 - 2,100 1,273 - 1,273
Current tax liabilities 4,781 - 4,781 12,455 - 12,455 - - - 8,380 - 8,380
Provisions (e) 22,352 (324) 22,028 24,541 - 24,541 14,386 (324) 14,062 16,829 - 16,829
Other (i) 21,639 11,376 33,015 38,132 7,264 45,396 12,664 917 13,581 18,322 - 18,322
Total current liabilities 106,296 11,052 117,348 185,873 7,165 193,038 46,306 593 46,899 63,718 - 63,718
Non-current liabilities
Interest bearing liabilities (h) - - - 139,286 (335) 138,951 - - - - - -
Provisions (f) 3,256 1,328 4,584 4,780 1,328 6,108 2,087 1,233 3,320 3,470 1,233 4,703
Other 9,458 - 9,458 9,938 - 9,938 9,458 - 9,458 9,938 - 9,938
Total non-current liabilities 12,714 1,328 14,042 154,004 993 154,997 11,545 1,233 12,778 13,408 1,233 14,641
Total liabilities 119,010 12,380 131,390 339,877 8,158 348,035 57,851 1,826 59,677 77,126 1,233 78,359
Net assets 145,529 (5,290) 140,239 165,870 (11,209) 154,661 123,675 1,139 124,814 141,287 3,981 145,268
Equity
Issued capital (j) 50,746 (1,371) 49,375 50,746 (1,371) 49,375 50,746 (1,371) 49,375 50,746 (1,371) 49,375
Reserves (g), (i) (995) (806) (1,801) 10,424 (14,341) (3,917) - (513) (513) - (128) (128)
Retained earnings 89,267 (3,113) 86,154 99,959 4,503 104,462 72,929 3,023 75,952 90,541 5,480 96,021
Total equity attributable to equity holders of the parent 139,018 (5,290) 133,728 161,129 (11,209) 149,920 123,675 1,139 124,814 141,287 3,981 145,268
Minority interest 6,511 - 6,511 4,741 - 4,741 - - - - - -
Total equity 145,529 (5,290) 140,239 165,870 (11,209) 154,661 123,675 1,139 124,814 141,287 3,981 145,268

102
COCHLEAR ANNUAL REPORT 2006
Reconciliation of net profit (including minority interest) for the year ended 30 June 2005
The following table sets out the adjustments to the income statements of the Company and of the Consolidated Entity for the year ended 30 June 2005:
Consolidated 2005
Company 2005
Amounts $000 NotePrevious
GAAPTransition
impactAIFRS Previous
GAAPTransition
impactAIFRS
Revenue (i) 344,854 4,112 348,966 234,277 917 235,194
Cost of sales (99,699) - (99,699) (91,886) - (91,886)
Gross profit 245,155 4,112 249,267 142,391 917 143,308
Other income 618 - 618 5,946 - 5,946
Distribution, marketing and field technical expenses (c), (e), (f) (100,736) (232) (100,968) (15,016) (195) (15,211)
Administration expenses (c), (e), (f), (j) (26,530) 1,268 (25,262) (19,117) (1,086) (20,203)
Research and development expenses (c), (e), (g) (43,760) 2,295 (41,465) (36,012) 2,293 (33,719)
Operating profit before net financing income 74,747 7,443 82,190 78,192 1,929 80,121
Financial income 3,045 - 3,045 2,658 - 2,658
Financial expenses (2,928) - (2,928) (1,244) - (1,244)
Net financing income 117 - 117 1,414 - 1,414
Profit before tax 74,864 7,443 82,307 79,606 1,929 81,535
Income tax expense (k) (21,512) (2,321) (23,833) (19,162) (1,185) (20,347)
Net profit (including minority interest) 53,352 5,122 58,474 60,444 744 61,188
Attributable to:
Equity holders of the parent 54,520 5,122 59,642 60,444 744 61,188
Minority interest (1,168) - (1,168) - - -
Net profit (including minority interest) 53,352 5,122 58,474 60,444 744 61,188
Basic earnings per share (cents) 100.5 110.1
Diluted earnings per share (cents) 100.5 109.7
Notes to the financial statements Cochlear Limited and its controlled entities for the year ended 30 June 2006
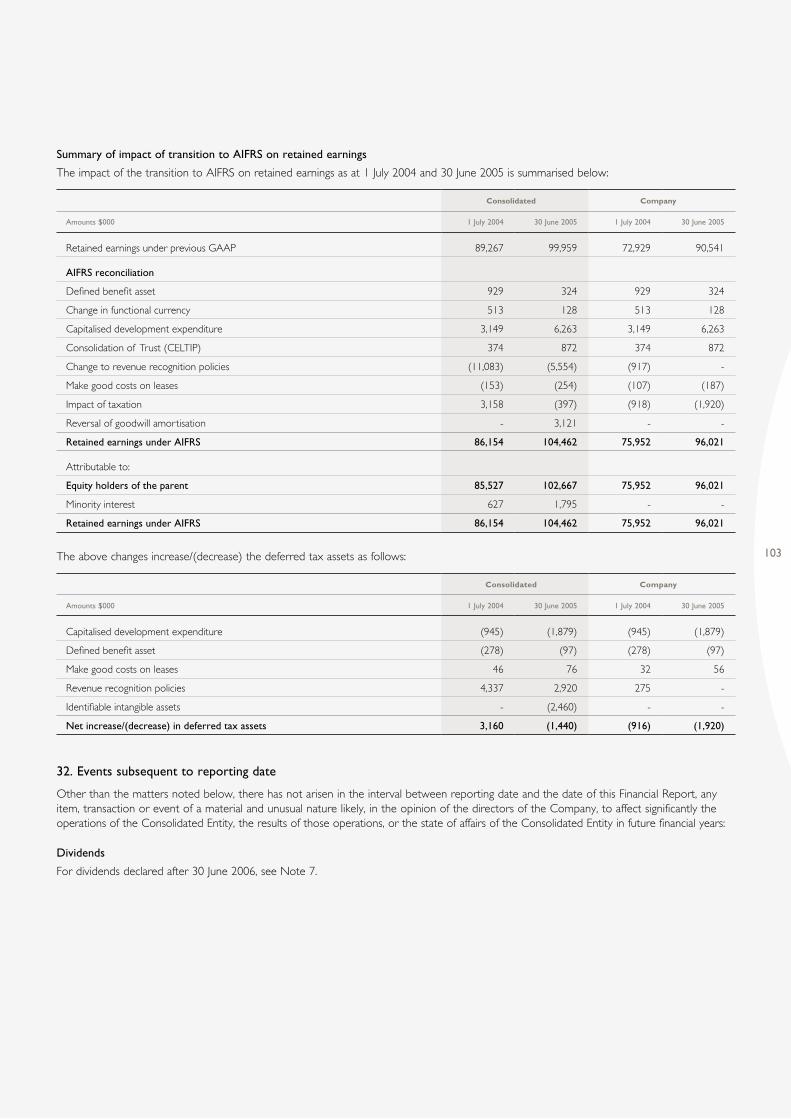
103
Summary of impact of transition to AIFRS on retained earnings
The impact of the transition to AIFRS on retained earnings as at 1 July 2004 and 30 June 2005 is summarised below:
Consolidated Company
Amounts $000 1 July 2004 30 June 2005 1 July 2004 30 June 2005
Retained earnings under previous GAAP 89,267 99,959 72,929 90,541
AIFRS reconciliation
Defined benefit asset 929 324 929 324
Change in functional currency 513 128 513 128
Capitalised development expenditure 3,149 6,263 3,149 6,263
Consolidation of Trust (CELTIP) 374 872 374 872
Change to revenue recognition policies (11,083) (5,554) (917) -
Make good costs on leases (153) (254) (107) (187)
Impact of taxation 3,158 (397) (918) (1,920)
Reversal of goodwill amortisation - 3,121 - -
Retained earnings under AIFRS 86,154 104,462 75,952 96,021
Attributable to:
Equity holders of the parent 85,527 102,667 75,952 96,021
Minority interest 627 1,795 - -
Retained earnings under AIFRS 86,154 104,462 75,952 96,021
The above changes increase/(decrease) the deferred tax assets as follows:
Consolidated Company
Amounts $000 1 July 2004 30 June 2005 1 July 2004 30 June 2005
Capitalised development expenditure (945) (1,879) (945) (1,879)
Defined benefit asset (278) (97) (278) (97)
Make good costs on leases 46 76 32 56
Revenue recognition policies 4,337 2,920 275 -
Identifiable intangible assets - (2,460) - -
Net increase/(decrease) in deferred tax assets 3,160 (1,440) (916) (1,920)
32. Events subsequent to reporting date
Other than the matters noted below, there has not arisen in the interval between reporting date and the date of this Financial Report, any item, transaction or event of a material and unusual nature likely, in the opinion of the directors of the Company, to affect significantly the operations of the Consolidated Entity, the results of those operations, or the state of affairs of the Consolidated Entity in future financial years:
Dividends
For dividends declared after 30 June 2006, see Note 7.

104
COCHLEAR ANNUAL REPORT 2006
In the opinion of the directors of Cochlear Limited:
(a) the financial statements, notes, and the remuneration disclosures contained in the Remuneration Report in the Directors’ Report, as set out on pages 38 to 103, are in accordance with the Corporations Act 2001, including:
(i) giving a true and fair view of the financial position of the Company and Consolidated Entity as at 30 June 2006 and of their performance, as represented by the results of their operations and their cash flows, for the financial year ended on that date; and
(ii) complying with Australian Accounting Standards and the Corporations Regulations 2001;
(b) there are reasonable grounds to believe that the Company will be able to pay its debts as and when they become due and payable;
(c) the remuneration disclosures that are contained in sections of the Remuneration Report in the Directors’ Report comply with AASB 124 Related Party Disclosures; and
(d) the directors have been given the declarations required by section 295A of the Corporations Act 2001 from the Chief Executive Officer and the Chief Financial Officer for the year ended 30 June 2006.
Dated at Sydney this 15th day of August 2006.
Signed in accordance with a resolution of the directors:
Director Director
Directors’ Declaration Cochlear Limited and its controlled entities for the year ended 30 June 2006

105
Independent Audit Report to the members of Cochlear Limited
Scope
The Financial Report, Remuneration disclosures and directors’ responsibilityThe Financial Report comprises the income statements, statements of recognised income and expense, balance sheets, statement of cash flows, accompanying notes 1 to 32 to the Financial Statements, and the Directors’ Declaration for both Cochlear Limited (the Company) and Cochlear Limited and its controlled entities (the Consolidated Entity), for the year ended 30 June 2006. The Consolidated Entity comprises both the Company and the entities it controlled during that year.
As permitted by the Corporations Regulations 2001, the Company has disclosed information about the remuneration of directors and executives (Remuneration disclosures) required by Australian Accounting Standard AASB 124 Related Party Disclosures labelled “audited” under the heading “Remuneration Report” in the Directors’ Report and not in the Financial Report.
The Remuneration Report also contains information not required by AASB 124 which is not subject to our audit.
The directors of the Company are responsible for the preparation and true and fair presentation of the Financial Report and the Remuneration Report in accordance with the Corporations Act 2001. This includes responsibility for the maintenance of adequate accounting records and internal controls that are designed to prevent and detect fraud and error, and for the accounting policies and accounting estimates inherent in the Financial Report. The directors are also responsible for preparing the relevant reconciling information regarding the adjustments required under AASB 1 First-time Adoption of Australian Equivalents to International Financial Reporting Standards. The directors are also responsible for the Remuneration disclosures contained in the Directors’ Report.
Audit approachWe conducted an independent audit in order to express an opinion to the members of the Company. Our audit was conducted in accordance with Australian Auditing Standards in order to provide reasonable assurance as to whether the Financial Report is free of material misstatement and that the Remuneration disclosures comply with AASB 124. The nature of an audit is influenced by factors such as the use of professional judgement, selective testing, the inherent limitations of internal control, and the availability of persuasive rather than conclusive evidence. Therefore, an audit cannot guarantee that all material misstatements have been detected.
We performed procedures to assess whether in all material respects the Financial Report presents fairly, in accordance with the Corporations Act 2001, Australian Accounting Standards and other mandatory financial reporting requirements in Australia, a view which is consistent with our understanding of the Company’s and the Consolidated Entity’s financial position, and of their performance as represented by the results of their operations and cash flows and whether the Remuneration disclosures comply with AASB 124.
We formed our audit opinion on the basis of these procedures, which included:
• examining, on a test basis, information to provide evidence supporting the amounts and disclosures in the Financial Report; and
• assessing the appropriateness of the accounting policies and disclosures used and the reasonableness of significant accounting estimates made by the directors.
While we considered the effectiveness of management’s internal controls over financial reporting when determining the nature and extent of our procedures, our audit was not designed to provide assurance on internal controls.
Audit opinionIn our opinion:
(1) the Financial Report of Cochlear Limited is in accordance with:
(a) the Corporations Act 2001, including: (i) giving a true and fair view of the Company’s and Consolidated Entity’s financial position as at 30 June 2006 and of their
performance for the financial year ended on that date; and (ii) complying with Australian Accounting Standards and the Corporations Regulations 2001; and
(b) other mandatory financial reporting requirements in Australia; and
(2) the Remuneration disclosures that are labelled as audited and contained in the Remuneration Report in the Directors’ Report comply with AASB 124 Related Party Disclosures.
KPMG John Wigglesworth, Partner
Sydney, 15 August 2006

Additional information required by Australian Stock Exchange Listing Rules and not disclosed elsewhere in this report – the information presented is as at 4 August 2006:
Shareholdings
Substantial shareholders
Name Number of ordinary shares held %
Commonwealth Bank Group 4,356,753 7.95
The Capital Group Companies, Inc 3,285,602 5.99
Total 7,642,355 13.94
Distribution of shareholders
Number of shares held Number of ordinary shareholders
1 – 1,000 16,186
1,001 – 5,000 3,242
5,001 – 10,000 201
10,001 – 100,000 127
100,001 – over 36
Total 19,792
Non-marketable parcels – 43 shareholders held less than a marketable parcel.
Twenty largest shareholders
Name Number of ordinary shares held %
JP Morgan Nominees Australia Ltd 7,818,999 14.26
National Nominees Ltd 7,216,648 13.17
Westpac Custodian Nominees Ltd 7,077,487 12.91
ANZ Nominees Ltd (Cash Income a/c) 4,109,787 7.50
Citicorp Nominees Pty Ltd 1,495,698 2.73
Queensland Investment Corporation 891,050 1.63
Cogent Nominees Pty Ltd 877,519 1.60
Citicorp Nominees Pty Ltd (CFS WSLE Imputation Fnd a/c) 592,446 1.08
AMP Life Ltd 555,681 1.01
UBS Nominees Pty Ltd 522,698 0.95
Citicorp Nominees Pty Ltd (CFS WSLE Geared Share Fnd a/c) 507,691 0.93
HSBC Custody Nominees (Australia) Ltd 408,804 0.75
Citicorp Nominees Pty Ltd (CFS Imputation Fnd a/c) 404,762 0.74
Cogent Nominees Pty Ltd (SMP Accounts) 337,231 0.62
IAG Nominees Pty Ltd 309,457 0.56
Citicorp Nominees Pty Ltd (CFS WSLE Aust Share Fnd a/c) 287,997 0.53
Bond Street Custodians Pty Ltd (Macq Aust Mkt Neutral Fnd) 274,385 0.50
Citicorp Nominees Pty Ltd (CFS WSLE Industrial Share a/c) 247,869 0.45
UBS Wealth Management Australia Nominees Pty Ltd 236,885 0.43
Dr Christopher Graham Roberts 225,000 0.41
The 20 largest shareholders held 62.76% of the ordinary shares of the Company.
On market buy-backThere is no current on market buy-back.
Other informationCochlear Limited, incorporated and domiciled in Australia, is a publicly listed company limited by shares.
Additional information
106
COCHLEAR ANNUAL REPORT 2006

Stock exchange listing Australian Stock Exchange Limited ASX code COH
Share registrar Computershare Investor Services Pty Limited 60 Carrington Street Sydney NSW 2000, Australia Tel: +61 2 8234 5000
Solicitors Clayton Utz
Auditors KPMG Chartered Accountants
Bankers Australia Westpac Banking Corporation Japan The Bank of Tokyo-Mitsubishi UFJ, Limited Sweden Skandinaviska Enskilda Banken AB United Kingdom NatWest Bank United States Wells Fargo Bank West, NA
Annual General Meeting The Annual General Meeting will be held at 2pm on Tuesday 24 October 2006 at the Four Seasons Hotel, 199 George Street, Sydney A Notice of Meeting and Proxy Form are enclosed with this Annual Report.
Financial calendar 2006 Dividend record date 31 August Payment of final dividend 21 September Annual General Meeting 24 October
2007 Interim profit announcement 13 February Interim dividend record date 23 February* Payment of interim dividend 13 March* Final profit announcement 14 August Annual General Meeting 23 October
* Indicative dates only.
Nucleus is a registered trademark of Cochlear Limited. Baha is a registered trademark of Entific Medical Systems AB, a Cochlear group company. Cochlear, the cochlear logo, Freedom, Beam, Contour, Contour Advance, SmartSound, Custom Sound, ESPrit and Baha Divino are trademarks of Cochlear Limited.
Design Cross Media Communications Pty Ltd
AIFRS Australian equivalents to International Financial Reporting Standards.
AGM Annual General Meeting.
ASIC Application Specific Integrated Circuit.
ASX Australian Stock Exchange.
Beam Digital technology for listening in crowds Designed to focus in on sounds coming directly in front of the listener and soften surrounding sounds by use of directional and omni-directional microphones.
BTE Behind-the-ear speech processor.
CE (Conformité Européenne) The CE mark indicates that a product complies with all the applicable European directives, especially the Medical Device Directive.
DACS Direct Acoustic Cochlear Stimulator.
ERP Enterprise resource planning.
Channel/Multi-channel Pairs of electrodes that stimulate the cochlea. A multi-channel implant that has multiple pairs of electrodes that give implant recipients more options for choosing the most responsive hearing nerve fibres, providing richer pitch information and improving hearing in noisy environments.
Glossary Company information
FDA United States Food and Drug Administration.
F05 Financial Year 2005: 1 July 2004 to 30 June 2005.
F06 Financial Year 2006: 1 July 2005 to 30 June 2006.
F07 Financial Year 2007: 1 July 2006 to 30 June 2007.
ISO (International Organisation for Standardisation) Responsible for the development and publication of international standards in various technical fields.
MHLW Ministry of Health, Labour and Welfare, Japan.
Previous GAAP Previous Australian Generally Accepted Accounting Principles.
Processor/speech processor The externally worn part of the cochlear implant.
R&D Research and development.
SmartSound Set of sound processing algorithms which enhance hearing performance.
TGA Therapeutic Goods Administration, Australia.
8 JUNE 2006 Gold award Cochlear Limited announces that the previous night it was awarded Gold for the Nucleus Freedom cochlear implant system at the International Medical Design Excellence Awards held in New York.
5 MAY 2006 $270 million order for China Cochlear Limited announces the receipt of an approximately $270 million order for cochlear implants to supply Nucleus cochlear implants in Taiwan and China over approximately six years.
10 MARCH 2006 Share price increase Cochlear Limited notes that the strong increase in share price that day appears to be in response to the recall of a competitor product.
14 FEBRUARY 2006 Record financial results for half year ended 31 December 2005 Cochlear Limited announces record revenue for the six months of $221.1 million, a 34% increase over the previous corresponding period, and core earnings of $47.3 million, an increase of 43% over the 31 December 2004 half year.
14 DECEMBER 2005 Full year earnings upgrade Cochlear Limited announces an increase in its full year F06 guidance of core earnings to approximately $80 million, an increase of 37% over the prior year.
20 OCTOBER 2005 Chairman’s address Cochlear Limited Chairman Tommie CE Bergman addresses shareholders at the Annual General Meeting.
16 AUGUST 2005 2005 full year financial results Cochlear Limited announces total revenue for the year of $348.5 million, a 22% increase over the prior financial year, and core earnings of $58.3 million, an increase of 58% over the prior financial year. The final dividend was 45 cents per share fully franked.
Company ASX announcement record

Cochlear and the elliptical logo are trademarks of Cochlear Limited. N32016 ISS1 AUG06