coca-cola summer intern report
DESCRIPTION
This research project is done at coca-cola. This is a summer internship project report which understands the coca-cola's distribution strategy across India and its analysis with competitors. Includes coca-cola's portfolio. The project also intended towards benefit of retailers as by keeping more variety and range of products, the sales volume will increase leading to enhanced profits and better ROI. This is a win-win situation for the retail outlets and the company.This research involved a study, which was descriptive in nature. It basically aims at gathering the data about range of the products that has been billed in each billing of each outlet. Retailers were contacted directly and personal interviews were taken at the retailer counters.TRANSCRIPT

Summer Internship Project ReportOn
ENHANCING “PRODUCT RANGE SELLING” OF PRODUCTS OF COCA COLA
ByAnkur Khandelwal
A0102211055MBA – M&S Class of 2013
Under the Supervision ofMrs. Shilpa SinghAssistant Professor
Department of International Business
In Partial Fulfillment of the Requirements for the Degree ofMaster of Business Administration – Marketing & Sales
At
AMITY BUSINESS SCHOOLAMITY UNIVERSITY UTTAR PRADESH
SECTOR 125, NOIDA - 201303, UTTAR PRADESH, INDIA2012

DECLARATION
Title of Project Report - Enhancing “Product Range Selling” of Coca Cola Products
………………………………………………………………………………………
I declare
(a)That the work presented for assessment in this Summer Internship Report is my own, that it has not previously been presented for another assessment and that my debts (for words, data, arguments and ideas) have been appropriately acknowledged
(b)That the work conforms to the guidelines for presentation and style set out in the relevant documentation.
Date: …………… Ankur khandelwal A0102211055
MBA – M&S Class of 2013

CERTIFICATE
I Shilpa Singh hereby certify that Ankur Khandelwal student of Masters of Business Administration – M&S at Amity Business School, Amity
University Uttar Pradesh has completed the Project Report on ―Enhancing “Product Range Selling” of Coca Cola products, under my guidance.
Mrs. Shilpa SinghAssistant Professor
Department Of International Business

ACKNOWLEDGEMENT
Perseverance, inspiration and motivation have played a great role in the success of
any venture. It would be incomplete to submit this report without acknowledging
the people behind this endeavor and without whose support I wouldn’t have able
to achieve this. It gives me immense pleasure to express my gratitude to everyone
who shared with me their precious time and effort during the project.
First of all, I thank Hindustan Coca Cola Beverages Pvt. Ltd. (HCCBPL) for
granting me the permission to work with the esteem organization. I am also
thankful to:
Mr. Sachin Singh (Operation Excellence Manager) my industry guide, for his
patience and guidance, encouragement and for sharing his expertise in writing this
feasibility study.
Then to Mrs. Shilpa Singh my faculty guide for giving her valuable time and
precious knowledge for guidance of this project.
Then to Mr.Ashwani Gurang (Capability Manager) who assisted and taught us
how to make a feasibility study.
I thank to all my pre sellers and the market developers of the Hindustan Coca
Cola Beverages Pvt. Ltd. They guided and helped me in all possible ways they
could, at every stage of the report. I would also like to thank all the Executives,
distributors & staff of Hindustan Coca Cola Beverages Pvt. Ltd. Who provided us
all the relevant information and their kind support on the basis of which this
report and my summer intern ship has been prepared.
Finally I thank my college Amity Business School, NOIDA for having given me
this opportunity to put to practice, the theoretical knowledge that I imparted
from the program.
Ankur Khandelwal
Amity Business School
Noida – UP

TABLE OF CONTENTS
Chapter 1: Introduction 1.1 Hindustan Coca Cola Pvt. Ltd 1.2 Soft Drink Market in India1.3 Products of Coca Cola1.3 Significance of the Study
Chapter 2: Review of the Literature 2.1 Review of researchers2.2 Some important Literature Reviews
Chapter 3: Research Methods and Procedures 3.1 Purpose of the Study 3.2 Research Design 3.3 Research Questions 3.4 Data Collection3.5 Instruments used 3.6 Procedures 3.7 Limitations
Chapter 4: Data Analysis and Findings4.1 Review of Methodology 4.2 Results of Research Questions 4.3 Summary of the Findings
Chapter 5: Suggestions & Conclusions5.1 Suggestions5.2 conclusions
BibliographyAnnexure

ABSTRACT
The research study was conducted to learn the localization strategy of global
beverage company Coca Cola in terms of two of its marketing mix variables,
namely, the product portfolio on offer and the distribution process. In the process
detailed information was collected on products launched, sales and distribution
practices followed by the company, the working style of the retail outlets that
stocked and retailed Coca Cola products, and to a limited extent the psyche of the
consumers. In addition the study also uncovered initiatives taken up by the top
level management and the strategies they laid out to enhance the company’s
market share and sales turnover.
This research was conducted with the help of personal interview that tried to find
the satisfaction levels of the retailers regarding the support they enjoyed in terms
of the products and services offered by Hindustan Coca Cola company. In
addition retailers were also queried on what more they expected from the
company, and the response of consumers towards Coca Cola’s products.
This project is prepared to provide a comprehensive introduction to the study of
the “Product Range Selling” of Coca-Cola. A genuine attempt has made to
provide a very clear understanding of the range selling done by the company, the
various decision of the organization; the work done at the organization is well
balanced.
The concept “Product Range Selling” can be regarded as the number of items
billed at a retailer, where range signifies the variety of products and different-
different volumes of each product.

The concept consists of the parameter “SKU- Stock Keeping Unit” which is used
for measuring the Product Range billed at an outlet, where each variety and each
volume is counted as 1SKU.
The concept “Product Range Selling” is a sub-concept which comes under the
marketing strategy of the company – GREEN ( Grow By Excellent
Execution).The whole project is focused at selling wide range of company
products to the retail outlets .Selling of different varieties, flavors, sizes and
products of different brands owned by the company. Selling of unique SKU’s to
retailers to increase the sales volume is the main objective.
The process will help to leverage different brands of the company and increase
the awareness among the customers. This will help in giving the customers wide
range of options and alternatives. They will have good options to choose from.
The process will help to survive in the market as this segment is very lucrative
and has high growth potential. With the entrance of many players in the market
the segment is facing cut throat competition.
The main aim of the company is to sell more than 5SKU’s or 5 unique products to
the retail outlets. This is strategic growth plan of the company for the long term
growth and survival.
The organization has been seeing continuous decline in the Product Range selling
so at the time of giving this project the objective of the company was to visit each
retailer and find the root cause of the problem and removing those barriers.
Recommendations and suggestions are intended to be taken from the retailers and
have been worked out.
The project also intended towards benefit of retailers as by keeping more variety
and range of products, the sales volume will increase leading to enhanced profits
and better ROI. This is a win-win situation for the retail outlets and the company.
This research involved a study, which was descriptive in nature. It basically aims
at gathering the data about range of the products that has been billed in each
billing of each outlet. Retailers were contacted directly and personal interviews
were taken at the retailer counters.

CHAPTER 1
INTRODUCTION

1.1 Hindustan Coca Cola Beverages Pvt. Ltd:
Hindustan Coca-Cola Beverages Private Limited (HCCB) is the company owned
Bottling operation of The Coca-Cola Company in India. The Company is engaged
in production, manufacture, bottling, sale, distribution, and supply of non-
alcoholic ready to drink beverages including sparkling beverages, packaged
drinking water, and fruit based drinks under various trademarks across designated
territories pan India.
The company-owned Bottling arm of the Indian Operations- Hindustan Coca-
Cola Beverages Private Limited is responsible for the manufacture, sale and
distribution of beverages across the country. Coca-Cola was the leading soft drink
brand in India until 1977, when it left rather than reveals its formula to the
Government and reduces its equity stake as required under the Foreign Regulation
Act (FERA) which governed the operations of foreign companies in India. Coca-
Calare-entered the Indian market on 26th October 1993 after a gap of 16 years,
with its launch in Agra. An agreement with the Parle Group gave the Company
instant ownership of the top soft drink brands of the nation.
In the new liberalized and deregulated environment in1993, Coca-Cola made its
re-entry into India through its 100% owned subsidiary, HCCBPL, the Indian
bottling armor the Coca-Cola Company. However, this was based
innumerous commitments and stipulations which the Company agreed to
implement (on the basis of the rules and regulations of the Indian government) in
due course. One such major commitment was that, the Hindustan Coca-Cola
Holdings would divest 49% of its shareholding in favor of resident shareholders
by June 2002.

1.2 Soft drink market in India:
MAJOR PARTICIPANTS IN SOFTDRINK INDUSTRY
The major participants involved in the production and distribution of soft drinks
are:
Concentrated syrup producers,
Bottlers and
Retail channel.
Concentrate producers manufacture basic soft drink flavors and retail channel
refers to business location that tells or serves the products directly to
consumers. Lots of sale depends upon the strength of merchandizing done at the
point of sale.
THE GLOBAL SOFT DRINK MARKET AND INDIA’S POSITION
The global soft drinks market grew at a compound annual growth rate (CAGR) of
3.5% from 2005 to 2009 and was valued at $494.5 billion in 2009. New product
launches in the global soft drinks market increased by 8.59% in 2009. The US
was the top country by retail sales as well as by number of new product launches,
followed by Japan which ranked second in both categories. Globally, India ranked
25th in terms of retail sales and 13th in terms of the number of new product
launches in the soft drinks market in 2009.
India in 2012 is one of the most potential markets, with population of around 1.2
billion people. Population and potential market are two major reasons for major
multinational companies to enter in India. They feel that a huge population
coupled with low consumption and low budget (due to low economy) can only
lead to an increase in the soft drink market.
In spite of India’s huge population and the fact that around 47% of the population
is composed of persons below 30 years of age, the per-capita consumption of soft

drinks in India remains very low, at approximately at 5.2 liters against the world
average of nearly 85.2 liters.
Another increase and boom in the sale of soft drinks in the scorching heat
and the climate of India, which is together, have contributed to a 30% growth in
the soft drinks industry till 2010. If the demand continues growing at the same
rate, within two years the volume could touch 2 billion cases.
All these factors are the reasons for the entry of two big manufacturers of the soft
drink industry to enter the Indian market. These two giants Pepsi and Coca-Cola,
themselves share 76% of the soft drink market share on the basis of records of
2009.Rest is shared by Cadbury’s Schweppes, Parle, RC Cola and other soft drink
brands.
In spite of India’s huge population and the fact that around 47% of the population
is composed of persons below 30 years of age, the per-capita consumption of soft

drinks in India remains very low, at approximately at 5.2 liters against the world
average of nearly 85.22 liters.
Coca-Cola remains the market leader in the carbonates category with a annual
sales figure growth of more than 69.2% in the Indian market, followed by Pepsi
with around 20.7% till the year 2012. In the bottled water category, Parle’s,
Bisleri and Kinley from Coca-Cola are the leading players. The packaged juices
market in India continues to be dominated by Maaza and Frooti, followed by
brands such as Slice, Tropicana and Real which have registered good growths in
their market shares in the past few years. Red Bull with its strong dominance of
the energy drinks’ category, which is the largest segment in the functional drinks
category, is the market leader in the functional drinks market.
1.3 Products of Coca Cola:
(I) COKE:-It is a carbonated drink. It is available in different volumes in
market like:
200 ml glass bottle
350 ml glass bottle
600 ml pet bottle
2 litre pet bottle
330ml can
1.25 liter
(ii) THUMS UP:-It’s a very strong carbonated cola flavored drink as compared to
others. It was bought from Parle Agro by Coca-Cola in 1992. It is available in
different volumes in market like:
200 ml glass bottle
300 ml glass bottle
600 ml pet bottle
2 litre pet bottle
330ml can
1.25 liter
(iii)FANTA:-It is an orange flavored carbonated soft-drink. In India Fantail
entered as a substitute for the then popular soft-drink Gold-Spot. When Coca-Cola
re-entered the Indian Marketing 1993, it bought Gold Spot from Parle and
withdrew it from the market in order to make space for Fantail. It is available in
different volumes in market.
200 ml glass bottle
300 ml glass bottle
600 ml pet bottle
2 litre pet bottle
1.25 liter

(iv)LIMCA:- Lima is a lime and lemon flavored carbonated soft-drink made
primarily in India. In 1992 Coca-cola bought local soft drinks brand from Parle
Agro including Lima. It is available in market in following packs of quantizes:
200 ml glass bottle
300 ml glass bottle
600 ml pet bottle
2 litre pet bottle
330ml can
1.25 liter
(iv) SPRITE:- It is a transparent drink of lime flavor caffeine free soft-drink. It is
packed in green colored bottle. It is available in market in following packing:
200 ml glass bottle
300 ml glass bottle
600 ml pet bottle
2 litre pet bottle
330 ml can
2 litre pet bottle
1.25 liter
330ml can
(v)MINUTE MAID:- It comes in the juice category. It comes in Pulpy Orange,
Mango, Nimbu Fresh and Apple flavors.
It is only available in PET bottle.
400ml PET bottle
1 Ltr. PET Bottle
(vi) MAAZA :- It is a Mango flavored drink.
200ml glass bottle

200ml tetra pack
600ml pet
1.2 Lt. pet
(viii) KINLEY SODA :-
It is colorless & available in market in 300 ml glass bottle and in 600ml PET
bottle in the market.
(ix) KINLEY WATER:-
It is mineral water available in following volumes in market:
500 ml pet bottle
1 lt. pet bottle
2 lt. pet bottle
1.4 Significance of the study:

The significance of the study was:
Finding and working on the problems that the company has been facing in
its distribution which has been leading to decline in the sale of the
company.
Learning market condition in which companies are surviving and facing
competition.
Knowing about the distribution pattern that the company has been
following.
Studying the complete chain how the final product reaches the end
customer.
What are the problems that the retail outlets of the company are facing and
how they can be resolved.
Knowing about the perception of the retailers about the company.
Study various factors which directly or indirectly influence the sale of the
company
Identifying the needs and wants of both the retailers and dealers and how
well are they are being managed by the company’s anxious authorities.
Find out various reasons which are creating stumbling block in market
expansion.
Identifying the wakefulness of the brand and the company’s products in
the market.
Finding out the gratification level of customers and problems faced while
doing business with Coke.

CHAPTER 2
REVIEW OF THE LITERATURE
LITERATURE REVIEW
REVIEWS OF RESEARCHERS:
In case study presented by Adam Brown of Coca-Cola, he stated, “…back in the
day you would have heard me say, our home page isn’t just coke.com, it’s
google.com … now… it’s google.com, technorati.com, facebook.com…”. He
also stated in his presentation that Coca-Cola’s strategy is to Review, Record,
Respond, and Redirect. (Brown, 2009)
Coca-Cola has done an amazing job at not only reaching out to the “new media
era” audience, but also the people who followed them in the past. Coca-Cola has
an official blog called Coca-Cola Conversations which is written and updated by a
man by the name of Phil Mooney, who has served as the historian/archivist for
Coca-Cola for the last 30 years. The blog contains a wide variety of topics,
ranging from our role in pop culture to brand history to Coke collectibles.
(Mooney,2009). It reaches out to a wide variety of audiences, and encourages
people to write back and give their input, something Coke probably couldn’t have
gotten this far without.
Part of the Action Plan for Harnessing the Power of the New Rules states that you
should define your organizations goals first, then based on the goals decide
whether or not you want to provide the content for free and without registration.
It is also stated that you should write for your audience using examples and
stories, and of course make it interesting. (Scott, 2007).
SOME OF THE IMPORTANT LITERATURE REVIEWS:

1) Consumer Preference: A study of factors responsible for brand preference
in FMCG sector”
The purpose of this paper is the study of factors responsible for brand
preference in FMCG products, increasing competition, more due to
globalization, is motivating many companies to base their strategies
almost entirely on building brands. Brand preference means to compare
the different brands and opt for the most preferred brand. This
brand preference is influenced by various factors. According to this study many
factors were find out for preferring a brand like Brand persona Brand constancy
Brand loftiness Brand value. In the identification of factors affecting the brand
preference, it was concluded that brand persona is the most effective factor that
affects the brand preference. This brand persona deals with the personality
aspects or the external attributes of brand, thus it can be said that
consumer prefer any brand by looking at the external attributes of a brand.
JOURNAL OF IMS VOL 5 NO.1,
JAN-JUNE 2008
2) Taste or health: A study on consumer acceptance of cola drinks
T h i s s t u d y e x a m i n e d t h e r e l a t i v e c o n t r i b u t i o n s o f t a s t e a n d
h e a l t h c o n s i d e r a t i o n s o n consumer liking and purchase intent of cola
drinks. Eight types of commercial cola drinks were evaluated by 305 adult
consumers who also completed a brief questionnaire on food habits. Data were
analyzed using factor analysis. Results revealed that purchase intent of cola drinks
was strongly related to degree of liking and to several key sensory attributes
including saltiness, drinks flavor and greasiness. These variables
emerged as the first factor in the analysis, suggesting that consumers
perceive these characteristics as being most important in their choice of cola
drinks. Factor 2 described a health dimension and w a s r e l a t e d t o
r e s p o n d e n t s ' a t t i t u d e s t o w a r d f a t i n t h e d i e t . F a c t o r 3
c o m p r i s e d t w o remaining sensory attributes (color and crunchiness),
which apparently were of minor importance to the respondents. These
data suggest that in spite of current concern about reducing dietary fat,
health remains secondary to taste in the selection of cola drinks for consumers in
this population.
SOURCE-BEVERLY J. TIPPER AND AMY C. TRAIL
JOURNAL OF FOOD SCIENCE ANDTECHNOLOGY,
15 SEPTEMBER 1998
.
3) Paired preference tests using placebo pairs and different responses options
for Cola drinks and juices.
ABSTRACT Preference tests were performed for varieties of cola drinks, orange
juices and using three response protocols: the traditional paired preference test
with the "no preference" option, a 9-point hedonic scale and a 6-point hybrid
hedonic/purchase intent scale. The different stimuli to be assessed were presented
in pairs, but putatively identical stimuli were also presented as a "placebo"
pair. Performance on the placebo pair with identical
stimuli p r o v i d e d a m e a s u r e o f t h e h i d d e n d e m a n d c h a r a c t e r i s t i c
s o f t h e t e s t p r o t o c o l . T h e presentation of the different pairs provided a
measure of preference of the consumers and final users accompanied by such
h i d d e n d e m a n d e f f e c t s . C o m p a r i s o n b e t w e e n t h e t w o a l l o w e d a
b e t t e r m e a s u r e o f preference per se. The order of presentation of the
identical and different pairs did show occasional slight evidence of contrast
effects. For the placebo "identical" pairs, a majority of consumers reported
false preferences. Yet, the effects tended to be slight. The 6-point
hedonic/purchase intent scale exhibited the fewest false preferences in the
placebo condition, and this was because of its fewer categories rather than
any cognitive strategy change elicited by its different labels.

SOURCE- DAVIS WOMAN’S
JOURNAL OF FOOD SCIENCE AND TECHNOLOGY,
JULY 31, 2007
CONCLUSION:
Coca Cola being a big brand name in the beverage industry has been continuously
growing its business in the whole world. The company is really innovative and
customer oriented and is very well known for its reputation amongst the people.
The new products launched by the company like series of Minute maid are
brought seeming the demand and culture of the people in India so this shows that
the company is even culture oriented.
It has been highly preferred by the customer due to its taste and quality it offers in
the products. Thus it covers the major market of the country, India. The variety of
choices available almost covers all the taste that public usually demand. Coca
Cola has been always upgrading its product portfolio as per the changes in the
beverage industry and is always giving tuff competition to the major players like
PepsiCo, Parle, etc.
Not only this, Coca Cola has been doing up to date promotion and every possible
action to reach customer’s heart. They have entered facebook, google, twitter, and
many other social networking site to become friendly to the users and know about
their preference for the soft drinks.

CHAPTER 3
RESEARCH METHODOS AND PROCEDURES
3.1: Purpose of the Research:
RESEARCH OBJECTIVES:
To gain an insight about the perception of the retailers about the company.
To study various factors which directly or indirectly influence the sale of
the company
To identify the needs and wants of both the retailers and dealers and how
well are they being managed by the company’s higher authorities.
To find out various reasons which are creating stumbling block in market
expansion of company’s products
To identify the wakefulness of the brand and the company’s products in
the market.
To find out the gratification level of retailers and problems faced while
doing business with Coke.
3.2 Type of research: Exploratory and descriptive Research

The research design adopted is the multi-cross sectional design as my research
study involved the study of more than two respondents and information through
questionnaire has been collected from each sample only once. Even a part of
causal research will also be employed to find out the cause and effect of the
increase in the SKU billings on the retailer’s sales and company’s product range.
3.3 Method of data collection
There are two types of data collection method – Primary data and Secondary
data.
1. Primary Data:
This data is original in nature and is generated from results of personal interviews
with the retailers.
General observation method -The retailers were observed to have an
insight about the mindset and preference for a particular brand.
Personal interaction method -I made interactions with some retailers during
market survey, who want to give some extra information other than
questionnaire and who were busy and not ready to fill the questionnaire.
This was conducted without the help of any questionnaire. The objective
was to draw a general understanding about their problems, performance of
the distributer, their preferences and other useful information. This
technique helped to clear doubts arising due to observation method.
2. Secondary Data:
Some data was acquired from existing sources of information which were
accessed due to availability of various other forms of information and data. These
data served as the secondary data to me. Sources for these data are the company’s
websites, journals, publications and articles from industry experts/professionals,
previous market reports and some details about how they follow GREEN norms
which were provided by the company.
3.4 Data collection
This research involved a study, which was descriptive in nature. It basically aims
at gathering the data about the type of outlet, size of its purchase, 5SKU billings,
etc each outlet. I have contacted to retailers directly and taken the personal
interviews at the retailer counters. This has allowed me greater flexibility in
capturing the insights of the retailers.
Sample design
Sampling unit: - The retailer of grocery shop, general store, eats and drinking
stores was selected.
Sample Size:- The sample size taken is of 100 respondents for this study.
Sampling technique:-Normal Convenience and judgmental sampling technique
was followed.
Sampling method:- Data were collected from the personal interviews with the
retailers.
3.5 Instruments Used:-
Questionnaire :
Likert scale
Structured and un structure questions.

Analysis ( SPSS and MS EXCEL)
Frequency Distribution
Cross tabs
Case Summary
Distribution Graphs
Distribution tables
3.6 Procedures:-
The following procedure was followed for the purpose of research:
1) Research title was decided and parameters to be measure were set.(idea
generation)
2) The basic frame work for the activities to be done was made.(planning)
3) The project activities were then equally divided into the members of the
group, i.e. every body was assigned different markets of NOIDA and
GHAZIABAD. (Staffing)
4) Questionnaire was made on the basis of the parameters given by the
company.
5) Each member was allotted a market and a pre seller where he has to
collect the information by personally interviewing the retailer and then
getting the questionnaire filled by the retailer. (data collection)
6) The data which was collected was feeded in the excel sheet on the daily
basis. ( Data feeding)
The process continued till whole week…….
Every week a new market was given and research was done.
7) The final data of the whole research was then coded and entered into the
SPSS and analysis was done.
8) Results were drawn and on the basis of them interpretations were made.
3.7 Limitations:-
Though this study was taken up with sincere efforts to accomplish the objectives,
there were certain factors which created hurdles in accomplishing the work.

These factors are:-
1. Some retailers were having very non-cooperative behavior at the time of data
collection from them
2. The research was depending on the information provided by the respondents
(retailers).It may be insufficient.
3. The time frame for this research is short to cover the whole market of NOIDA
and GHAZIABAD.
4. Limited knowledge of the addresses of outlets.
5. Due to the financial and time constraints the study wasn’t able to include more retailers.
6. To convince the retailer for a proper interviewing process was also difficult.
7. Retailers some time give wrong data.
8. The reluctance on the part of the retailers was also major setback.
9. The analysis of project was based on observations and interpretation on the basis of sample survey.
10. A busy schedule of dealers/retailers had made my collation of information very difficult.

CHAPTER 6
DATA ANALYSIS AND FINDINGS
6.3 DETAILED ANALYSIS:
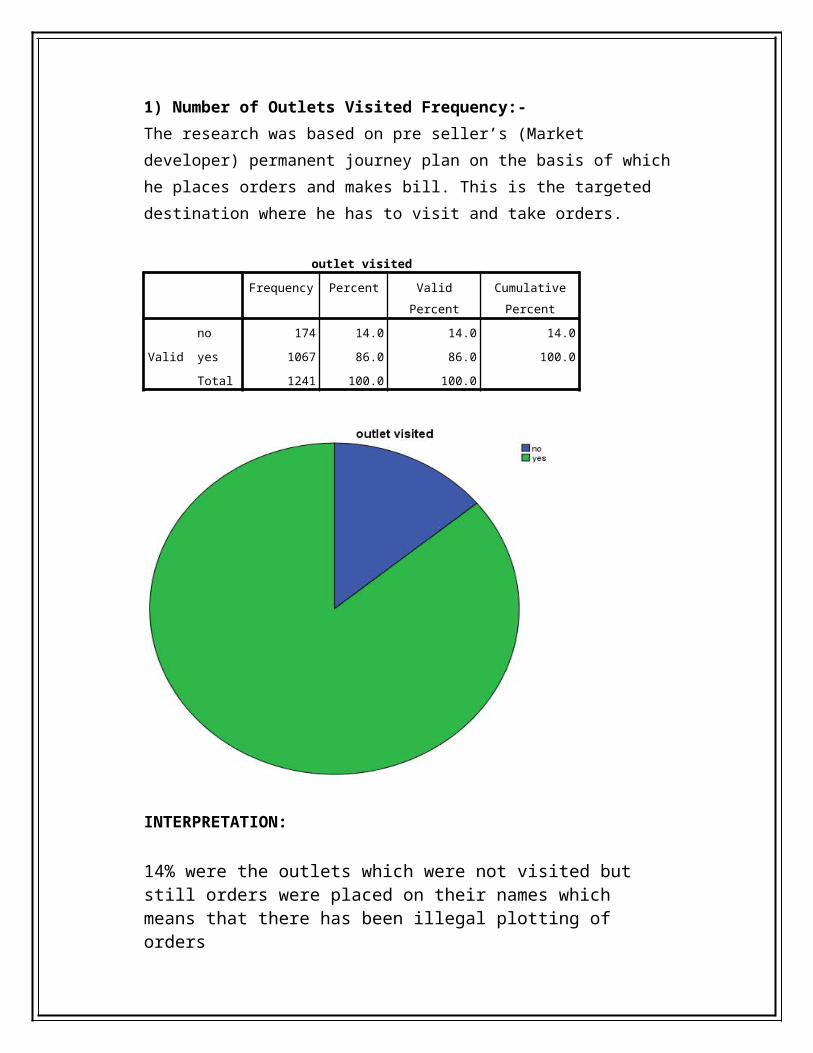
1) Number of Outlets Visited Frequency:-

The research was based on pre seller’s (Market developer) permanent journey
plan on the basis of which he places orders and makes bill. This is the targeted
destination where he has to visit and take orders.
outlet visited
Frequency Percent Valid Percent Cumulative
Percent
Valid
no 174 14.0 14.0 14.0
yes 1067 86.0 86.0 100.0
Total 1241 100.0 100.0
INTERPRETATION:
14% were the outlets which were not visited but still orders were placed on their names which means that there has been illegal plotting of orders
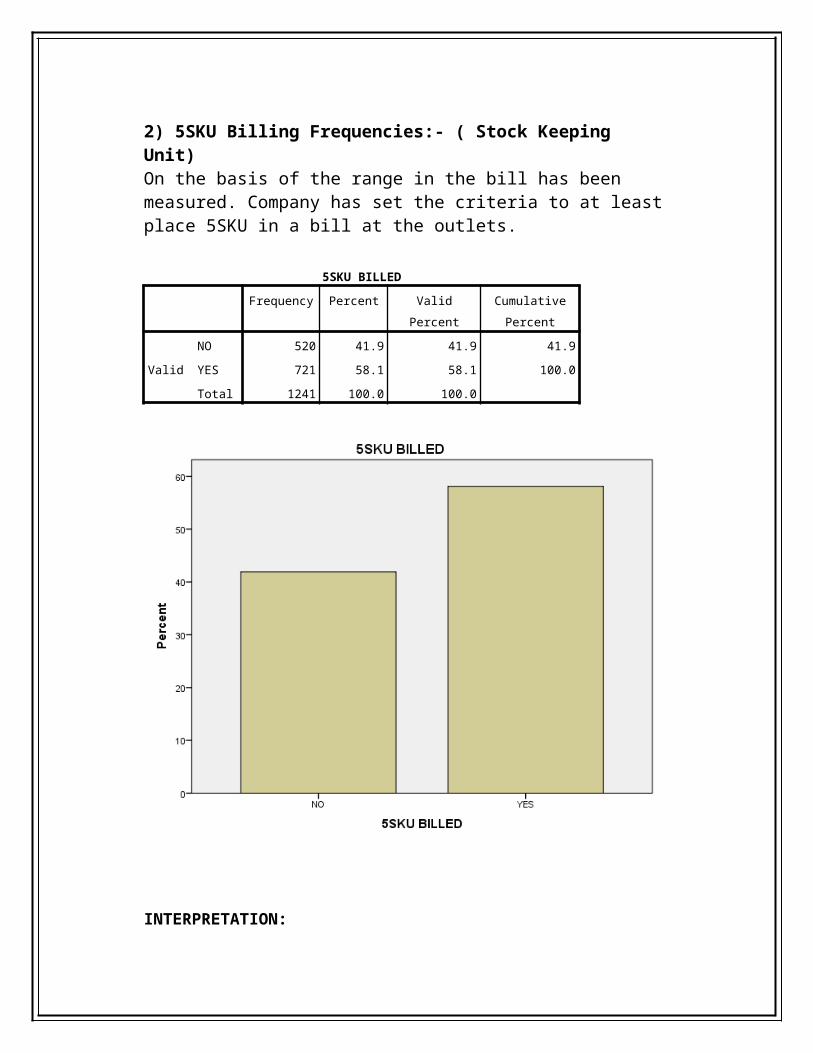
2) 5SKU Billing Frequencies:- ( Stock Keeping Unit)On the basis of the range in the bill has been measured. Company has set the criteria to at least place 5SKU in a bill at the outlets.

5SKU BILLED
Frequency Percent Valid Percent Cumulative
Percent
Valid
NO 520 41.9 41.9 41.9
YES 721 58.1 58.1 100.0
Total 1241 100.0 100.0
INTERPRETATION:There were still 42% of the outlets where 5SKU were not billed reasons were knotted down for NON billing. So this will act as a new target for the company to work on next time.
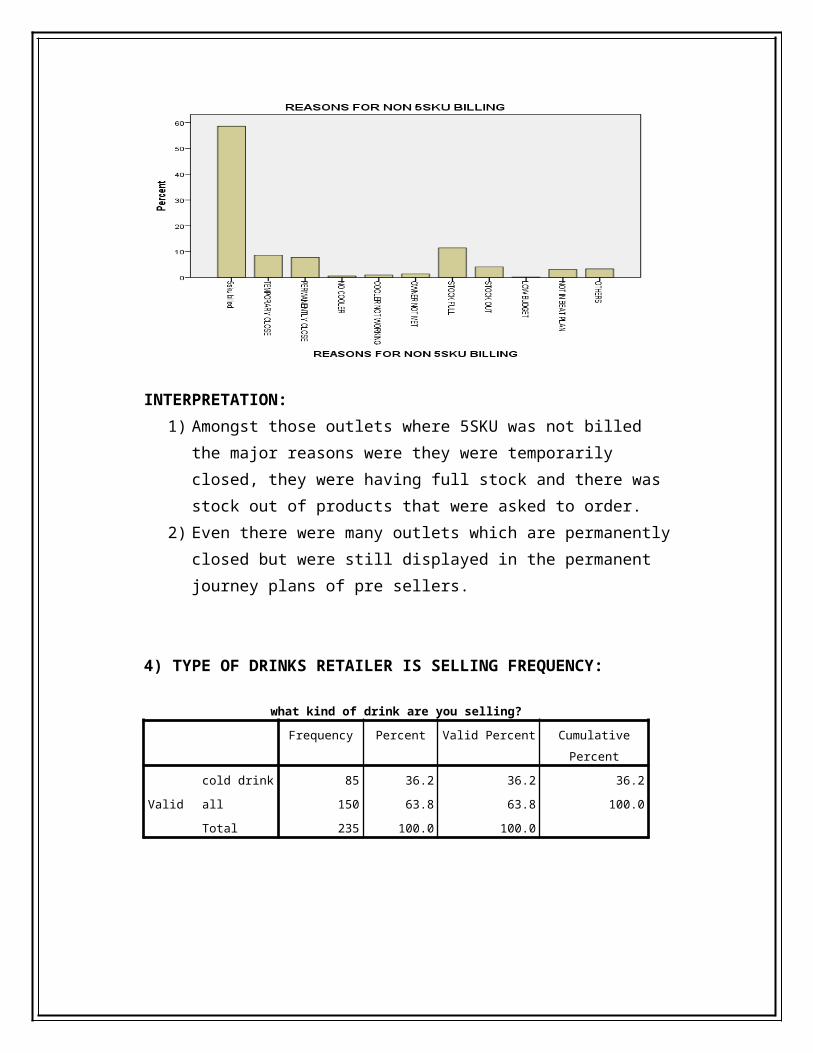
3) Reasons of Non- 5SKU billings Frequencies
REASONS FOR NON 5SKU BILLING
Frequency Percent Valid Percent Cumula
tive
Percent
Valid
5sku billed 727 58.6 58.6 58.6
TEMPORARY CLOSE 107 8.6 8.6 67.2
PERMANENTLY CLOSE 97 7.8 7.8 75.0
NO COOLER 7 .6 .6 75.6
COOLER NOT WORKING 12 1.0 1.0 76.6
OWNER NOT MET 17 1.4 1.4 77.9
STOCK FULL 142 11.4 11.4 89.4
STOCK OUT 51 4.1 4.1 93.5
LOW BUDGET 2 .2 .2 93.6
NOT IN BEAT PLAN 38 3.1 3.1 96.7
OTHERS 41 3.3 3.3 100.0
Total 1241 100.0 100.0
INTERPRETATION:
1) Amongst those outlets where 5SKU was not billed the major reasons were
they were temporarily closed, they were having full stock and there was
stock out of products that were asked to order.
2) Even there were many outlets which are permanently closed but were still
displayed in the permanent journey plans of pre sellers.

4) TYPE OF DRINKS RETAILER IS SELLING FREQUENCY:
what kind of drink are you selling?
Frequency Percent Valid Percent Cumulative
Percent
Valid
cold drink 85 36.2 36.2 36.2
all 150 63.8 63.8 100.0
Total 235 100.0 100.0
INTERPRETATION:36% of the retailers only sell carbonated drinks while 64% of the retailers are
those who sell all type of drinks which means demand for juices is also good in
the market.
5) FREQUENCIES OF THE BRANDS THAT RETAILERS KEEP IN STOCK; PEPSICO, DABUR, PARLE AND OTHERS BRAND ALONG WITH THE COCA COCA PRODUCTS.
FREQUENCY TABLE
pepsi co
Frequency Percent Valid Percent Cumulative
Percent
Valid
no 90 38.3 38.3 38.3
yes 145 61.7 61.7 100.0
Total 235 100.0 100.0
parle
Frequency Percent Valid Percent Cumulative
Percent
Valid
no 100 42.6 42.6 42.6
yes 135 57.4 57.4 100.0
Total 235 100.0 100.0
dabur
Frequency Percent Valid Percent Cumulative
Percent
Valid
no 170 72.3 72.3 72.3
yes 65 27.7 27.7 100.0
Total 235 100.0 100.0
Other
Frequency Percent Valid Percent Cumulative
Percent
Valid
no 155 66.0 66.0 66.0
yes 80 34.0 34.0 100.0
Total 235 100.0 100.0
Bar Chart

INTERPRETATION:
The analysis shows that amongst retail outlet dealers of Coca cola, 61% of the
dealers also keeps pepsico products, 60% also keeps parle product, 27% keeps
dabur products and 34% keeps other brands too which is giving big competition
to the company and even more choices to the consumers this is leading to flow in
the bucket of the Coca Cola Sales.
6) Frequency of factors that affects customer preference while
buying:
What attracts customers while buying the Coca Cola products?
Frequency Percent Valid Percent Cumulative
Percent
Valid
packaging 45 19.1 19.1 19.1
pricing 40 17.0 17.0 36.2
taste 60 25.5 25.5 61.7
display 80 34.0 34.0 95.7
any other 10 4.3 4.3 100.0
Total 235 100.0 100.0
INTERPRETATION:
Analysis shows that display of the product is the most important feature that
makes customer’s preference for purchase then followed by taste, packaging and
then pricing and least by others.

7) Frequency of the way retailers purchase the stock:
How do you purchase the stock of coca cola products?
Frequency Percent Valid Percent Cumulative
Percent
Valid
Through pre sellers (by order) 110 46.8 46.8 46.8
Through RSU 52 22.1 22.1 68.9
Through Fat Dealers 43 18.3 18.3 87.2
Through pre sellers and fat
dealers30 12.8 12.8 100.0
Total 235 100.0 100.0
INTERPRETATION:46% of the retailers purchase the stock from the company process i.e. through pre sellers. Rest all the purchase made is illegal according to the company. This is very big reason for uncounted sale of the company and illegal plotting of the stocks and orders in the market by the pre sellers.

8) Frequency of the most frequent buyer:
Who are the most frequent buyers of coca products?
Frequency Percent Valid Percent Cumulative
Percent
Valid
Less than 15 years 69 29.4 29.4 29.4
15 – 45 years 154 65.5 65.5 94.9
Above 45 years 12 5.1 5.1 100.0
Total 235 100.0 100.0
INTERPRETATION:-
The maximum number of purchase is made by the adults then followed by
children and old agers. This shows that company can focus on the priority basis
this is even one of the important reason for thumbs up being on top of most
selling products.
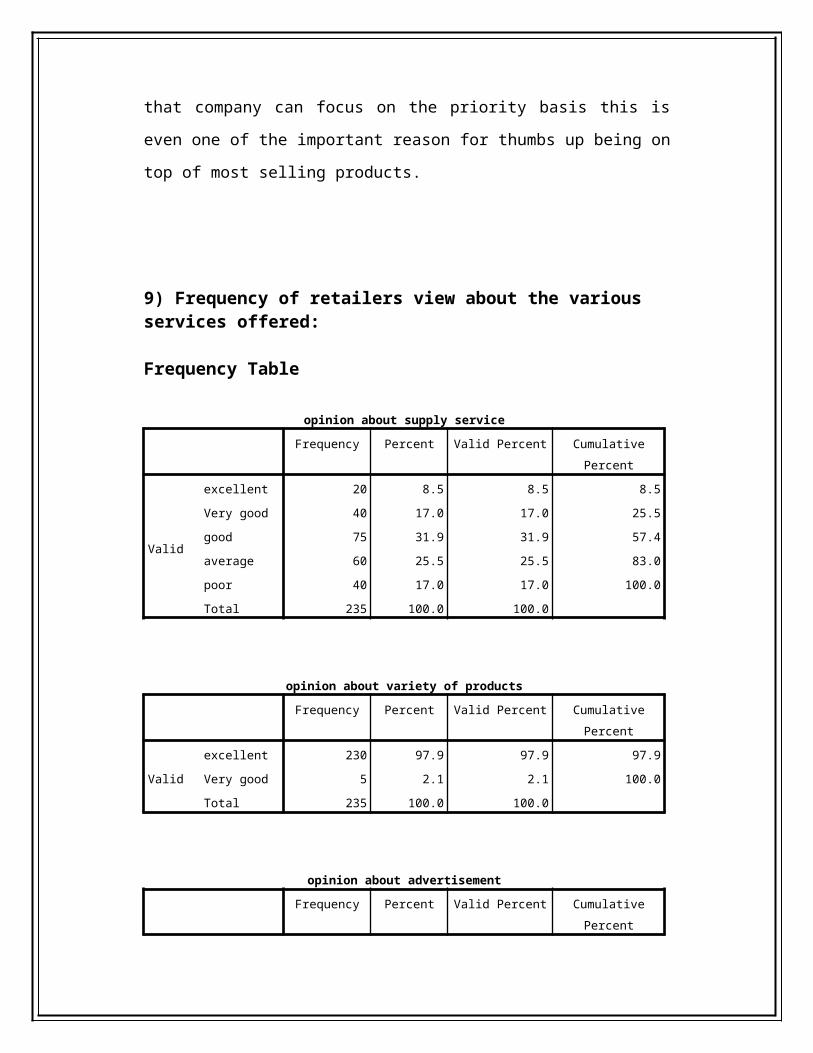
9) Frequency of retailers view about the various services offered:
Frequency Table
opinion about supply service
Frequency Percent Valid Percent Cumulative
Percent
Valid
excellent 20 8.5 8.5 8.5
Very good 40 17.0 17.0 25.5
good 75 31.9 31.9 57.4
average 60 25.5 25.5 83.0
poor 40 17.0 17.0 100.0
Total 235 100.0 100.0
opinion about variety of products
Frequency Percent Valid Percent Cumulative
Percent
Valid
excellent 230 97.9 97.9 97.9
Very good 5 2.1 2.1 100.0
Total 235 100.0 100.0
opinion about advertisement
Frequency Percent Valid Percent Cumulative
Percent
Valid
excellent 135 57.4 57.4 57.4
Very good 90 38.3 38.3 95.7
good 5 2.1 2.1 97.9
average 5 2.1 2.1 100.0
Total 235 100.0 100.0
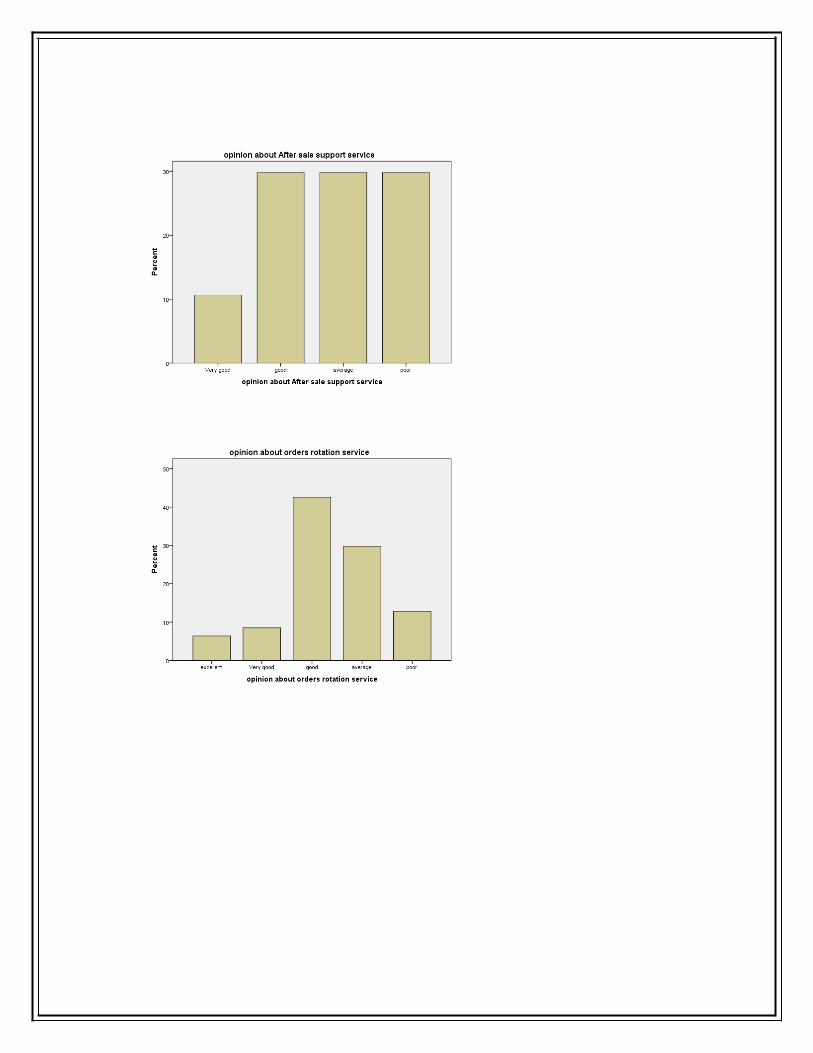
opinion about After sale support service
Frequency Percent Valid Percent Cumulative
Percent
Valid
Very good 25 10.6 10.6 10.6
good 70 29.8 29.8 40.4
average 70 29.8 29.8 70.2
poor 70 29.8 29.8 100.0
Total 235 100.0 100.0
opinion about orders rotation service
Frequency Percent Valid Percent Cumulative
Percent
Valid
excellent 15 6.4 6.4 6.4
Very good 20 8.5 8.5 14.9
good 100 42.6 42.6 57.4
average 70 29.8 29.8 87.2
poor 30 12.8 12.8 100.0
Total 235 100.0 100.0
opinion about sales man behaviour
Frequency Percent Valid Percent Cumulative
Percent
Valid
excellent 25 10.6 10.6 10.6
Very good 100 42.6 42.6 53.2
good 55 23.4 23.4 76.6
average 30 12.8 12.8 89.4
poor 25 10.6 10.6 100.0
Total 235 100.0 100.0
opinion about complain handling service
Frequency Percent Valid Percent Cumulative
Percent
Valid
excellent 15 6.4 6.4 6.4
Very good 25 10.6 10.6 17.0
good 55 23.4 23.4 40.4
average 105 44.7 44.7 85.1
poor 35 14.9 14.9 100.0
Total 235 100.0 100.0
opinion about cooler service
Frequency Percent Valid Percent Cumulative
Percent
Valid
excellent 50 21.3 21.3 21.3
Very good 75 31.9 31.9 53.2
good 25 10.6 10.6 63.8
average 25 10.6 10.6 74.5
poor 60 25.5 25.5 100.0
Total 235 100.0 100.0
opinion about schemes offered
Frequency Percent Valid Percent Cumulative
Percent
Valid
excellent 15 6.4 6.4 6.4
Very good 55 23.4 23.4 29.8
good 70 29.8 29.8 59.6
average 80 34.0 34.0 93.6
poor 15 6.4 6.4 100.0
Total 235 100.0 100.0

opinion about prices of products
Frequency Percent Valid Percent Cumulative
Percent
Valid
excellent 5 2.1 2.1 2.1
Very good 65 27.7 27.7 29.8
good 110 46.8 46.8 76.6
average 20 8.5 8.5 85.1
poor 35 14.9 14.9 100.0
Total 235 100.0 100.0
opinion about packaging
Frequency Percent Valid Percent Cumulative
Percent
Valid
excellent 130 55.3 55.3 55.3
Very good 90 38.3 38.3 93.6
good 15 6.4 6.4 100.0
Total 235 100.0 100.0
Bar Chart


INTERPRETATION:-
1) Supply: Retailers are not much satisfied with the supply services of the
company. 31% of the retailers gave their opinion as average.
2) Advertising: Retailers were very much satisfied.
3) After Sale Service: According to retailers it was just ok not too good not
too bad.
4) Order Rotation Service: According to retailers it was good.
5) Opinion about Sales Man Behavior: Retailers were very much satisfied
with the sales man. But this can be biased too as the sales man was always
there while getting the questionnaire filled.
6) Complain Handling Service: Unsatisfactory / Average
7) Cooler Service: Some retailers were highly satisfied but some were very
much unsatisfied.
8) Schemes Offered: It was good. Can be biased because retailers always
want high profit margins.
9) Prices of products: It was good.
10) Packaging: Retailers were very much satisfied.

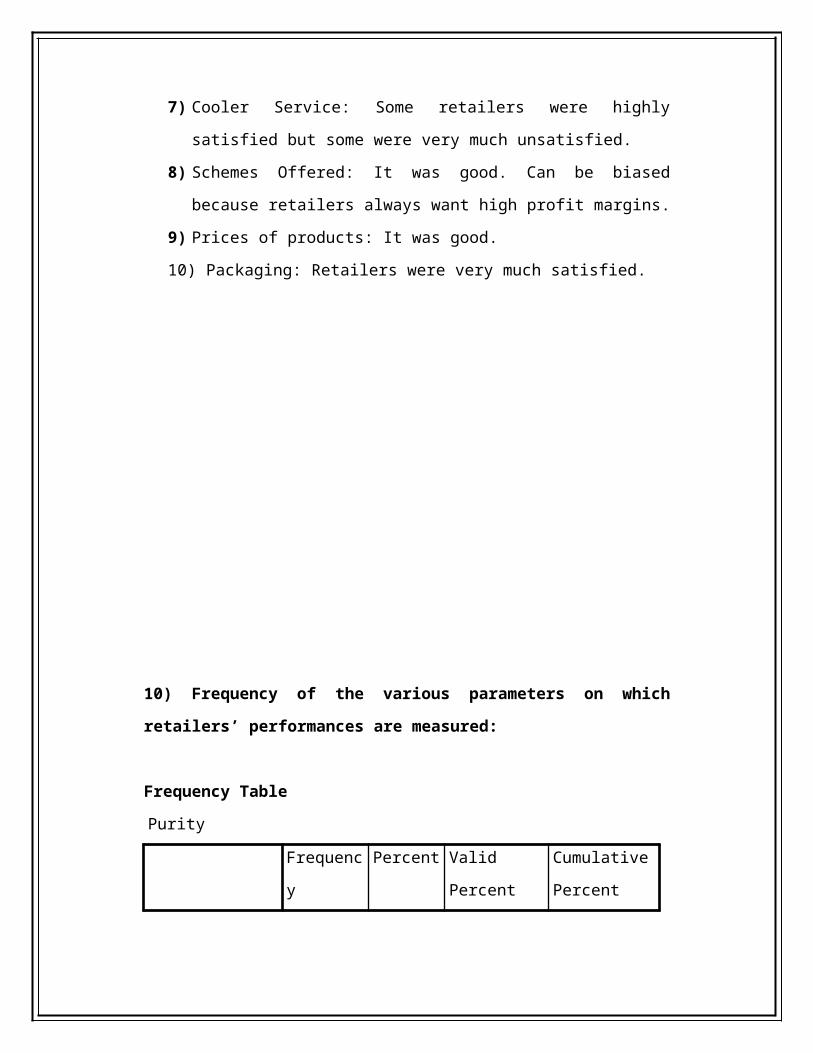
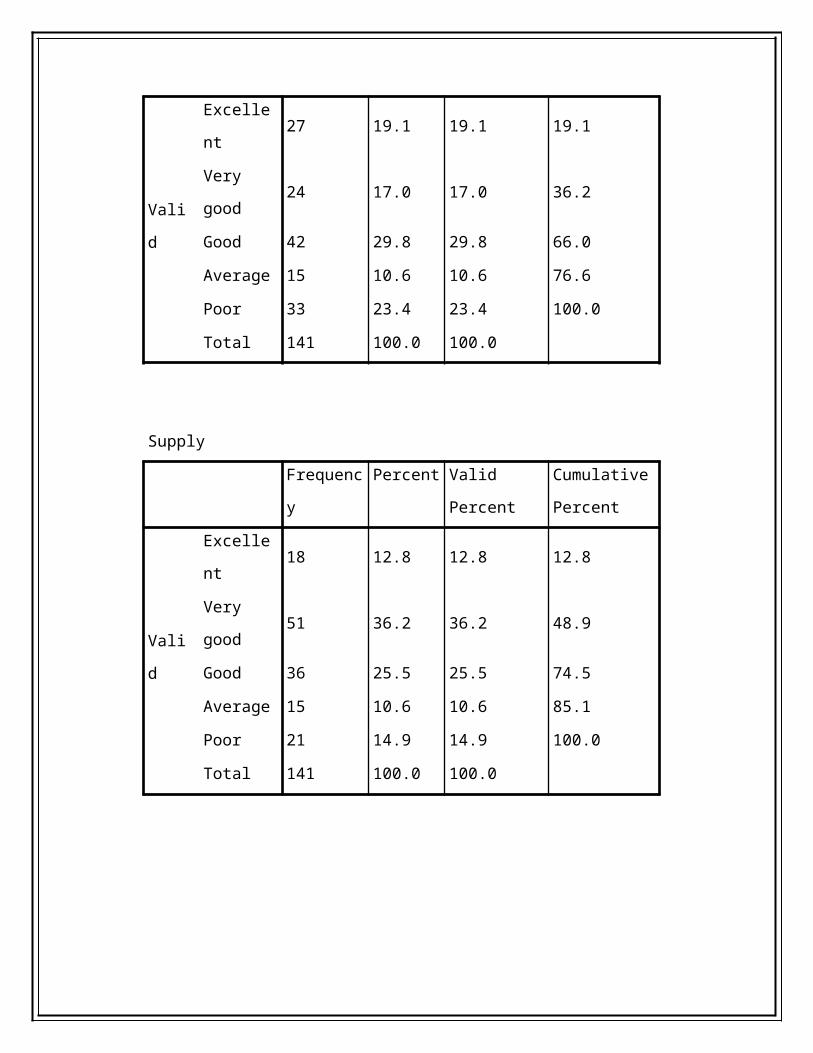
10) Frequency of the various parameters on which retailers’ performances
are measured:
Frequency Table
Purity
Frequency Percent Valid Percent Cumulative
Percent
Valid
Excellent 27 19.1 19.1 19.1
Very good 24 17.0 17.0 36.2
Good 42 29.8 29.8 66.0
Average 15 10.6 10.6 76.6
Poor 33 23.4 23.4 100.0
Total 141 100.0 100.0
Supply
Frequency Percent Valid Percent Cumulative
Percent
Valid
Excellent 18 12.8 12.8 12.8
Very good 51 36.2 36.2 48.9
Good 36 25.5 25.5 74.5
Average 15 10.6 10.6 85.1
Poor 21 14.9 14.9 100.0
Total 141 100.0 100.0

Stock availability
Frequency Percent Valid Percent Cumulative
Percent
Valid
excellent 36 25.5 25.5 25.5
Very good 24 17.0 17.0 42.6
good 33 23.4 23.4 66.0
average 12 8.5 8.5 74.5
poor 36 25.5 25.5 100.0
Total 141 100.0 100.0
Cooler availability
Frequency Percent Valid Percent Cumulative
Percent
Valid
excellent 36 25.5 25.5 25.5
Very good 24 17.0 17.0 42.6
good 18 12.8 12.8 55.3
average 18 12.8 12.8 68.1
poor 45 31.9 31.9 100.0
Total 141 100.0 100.0
Demand
Frequency Percent Valid Percent Cumulative
Percent
Valid
excellent 54 38.3 38.3 38.3
Very good 36 25.5 25.5 63.8
good 9 6.4 6.4 70.2
average 15 10.6 10.6 80.9
poor 27 19.1 19.1 100.0
Total 141 100.0 100.0

Display
Frequency Percent Valid Percent Cumulative
Percent
Valid
excellent 45 31.9 31.9 31.9
Very good 9 6.4 6.4 38.3
good 21 14.9 14.9 53.2
average 24 17.0 17.0 70.2
poor 42 29.8 29.8 100.0
Total 141 100.0 100.0
Purchasing power
Frequency Percent Valid Percent Cumulative
Percent
Valid
excellent 60 42.6 42.6 42.6
Very good 36 25.5 25.5 68.1
good 9 6.4 6.4 74.5
average 3 2.1 2.1 76.6
poor 33 23.4 23.4 100.0
Total 141 100.0 100.0
Cooling
Frequency Percent Valid Percent Cumulative
Percent
Valid
excellent 39 27.7 27.7 27.7
Very good 24 17.0 17.0 44.7
good 18 12.8 12.8 57.4
average 6 4.3 4.3 61.7
poor 54 38.3 38.3 100.0
Total 141 100.0 100.0
Sales
Frequency Percent Valid Percent Cumulative
Percent
Valid
excellent 51 36.2 36.2 36.2
Very good 27 19.1 19.1 55.3
Good 15 10.6 10.6 66.0
Average 12 8.5 8.5 74.5
Poor 36 25.5 25.5 100.0
Total 141 100.0 100.0
Ordering cycle
Frequency Percent Valid Percent Cumulative
Percent
Valid
excellent 42 29.8 29.8 29.8
Very good 15 10.6 10.6 40.4
Good 33 23.4 23.4 63.8
Average 15 10.6 10.6 74.5
Poor 36 25.5 25.5 100.0
Total 141 100.0 100.0
Loyalty
Frequency Percent Valid Percent Cumulative
Percent
Valid
excellent 48 34.0 34.0 34.0
Very good 15 10.6 10.6 44.7
Good 27 19.1 19.1 63.8
Average 21 14.9 14.9 78.7
Poor 30 21.3 21.3 100.0
Total 141 100.0 100.0

Location
Frequency Percent Valid Percent Cumulative
Percent
Valid
excellent 84 59.6 59.6 59.6
Very good 24 17.0 17.0 76.6
good 21 14.9 14.9 91.5
average 12 8.5 8.5 100.0
Total 141 100.0 100.0
Attitude
Frequency Percent Valid Percent Cumulative
Percent
Valid
excellent 24 17.0 17.0 17.0
Very good 18 12.8 12.8 29.8
good 45 31.9 31.9 61.7
average 27 19.1 19.1 80.9
poor 27 19.1 19.1 100.0
Total 141 100.0 100.0

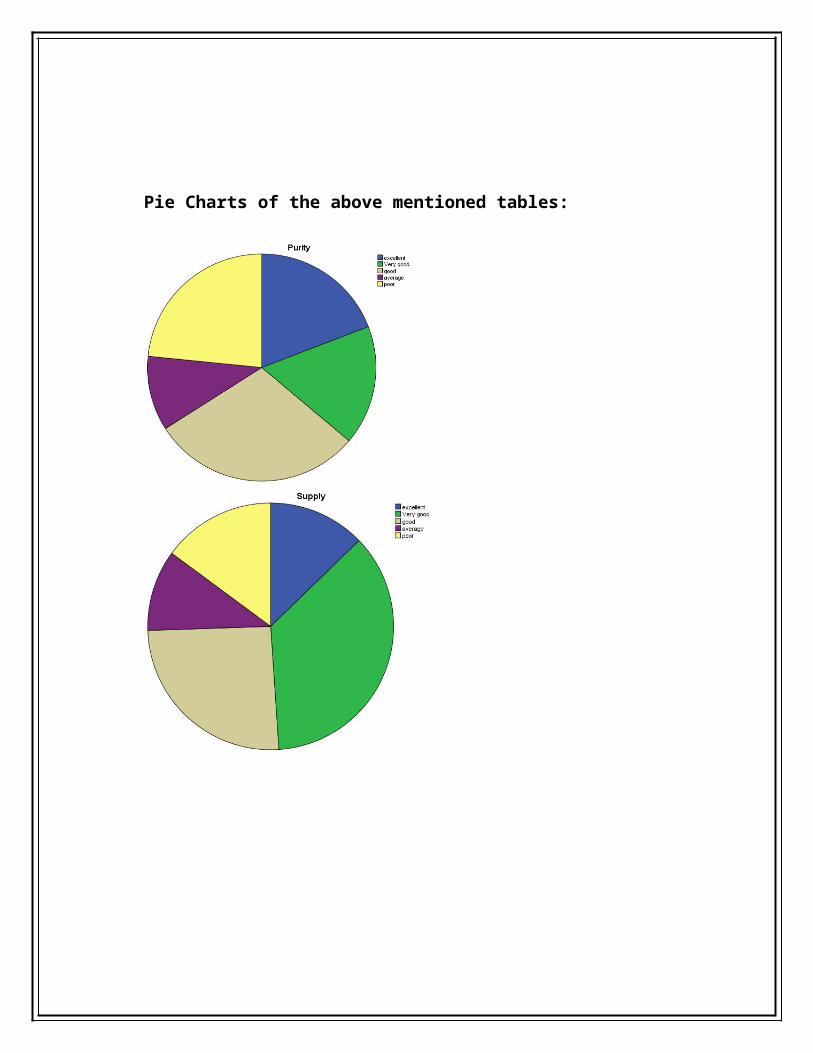
Pie Charts of the above mentioned tables:


INTERPRETATION:-
1) Purity: Purity was good not too bad not too good.
2) Supply: It was good.
3) Stock availability: a variety of retailers were there this was dependent of
the purchasing power of the retailer some were good, some were excellent
and even some were very poor.
4) Cooler Availability: It was very poor. Lots many retailers with good
locations doesn’t have coolers.
5) Demand: Demand for coca cola products was excellent.
6) Display: both varieties of responses poor and excellent.
7) Purchasing Power: Most of the retailers of Coca Cola are having excellent
purchasing power.
8) Cooling: Poor cooling due to non working and damaged coolers.
9) Ordering cycle: Retailers were having very good ordering cycle, but as an
exception that RSU purchase is not done.

10) Sales: Maximum retailers are having high volume sales.(Excellent)
11) Loyalty: Retailers of Coca Cola are very much loyal to the company.
12) Location: Location of the most 60% of the retailers is excellent.
13) Attitude: 32% of the retailers were having good attitude and most of the
remaining were having average and poor attitude towards company.

CHAPTER 7
SUGGESTIONS AND CONCLUSIONS
7.1: SUGGESTIONS
The company should measure retailers’ satisfaction regularly.
Company can increase the sales if it will concentrate more on
retailers, their suggestions or complaints about service and product so that
necessary actions can be taken.
Company should take actions to stop RSU (Ready Stock Unit) purchase
by the retailers.
Company should have a complain number for retailers where they can
register their complains. This will increase transparency between company
and its retailers.
More knowledge about the company strategies should be given to the pre
sellers so that they can work on it in better way.
Company should take actions for improving the supply chains amongst the
reasons for non 5SKU billing reasons “stock out” is also a major reason.
Review meeting should be often held so that the working pattern of the
sales people can be checked and improved if needed.
Company pre sellers should take orders by visiting retailers and should
make a long-term liaison with retailers so that they can push the product.
Pre sellers’ loyalty check should be done on monthly basis so that they
have the fear to visit the maximum number of retailers and can not be able
to plot orders in unauthorized manner.
Since brand value of Coke & expectation of retailers from this brand is
high, as the brand image shows their qualities supervene so the company
should also take feedback time to time. By this they can maintain their
brand loyalty in their customers.
Distributers should be convinced to pass the incentives to the retailers so
that they are motivated to promote this brand.
Increase the number of dealers and retailers as this will help in making
high sales volume.
Cash discount should be given & it should be competitive and luring.
Try to maintain the good image of the monopoly outlets in market by
developing the image of the outlets i.e. by providing extra discounts, by
glow boards, signboards, and point of sale material (P.O.S.M) and by
providing good quality services. By this the monopoly of the retailer will
continue and it will promote other retailers to adopt Coke monopoly.
Company should also concentrate on small outlets so that there sales can
increase.
Company representatives should search new areas for increase in sales.
In winter Season company should give more discount & schemes to the
retailers so they sell more our product.
Company must make aggressive & new strategies to fight with major
competitors and local cold drinks brands.
The company should work on retailers’ complaints regarding to the Visi
cooler.
Company should give proper schemes to the outlet and must watch that
retailers are been given the same scheme which company has declared.
The refrigerator purity should be given the priority.
Overall services should be improved for getting more sales and to
continue to be the market leader.
Company should take the problem of “cut off rates seriously”.
Coca-Cola should be written on florescent boards displaying location and
distances on road.
Illegal distribution done by some distributors should be minimized.

7.2: CONCLUSION
Everything in this world is made to utilize properly but it should be reach at the
proper person or to the proper utilized areas. Otherwise the value added to those
things became in vein. As there is a proverb:-
“Far from eye, far from heart”
Thus marketing plays very important role in achieving the objectives of the
company. Undoubtedly, value utility is created by the manufacture of product or
service but time and place utilities are created by marketing role.
According to Ducker, “Both the market and the distribution channels are often
more crucial than the product”. They are primary, the product is secondary.
In an economy like that of India, where marginal shortages
can lead to disproportion, distortion in prices, dependable and efficient
distribution system is very much essential. The distribution system creates value
added to all most all products. All from the above study not withstanding its
restricting efforts Pepsi is still far away with its great competitor like Coca Cola.
The only source of revenue with the companies is the sales its only sales which
shows the growth of the organization so they should always make new creative
and innovative strategies for better sales.
Market conditions are truly different from what we have studies in books so in
order to survive in such kind of competitions company should focus more on its
distribution system because it is a saying in the market that “ jo dikhta hai wahi
bikta hai”- So proper and timely availability of the product is very necessary for
its sale.

BIBLIOGRAPHY:
REFRENCES:
BOOKS: AUTHOR:
MARKETING RESEARCH NARESH MALHOTRA
MARKETING MANAGEMENT PHILIP KOTLER
RESEARCH METHEDOLOGY C.R.KOTHARI
Websites:
www.quickmba.com
www.indiacom.com
www.yellowpages.com
www.coca-colaindia.com

ANNEXURE 1
QUESTIONAIRE FOR RETAILERS
The objective of this survey is to Study the reasons of low green score with special reference to preference of stock keeping units (SKU) in Coca Cola products by retailers in Ghaziabad city.
We request you to attempt all the questions so as to help us arrive at authentic results. The data collected herein will be purely used for academic purpose. Your cooperation will be highly appreciated.
Amity University, Noida
QUESTIONNAIRE
P l e a s e e x p r e s s y o u r f r a n k o p i n i o n o n a l l t h e f o l l o w i n g q u e s t i o n s c o n c e r n i n g y o u r preference of brand in cold drinks by checking the most appropriate alternative(s) and others as well
1. What kind of drink are you selling?
Cold drink
Juice
All
2. What brand of drinks you stock at your outlet?
Coca Cola
PepsiCo
Parle
Dabur
Any other ______________
3. How long you have been selling coke in your outlet?
Since last 1 month
Since last 1 year
Since last 2 years
Since last 3 years
Over 3 years

4. What attracts customers while buying the Coca Cola products?
Packaging
Pricing
Taste
Display
Any other____________
5. How do you purchase the stock of coca cola products.
Through pre sellers (by order)
Through RSU
Through Fat Dealers
Through pre sellers and fat dealers
6. Who are the frequent buyers?
Children
Adults
Any other ____________
6. What is your opinion about the Following services offered by Coca Cola to its retailers on the following factors?
(Please mark :: 1=Excellent, 2=Very Good, 3=Good, 4=Average and 5=Poor for each feature.)
Features Excellent(1)
Very Good(2)
Good(3)
Average(4)
Poor(5)
SupplyVariety of productsAdvertisementAfter sale supportOrders rotationSales man behaviorComplain handlingCooler serviceSchemes offeredRatesPackaging
7. Your suggestion about how to increase to increase sales of coke?
_______________________________________________________________________________________________________________________________________________________________________________________________________________________________
P l e a s e f i l l t h e f o l l o w i n g i n f o r m a t i o n a l d e t a i l s .
1. NAME : ______________________________________
2. GENDER : ______________________________________
3. AGE (Please Tick): Under 20 Between 20-29 Between 30-39 Between 40-49 Between 50-60 Over 60
4. Annual income (Please Tick) :
Under 1,50,000 Between 1,50,000- 2,50,000 Over 2,50,000
-: Thanks for your participation:-
6.2 OTHER FINDINGS:
Official Use
Measuring Performance
1). Parameters for measurement:-
Features Excellent(1)
Very Good(2)
Good(3)
Average(4)
Poor(5)
PuritySupplyStock availabilityCooler availabilityDemandDisplayPurchasing powerCoolingSalesLocationLoyaltyAttitude

Ordering cycle
2). Products Available:-
Products\volume RGB200ml
RGB
300ml
Tetra Pack200m
l
Express350ml
Pet500ml
Pet600ml
1.25L 2.0 L 2.25L 300mlCAN
Thumps up - -Coke -
Fantail -Sprite -Lima -Diet Coke -Maze -Maze milky delight - -M M pulpy orange - -M M Nimbu Fresh -Kinley water -Kinley Soda - -
3). Problems at Pre Seller’s end.
_________________________________________________________________________________________________________________________________________________________________________________________________________________________________________________________________________________________________________________________________________________________________________________________________________________________________________________________________________________________________________________________________________________________________________

ANNEXURE 2
