coats group plc - coats - the world's leading industrial ... · coats group plc . 2015 full...
TRANSCRIPT
Coats Group plc 2015 full year results presentation
25 February 2016
© Coats Group plc | 2015 full year results presentation | 25 February 2016 Page 2
Disclaimer
Restricted distributionThis presentation is not for release, publication or distribution, in whole or in part, directly or indirectly, in, into or from any jurisdiction where to do so would constitute a violation of the relevant laws or regulations of such jurisdiction (the ‘Restricted Jurisdictions’).
Not an offerThis presentation is not intended to and does not constitute, or form part of, any offer to sell or subscribe for or an invitation to purchase or subscribe for any securities or the solicitation of any vote or approval in any jurisdiction pursuant to the matters contained herein or otherwise.
Forward-looking statementsThis document contains certain forward-looking statements, including statements regarding Coats Group plc’s plans (‘Coats’ or the ‘Company’), objectives and expected performance. Such statements relate to events and depend on circumstances that will occur in the future and are subject to risks, uncertainties and assumptions. There are a number of factors which could cause actual results and developments to differ materially from those expressed or implied by such forward-looking statements, including, among others the enactment of legislation or regulation that may impose costs or restrict activities; the re-negotiation of contracts of licences; fluctuations in demand and pricing in the industry; fluctuations in exchange controls; changes in government policy and taxations; industrial disputes; and war and terrorism. These forward-looking statements speak only as at the date of this document.
Not a profit forecastThe financial information contained in this presentation is based on publicly available historic financial information of Coats and is not intended to be a profit forecast or profit estimate under applicable rules.
RoundingDue to rounding, numbers presented throughout this document may not add up precisely to the totals provided and percentages may not precisely reflect the absolute figures.
© Coats Group plc | 2015 full year results presentation | 25 February 2016 Page 3
Overview
Financial performance
Summary and outlook
Appendices
2015 full year results presentation
Agenda
Overview
© Coats Group plc | 2015 full year results presentation | 25 February 2016 Page 5
Highlights
Strong operating performance and improved quality of earnings
Pre-exceptional operating profit up 19% LFL (constant currency); operating margins up 130bps
Adjusted EPS up 38% LFL; reported loss due to discontinued items
Adjusted free cash flow of $74m (2014: $88m)
Return on capital employed increased to 33% (2014: 24%)
Strategic progress
Disposed of loss-making EMEA Crafts business and completed first acquisition (GSD)
Good market share gains in Industrial
Highly engaged and safe workforce
Recordable accident rate down 12%; employee engagement score 83% (in global top 10%)
Normalising as a UK plc
Change of name, combined Board, UK focused share register, intention to delist from NZX and ASX
Pensions investigations: initiated settlement discussions with Trustees of three UK schemes
© Coats Group plc | 2015 full year results presentation | 25 February 2016 Page 6
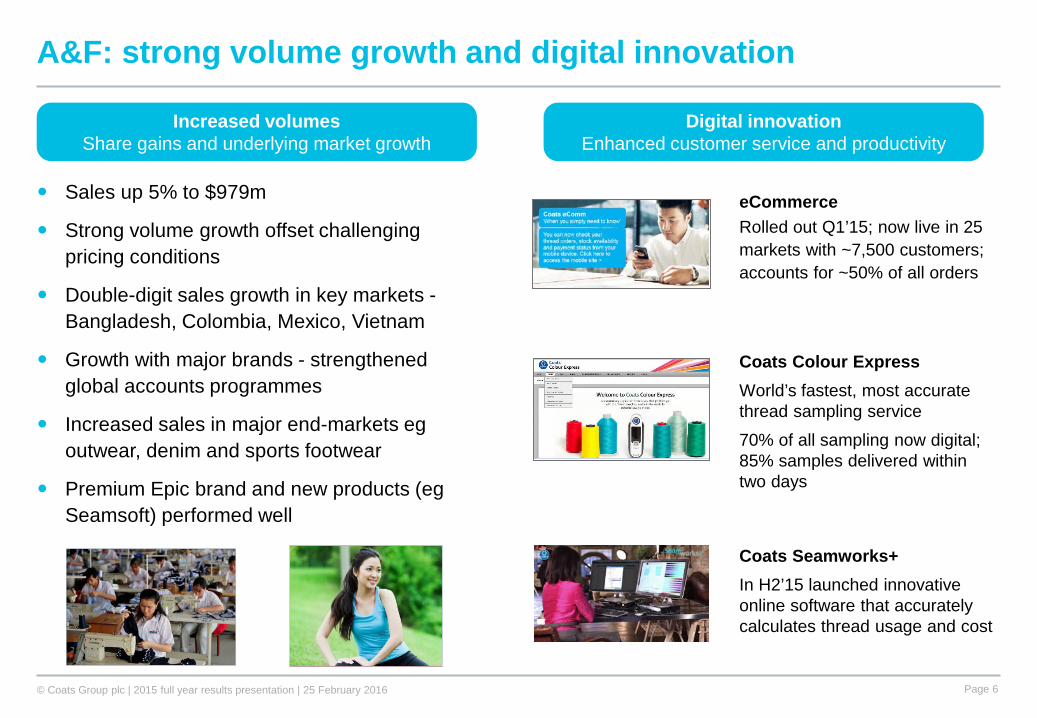
Sales up 5% to $979m
Strong volume growth offset challenging pricing conditions
Double-digit sales growth in key markets -Bangladesh, Colombia, Mexico, Vietnam
Growth with major brands - strengthened global accounts programmes
Increased sales in major end-markets egoutwear, denim and sports footwear
Premium Epic brand and new products (egSeamsoft) performed well
A&F: strong volume growth and digital innovation
Coats Colour ExpressWorld’s fastest, most accurate thread sampling service
70% of all sampling now digital; 85% samples delivered within two days
Coats Seamworks+In H2’15 launched innovative online software that accurately calculates thread usage and cost
eCommerceRolled out Q1’15; now live in 25 markets with ~7,500 customers; accounts for ~50% of all orders
Increased volumesShare gains and underlying market growth
Digital innovationEnhanced customer service and productivity
© Coats Group plc | 2015 full year results presentation | 25 February 2016 Page 7
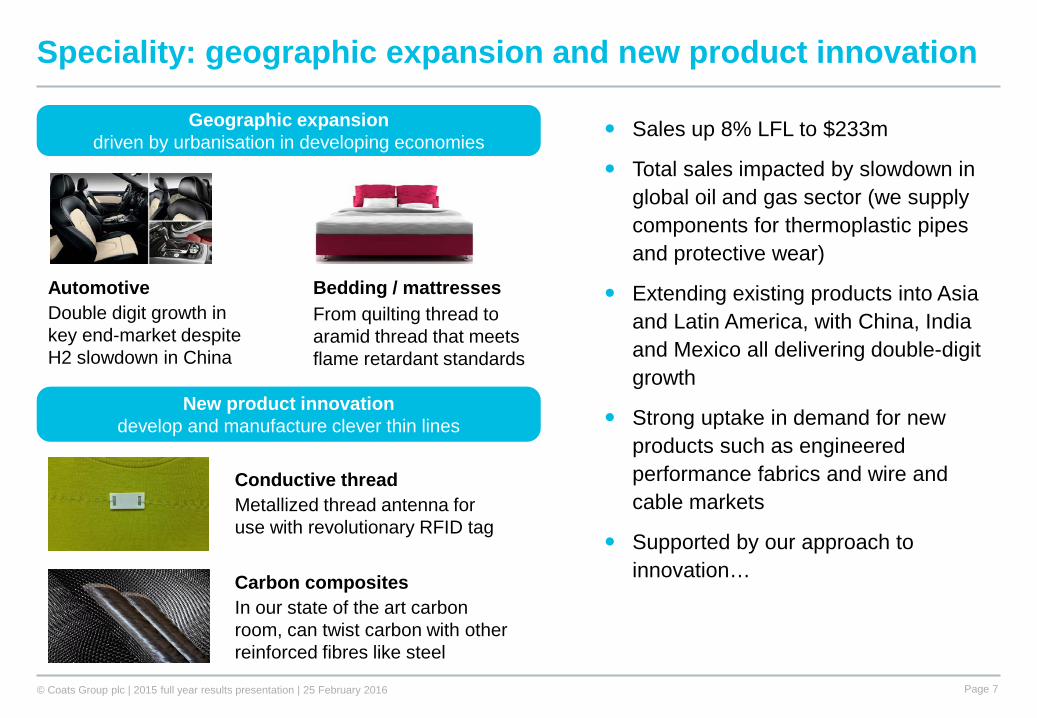
Sales up 8% LFL to $233m
Total sales impacted by slowdown in global oil and gas sector (we supply components for thermoplastic pipes and protective wear)
Extending existing products into Asia and Latin America, with China, India and Mexico all delivering double-digit growth
Strong uptake in demand for new products such as engineered performance fabrics and wire and cable markets
Supported by our approach to innovation…
Speciality: geographic expansion and new product innovation
Conductive threadMetallized thread antenna for use with revolutionary RFID tag
New product innovationdevelop and manufacture clever thin lines
Carbon compositesIn our state of the art carbon room, can twist carbon with other reinforced fibres like steel
Geographic expansiondriven by urbanisation in developing economies
AutomotiveDouble digit growth in key end-market despite H2 slowdown in China
Bedding / mattressesFrom quilting thread to aramid thread that meets flame retardant standards
© Coats Group plc | 2015 full year results presentation | 25 February 2016 Page 8
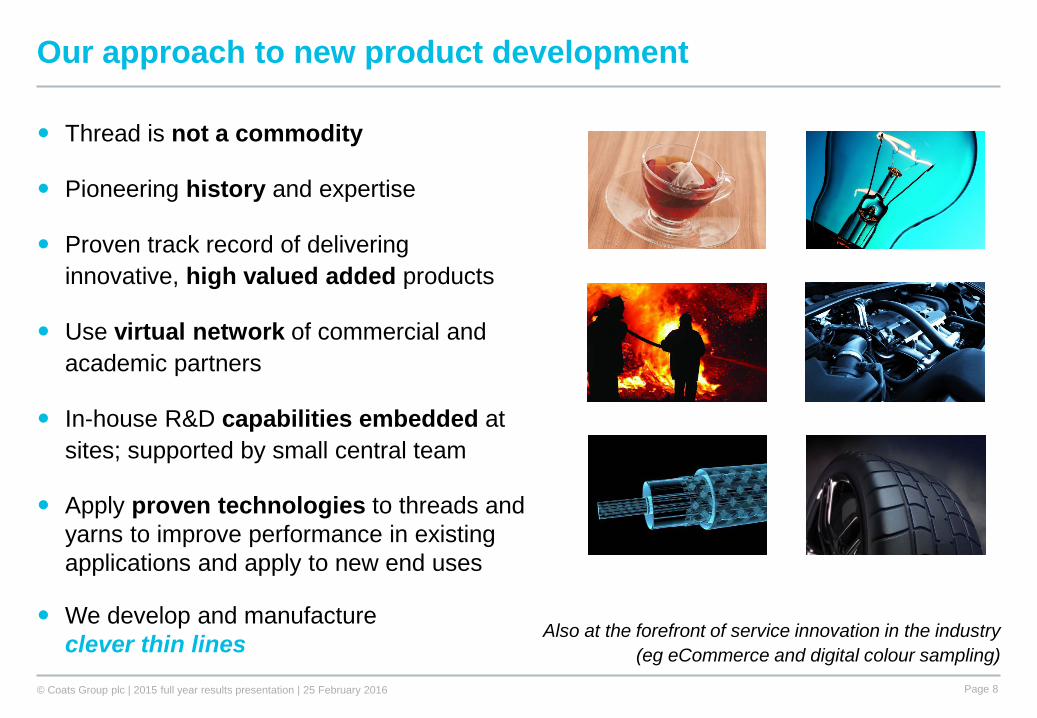
Our approach to new product development
Thread is not a commodity
Pioneering history and expertise
Proven track record of delivering innovative, high valued added products
Use virtual network of commercial and academic partners
In-house R&D capabilities embedded at sites; supported by small central team
Apply proven technologies to threads and yarns to improve performance in existing applications and apply to new end uses
We develop and manufacture clever thin lines Also at the forefront of service innovation in the industry
(eg eCommerce and digital colour sampling)
© Coats Group plc | 2015 full year results presentation | 25 February 2016 Page 9
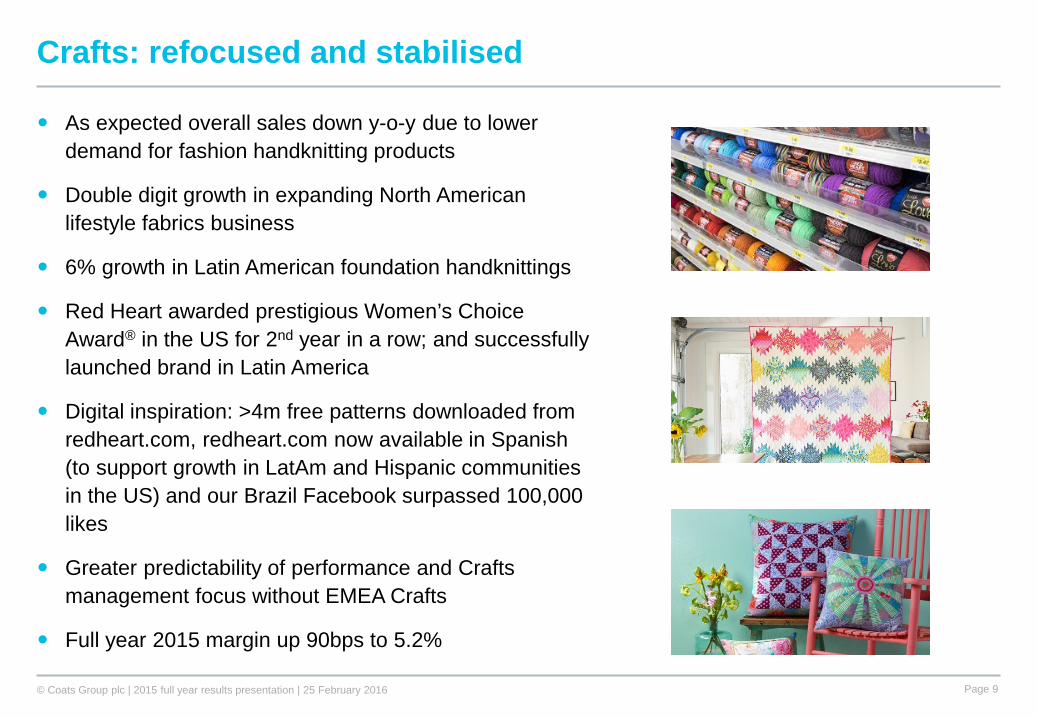
As expected overall sales down y-o-y due to lower demand for fashion handknitting products
Double digit growth in expanding North American lifestyle fabrics business
6% growth in Latin American foundation handknittings
Red Heart awarded prestigious Women’s Choice Award® in the US for 2nd year in a row; and successfully launched brand in Latin America
Digital inspiration: >4m free patterns downloaded from redheart.com, redheart.com now available in Spanish (to support growth in LatAm and Hispanic communities in the US) and our Brazil Facebook surpassed 100,000 likes
Greater predictability of performance and Crafts management focus without EMEA Crafts
Full year 2015 margin up 90bps to 5.2%
Crafts: refocused and stabilised
© Coats Group plc | 2015 full year results presentation | 25 February 2016 Page 10
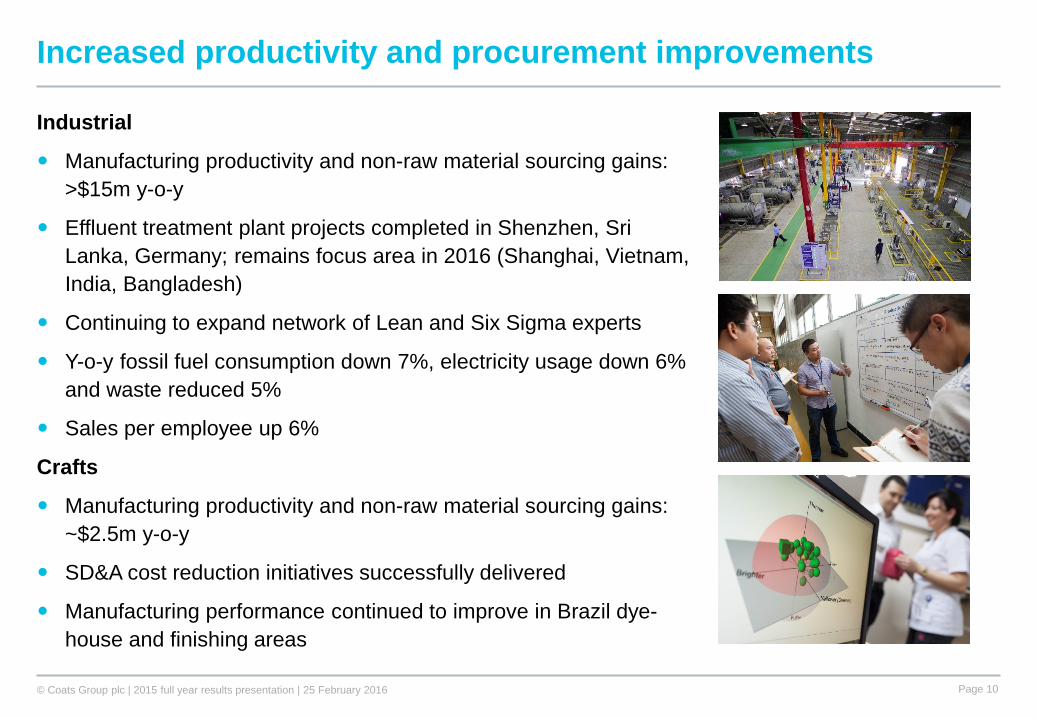
Increased productivity and procurement improvements
Industrial
Manufacturing productivity and non-raw material sourcing gains: >$15m y-o-y
Effluent treatment plant projects completed in Shenzhen, Sri Lanka, Germany; remains focus area in 2016 (Shanghai, Vietnam, India, Bangladesh)
Continuing to expand network of Lean and Six Sigma experts
Y-o-y fossil fuel consumption down 7%, electricity usage down 6% and waste reduced 5%
Sales per employee up 6%
Crafts
Manufacturing productivity and non-raw material sourcing gains: ~$2.5m y-o-y
SD&A cost reduction initiatives successfully delivered
Manufacturing performance continued to improve in Brazil dye-house and finishing areas
© Coats Group plc | 2015 full year results presentation | 25 February 2016 Page 11
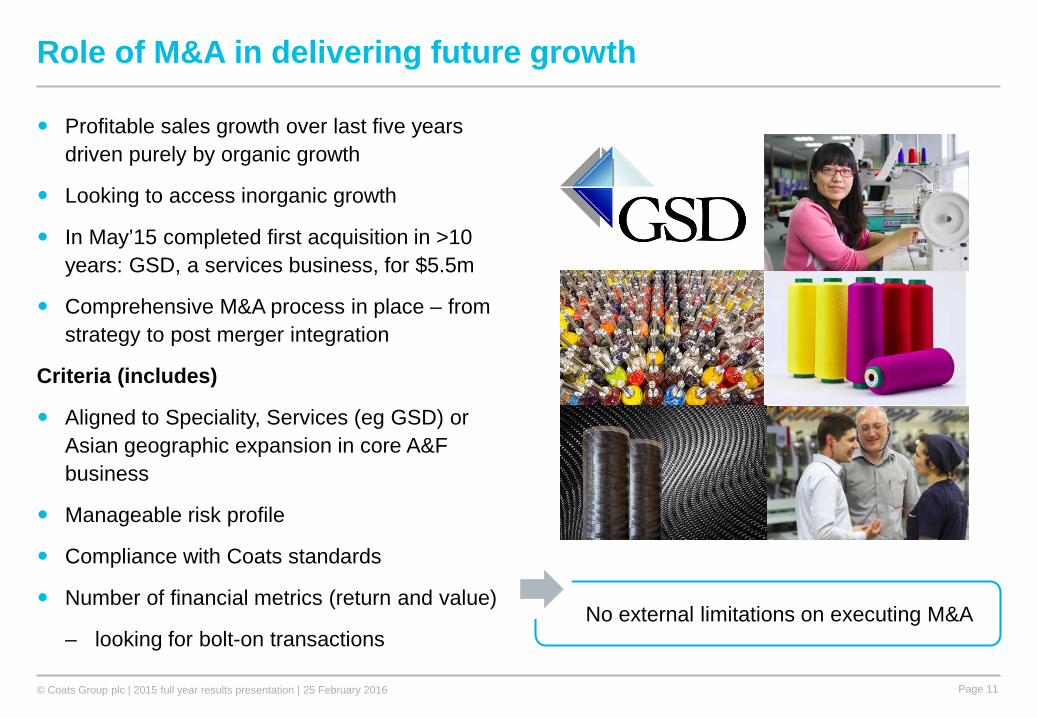
Role of M&A in delivering future growth
Profitable sales growth over last five years driven purely by organic growth
Looking to access inorganic growth
In May’15 completed first acquisition in >10 years: GSD, a services business, for $5.5m
Comprehensive M&A process in place – from strategy to post merger integration
Criteria (includes)
Aligned to Speciality, Services (eg GSD) or Asian geographic expansion in core A&F business
Manageable risk profile
Compliance with Coats standards
Number of financial metrics (return and value)
– looking for bolt-on transactionsNo external limitations on executing M&A
© Coats Group plc | 2015 full year results presentation | 25 February 2016 Page 12
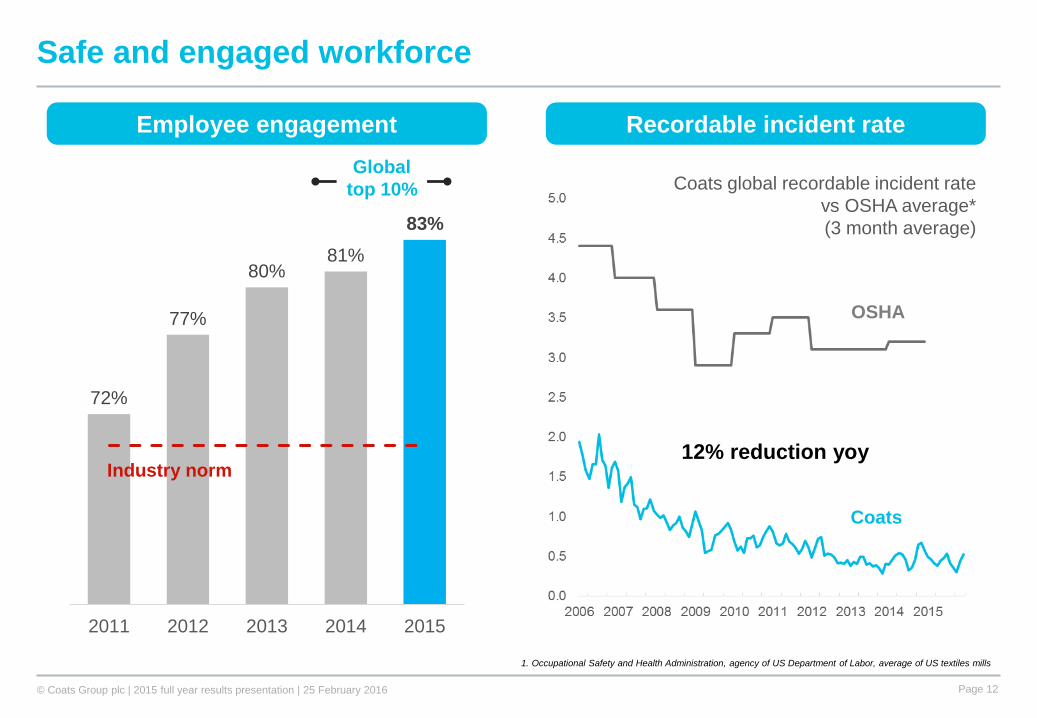
Safe and engaged workforce
72%
77%
80%81%
83%
2011 2012 2013 2014 2015
Industry norm
Employee engagement Recordable incident rateGlobal
top 10% Coats global recordable incident rate vs OSHA average*(3 month average)
OSHA
Coats
1. Occupational Safety and Health Administration, agency of US Department of Labor, average of US textiles mills
12% reduction yoy
© Coats Group plc | 2015 full year results presentation | 25 February 2016 Page 13
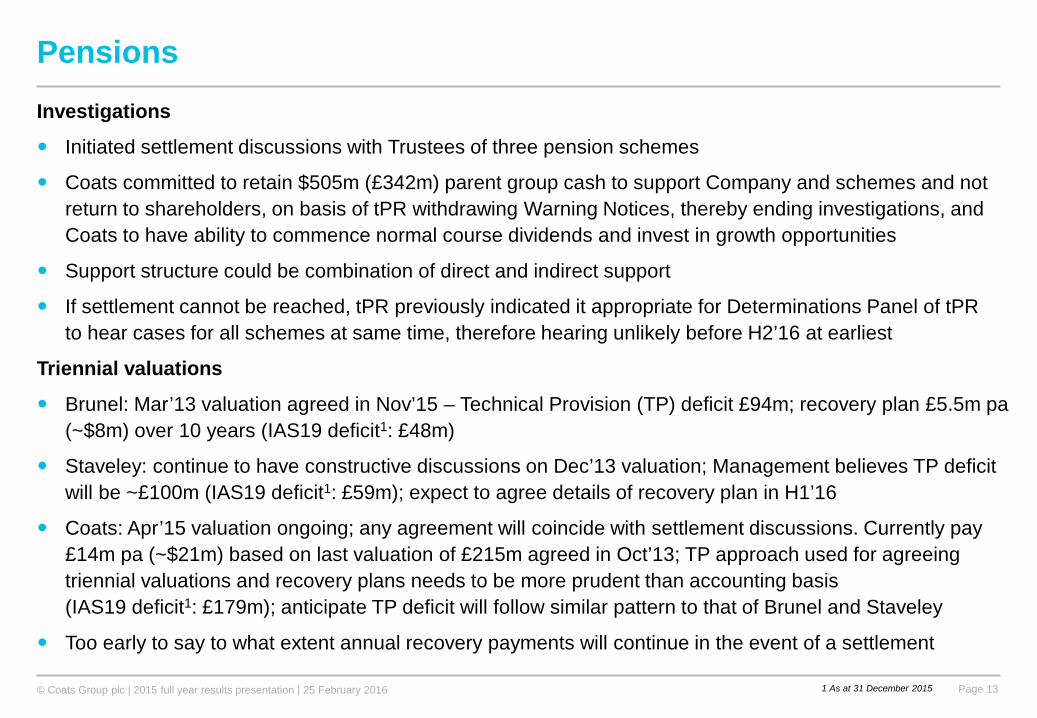
PensionsInvestigations
Initiated settlement discussions with Trustees of three pension schemes
Coats committed to retain $505m (£342m) parent group cash to support Company and schemes and not return to shareholders, on basis of tPR withdrawing Warning Notices, thereby ending investigations, and Coats to have ability to commence normal course dividends and invest in growth opportunities
Support structure could be combination of direct and indirect support
If settlement cannot be reached, tPR previously indicated it appropriate for Determinations Panel of tPR to hear cases for all schemes at same time, therefore hearing unlikely before H2’16 at earliest
Triennial valuations
Brunel: Mar’13 valuation agreed in Nov’15 – Technical Provision (TP) deficit £94m; recovery plan £5.5m pa (~$8m) over 10 years (IAS19 deficit1: £48m)
Staveley: continue to have constructive discussions on Dec’13 valuation; Management believes TP deficit will be ~£100m (IAS19 deficit1: £59m); expect to agree details of recovery plan in H1’16
Coats: Apr’15 valuation ongoing; any agreement will coincide with settlement discussions. Currently pay £14m pa (~$21m) based on last valuation of £215m agreed in Oct’13; TP approach used for agreeing triennial valuations and recovery plans needs to be more prudent than accounting basis (IAS19 deficit1: £179m); anticipate TP deficit will follow similar pattern to that of Brunel and Staveley
Too early to say to what extent annual recovery payments will continue in the event of a settlement
1 As at 31 December 2015
© Coats Group plc | 2015 full year results presentation | 25 February 2016 Page 14
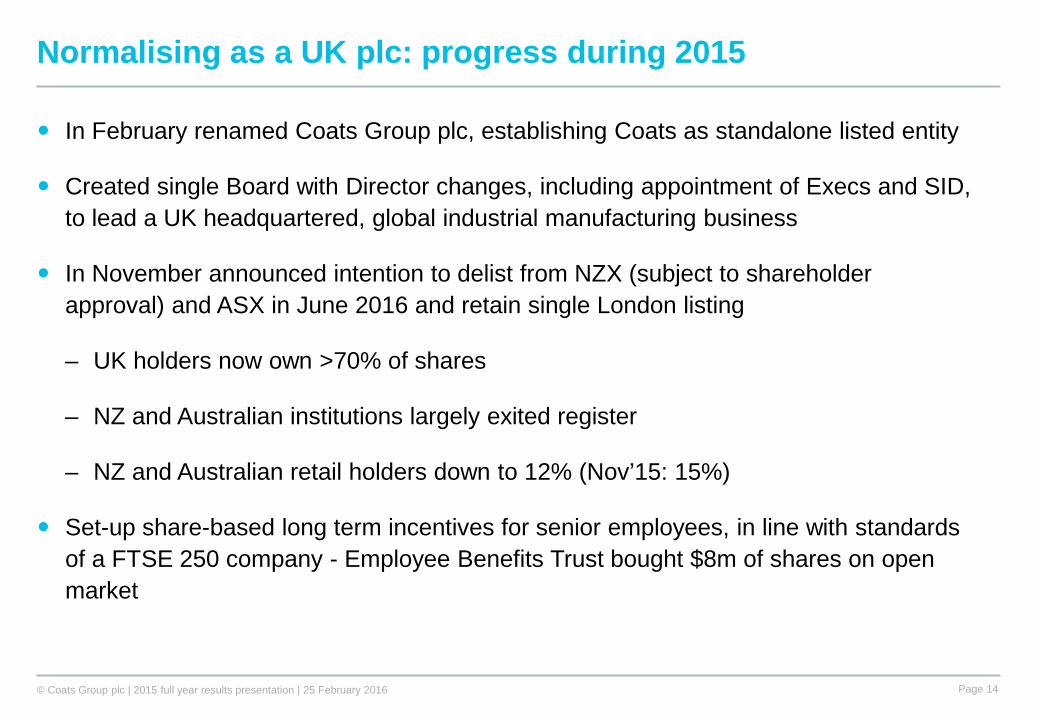
Normalising as a UK plc: progress during 2015
In February renamed Coats Group plc, establishing Coats as standalone listed entity
Created single Board with Director changes, including appointment of Execs and SID, to lead a UK headquartered, global industrial manufacturing business
In November announced intention to delist from NZX (subject to shareholder approval) and ASX in June 2016 and retain single London listing
– UK holders now own >70% of shares
– NZ and Australian institutions largely exited register
– NZ and Australian retail holders down to 12% (Nov’15: 15%)
Set-up share-based long term incentives for senior employees, in line with standards of a FTSE 250 company - Employee Benefits Trust bought $8m of shares on open market
Financial performance
© Coats Group plc | 2015 full year results presentation | 25 February 2016 Page 16
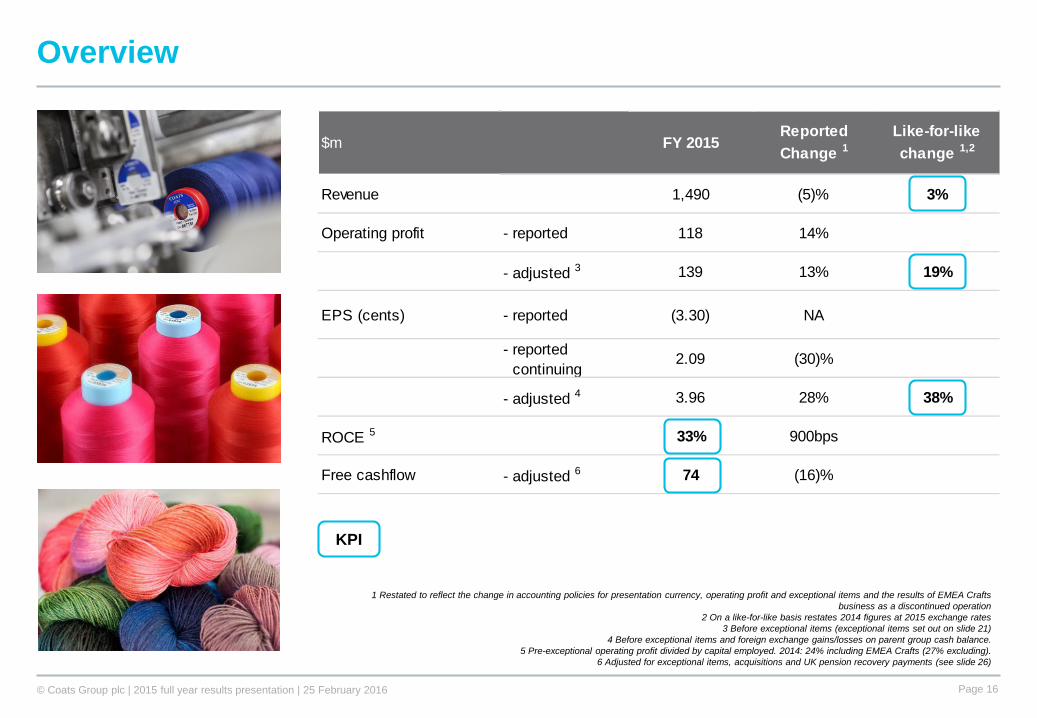
Revenue 1,490 (5)% 3%
Operating profit - reported 118 14%
- adjusted 3 139 13% 19%
EPS (cents) - reported (3.30) NA
- reported continuing
2.09 (30)%
- adjusted 4 3.96 28% 38%
ROCE 5 33% 900bps
Free cashflow - adjusted 6 74 (16)%
$m FY 2015Reported Change 1
Like-for-like change 1,2
Overview
KPI
1 Restated to reflect the change in accounting policies for presentation currency, operating profit and exceptional items and the results of EMEA Crafts business as a discontinued operation
2 On a like-for-like basis restates 2014 figures at 2015 exchange rates3 Before exceptional items (exceptional items set out on slide 21)
4 Before exceptional items and foreign exchange gains/losses on parent group cash balance.5 Pre-exceptional operating profit divided by capital employed. 2014: 24% including EMEA Crafts (27% excluding).
6 Adjusted for exceptional items, acquisitions and UK pension recovery payments (see slide 26)
© Coats Group plc | 2015 full year results presentation | 25 February 2016 Page 17
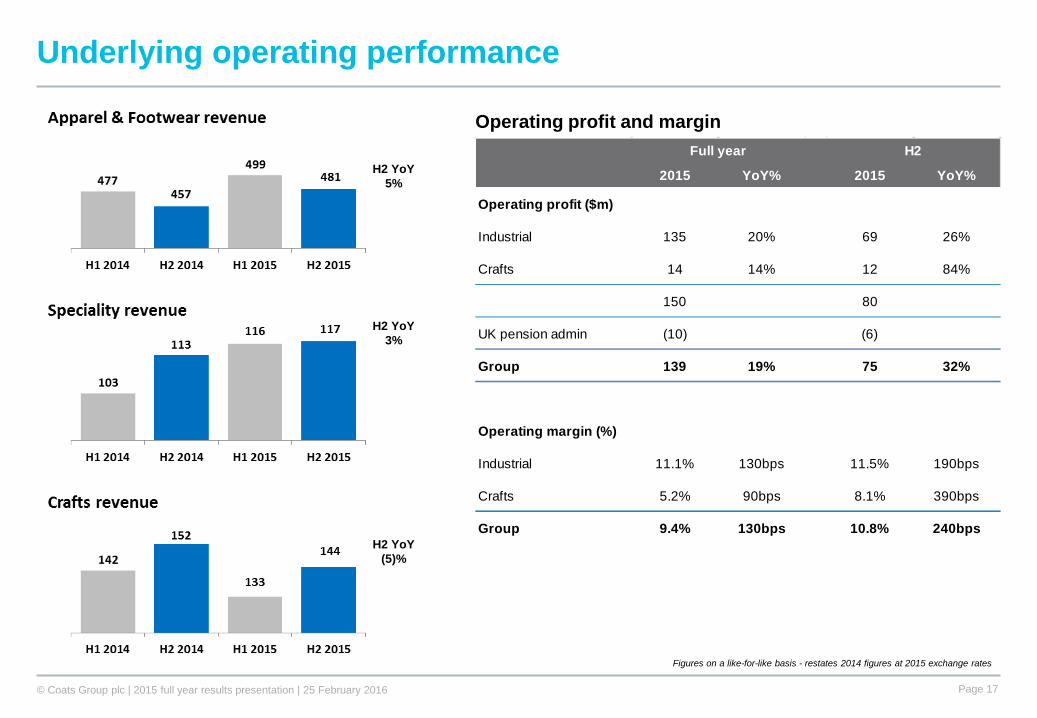
Underlying operating performance
Operating profit and margin
H2 YoY 5%
H2 YoY 3%
H2 YoY (5)%
2015 YoY% 2015 YoY%
Operating profit ($m)
Industrial 135 20% 69 26%
Crafts 14 14% 12 84%
150 80
UK pension admin (10) (6)
Group 139 19% 75 32%
Operating margin (%)
Industrial 11.1% 130bps 11.5% 190bps
Crafts 5.2% 90bps 8.1% 390bps
Group 9.4% 130bps 10.8% 240bps
Full year H2
Figures on a like-for-like basis - restates 2014 figures at 2015 exchange rates
© Coats Group plc | 2015 full year results presentation | 25 February 2016 Page 18
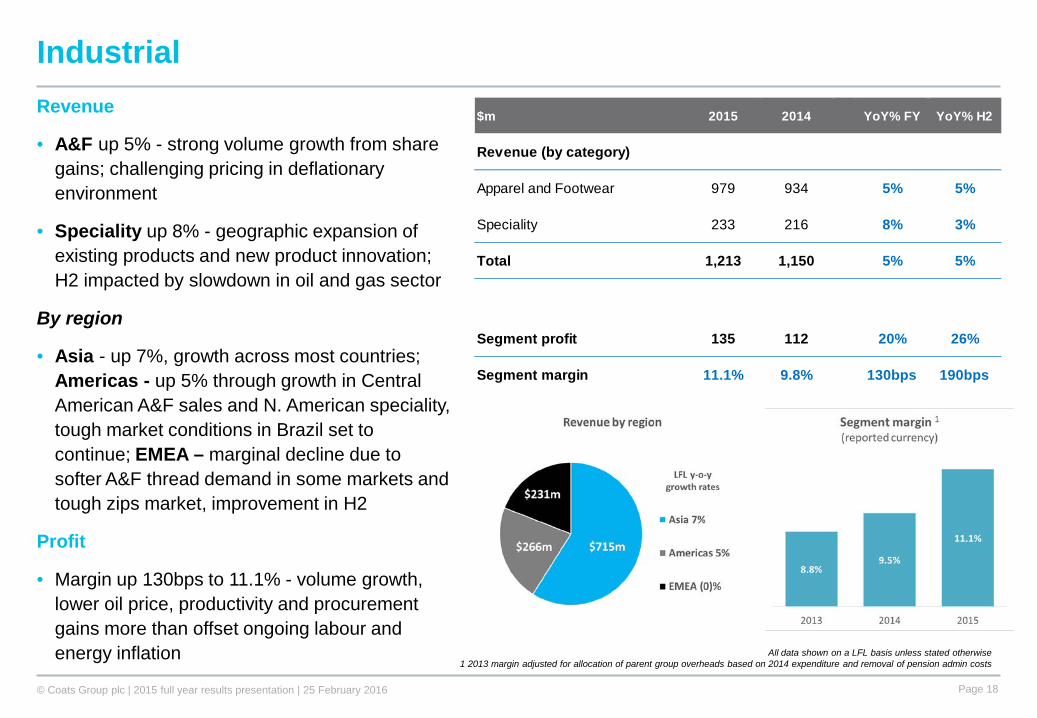
IndustrialRevenue
• A&F up 5% - strong volume growth from share gains; challenging pricing in deflationary environment
• Speciality up 8% - geographic expansion of existing products and new product innovation; H2 impacted by slowdown in oil and gas sector
By region
• Asia - up 7%, growth across most countries; Americas - up 5% through growth in Central American A&F sales and N. American speciality, tough market conditions in Brazil set to continue; EMEA – marginal decline due to softer A&F thread demand in some markets and tough zips market, improvement in H2
Profit
• Margin up 130bps to 11.1% - volume growth, lower oil price, productivity and procurement gains more than offset ongoing labour and energy inflation All data shown on a LFL basis unless stated otherwise
1 2013 margin adjusted for allocation of parent group overheads based on 2014 expenditure and removal of pension admin costs
$m 2015 2014 YoY% FY YoY% H2
Revenue (by category)
Apparel and Footwear 979 934 5% 5%
Speciality 233 216 8% 3%
Total 1,213 1,150 5% 5%
Segment profit 135 112 20% 26%
Segment margin 11.1% 9.8% 130bps 190bps
© Coats Group plc | 2015 full year results presentation | 25 February 2016 Page 19
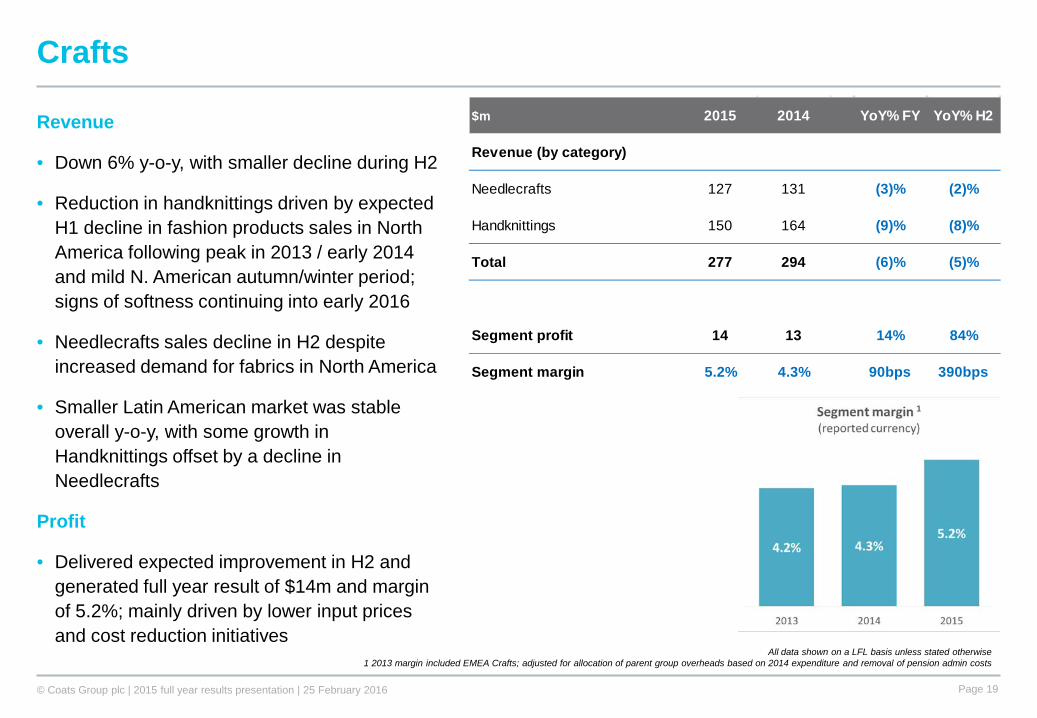
Crafts
Revenue
• Down 6% y-o-y, with smaller decline during H2
• Reduction in handknittings driven by expected H1 decline in fashion products sales in North America following peak in 2013 / early 2014 and mild N. American autumn/winter period; signs of softness continuing into early 2016
• Needlecrafts sales decline in H2 despite increased demand for fabrics in North America
• Smaller Latin American market was stable overall y-o-y, with some growth in Handknittings offset by a decline in Needlecrafts
Profit
• Delivered expected improvement in H2 and generated full year result of $14m and margin of 5.2%; mainly driven by lower input prices and cost reduction initiatives
All data shown on a LFL basis unless stated otherwise1 2013 margin included EMEA Crafts; adjusted for allocation of parent group overheads based on 2014 expenditure and removal of pension admin costs
$m 2015 2014 YoY% FY YoY% H2
Revenue (by category)
Needlecrafts 127 131 (3)% (2)%
Handknittings 150 164 (9)% (8)%
Total 277 294 (6)% (5)%
Segment profit 14 13 14% 84%
Segment margin 5.2% 4.3% 90bps 390bps
© Coats Group plc | 2015 full year results presentation | 25 February 2016 Page 20
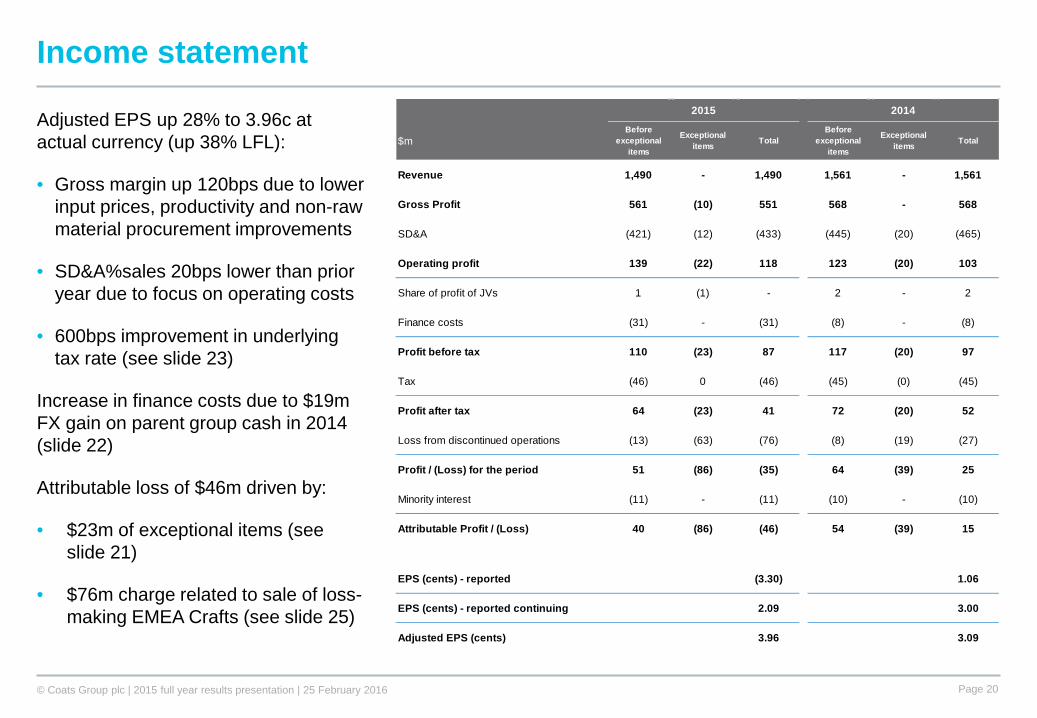
Income statement
Adjusted EPS up 28% to 3.96c at actual currency (up 38% LFL):
• Gross margin up 120bps due to lower input prices, productivity and non-raw material procurement improvements
• SD&A%sales 20bps lower than prior year due to focus on operating costs
• 600bps improvement in underlying tax rate (see slide 23)
Increase in finance costs due to $19m FX gain on parent group cash in 2014 (slide 22)
Attributable loss of $46m driven by:
• $23m of exceptional items (see slide 21)
• $76m charge related to sale of loss-making EMEA Crafts (see slide 25)
$mBefore
exceptional items
Exceptional items Total
Before exceptional
items
Exceptional items Total
Revenue 1,490 - 1,490 1,561 - 1,561
Gross Profit 561 (10) 551 568 - 568
SD&A (421) (12) (433) (445) (20) (465)
Operating profit 139 (22) 118 123 (20) 103
Share of profit of JVs 1 (1) - 2 - 2
Finance costs (31) - (31) (8) - (8)
Profit before tax 110 (23) 87 117 (20) 97
Tax (46) 0 (46) (45) (0) (45)
Profit after tax 64 (23) 41 72 (20) 52
Loss from discontinued operations (13) (63) (76) (8) (19) (27)
Profit / (Loss) for the period 51 (86) (35) 64 (39) 25
Minority interest (11) - (11) (10) - (10)
Attributable Profit / (Loss) 40 (86) (46) 54 (39) 15
EPS (cents) - reported (3.30) 1.06
EPS (cents) - reported continuing 2.09 3.00
Adjusted EPS (cents) 3.96 3.09
2015 2014
© Coats Group plc | 2015 full year results presentation | 25 February 2016 Page 21
$m 2015 2014
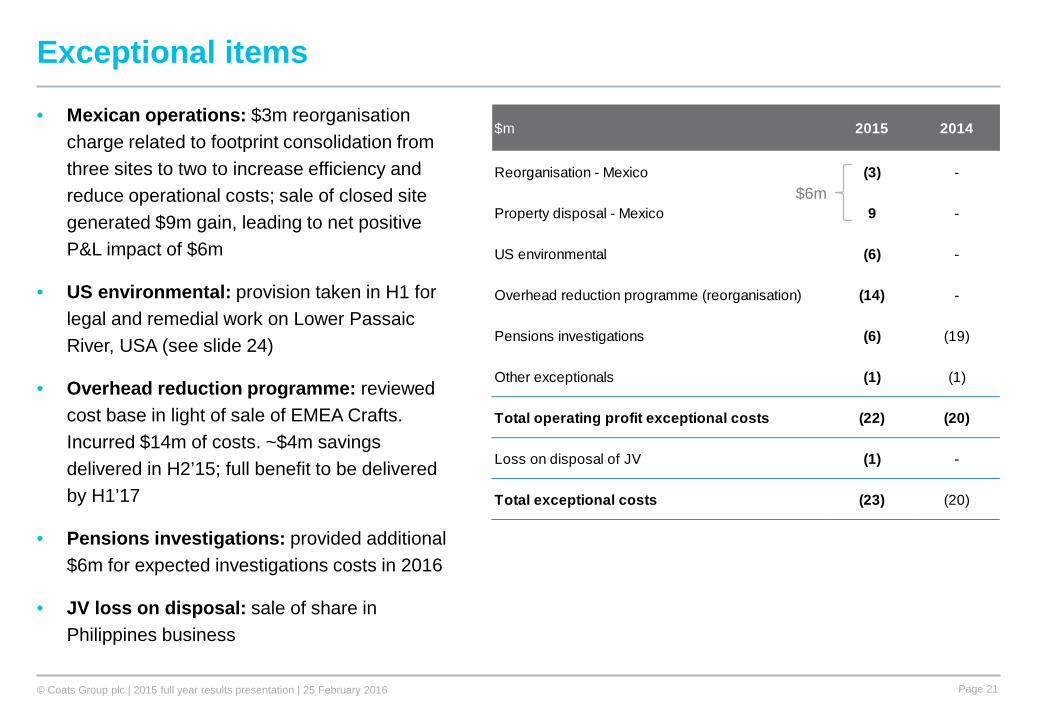
Reorganisation - Mexico (3) -
Property disposal - Mexico 9 -
US environmental (6) -
Overhead reduction programme (reorganisation) (14) -
Pensions investigations (6) (19)
Other exceptionals (1) (1)
Total operating profit exceptional costs (22) (20)
Loss on disposal of JV (1) -
Total exceptional costs (23) (20)
• Mexican operations: $3m reorganisation charge related to footprint consolidation from three sites to two to increase efficiency and reduce operational costs; sale of closed site generated $9m gain, leading to net positive P&L impact of $6m
• US environmental: provision taken in H1 for legal and remedial work on Lower Passaic River, USA (see slide 24)
• Overhead reduction programme: reviewed cost base in light of sale of EMEA Crafts. Incurred $14m of costs. ~$4m savings delivered in H2’15; full benefit to be delivered by H1’17
• Pensions investigations: provided additional $6m for expected investigations costs in 2016
• JV loss on disposal: sale of share in Philippines business
Exceptional items
$6m
© Coats Group plc | 2015 full year results presentation | 25 February 2016 Page 22
Finance costs and foreign exchange movements
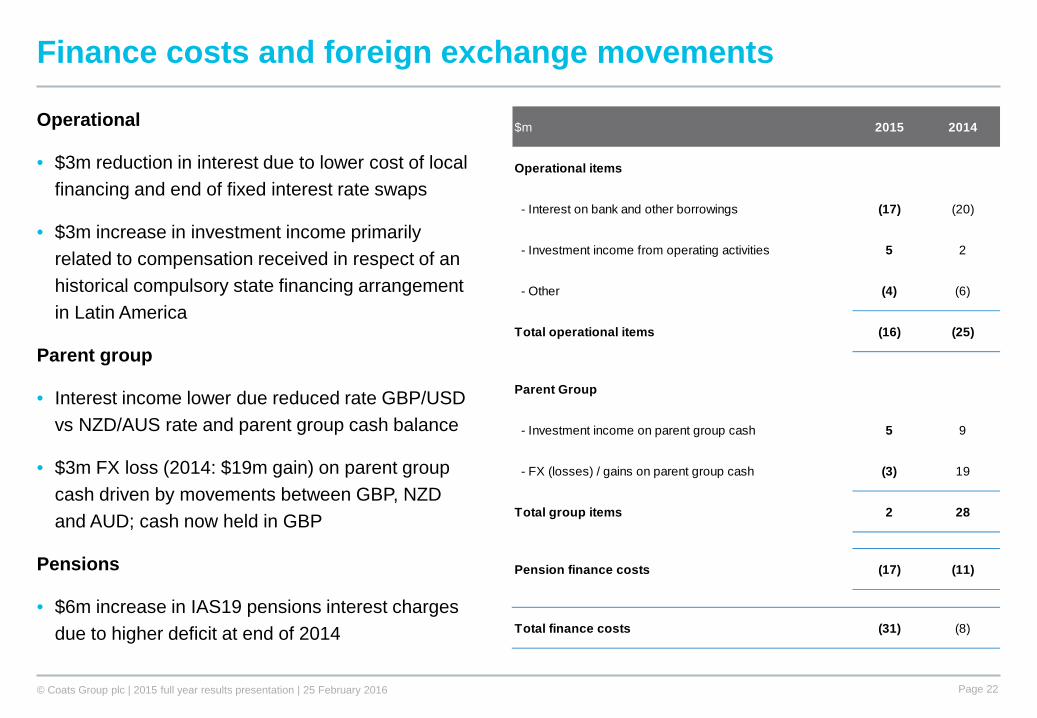
Operational
• $3m reduction in interest due to lower cost of local financing and end of fixed interest rate swaps
• $3m increase in investment income primarily related to compensation received in respect of an historical compulsory state financing arrangement in Latin America
Parent group
• Interest income lower due reduced rate GBP/USD vs NZD/AUS rate and parent group cash balance
• $3m FX loss (2014: $19m gain) on parent group cash driven by movements between GBP, NZD and AUD; cash now held in GBP
Pensions
• $6m increase in IAS19 pensions interest charges due to higher deficit at end of 2014
$m 2015 2014
Operational items
- Interest on bank and other borrowings (17) (20)
- Investment income from operating activities 5 2
- Other (4) (6)
Total operational items (16) (25)
Parent Group
- Investment income on parent group cash 5 9
- FX (losses) / gains on parent group cash (3) 19
Total group items 2 28
Pension finance costs (17) (11)
Total finance costs (31) (8)
© Coats Group plc | 2015 full year results presentation | 25 February 2016 Page 23
Taxation
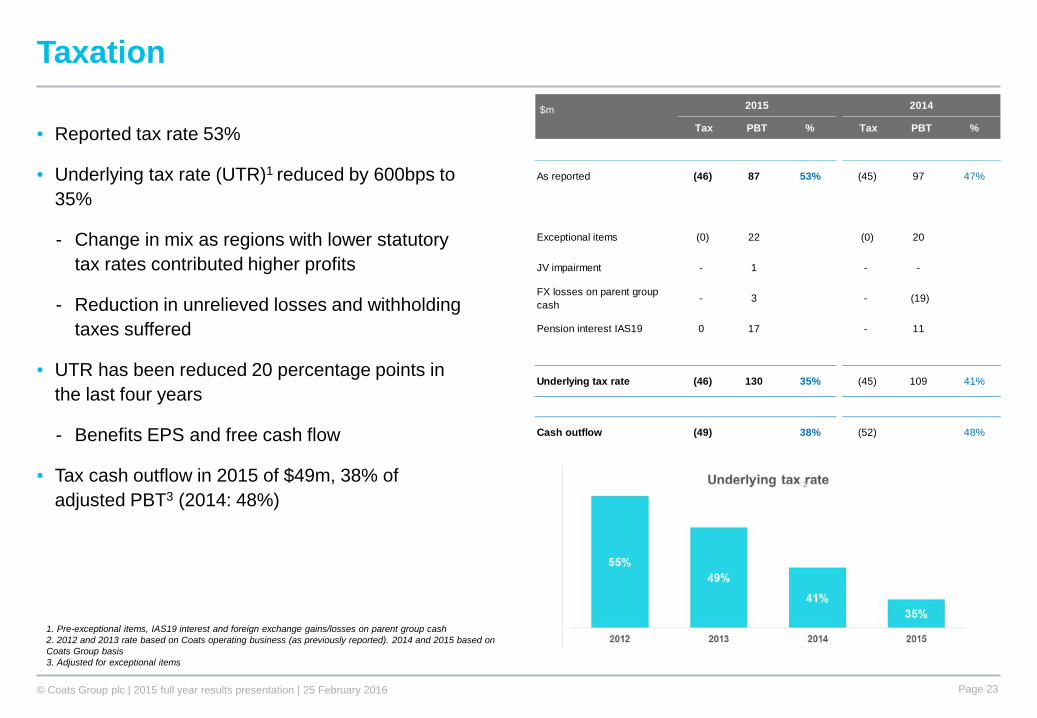
• Reported tax rate 53%
• Underlying tax rate (UTR)1 reduced by 600bps to 35%
- Change in mix as regions with lower statutory tax rates contributed higher profits
- Reduction in unrelieved losses and withholding taxes suffered
• UTR has been reduced 20 percentage points in the last four years
- Benefits EPS and free cash flow
• Tax cash outflow in 2015 of $49m, 38% of adjusted PBT3 (2014: 48%)
1. Pre-exceptional items, IAS19 interest and foreign exchange gains/losses on parent group cash2. 2012 and 2013 rate based on Coats operating business (as previously reported). 2014 and 2015 based on Coats Group basis3. Adjusted for exceptional items
Tax PBT % Tax PBT %
As reported (46) 87 53% (45) 97 47%
Exceptional items (0) 22 (0) 20
JV impairment - 1 - -
FX losses on parent group cash
- 3 - (19)
Pension interest IAS19 0 17 - 11
Underlying tax rate (46) 130 35% (45) 109 41%
Cash outflow (49) 38% (52) 48%
$m 2015 2014
2
© Coats Group plc | 2015 full year results presentation | 25 February 2016 Page 24
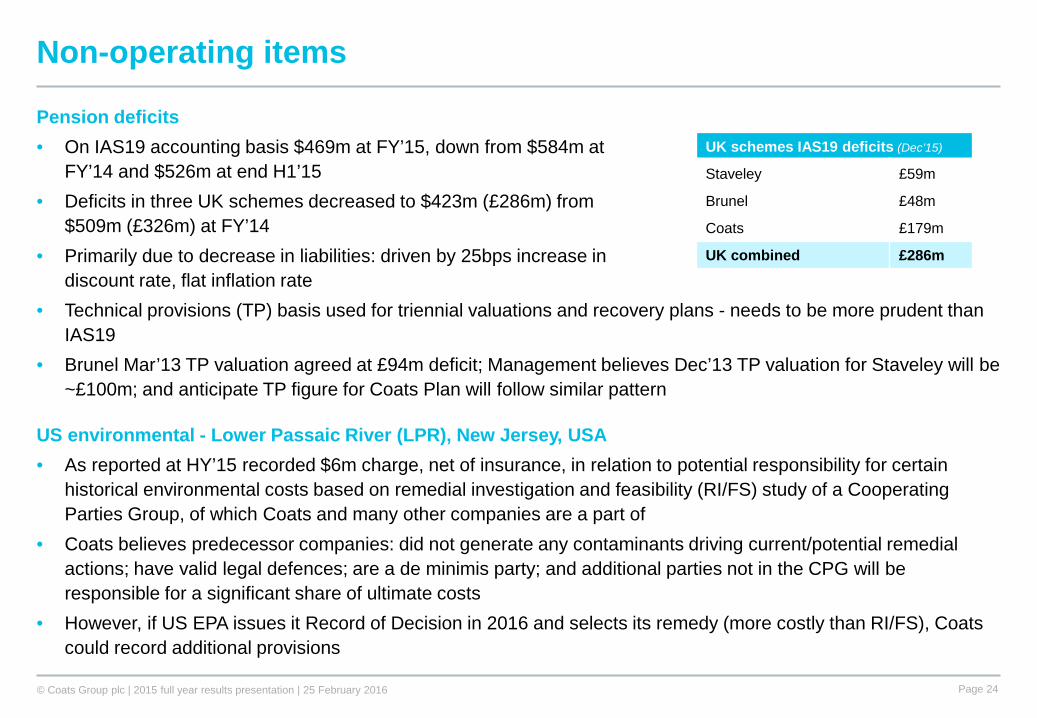
Pension deficits• On IAS19 accounting basis $469m at FY’15, down from $584m at
FY’14 and $526m at end H1’15• Deficits in three UK schemes decreased to $423m (£286m) from
$509m (£326m) at FY’14• Primarily due to decrease in liabilities: driven by 25bps increase in
discount rate, flat inflation rate• Technical provisions (TP) basis used for triennial valuations and recovery plans - needs to be more prudent than
IAS19• Brunel Mar’13 TP valuation agreed at £94m deficit; Management believes Dec’13 TP valuation for Staveley will be
~£100m; and anticipate TP figure for Coats Plan will follow similar pattern
US environmental - Lower Passaic River (LPR), New Jersey, USA• As reported at HY’15 recorded $6m charge, net of insurance, in relation to potential responsibility for certain
historical environmental costs based on remedial investigation and feasibility (RI/FS) study of a Cooperating Parties Group, of which Coats and many other companies are a part of
• Coats believes predecessor companies: did not generate any contaminants driving current/potential remedial actions; have valid legal defences; are a de minimis party; and additional parties not in the CPG will be responsible for a significant share of ultimate costs
• However, if US EPA issues it Record of Decision in 2016 and selects its remedy (more costly than RI/FS), Coats could record additional provisions
Non-operating items
UK schemes IAS19 deficits (Dec’15)
Staveley £59m
Brunel £48m
Coats £179m
UK combined £286m
© Coats Group plc | 2015 full year results presentation | 25 February 2016 Page 25
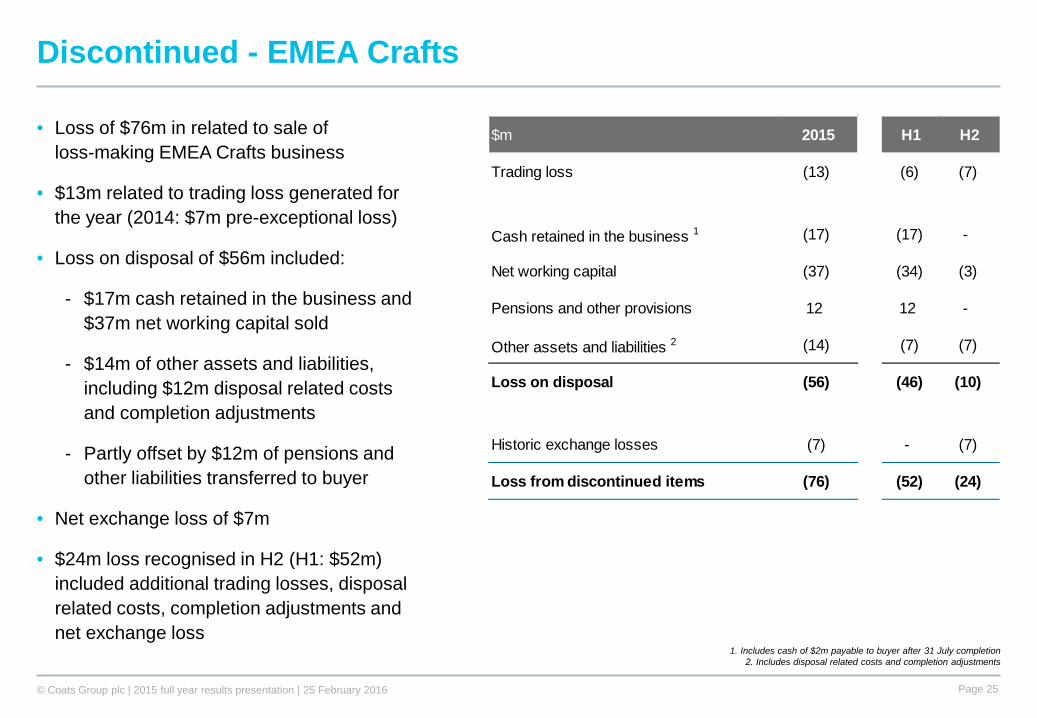
Discontinued - EMEA Crafts
• Loss of $76m in related to sale of loss-making EMEA Crafts business
• $13m related to trading loss generated for the year (2014: $7m pre-exceptional loss)
• Loss on disposal of $56m included:
- $17m cash retained in the business and $37m net working capital sold
- $14m of other assets and liabilities, including $12m disposal related costs and completion adjustments
- Partly offset by $12m of pensions and other liabilities transferred to buyer
• Net exchange loss of $7m
• $24m loss recognised in H2 (H1: $52m) included additional trading losses, disposal related costs, completion adjustments and net exchange loss
1. Includes cash of $2m payable to buyer after 31 July completion2. Includes disposal related costs and completion adjustments
$m 2015 H1 H2
Trading loss (13) (6) (7)
Cash retained in the business 1 (17) (17) -
Net working capital (37) (34) (3)
Pensions and other provisions 12 12 -
Other assets and liabilities 2 (14) (7) (7)
Loss on disposal (56) (46) (10)
Historic exchange losses (7) - (7)
Loss from discontinued items (76) (52) (24)
© Coats Group plc | 2015 full year results presentation | 25 February 2016 Page 26
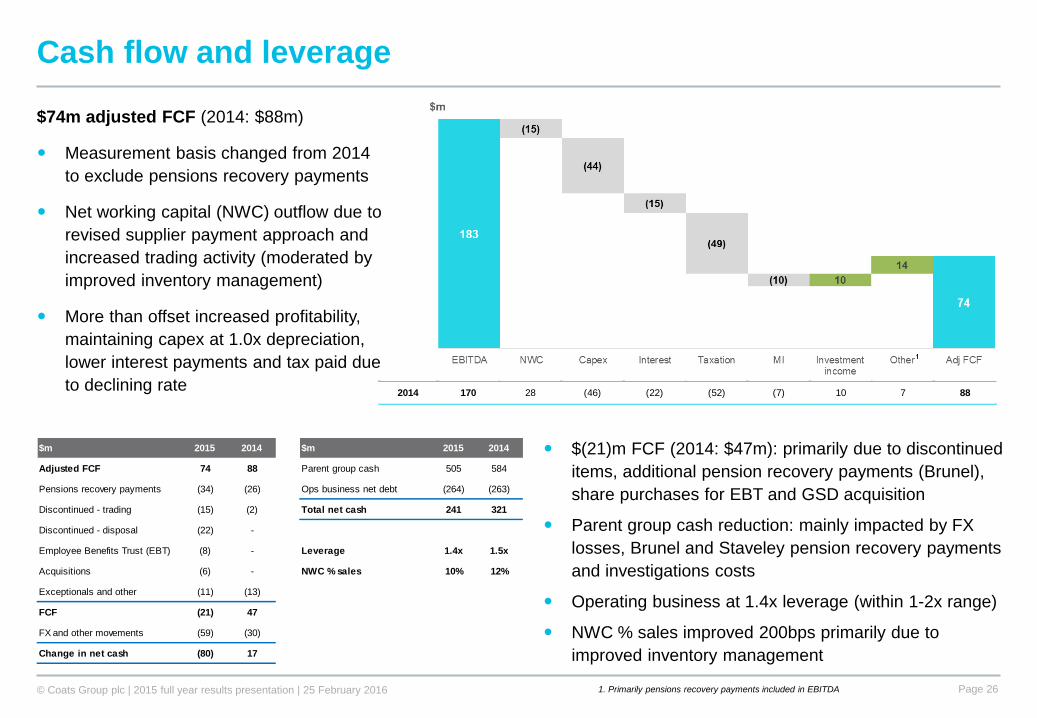
Cash flow and leverage
$74m adjusted FCF (2014: $88m)
Measurement basis changed from 2014 to exclude pensions recovery payments
Net working capital (NWC) outflow due to revised supplier payment approach and increased trading activity (moderated by improved inventory management)
More than offset increased profitability, maintaining capex at 1.0x depreciation, lower interest payments and tax paid due to declining rate
1. Primarily pensions recovery payments included in EBITDA
$(21)m FCF (2014: $47m): primarily due to discontinued items, additional pension recovery payments (Brunel), share purchases for EBT and GSD acquisition
Parent group cash reduction: mainly impacted by FX losses, Brunel and Staveley pension recovery payments and investigations costs
Operating business at 1.4x leverage (within 1-2x range)
NWC % sales improved 200bps primarily due to improved inventory management
2014 170 28 (46) (22) (52) (7) 10 7 88
$m 2015 2014 $m 2015 2014
Adjusted FCF 74 88 Parent group cash 505 584
Pensions recovery payments (34) (26) Ops business net debt (264) (263)
Discontinued - trading (15) (2) Total net cash 241 321
Discontinued - disposal (22) -
Employee Benefits Trust (EBT) (8) - Leverage 1.4x 1.5x
Acquisitions (6) - NWC % sales 10% 12%
Exceptionals and other (11) (13)
FCF (21) 47
FX and other movements (59) (30)
Change in net cash (80) 17
Outlook and summary
© Coats Group plc | 2015 full year results presentation | 25 February 2016 Page 28
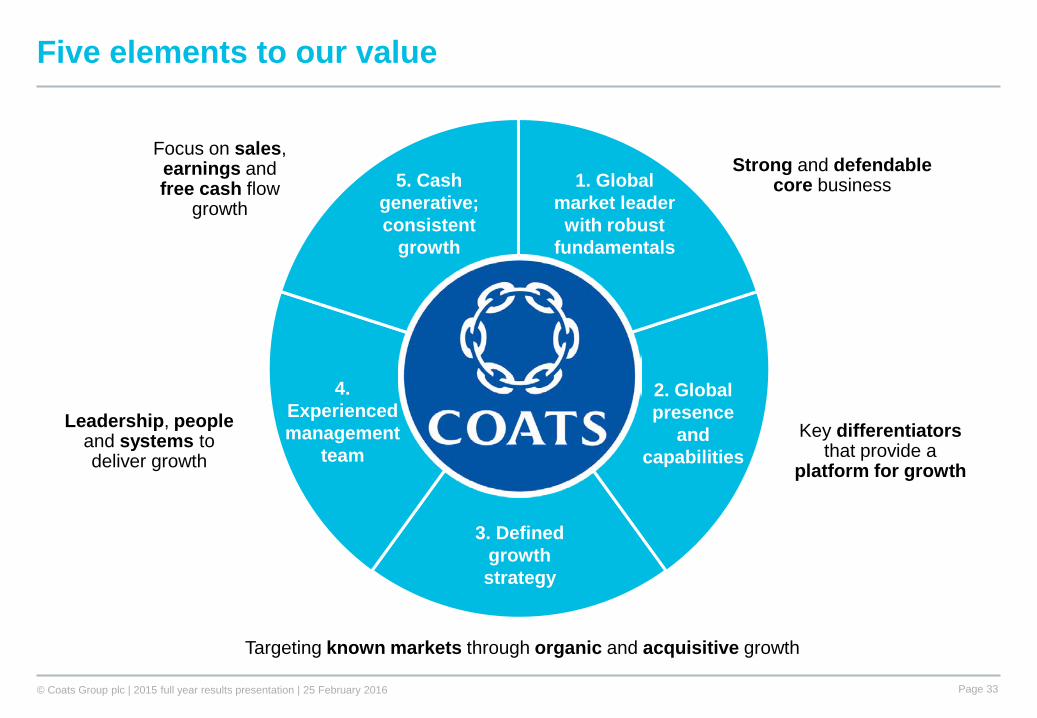
Global market leader with robust fundamentals; strong and defendable core
Defined growth strategy and updated market goals
Supported by key differentiators - world class asset base, product and service (including digital) innovation, highly engaged workforce and corporate responsibility
Delivering EPS growth and generating cash to reinvest in business
Healthy acquisition pipeline to complement organic sales growth and funded internally
Normalising as a UK plc - move to single UK listing in 2016
Initiated settlement discussions on UK pensions investigations
Well positioned for continued sales, earnings and free cash flow growth
Summary
© Coats Group plc | 2015 full year results presentation | 25 February 2016 Page 29
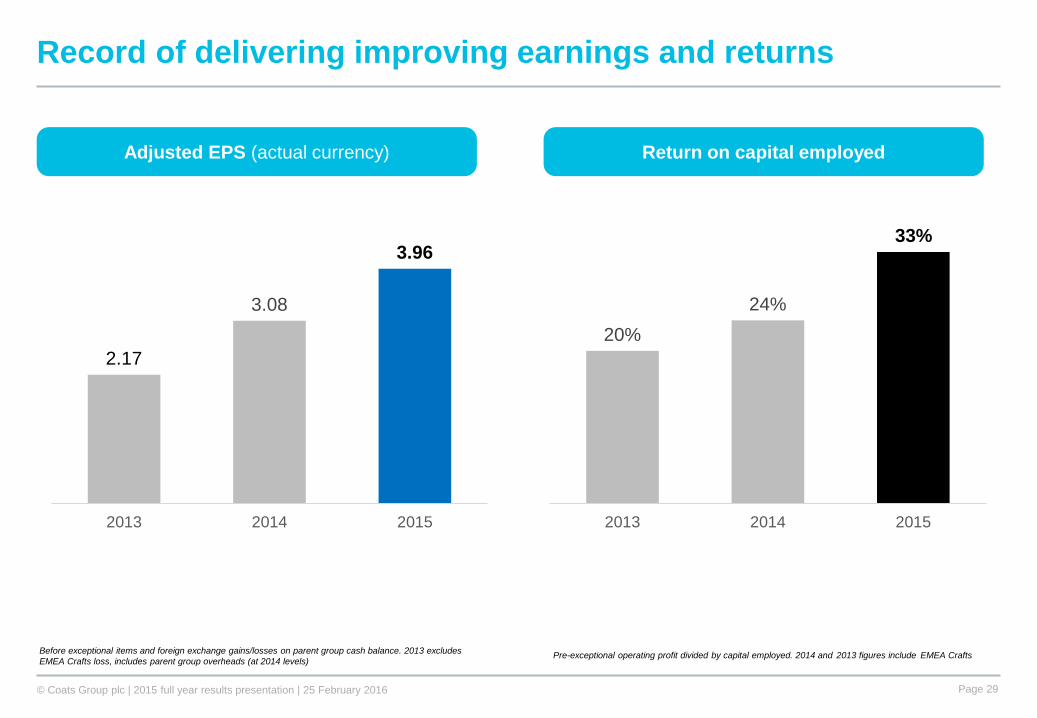
Record of delivering improving earnings and returns
20%24%
33%
2013 2014 2015
Pre-exceptional operating profit divided by capital employed. 2014 and 2013 figures include EMEA Crafts
Adjusted EPS (actual currency) Return on capital employed
2.17
3.08
3.96
2013 2014 2015
Before exceptional items and foreign exchange gains/losses on parent group cash balance. 2013 excludes EMEA Crafts loss, includes parent group overheads (at 2014 levels)
© Coats Group plc | 2015 full year results presentation | 25 February 2016 Page 30
2016 outlook
• Strong performance in 2015 supported by market share gains, product innovation, lower input prices, productivity and procurement gains
• Put the business on a solid footing for the year ahead
• Will realise incremental savings from overhead reduction programme
• However to grow we need to reinvest to support our growth ambitions
• Furthermore against backdrop of mixed economic conditions (uncertainties in US and Western European consumer demand, demand from oil and gas industry and potential for US dollar to further strengthen) group performance could be adversely impacted
• On balance, Management expects to deliver modest y-o-y growth in Group pre-exceptional operating profit, with improvements to non-operating items further benefiting adjusted EPS
Appendices
© Coats Group plc | 2015 full year results presentation | 25 February 2016 Page 32
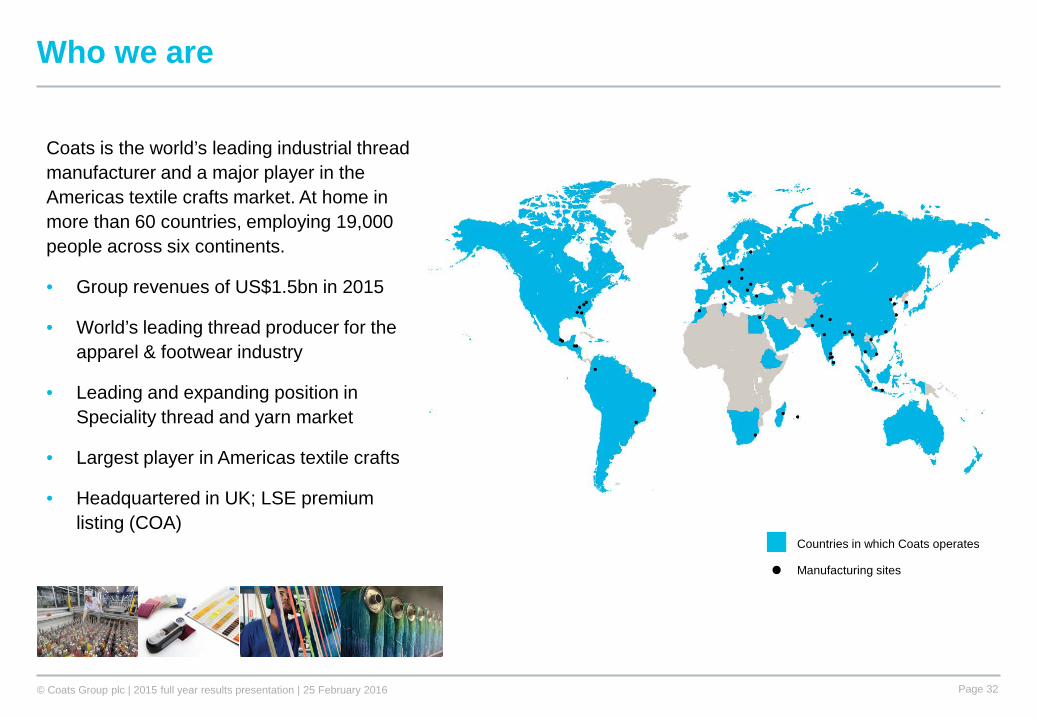
Coats is the world’s leading industrial thread manufacturer and a major player in the Americas textile crafts market. At home in more than 60 countries, employing 19,000 people across six continents.
• Group revenues of US$1.5bn in 2015
• World’s leading thread producer for the apparel & footwear industry
• Leading and expanding position in Speciality thread and yarn market
• Largest player in Americas textile crafts
• Headquartered in UK; LSE premium listing (COA)
Countries in which Coats operates
Manufacturing sites
Who we are
© Coats Group plc | 2015 full year results presentation | 25 February 2016 Page 33
Key differentiatorsthat provide a
platform for growth
Strong and defendable core business
Leadership, peopleand systems to deliver growth
Focus on sales, earnings and free cash flow
growth
Targeting known markets through organic and acquisitive growth
Five elements to our value
3. Defined growth strategy
4. Experienced management
team
1. Global market leader
with robust fundamentals
5. Cash generative; consistent
growth
2. Global presence
and capabilities
© Coats Group plc | 2015 full year results presentation | 25 February 2016 Page 34
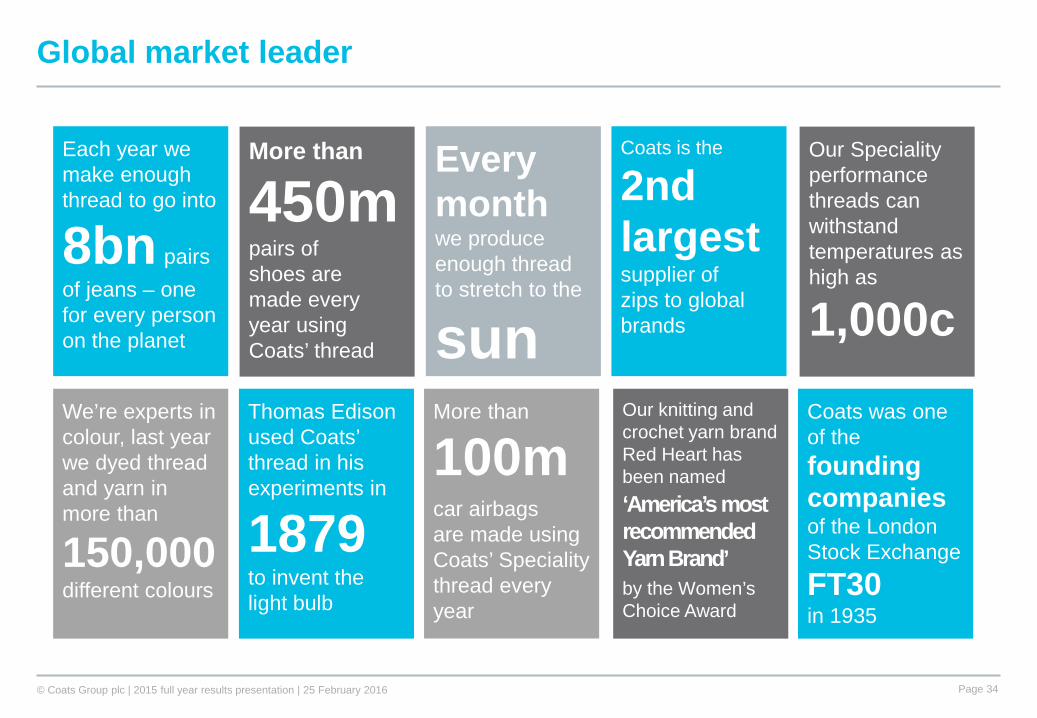
Global market leader
Each year we make enough thread to go into
8bn pairs of jeans – one for every person on the planet
We’re experts in colour, last year we dyed thread and yarn in more than
150,000 different colours
Coats is the
2nd largest supplier of zips to global brands
Thomas Edison used Coats’ thread in his experiments in
1879 to invent the light bulb
More than
100mcar airbags are made using Coats’ Speciality thread every year
Coats was one of the founding companies of the London Stock Exchange
FT30in 1935
More than
450mpairs of shoes are made every year using Coats’ thread
Every month we produce enough thread to stretch to the
sun
Our Speciality performance threads can withstand temperatures as high as
1,000cOur knitting and crochet yarn brandRed Heart has been named
by the Women’s Choice Award
‘America’s most recommended Yarn Brand’
© Coats Group plc | 2015 full year results presentation | 25 February 2016 Page 35
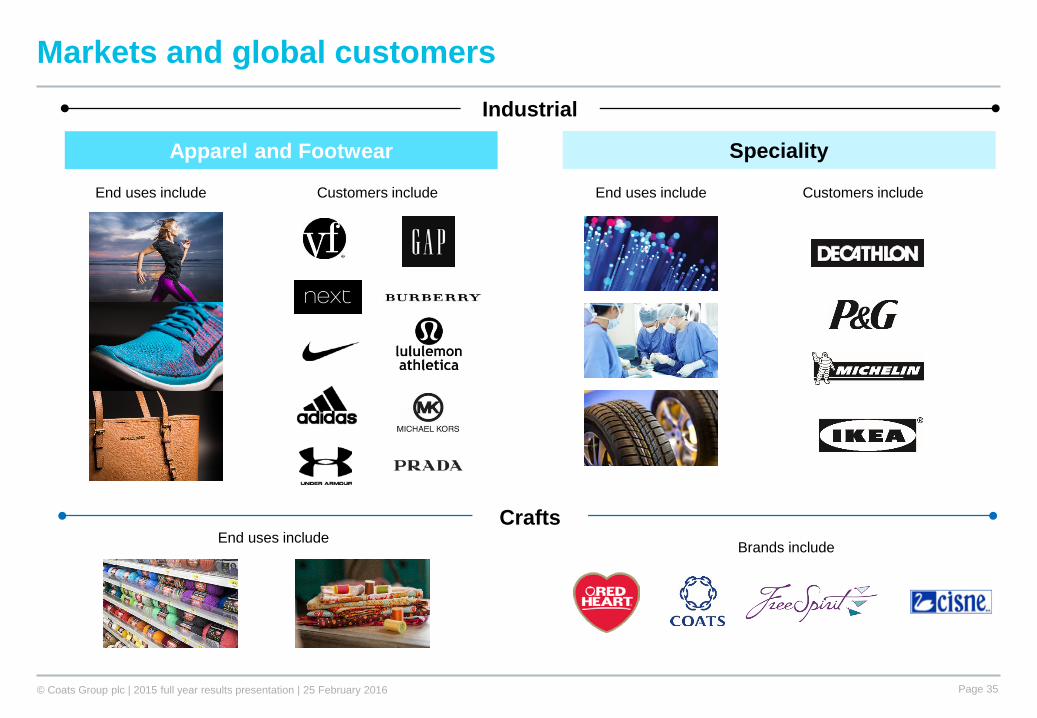
Markets and global customers
Apparel and Footwear Speciality
Customers includeEnd uses include Customers includeEnd uses include
Industrial
Brands includeEnd uses includeCrafts
© Coats Group plc | 2015 full year results presentation | 25 February 2016 Page 36
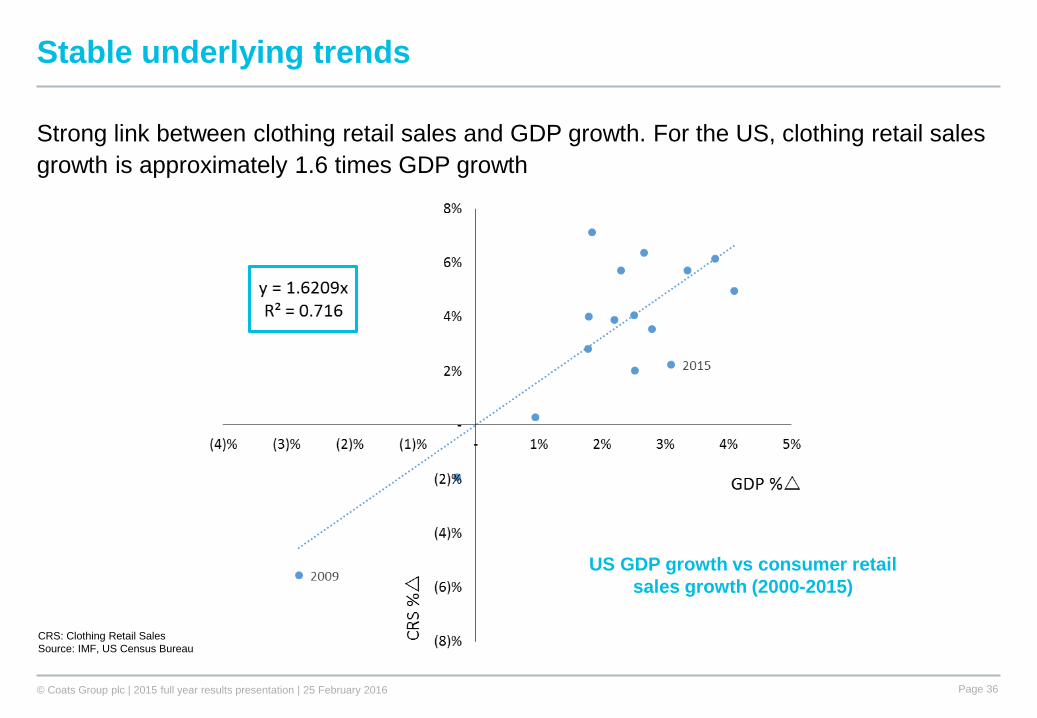
Strong link between clothing retail sales and GDP growth. For the US, clothing retail sales growth is approximately 1.6 times GDP growth
CRS: Clothing Retail SalesSource: IMF, US Census Bureau
US GDP growth vs consumer retail sales growth (2000-2015)
Stable underlying trends
© Coats Group plc | 2015 full year results presentation | 25 February 2016 Page 37
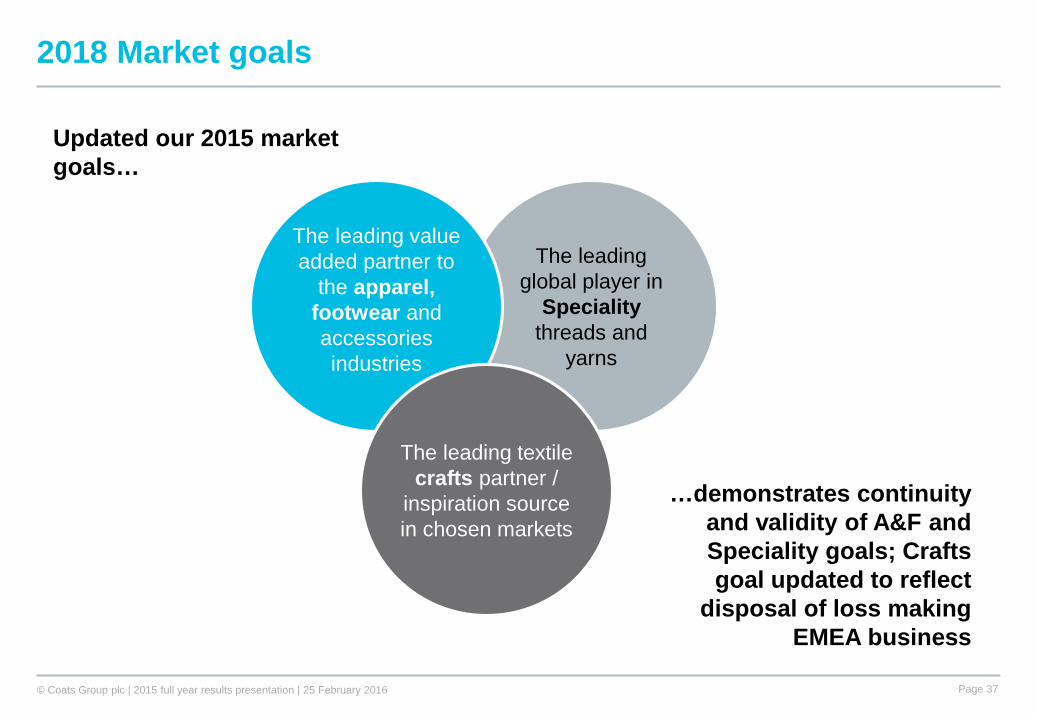
2018 Market goals
The leading global player in
Specialitythreads and
yarns
The leading value added partner to
the apparel, footwear andaccessoriesindustries
The leading textile crafts partner /
inspiration source in chosen markets
Updated our 2015 market goals…
…demonstrates continuity and validity of A&F and Speciality goals; Crafts goal updated to reflect
disposal of loss making EMEA business
© Coats Group plc | 2015 full year results presentation | 25 February 2016 Page 38
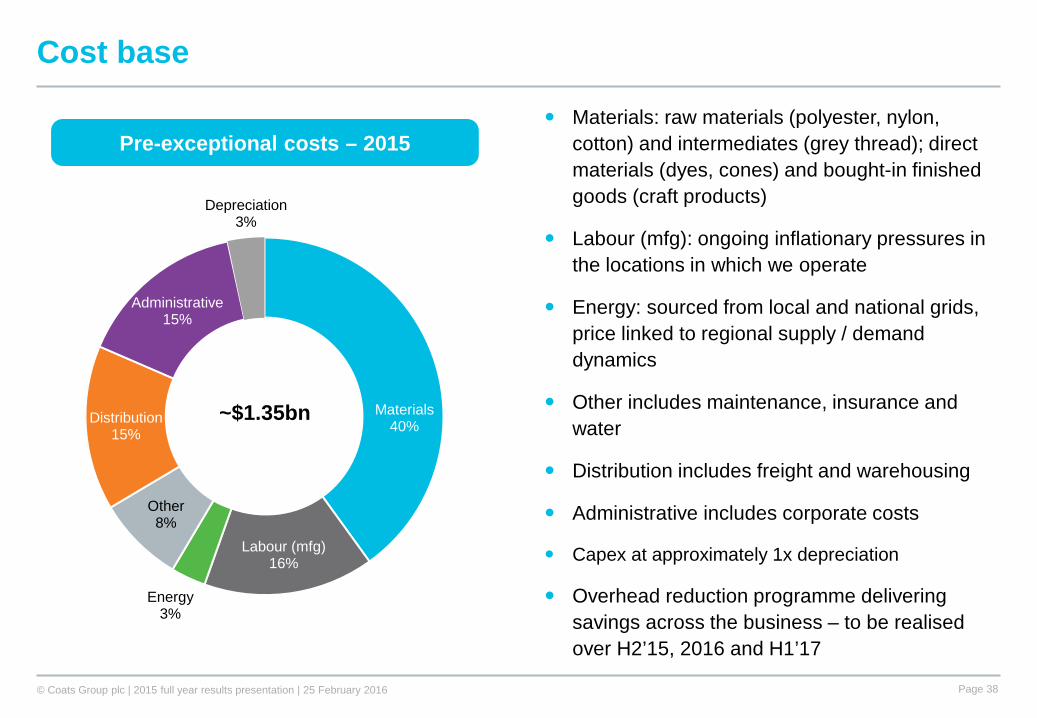
Materials: raw materials (polyester, nylon, cotton) and intermediates (grey thread); direct materials (dyes, cones) and bought-in finished goods (craft products)
Labour (mfg): ongoing inflationary pressures in the locations in which we operate
Energy: sourced from local and national grids, price linked to regional supply / demand dynamics
Other includes maintenance, insurance and water
Distribution includes freight and warehousing
Administrative includes corporate costs
Capex at approximately 1x depreciation
Overhead reduction programme delivering savings across the business – to be realised over H2’15, 2016 and H1’17
Cost base
Materials40%
Labour (mfg)16%
Energy3%
Other8%
Distribution15%
Administrative15%
Depreciation3%
Pre-exceptional costs – 2015
~$1.35bn
© Coats Group plc | 2015 full year results presentation | 25 February 2016 Page 39
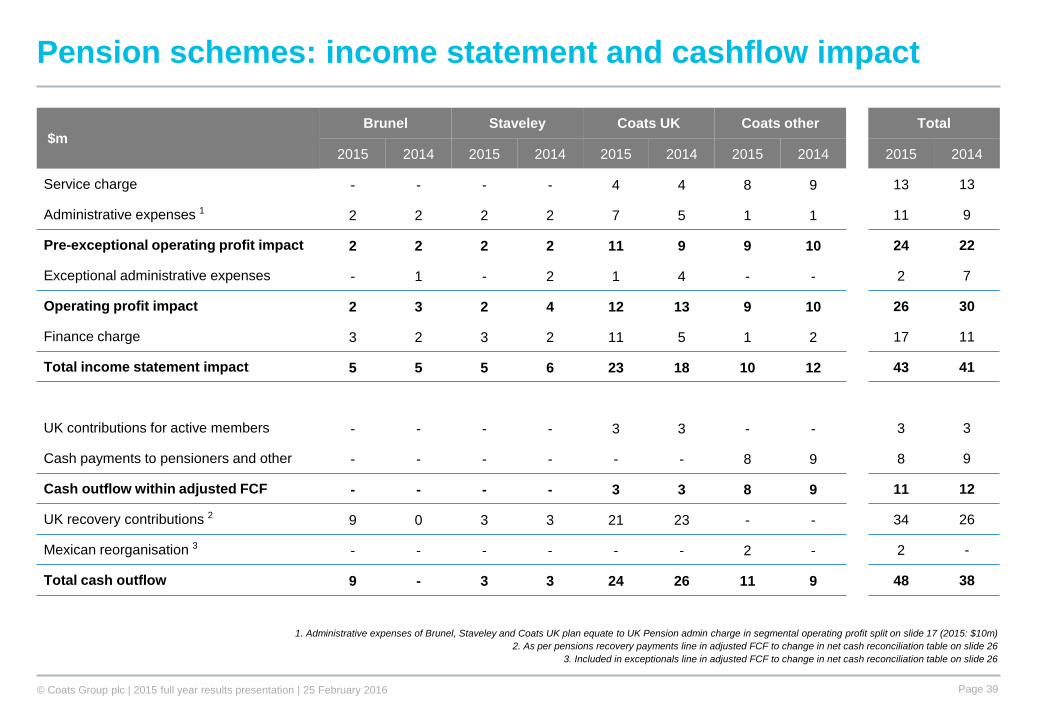
Pension schemes: income statement and cashflow impact
$mBrunel Staveley Coats UK Coats other Total
2015 2014 2015 2014 2015 2014 2015 2014 2015 2014
Service charge - - - - 4 4 8 9 13 13
Administrative expenses 1 2 2 2 2 7 5 1 1 11 9
Pre-exceptional operating profit impact 2 2 2 2 11 9 9 10 24 22
Exceptional administrative expenses - 1 - 2 1 4 - - 2 7
Operating profit impact 2 3 2 4 12 13 9 10 26 30
Finance charge 3 2 3 2 11 5 1 2 17 11
Total income statement impact 5 5 5 6 23 18 10 12 43 41
UK contributions for active members - - - - 3 3 - - 3 3
Cash payments to pensioners and other - - - - - - 8 9 8 9
Cash outflow within adjusted FCF - - - - 3 3 8 9 11 12
UK recovery contributions 2 9 0 3 3 21 23 - - 34 26
Mexican reorganisation 3 - - - - - - 2 - 2 -
Total cash outflow 9 - 3 3 24 26 11 9 48 38
1. Administrative expenses of Brunel, Staveley and Coats UK plan equate to UK Pension admin charge in segmental operating profit split on slide 17 (2015: $10m)2. As per pensions recovery payments line in adjusted FCF to change in net cash reconciliation table on slide 26
3. Included in exceptionals line in adjusted FCF to change in net cash reconciliation table on slide 26
© Coats Group plc | 2015 full year results presentation | 25 February 2016 Page 40
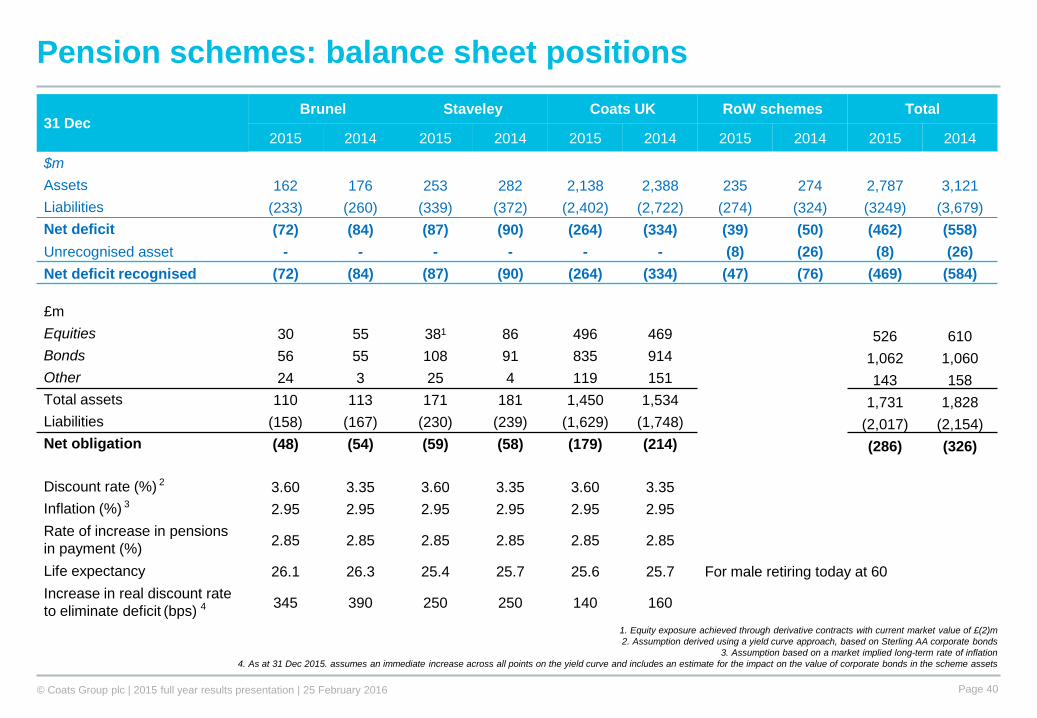
Pension schemes: balance sheet positions
1. Equity exposure achieved through derivative contracts with current market value of £(2)m2. Assumption derived using a yield curve approach, based on Sterling AA corporate bonds
3. Assumption based on a market implied long-term rate of inflation4. As at 31 Dec 2015. assumes an immediate increase across all points on the yield curve and includes an estimate for the impact on the value of corporate bonds in the scheme assets
31 DecBrunel Staveley Coats UK RoW schemes Total
2015 2014 2015 2014 2015 2014 2015 2014 2015 2014
$mAssets 162 176 253 282 2,138 2,388 235 274 2,787 3,121Liabilities (233) (260) (339) (372) (2,402) (2,722) (274) (324) (3249) (3,679)Net deficit (72) (84) (87) (90) (264) (334) (39) (50) (462) (558)Unrecognised asset - - - - - - (8) (26) (8) (26)Net deficit recognised (72) (84) (87) (90) (264) (334) (47) (76) (469) (584)
£mEquities 30 55 381 86 496 469 526 610Bonds 56 55 108 91 835 914 1,062 1,060Other 24 3 25 4 119 151 143 158Total assets 110 113 171 181 1,450 1,534 1,731 1,828Liabilities (158) (167) (230) (239) (1,629) (1,748) (2,017) (2,154)Net obligation (48) (54) (59) (58) (179) (214) (286) (326)
Discount rate (%) 2 3.60 3.35 3.60 3.35 3.60 3.35Inflation (%) 3 2.95 2.95 2.95 2.95 2.95 2.95Rate of increase in pensions in payment (%) 2.85 2.85 2.85 2.85 2.85 2.85
Life expectancy 26.1 26.3 25.4 25.7 25.6 25.7 For male retiring today at 60Increase in real discount rate to eliminate deficit (bps) 4 345 390 250 250 140 160

© Coats Group plc | 2015 full year results presentation | 25 February 2016 Page 41
For more information
Jaideep ThataiHead of Investor Relations+44 20 8210 [email protected]
Coats Group plcwww.coats.com