coal-fired power technologies: coal-fired power options · pdf filecoal-fired power...
TRANSCRIPT

October 2004
ECN-C--04-076
Coal-fired power technologies
Coal-fired power options on the brink of climate policies
P. Lako

Acknowledgement This study is part of the ECN project �Clean coal technologies�. In the framework of this pro-ject, an analysis has been made of coal-fired power options on the brink of climate policies. The study was carried out by ECN Policy Studies under ECN project number 7.7585. Abstract This study provides an overview of coal-fired power generation options. The deployment of coal power plants largely depends on their competitiveness compared to gas-fired power, nu-clear power, etc. There are roughly four types of coal-fired power plants. Probably, most coal-fired power plants to be built within the next decades will be either pulverised coal power plants based on the simple Rankine cycle (steam cycle), or Integrated Gasification Combined Cycle (IGCC) power plants. This study addresses the technological, economical, and environmental perspectives of pulverised coal and IGCC power plants. Attention is also paid to options for fur-ther reduction of SO2 and NOx emissions at pulverised coal power plants. Last but not least, the study covers the options of CO2 capture at (advanced) pulverised coal and IGCC plants and shows their resemblances and differences.
2 ECN-C--04-076

CONTENTS
LIST OF TABLES 4 LIST OF FIGURES 4 SUMMARY 5 1. INTRODUCTION 9 2. PULVERISED COAL POWER PLANT 13
2.1 Introduction 13 2.2 State-of-the-art of pulverised power plants 13 2.3 Advanced steam cycles 15
2.3.1 Introduction 15 2.3.2 Period 2000-2020 15 2.3.3 Energy, environment and economic parameters 2000-2050 17
3. IGCC POWER PLANT 19 3.1 Introduction 19 3.2 State-of-the-art 19 3.3 Advanced IGCCs 20
3.3.1 Introduction 20 3.3.2 Period 2000-2020 21 3.3.3 Energy, environment and economic parameters 2000-2050 21 3.3.4 Comparison between IGCC and pulverised coal 22
4. POTENTIAL FOR FURTHER DEVELOPMENT 24 4.1 Introduction 24 4.2 Beyond state-of-the-art SO2 emissions 24 4.3 Beyond state-of-the-art NOx (NO2) emissions 26 4.4 Advanced steam power plants with CO2 capture 27 4.5 IGCC power plants with CO2 capture 28 4.6 IGCC with CO2 capture compared to pulverised coal with CO2 capture 31
5. CONCLUSIONS 33 ANNEX A LIST OF ABBREVIATIONS 35 REFERENCES 36
ECN-C--04-076 3

LIST OF TABLES
Table 1.1 Different types of coal-fired power plants built around the world 11 Table 1.2 Classification of pulverised coal power plants according to UNIPEDE 11 Table 2.1 State-of-the-art of pulverised coal power plants, 1991-2002 14 Table 2.2 Materials, steam conditions, and efficiencies of pulverised coal power plants 14 Table 2.3 Efficiency, CO2, SO2, and NOx emissions and investment cost of PC power plant 17 Table 3.1 Parameters of IGCC based on hard coal or lignite & petroleum cokes (50/50%) 20 Table 3.2 Efficiency, CO2, SO2, and NOx emissions and investment cost of IGCC 21 Table 4.1 Consequences of more stringent SO2 reduction at Dutch pulverised coal plants 24 Table 4.2 Efficiency, CO2, SO2, and NOx emissions and investment cost of PC with SCR 26 Table 4.3 Efficiency, CO2 emission, and generation cost of coal-fired power plants 27 Table 4.4 Efficiency, CO2 etc. emissions and investment cost of PC with CO2 capture 28 Table 4.5 Efficiency, investment cost and O&M cost of IGCCs without/with CO2 capture 30 Table 4.6 Efficiency, CO2, etc. emissions and investment cost of IGCC with CO2 capture 31
LIST OF FIGURES
Figure 1.1 Ageing of installed generating capacity, based on power plants built 9 Figure 1.2 Growth cycles with two economic booms, based on power plant orders 10 Figure 1.3 Age of coal-fired power plants in the EU-15 (2002) 10 Figure 2.1 Efficiency improvements of pulverised coal power plants, 1975-2000 13 Figure 2.2 Efficiency improvements of pulverised coal power plants 14 Figure 2.3 Efficiency pulverised coal power plant as a function of steam temperature 16 Figure 3.1 Projection of generating efficiency of pulverised coal and IGCC power plants 22 Figure 3.2 Projected specific investment costs of pulverised coal and IGCC power plants 23 Figure 4.1 Specific investment cost of desulphurisation as a function of installed capacity 25 Figure 4.2 Investment cost of catalytic deNOx (SCR) as a function of installed capacity 26 Figure 4.3 Amine absorption process for CO2 recovery from flue gas 27 Figure 4.4 Scheme of IGCC with CO2 recovery from fuel gas 29 Figure 4.5 Specific investment cost and efficiency of state-of-the-art IGCC without and
with CO2 capture 29 Figure 4.6 Learning rate of CO2 capture technologies 30 Figure 4.7 Specific investment cost of pulverised coal and IGCC plants with CO2 capture 31
4 ECN-C--04-076

SUMMARY
Today, the world�s energy needs are largely met by oil, natural gas, and coal. On a global scale natural gas is taking over coal as the second most important fuel. Still, coal is and remains a very important fossil fuel, as it is the most abundant and widely spread fossil energy resource on earth, and coal-fired power stations currently account for 38% of power produced in the world. Whereas demand for new coal-fired power stations is relatively low in industrialised countries due to the recent economic downturn, economic growth patters and related �boom and bust� cy-cles for power plant orders in the �west� do not automatically apply to other world regions, e.g. China and India. For instance, in mid-2002 the installed capacity of coal-fired power plants in China amounted to 330 GW and coal-fired power supplies some 75% of electricity demand. Therefore, building new coal-fired power plants is an ongoing business in countries like China, India, etc. For countries like the US, that are also highly dependent on coal-fired power generat-ing, the resumption of orders for coal-fired power plants it is only a matter of time. However, the position of coal-fired power in general depends to a large extent on its competitiveness compared to gas-fired power, nuclear power, etc. Also, the age of the installed generating capac-ity is important. Although a lifetime of 30 years for a coal-fired power plant is not exceptional, 40 years is really long by technical and economic standards. In Europe, coal-fired power may be favoured in countries with a substantial coal-fired generat-ing capacity. Apart from large countries like Poland, Germany, and the UK, also some smaller EU-countries depend on coal-fired power to a considerable extent, viz. Denmark and the Neth-erlands. In these countries coal-fired power remains a serious contender for baseload power generation - in Germany, lignite-fired power plants are used for baseload. Although the rela-tively low and stable price of coal is one of the main considerations for power generating com-panies to build new coal-fired power plants, another factor is diminishment of supply con-straints. Both governments and power generators are aware of the risks of becoming too much dependent on a single energy source. This is the reason why coal-fired power remains important in the UK and the Netherlands. However, coal-fired power causes almost twice the amount of greenhouse gas emissions per kWh compared to power plants based on natural gas (combined cycle power plants). This is a serious disadvantage for coal-fired power, now that the Kyoto Protocol is in the stage of being ratified. Therefore, coal�s future in the global energy market, and particularly in the power generation market, is questioned. Alternatively, an adaptive strat-egy based on capture and storage of CO2 at (new-built) coal-fired power plants is a large chal-lenge from a technological, economical, and political point of view. Such a strategy could stretch the life cycle of coal-fired power as a main source of power on a global scale. Although in the short term, the market for conventional power plants - among which coal-fired power - is regarded as difficult, due to a slowdown of economic growth rates, there is little doubt that the demand a lot of countries in the world will need new coal-fired power plants in the foreseeable future. As an input for discussions on new coal fired power plants, this report gives an overview of the main options for electricity generation from coal. There are (at least) four options for coal-fired power: Circulating or Pressurised Fluidised Bed Combustion (CFBC or PFBC), or pulverised coal (PC) based on the simple Rankine cycle (steam cycle) or Integrated Gasification Combined Cycle (IGCC) power plants, based on a combined cycle. CFBCs are mainly used for Combined Heat and Power (CHP) based on a vari-ety of fuels like coal, peat, biomass, etc. A PFBC is only competitive based on its fuel flexibil-ity. The higher generating efficiency of a PFBC compared to a CFBC plant does not seem to offset the higher complexity and higher specific investment cost. The main options for the next decades seem to be the pulverised coal power plant and the IGCC power plant. Therefore, this
ECN-C--04-076 5

study focuses on these two options, and the extent to which they can contribute to climate poli-cies. The state-of-the-art pulverised coal power plant has a generating efficiency of 46% for hard coal and 45% for lignite. In the 1990s, highly efficient pulverised coal power plants have been built in Denmark, Germany, and the Netherlands. Advanced steam cycles have applications in both simple Rankine cycle power plants and as bottoming cycles in complex �Vision 21� plants (R&D programme of the US). There is a strong relationship between steam temperature and the generating efficiency. Higher steam pressures and temperatures require improvements in high-strength alloys. Beyond 2010, advanced alloys for pipes, boiler, and headers may become avail-able. In 2010, the generating efficiency of a pulverised coal power plant may be 48-50%. De-velopment of new alloys for steam boilers and steam turbines could push the generating effi-ciency to 50-53% in 2020, and further development could offer 51-55% efficiency in 2050. There is a reasonable likelihood of only moderate additional specific capital requirements for advanced (ultra-supercritical) pulverised coal power plants over current state-of-the-art. As the pulverised coal power technology is rather mature, the specific investment cost may come down only steadily to � 1,100/kW1 in 2020 and � 1,050/kW in 2050 (currently ~ � 1,200/kW). Pulver-ised coal does not have the same potential for cost reduction as the IGCC. IGCC plants can achieve up to 45% efficiency, greater than 99% SO2 removal and very low NOx emissions. The SO2 emission of a pulverised coal (PC) power plant is generally one order of magnitude higher than that of an IGCC, as the desulphurisation grade of a PC power plant is commonly 90%, compared to 99% for an IGCC. If more stringent SO2 emission limits are im-posed, the investment cost of a pulverised coal power plant goes up. IGCCs built in 2010 may have a generating efficiency of 50-52%. Continued R&D will make gas turbines and combined cycles more and more efficient. Also, high-temperature desulphuri-sation processes may be available in 2020. Therefore, the generating efficiency of an IGCC may rise to 53-56% in 2020. If the conditions for the development of highly efficient IGCCs are there, an IGCC may be 3 percent points more efficient than the most efficient pulverised coal power plant in 2020, and possibly 5 percent points in 2050. This is a substantial difference, con-sidering the proportionally lower CO2 emission from IGCCs. The specific investment cost of IGCC power plants built in the last decade hovered around � 2,000/kW. A cost reduction of 25% in 2010 seems to be achievable. Therefore, � 1,500 is a reasonable cost estimate for an IGCC in 2010. A decade later, the specific investment cost may have come down to � 1,400/kW, and the investment cost may be as low as � 1,250/kW in 2050. According to the projections in this study the gap between the investment costs of pulverised coal plants and IGCC plants may be narrowed to 25% in 2020, and 20% in 2050. Such a margin is not an impediment to commercialisation of IGCCs: the higher efficiency of an IGCC results in lower fuel cost, and lower CO2 emission per kWh - very important for climate policies. New pulverised coal power plants based on high-sulphur coal may apply a combined desul-phurisation/deNOx process, e.g. the SNOX Process (Topsøe A/S). The SNOX process may in-crease the overall specific investment cost of a pulverized coal power plant by another � 50/kW. The total investment cost of conventional �wet gypsum� desulphurisation with catalytic deNOx (SCR) is estimated at � 190/kWe - � 130/kW for desulphurisation and � 60/kW for SCR. R&D spending on separation of CO2 from power plants is growing strongly. The main chal-lenge of CO2 capture and storage is the high cost of technologies using current state-of-the-art. Separation and compression of CO2 are the most important cost factors. For CO2 capture at an
1 The currency used in this study is � of the year 2004.
6 ECN-C--04-076

IGCC, the higher pressure and higher CO2 concentration is very favourable. This enables the application of physical instead of chemical absorption technologies. In 2010, the specific investment cost of IGCC with CO2 capture is estimated at � 1,850/kW, which is in the range of cost estimates from the sources referenced (Figure 4.7). In 2050, the in-vestment cost could be 20% lower, viz. � 1,475/kW - quite comparable with the cost figure for a pulverised coal (PC) plant with CO2 capture (� 1,500/kW). However, the generating efficiency of an IGCC with CO2 capture may be boosted to 46-51% in 2050, compared to 42-46% for a PC coal plant. Therefore, IGCC seems to be a superior technology if CO2 capture has to be applied.
ECN-C--04-076 7

8 ECN-C--04-076

1. INTRODUCTION
Coal is the most abundant and widely spread fossil energy resource worldwide and coal-fired power stations currently account for 38% of power produced in the world (Henderson, 2003). The development of coal-fired power generation in the global market depends to a large extent on the competitive position compared to gas-fired power, nuclear power, etc. Another important factor is the age of the installed generating capacity. Figure 1.1 shows that the age of many coal-fired power plants in the world (conventional steam turbine, ST) becomes critical, in the sense that a large number of plants will reach its economic lifetime within a decade (Otter, 2002).
Installed Capacity is Aging Rapidly
0
20
40
60
80
100
120
2 7 12 17 22 27 32 37 42 47
HydroNuclearConventional STGas Turbine
Age ofPower Plant
Source: UDI
20002005
~ 30% More than30 years old in 2005
~ 18% More than30 years old today
GW
88 978 1968 1958 Year ofCommissioning
1998 19 1 195819681978 19881998
Figure 1.1 Ageing of installed generating capacity, based on power plants built Source: Otter, 2002. Coal-fired power plants are among the oldest power plants in operation in the world (at least on average). Although a lifetime of 30 years for a coal-fired power plant is not exceptional, 40 years is really long by technical and economic standards. Therefore, it may be taken for granted that by 2005 some 20 GW of coal-fired power plant capacity will have to be replaced on an an-nual base. Part of this demand will be met by new coal-fired capacity. After 2005, the demand for replacement of coal-fired capacity (conventional ST) will even grow to 40 GW/a. The demand for new power plants - some of which based on (hard) coal - depends on the stage of the economic cycle (downturn, stable, upturn). Currently, there seems to be a downturn in economic activity in most of the industrialised world. However, this period of slowdown of economic growth and slowdown of growth of electricity demand will not last forever. There-fore, sooner or later the demand for new power plant capacity - largely for replacement - will take up. In the short term, the market for conventional power plants - among which coal-fired power - is regarded as difficult (Otter, 2002), due to a slowdown of economic growth rates in industrialised countries. A survey by Merril Lynch of more than 57 companies in the US generation industry estimates that just 10,980 MW will be added to the grid in 2004 (IPG, 2003a). Also, the margin between the installed capacity and the maximum demand for electricity may be ample. Overca-pacity has not been unusual in the late 1990s when the capacity build-up (mainly gas-fired power) in the US and Europe was strong (Figure 1.2).
ECN-C--04-076 9

Growth Cycles with 2 Major Booms
020406080
100120140160180200220
51 56 61 66 71 76 81 86 91 96 01Order Year
15 ye
ars
15 ye
ars
10 yearsNAM
LAM
ChinaAsia
MEAEurope
« US gas bubble » At Risk ofCancellation
Figure 1.2 Growth cycles with two economic booms, based on power plant orders Note: NAM = North America; LAM = Latin America; MEA = Middle East & Africa. Source: Otter, 2002. Although cancellation of gas-fired capacity may have brought some relief, the demand for power plants in the EU and the US is somewhat depressed. Based on the growth cycles in the past, an upturn in demand for power plants may be expected around 2010. Figure 1.3 shows the age distribution of coal-fired power plants in the EU-15 (Stamatelopoulos et al., 2002).
0
2
4
6
8
10
12
14
16
18
20
22
24
0-5 5-10 10-15 15-20 20-25 25-30 30-35 35-40 >40Years
Perc
enta
ge o
f tot
al c
apac
ity
of E
U c
oal-f
ired
pow
er p
lant
s
0
20
40
60
80
100
120
140
160
180
200N
o of
uni
tsPerc entage of c apac ity (%)Number of units
37 % 63 %
Figure 1.3 Age of coal-fired power plants in the EU-15 (2002) Source: Stamatelopoulos et al., 2002. The economic growth patterns and related �boom and bust� cycles for power plant orders do not automatically apply to e.g. China and India. These countries have ambitious plans for new power plants, mostly hydropower. Whether power demand in China and India will be met by coal-fired power, hydropower, or nuclear power, depends inter alia on energy policies. In mid-2002, the installed capacity of coal-fired power plants in China amounted to 330 GW and coal-fired power supplies some 75% of electricity demand2 (Logan, 2002). Similar considerations apply to Latin America, and the Middle East and Africa.
2 These power plants often have a low efficiency and pollution control technology is often absent or minimal.
10 ECN-C--04-076

Table 1.1 shows four types of coal-fired power plants (Grammelis et al., 2002; Henderson, 2003). The power plant type that is widely applied is the pulverised coal-fired power plant, gen-erally including flue gas desulphurisation. Also Circulating Fluidised Bed Combustion (CFBC) power plants have been built on a commercial basis. They are mainly used for Combined Heat and Power (CHP) based on a variety of fuels like coal, peat, biomass, etc. Their main advan-tages are fuel flexibility, relatively low NOx emission, and low specific investment cost. How-ever, the modest generating efficiency and limited unit size are disadvantageous.
Table 1.1 Different types of coal-fired power plants built around the world Pulverised coal-fired
power plant a Circulating
Fluidised Bed Combustion a
(CFBC)
Pressurised Fluidised Bed Combustion a
(PFBC)
Integrated Gasification
Combined Cycle (IGCC)
General characteristics Status Commercial Commercial Demonstrated Demonstrated Installed worldwide ~ 1,000 GW ~ 3 GW ~ 1 GW ~ 1 GW Complexity Medium Low Medium High Usage Base/medium load Base/medium load Base/medium load Base load Fuel range All coals All coals, residuals,
biomass All coals All coals, residuals,
biomass Fuel flexibility Low Very high High Medium Operational flexibility Medium High Medium Low
Technical parameters Unit size (2000) 400-1,000 MW ≤460 MW ≤360 MW ≤318 MW Max. GT b applied - - ~ 140 MW 198 MW Max. efficiency 2000 44% 39% 41% 45% Max. efficiency 2010 48-50% 43% 44% 50-52% Max. efficiency 2020 50-53% 48% 50% 54-56%
Environmental parameters Desulphurisation 90% 90% 90% 99% SO2 emission (2000) 0.6 kg/MWh 0.66 kg/MWh 0.66 kg/MWh 0.06 kg/MWh NOx emission (2000) 1.2 kg/MWh 0.8 kg/MWh 0.8 kg/MWh 0.4 kg/MWh CO2 emission (2000) 760 kg/MWh 860 kg/MWh 820 kg/MWh 740 kg/MWh
Financial parameters Investment cost c (2000) � 1,200/kW � 1,000/kW � 1,500/kW � 1,700/kW
a Including flue gas desulphurisation or desulphurisation by dolomite addition (CFBC, PFBC). b GT = Gas Turbine. c Investment costs are indicative; pulverised coal and IGCC are elaborated in Chapter 2 and 3, respectively. Sources: Grammelis et al., 2002; Henderson, 2003, COORETEC, 2003. The largest �supercritical� CFBC plant planned is the 460 MW plant at Lagisza in Poland (IPG, 2003b). This will have a net generating efficiency of 43%. CFBC may be the favoured power generation technology if low-grade fuels like lignite, peat, or wood residues are available. Table 1.2 shows a classification of pulverised coal power (Henderson, 2003; Smeers et al., 2001).
Table 1.2 Classification of pulverised coal power plants according to UNIPEDE Category Unit Subcritical Supercritical Advanced
Supercritical Ultra Supercritical
(USC)
Year <1990 1990 1995-2000 2000- Live steam pressure [MPa] 16.5 ≥22.1 27.5-30 ≥30 MPa Live steam temperature [ºC] 540 540-560 560-600 ≥600 Reheat steam temperature [ºC] - a 560 580 ≥600 Single reheat no yes yes no Double reheat no no no yes Generating efficiency [%] ~38 ~41 ~44 46+ a No reheat. Sources: Henderson, 2003; Smeers et al., 2001.
ECN-C--04-076 11

The choice of steam pressure determines whether the boiler is subcritical or supercritical. The latter appertains to pressures above 22.1 MPa, when vapour and liquid are not distinguishable and the water exists as a supercritical fluid. Supercritical pulverised coal power plants retain many of the features of subcritical systems. However, a once-through boiler design is essential, since there is no distinction between liquid and vapour for a supercritical fluid. Also, double re-heat may be used to take full efficiency advantage of the high main steam conditions although capital cost increases and this may be justifiable only where low condenser pressures are usable at cold seawater sites. This is why double reheat at Ultra Supercritical (USC, ≥30 MPa) coal power plants has been applied at plants with seawater cooling in Denmark (Henderson, 2003). The third option is Pressurised Fluidised Bed Combustion (PFBC), a number of which have been built around the world with capacities of approximately 100-360 MW. A PFBC includes a gas turbine in which the hot, cleaned, gas from the pressurised fluidised bed combustor is ex-panded. Commercialisation of the PFBC appears to be difficult because of lack of demand from the market (Henderson, 2003). The generating efficiency is higher than that of an atmospheric CFBC, but a PFBC is more complex. Also, the maximum unit size is small compared to that of a pulverised coal power plant. A PFBC is only competitive based on its fuel flexibility. The higher generating efficiency of a PFBC compared to a CFBC plant does not seem to offset the higher complexity and higher specific investment cost. The mixture of the by-products slag, gypsum, and (excess) dolomite precludes reuse as a building material. The fourth option is Integrated Gasification Combined Cycle (IGCC). A number of IGCCs has built around the world. The main advantages are its (very) high efficiency, demonstrated very low emissions of SO2 and NOx, and the potential for CO2 capture. The main disadvantages are high complexity, low operational flexibility, and relatively high specific investment cost. IGCC power plants have to be designed for a specific type of coal or solid fuel(s) in order to warrant a high reliability. There is significant potential for cost reduction. In the longer term, the relatively high complexity of this type of power plant does not preclude reliable and commercial IGCCs. Probably, most coal-fired power plants to be built within the next decades will be either: • Pulverised coal power plants based on the simple Rankine cycle (steam cycle) or • Integrated Gasification Combined Cycle (IGCC) power plants, based on a combined cycle -
an open gas turbine cycle as the topping cycle and a steam cycle as the bottoming cycle. The IGCC, which has been demonstrated in the US and in Europe, is based on the same type of cycle as the gas-fired combined cycle that is widely applied.
The content of this study is as follows. In Chapter 2, the focus is on the pulverised coal power plant, viz. the state-of-the-art, the potential of advanced cycles, and (future) parameters with re-gard to efficiency, environmental performance, and economics. The currency used in this study is � of the year 2004. Based on a similar format, Chapter 3 addresses the IGCC, viz. the state-of-the-art, the potential of advanced IGCCs, and (future) parameters with regard to efficiency, en-vironmental performance, and economics. In Chapter 4, the potential for further development of both pulverised coal and IGCC power plants is explored with regard to lower SO2 and NOx emissions. Also, CO2 capture and storage at pulverised coal and IGCC plants is addressed. Chapter 5 presents a number of conclusions.
12 ECN-C--04-076

2. PULVERISED COAL POWER PLANT
2.1 Introduction The state-of-the-art of the pulverised coal power plant is already quite advanced. In case of hard coal, the maximum generating efficiency rose from 38% to 46% during the last 30 years, and for lignite from 35% to 45%. Still, there is scope for higher efficiencies, in particular through higher steam pressures and temperatures. Paragraph 2.2 addresses the state-of-the-art of pulverised coal power plants (hard coal). In Paragraph 2.3, the focus is on more advanced steam power plants. The potential of CO2 separation at advanced steam power plants is addressed in Chapter 4, just like the potential of catalytic de-NOx and the option of co-combustion of biomass in pulverised coal power plants.
2.2 State-of-the-art of pulverised power plants Pulverised coal power plants based on the simple Rankine cycle (steam cycle) - as opposed to the combined cycle in case of natural gas (Chapter 3) - are widely applied. Figure 2.1 shows the efficiency of pulverised coal power plants witnessed during the last three decades (Otter, 2002).
35
40
45
50
55
1970 1980 1990 2000 2010
η net
Ultra super critical Double RH STNordjylland DK 400 MW
USC STAvedoere 2 DK 400 MW
Supercritical BoilersWaigaoqiao CN 900 MW
Vestkraft DK 400 MW
Yonghung SK 800 MW
Mai Liao TW 600 MW
Houshi CN 600 MW
Niederaussem D 1000 MW
Florina GE 330 MW
EC AD700
&
US USC Consortium
Supercritical Steam TurbinesShidogkou CN 600 MW
Hemweg 8 NL 630 MW
Meri Pori FN 590 MW
Staudinger 5 D 509 MW
Rostock 1 D 509 MW
Amer 9 NL 600 MW
Esbjerg 3 DK 415 MW
Lippendorf D 930 MW
Schwarze Pumpe D 800 MW35
40
45
50
55
1970 1980 1990 2000 2010
η net
Ultra super critical Double RH STNordjylland DK 400 MW
USC STAvedoere 2 DK 400 MW
Supercritical BoilersWaigaoqiao CN 900 MW
Vestkraft DK 400 MW
Yonghung SK 800 MW
Mai Liao TW 600 MW
Houshi CN 600 MW
Niederaussem D 1000 MW
Florina GE 330 MW
EC AD700
&
US USC Consortium
Supercritical Steam TurbinesShidogkou CN 600 MW
Hemweg 8 NL 630 MW
Meri Pori FN 590 MW
Staudinger 5 D 509 MW
Rostock 1 D 509 MW
Amer 9 NL 600 MW
Esbjerg 3 DK 415 MW
Lippendorf D 930 MW
Schwarze Pumpe D 800 MW
Figure 2.1 Efficiency improvements of pulverised coal power plants, 1975-2000 Source: Otter, 2002. Figure 2.1 shows that in the 1990s highly efficient pulverised coal power plants have been built in Denmark, Germany, and the Netherlands. The most efficient coal power plants, dating from 1998-2000 and built in Denmark, have generating efficiencies of 46%. Table 2.1 shows the rela-tion between higher steam temperatures and efficiency of pulverised coal plants (Henderson, 2003; Perrin Quarles Associates, 2001; Meier, 2002; Smeers et al., 2001).
ECN-C--04-076 13

Table 2.1 State-of-the-art of pulverised coal power plants, 1991-2002 Plant Commissioned Capacity Steam temperature a Net efficiency
[year] [MW] [ºC] [%] Studsrup 3&4 (DK) 1984/1985 2x350 540/540 42.0 Avedøreværket 1 (DK) 1990 250 545/545 42.4 Fynsværket 7 (DK) 1991 385 540/540 43.5 Esbjergværket 3 (DK) 1992 385 560/560 45.0 Staudinger 5 (D) 1992 500 545/562 43.0 Rostock 1 (D) 1994 500 545/562 43.0 Hemweg 8 (NL) 1994 630 535/563 43.0 Amer 9 (NL) 1994 600 540/568 42.6 Nordjyllandsværket 3 (DK) 1998 400 582/582/582 46.8 Lubeck (D) 1998 440 580/600 45.4 Avedøreværket 2 (DK) 2002 400 580/600 46.8 Bexbach II (D) 2002 750 575/595 46.0 a These temperatures refer to the live steam temperature, and primary/secondary reheat steam temperature. Sources: Henderson, 2003; Perrin Quarles Associates, 2001; Meier, 2002; Smeers et al., 2001. Higher steam pressures and temperatures require improvements in high-strength alloys of pipes, boiler, etc. (Theis et al., 2001) indicate that 50% efficiency is feasible by 2010 (Figure 2.2).
Advanced materials Advanced processes and components
41
42
43
44
45
46
47
48
49
50
51
X20 X20 P91 NF616 NF12 Inconel
[%]
41
42
43
44
45
46
47
48
49
50
51
Doublereheating
Eff steamturbine
Pressureloss
Waste heatrecovery
167 bar
538/538°C
250 bar
540/560°C
270 bar
585/600°C
285 bar
600/620°C
300 bar
625/640°C
350 bar
700/720°C
Figure 2.2 Efficiency improvements of pulverised coal power plants Note: The efficiency may be raised by 0.6% by reducing pressure losses and internal consumption and by another 0.6% by waste heat recovery at the steam generator. Table 2.2 shows generations of pulverised coal plants. State-of-the-art is 30 MPa and 600ºC, with Ultra-Supercritical Conditions above 30 MPa (Smeers et al., 2001; Noer et al., 1998).
Table 2.2 Materials, steam conditions, and efficiencies of pulverised coal power plants Steam parameters Plant type Material of pipes,
boiler, headers Pressure [MPa] Temperature [ºC] Efficiency
[%]
Staudinger 5 (D) F12 25.0 545/562 43.0 P91 27.0 580/600 44.5 Ultra-Supercritical Conditions (USC)
Nordjyllandsværket 3 (DK) P91 29.0 582/582/582 46.8 NF616 30.0 600/620 45.2 Austenite 31.5 620/620 45.6 Inconel 37.0 700/720 47.7
14 ECN-C--04-076

2.3 Advanced steam cycles
2.3.1 Introduction The development of advanced steam cycles dates back from the 1990s. Advanced steam cycles have applications in both simple Rankine cycle power plants and as bottoming cycles in com-plex �Vision 21� plants - referring to a Research, Development, and Demonstration (RD&D) program in the US focused on high efficiency/low CO2 emission coal-fired power - that may also use Brayton cycles and fuels cells. Here, we focus on pulverised coal power plants with a simple cycle. In Paragraph 2.3.2, the focus is on the potential of advanced steam cycles until 2020. In Paragraph 2.3.3, the scope is widened to economic considerations and to the timeframe until 2050.
2.3.2 Period 2000-2020 Definitions of efficiency In order to qualify the future development of the generating efficiency of pulverised coal power plants, it is useful to present definitions of efficiency related to power generation (Box 2.1). Box 2.1 Definitions of efficiency The theoretical efficiency (Carnot efficiency) is defined as follows:
ηC = 1 � T0/T. T is the maximum steam temperature in K. T0 is the ambient temperature in K (15ºC, 288K).
The theoretical efficiency of a Rankine cycle is a function of both steam temperature and pres-sure, with the dependence on temperature being much stronger. The practical maximum efficiency is the efficiency including irreversible losses through addi-tional components, internal consumption, etc. However, this practical maximum efficiency is not economically achievable. Finally, the (reasonably achievable) net efficiency is the generating efficiency that is economi-cally feasible.
Year 2010 In the period 1985-1998, the generating efficiency increased as follows: • In 1985, Studsrup 3&4 (540ºC, DK) had a generating efficiency of 42%. • In 1998, �Nordjyllandsvaerket� (580ºC, DK) attained a generating efficiency of 46%. Over the temperature range 500�800ºC, the theoretical efficiency varies almost linearly with steam temperature (Figure 2.3). The efficiency of pulverised coal power plants may be increased from current levels of 46% and the CO2 emissions may be reduced accordingly, if materials are developed that allow higher steam temperatures (and pressures). The generating efficiency may increase due toe higher steam temperatures even at lower than optimum steam pressures, as pressure has a relatively small effect on efficiency. Operating at reduced pressure would mitigate the high-temperature strength requirements of the alloys needed to make the boiler tubes. Although iron-based alloys could be further developed to allow even higher conditions, it was recognised during the early 1990s that there would be greater scope for advance by exploiting alloys based on nickel. Such �superalloys� are already in use in aerospace and gas turbine appli-cations. New alloys will become available around 2013 at the earliest (Henderson, 2003).
ECN-C--04-076 15

The Japanese Electric Power Development Company (EPDC) operates a 1,000 MW cross com-pound plant with maximum steam temperatures of 600/610ºC in Shikoku (Japan). In tests since late 2000, this unit has been the proving ground for 1,000 MW steam turbines from Mitsubishi Heavy Industries (MHI). The maximum steam temperature of the unit is 610ºC and the generat-ing efficiency is 49%. Ferritic heat resistant steels are commonly used for 600ºC operation. Ex-amples include 12Cr (chromium) forged, 12Cr cast, and 9Cr forged steels. The 600ºC ceiling was raised by use of a newer 12Cr with Co (cobalt) alloy (IPG, 2003c). Power plants in 2010 will use readily available alloys like those depicted in Figure 2.2 (see also Table 2.2). Inconel would enable a maximum steam temperature of 700-720ºC and a generating efficiency of 50%. (Figure 2.3) It is generally assumed that this is the practical limit for pulver-ised coal power plants in 2010 (Otter, 2002; Bugge et al., 2002; COORETEC, 2003). The EU program on the �Advanced 700ºC PF Power Plant� (�EC AD700�) aims to realise such an ad-vanced pulverised coal power plant, possibly as a demonstration plant, a few years after 2010. Year 2020 The key components of a steam power plant for which the properties of available materials may limit high-temperature performance include superheater and reheater tubing, high-pressure steam headers and piping, and turbine rotors and casings. All of these components have to meet creep strength requirements and resist steam-side oxidation. In the framework of research on behalf of the US Department of Energy (DoE), barriers to increase the temperature capabilities of alloys will be examined, and the issues involved in developing materials for service at tem-peratures as high as 870ºC will be identiÞed (Ruth, 2003). In 2020, advanced alloys for pipes, boiler, and headers may be available. If pulverised coal (PC) would have a maximum steam temperature of 775ºC, this could have the following impact: • The (thermodynamic) Carnot efficiency could be 73%, compared to a level of 65% in 1985
(Studsrup 3&4), and 70% in 2010 (if a �EC AD 700� power plant would be built). • The practical maximum efficiency could be approximately 60%, compared to a level of 52%
in 1985, and possibly 58% in 2010. • The (reasonably achievable) net efficiency could be 53%, compared to a level of 42% in
1985, and possibly 50% in 2010. All in all, a steam temperature of about 775ºC seems to be achievable around 2020 (Figure 2.3).
40
45
50
55
60
65
70
75
525 575 625 675 725 775
Carnot efficiencyPractical maximumNet efficiencyProjection
[%]
[°C]
2020
EC AD700, 2012
1998
1985
40
45
50
55
60
65
70
75
525 575 625 675 725 775
Carnot efficiencyPractical maximumNet efficiencyProjection
[%]
[°C]
2020
EC AD700, 2012
1998
1985 Figure 2.3 Efficiency pulverised coal power plant as a function of steam temperature Note: Based on coal-fired power plants Table 2.1 and �Advanced 700ºC PF Power Plant� (EC AD700).
16 ECN-C--04-076
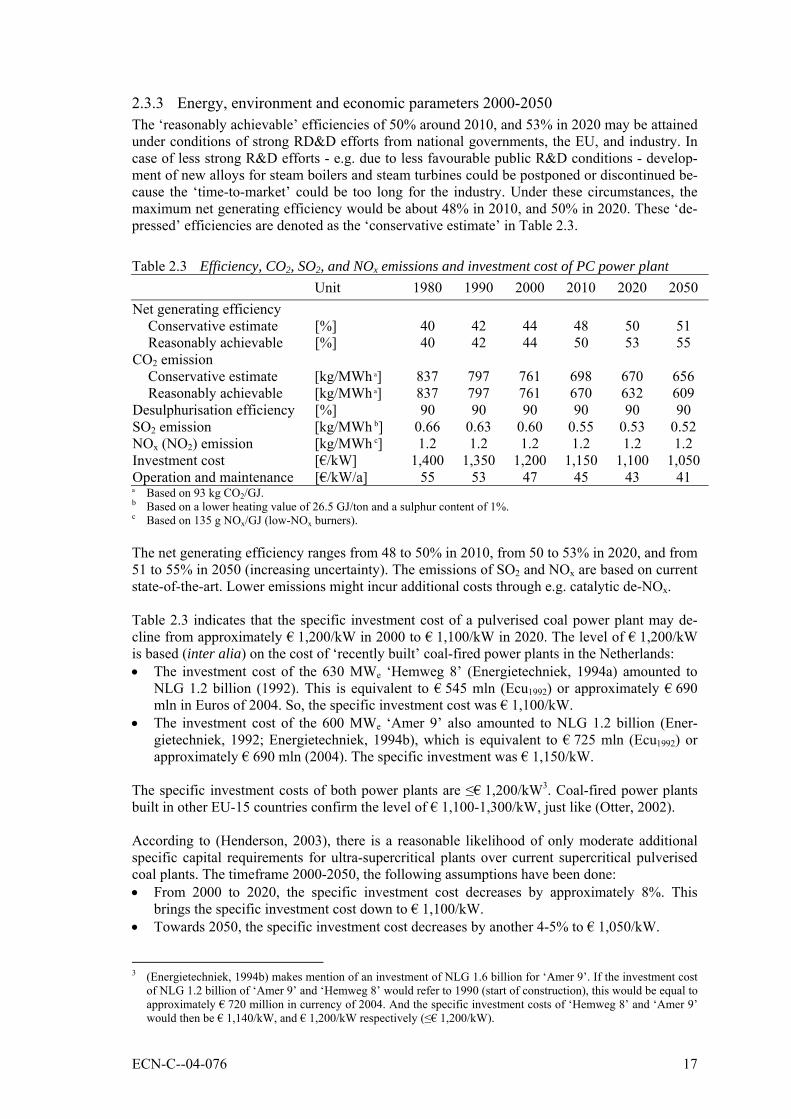
2.3.3 Energy, environment and economic parameters 2000-2050 The �reasonably achievable� efficiencies of 50% around 2010, and 53% in 2020 may be attained under conditions of strong RD&D efforts from national governments, the EU, and industry. In case of less strong R&D efforts - e.g. due to less favourable public R&D conditions - develop-ment of new alloys for steam boilers and steam turbines could be postponed or discontinued be-cause the �time-to-market� could be too long for the industry. Under these circumstances, the maximum net generating efficiency would be about 48% in 2010, and 50% in 2020. These �de-pressed� efficiencies are denoted as the �conservative estimate� in Table 2.3.
Table 2.3 Efficiency, CO2, SO2, and NOx emissions and investment cost of PC power plant Unit 1980 1990 2000 2010 2020 2050 Net generating efficiency Conservative estimate [%] 40 42 44 48 50 51 Reasonably achievable [%] 40 42 44 50 53 55
CO2 emission Conservative estimate [kg/MWh a] 837 797 761 698 670 656 Reasonably achievable [kg/MWh a] 837 797 761 670 632 609
Desulphurisation efficiency [%] 90 90 90 90 90 90 SO2 emission [kg/MWh b] 0.66 0.63 0.60 0.55 0.53 0.52 NOx (NO2) emission [kg/MWh c] 1.2 1.2 1.2 1.2 1.2 1.2 Investment cost [�/kW] 1,400 1,350 1,200 1,150 1,100 1,050 Operation and maintenance [�/kW/a] 55 53 47 45 43 41 a Based on 93 kg CO2/GJ. b Based on a lower heating value of 26.5 GJ/ton and a sulphur content of 1%. c Based on 135 g NOx/GJ (low-NOx burners). The net generating efficiency ranges from 48 to 50% in 2010, from 50 to 53% in 2020, and from 51 to 55% in 2050 (increasing uncertainty). The emissions of SO2 and NOx are based on current state-of-the-art. Lower emissions might incur additional costs through e.g. catalytic de-NOx. Table 2.3 indicates that the specific investment cost of a pulverised coal power plant may de-cline from approximately � 1,200/kW in 2000 to � 1,100/kW in 2020. The level of � 1,200/kW is based (inter alia) on the cost of �recently built� coal-fired power plants in the Netherlands: • The investment cost of the 630 MWe �Hemweg 8� (Energietechniek, 1994a) amounted to
NLG 1.2 billion (1992). This is equivalent to � 545 mln (Ecu1992) or approximately � 690 mln in Euros of 2004. So, the specific investment cost was � 1,100/kW.
• The investment cost of the 600 MWe �Amer 9� also amounted to NLG 1.2 billion (Ener-gietechniek, 1992; Energietechniek, 1994b), which is equivalent to � 725 mln (Ecu1992) or approximately � 690 mln (2004). The specific investment was � 1,150/kW.
The specific investment costs of both power plants are ≤� 1,200/kW3. Coal-fired power plants built in other EU-15 countries confirm the level of � 1,100-1,300/kW, just like (Otter, 2002). According to (Henderson, 2003), there is a reasonable likelihood of only moderate additional specific capital requirements for ultra-supercritical plants over current supercritical pulverised coal plants. The timeframe 2000-2050, the following assumptions have been done: • From 2000 to 2020, the specific investment cost decreases by approximately 8%. This
brings the specific investment cost down to � 1,100/kW. • Towards 2050, the specific investment cost decreases by another 4-5% to � 1,050/kW.
3 (Energietechniek, 1994b) makes mention of an investment of NLG 1.6 billion for �Amer 9�. If the investment cost
of NLG 1.2 billion of �Amer 9� and �Hemweg 8� would refer to 1990 (start of construction), this would be equal to approximately � 720 million in currency of 2004. And the specific investment costs of �Hemweg 8� and �Amer 9� would then be � 1,140/kW, and � 1,200/kW respectively (≤� 1,200/kW).
ECN-C--04-076 17

The investment cost of pulverised coal power plants will come down only steadily, and not so fast as anticipated for new power plant technologies like IGCC with a higher learning potential.
18 ECN-C--04-076

3. IGCC POWER PLANT
3.1 Introduction Integrated Gasification Combined Cycle (IGCC) is a power plant technology that has been demonstrated - in Europe and in the US a small number of coal-based IGCCs is in operation. IGCC technology offers much development potential, in terms of generation efficiency and cost. Paragraph 3.2 addresses the state-of-the-art of IGCC plants, and Paragraph 3.3 addresses more advanced IGCCs.
3.2 State-of-the-art In 1994, the 253 MWe (semi-)commercial IGCC power plant �Demkolec� was commissioned at Buggenum, the Netherlands (Energietechniek, 1994c; Hannemann et al., 2002). The net generat-ing efficiency of this power plant - applying Shell gasification technology4 - is 43.2% (Ta-ble 3.1). The investment cost was NLG 850 mln (1989), or approximately Ecu 385 mln (1989)5 and � 520 mln in currency of 2004. Thus, the specific investment cost was � 2,050/kW (2004). In 1995, the 252 MWe Wabash River IGCC was commissioned at PSI�s Wabash River Generat-ing Station in Terre Haute, Indiana (US). Wabash River meant repowering of a small steam power plant, and not a �greenfield� project, based on the E-Gas� process6. The IGCC has a net efficiency of 39.9%7. The investment cost was $ 416.6 mln (1994), or Ecu 344 mln (1994), which is equal to approximately � 419 mln (2004). Thus, the specific investment cost was � 1,664/kW. If Wabash River would have been a greenfield project, the investment cost would have been $ 428 mln (1994) ≈ � 430 mln (2004); this is equivalent to a specific investment cost of � 1,710/kW (Wabash River, 2000). In 1996, a 250 MWe IGCC was commissioned in Polk County, Florida (US). This IGCC power plant, based on Texaco gasification technology8, has a net generating efficiency of 38.0%9 (Tampa Electric, 2002; O�Brien, 2004). The investment cost amounted to $ 410 ($ mid 2001) or approximately � 465 mln (mid 2001), which is approximately � 494 mln (2004). Thus, the spe-cific investment cost was � 1,975/kW. Today�s direct cost for a new single-train IGCC plant on the Polk site in Polk�s current configuration incorporating all the lessons learnt would be about $ 1,650/kW (2002), or approximately � 1,840/kW (2004). In 1996, a 318 MWe IGCC entered service at Puertollano (Spain). Until 1998 the power plant was operated on the (secondary) fuel natural gas (Hannemann et al., 2003; Méndez-Vigo, 2002; Coca et al., 1998). When the gasifier became operational in 1998, hard coal and petroleum cokes (50/50%) became the main fuels. �Puertollano� makes use of Prenflo gasification technol-ogy10, and has a net efficiency of 45% (Table 3.1). The investment cost of the IGCC at Puertol-lano amounted to $ 894 mln, which is equal to � 906 mln in Euros of 2004. Therefore, the spe-cific investment cost of the IGCC was � 2,700/kW (nominal capacity 335 MWe at ISO condi-tions). When an IGCC is based on a mixture of lignite and petroleum cokes the specific invest-ment cost may be up to 15% higher than for hard coal (Illinois coal) as the main fuel. This per-
4 The Shell gasification process is an oxygen-blown, dry-fed, entrained-flow gasification process. 5 The Ecu is used as the currency prior to introduction of the Euro (�). 6 The E-Gas� is an oxygen-blown, slurry-fed, continuous-slagging, two-stage, entrained-flow gasification process. 7 Plant heat rate 9.40 MJ/kWh (HHV) → η = 38.3% (HHV) ≈ 39.9% (LHV); efficiency reduced by cooling towers. 8 The Texaco gasification process is an oxygen-blown, slurry-fed, entrained-flow gasification process. 9 Plant heat rate 9.68 MJ/kWh (HHV) → η = 36.5% (HHV) ≈ 38.0% (LHV); efficiency reduced by cooling towers. 10 The Prenflo gasification process is an oxygen-blown, dry-fed, entrained-flow gasification process.
ECN-C--04-076 19

centage is based on (Breton et al., 2002), who address the specific investment cost of several configurations of an IGCC based on the E-Gas� gasification process. This may be part of the explanation of the high investment cost of �Puertollano�. Table 3.1 shows several parameters of IGCC plants based on coal and other fuels (Hannemann et al., 2003; Méndez-Vigo, 2002; Wabash River, 2000; Keeler, 2002; Topper, 2003).
Table 3.1 Parameters of IGCC based on hard coal or lignite & petroleum cokes (50/50%) IGCC power plant Dow
Plaquemine Wabash River Buggenum Puertollano
Year (operational) 1987 1995 1994 1998 State/Country Louisiana/ USA Indiana/USA The Netherlands Spain Feedstock Hard coal Hard coal Hard coal Lignite &
petroleum cokes Gasification process Dow/E-Gas� E-Gas� Shell Prenflo Level of integration Low Low High High Fuel gas temperature [ºC] 149 300 300 302 Fuel gas composition [% vol.]
H2 41.4 34.4 12.3 10.7 CO 38.5 45.3 24.8 29.2 CO2 18.5 15.8 0.8 1.9 N2 1.5 1.9 42.0 53.1 CH4 0.1 1.9 - 0.01 Ar - 0.6 0.6 0.6 H2O - - 19.1 4.2 O2 - - 0.4 0.3 H2/CO ratio (vol.) 1.07 0.76 0.50 0.36 [mg/m3] N/A - 3.8 25
Total sulfur [ppmv] N/A 68 - 12
Lower Heating Value [MJ/kg] 10.4 10 4.32 4.3 Desulphurisation eff. [%] N/A 99 97.85 99
[g/GJ] N/A 65 ~30 50 NOx emission [ppmv] 25 <20 9 ~15 Secondary fuel Natural gas N/A Natural gas Natural gas Air extracted from GTa
Related to ASUb [%] 0 0 100 100 Related to compressor [%] 0 0 16 18
Nitrogen integration [%] 0 0 100 100 Net power output [MW] 160 252 253 318 Net efficiency (LHV)
High quality hard coal [%] N/A 39.9 43.2 45.0 Lignite & petcoke [%] - - - 42.0 Petroleum cokes [%] - 40.4 - - Natural gas [%] N/A N/A 52 52.4
a GT = Gas Turbine. b ASU = Air Separation Unit. Sources: Hannemann et al., 2003; Méndez-Vigo, 2002; Wabash River, 2000; Keeler, 2002; Topper, 2003.
3.3 Advanced IGCCs
3.3.1 Introduction Advanced IGCCs may be based on the same concept as the �state-of-the-art� IGCCs of Para-graph 3.2, but incorporate more efficient gas turbines and e.g. high-temperature desulphurisa-tion processes. It seems worthwhile to analyse the potential of IGCCs in the period 2000-2020 (Paragraph 3.3.2.). After that, the scope is widened to economic considerations and to a time-frame until 2050 (Paragraph 3.3.3). Finally, the potential of IGCC is compared to that of pulver-
20 ECN-C--04-076

ised coal from the point of view of generating efficiency and (reduction of) the specific invest-ment cost (Paragraph 3.3.4).
3.3.2 Period 2000-2020 IGCC plants can achieve up to 45% efficiency, greater than 99% SO2 removal and very low NOx emissions. According to (Internet Source 1) IGCC cost projections range from $ 1,200 to 1,400/kW; 10 to 30% higher than for pulverised coal with SO2 scrubbers. The high efficiency of IGCCs may become an important factor in the view of climate change. Also, IGCC technology may be the technology of choice when high SO2 removal and low NOx emissions are required. IGCCs built in 2010 may have a generating efficiency of 50-52%. Continued R&D will make gas turbines and combined cycles more and more efficient. Also, high-temperature desulphuri-sation processes may be available in 2020. Due to these technological developments, the maxi-mum generating efficiency of an IGCC may rise to 53-56% in 2020.
3.3.3 Energy, environment and economic parameters 2000-2050 In 2010, the generating efficiency of an IGCC may be 50%. This level of generating efficiency presumes current gasification technology - Dow, E-Gas�, Lurgi, Prenflo, Shell, Texaco - and application of modern gas turbine technology. Conventional desulphurisation processes will be applied - based on refinery applications - as high-temperature desulphurisation processes are not available. When the most advanced gas turbine technology would be applied, the generating ef-ficiency could even approach 52% (Hanneman et al., 2003). For 2020, the generating efficiency may range from 53 to 56%, dependent on the R&D with regard to gas turbines, but also with regard to gasification, oxygen production, gas clean up, etc. Table 3.2 shows the energy, environment, and economic parameters of IGCC power plants in the period 2000-2050. With regard to generating efficiency and CO2 emission, two levels are regarded, viz. a �conservative estimate� (little emphasis on RD&D from e.g. the EU) and a �rea-sonably achievable level� (continued strong RD&D effort). These levels should be regarded as a preliminary distinction between �relatively moderate� and �ambitious� RD&D policies.
Table 3.2 Efficiency, CO2, SO2, and NOx emissions and investment cost of IGCC Unit 1990 2000 2010 2020 2050 Net generating efficiency
Conservative estimate [%] 42 45 50 54 55 Reasonably achievable [%] 42 45 52 56 60
CO2 emission Conservative estimate [kg/MWh a] 797 744 670 620 609 Reasonably achievable [kg/MWh a] 797 744 644 598 558
Desulphurisation efficiency [%] 98.5 99 99 99 99 SO2 emission [kg/MWh b] 0.09 0.06 0.06 0.05 0.05 NOx (NO2) emission [kg/MWh c] 0.4 0.4 0.4 0.4 0.4 Investment cost [�/kW] 2,000 1,700 1,500 1,400 1,250 Operation and maintenance [�/kW/a] 70 60 53 49 44 a Based on 93 kg CO2/GJ. b Based on a lower heating value of 26.5 GJ/ton and a sulphur content of 1%. c Based on 50 g NOx/GJ (low-NOx burners). Sources: Wabash River, 2000; Hannemann et al., 2003; Méndez-Vigo, 2002; Keeler, 2002; Topper, 2003. It is assumed that the specific investment cost will be reduced by some 25% compared to �Bug-genum�, viz. to � 1,500 in 2010. (EPRI, 1995) gives quotes for the specific investment cost of a 2nd generation 600 MW IGCC after �Buggenum� (generating efficiency ≥50%) and also for a 2nd
ECN-C--04-076 21

generation IGCC after �Puertollano� (generating efficiency ≥48%): $ 1,700/kW (2010) for 2nd generation Buggenum, and $ 1,400/kW (2010) for 2nd generation Puertollano. Therefore, the figure of � 1,500 is in accordance with these estimates. Around 2020 and beyond, a 3rd generation IGCC (�Puertollano�) would have a specific invest-ment cost of $ 1,000/kW ($1995) ≈ � 1,200/kW (EPRI, 1995). It is assumed that the specific in-vestment cost of an IGCC will come down to � 1,400/kW in 2020, and � 1,250/kW in 2050.
3.3.4 Comparison between IGCC and pulverised coal The most striking difference between an IGCC and a pulverised coal (PC) power plant is the higher efficiency of the former. Figure 3.1 shows a projection of their generating efficiencies. In the timeframe 2000-2020, the maximum generating efficiency of a gas-fired combined cycle (CC) power plant may increase from 60% in 2000 to 63-64% in 2010 and 65-67% in 2020 (the uppermost line in Figure 3.1). IGCC technology may profit from such advanced combined cy-cles becoming available until 2020. Therefore, the net generating efficiency of an IGCC may be 56% in 2020, based on a scenario of continued (publicly supported) RD&D with regard to gasi-fication, advanced oxygen production technology, high-temperature desulphurisation, etc.
35
40
45
50
55
60
65
70
1990 2000 2010 2020 2030 2040 2050
CC High
IGCC High
IGCC Low
PC High
PC Low
Buggenum
Wabash River
Polk Power Plant
Puertollano
Buggenum 600 MWstudyPuertollano 2ndgeneration
[%]
Figure 3.1 Projection of generating efficiency of pulverised coal and IGCC power plants Sources: Wabash River, 2000; Hannemann et al., 2003; Méndez-Vigo, 2002; EPRI, 1995. If the conditions for the development of highly efficient IGCCs are right, an IGCC may be 3 percent points more efficient than the most efficient pulverised coal power plant in 2020, and possibly 5 percent points in 2050. This is a substantial difference, considering the proportionally lower CO2 emission from IGCCs. However, an IGCC will most likely remain more expensive (�/kW) than a similar-sized pulverised coal-fired power plant. Figure 3.2 shows a possible evolution of the specific investment cost of both power plant types. Figure 3.2 shows that the specific investment cost of pulverised coal power plants may decline to � 1,100/kW in 2020, and � 1,050/kW in 2050. The cost reduction compared to 1990 may be
22 ECN-C--04-076

in excess of 20%, which is substantial. The specific investment cost of IGCC power plants is deemed to decline to � 1,400/kW in 2020, and � 1,250/kW in 2050. The cost reduction com-pared to 1990 would be nearly 40%, reflecting the high learning potential associated with IGCC technology, in particular due to more efficient gas turbines, oxygen plants, gas clean-up, etc. As IGCC is rather complex technology, it is assumed that its specific investment cost is 35% higher compared to a pulverised coal power plant in 2000. The cost projections for pulverised coal and IGCC - see Figure 3.2 - indicate that the gap may be narrowed to approximately 25% in 2020, and 20% in 2050. A margin of this order of magnitude may not be an impediment to the commercialisation of IGCCs. The higher efficiency of an IGCC results in lower fuel cost. Another consequence is a lower CO2 emission per kWh - very important for climate policies.
1,000
1,200
1,400
1,600
1,800
2,000
2,200
2,400
2,600
2,800
1990 2000 2010 2020 2030 2040 2050
IGCC
PC
Buggenum
Wabash River
Polk Power Plant
Puertollano
Buggenum 600 MWstudyPuertollano 2ndgenerationPuertollano 3rdgeneration
[Euro/kW]
Figure 3.2 Projected specific investment costs of pulverised coal and IGCC power plants Sources: Wabash River, 2000; Hannemann et al., 2003; Méndez-Vigo, 2002; EPRI, 1995. It is also noteworthy that IGCCs are also superior with regard to SO2 and NOx emissions: • The SO2 emission of a pulverised coal (PC) power plant is generally one order of magnitude
higher than that of an IGCC, as the desulphurisation grade of a PC power plant is commonly 90%, compared to 99% for an IGCC. If more stringent SO2 emission limits are imposed, the investment cost of a pulverised coal power plant goes up. Paragraph 4.2 provides cost data of technologies for stringent SO2 and NOx emission reduction.
• The NOx emission of a pulverised coal power plant without catalytic de-NOx (Selective Catalytic Reduction, SCR) is a factor three higher than that of an IGCC. More stringent NOx emission limits would incur higher costs for a pulverised coal power plant.
ECN-C--04-076 23
4. POTENTIAL FOR FURTHER DEVELOPMENT
4.1 Introduction In this Chapter, the potential for further SO2 and NOx emission reduction at pulverised coal power plants is explored (Paragraph 4.2 and 4.3). Next, the potential of CO2 capture at pulver-ised coal and IGCC power plants is explored (Paragraph 4.4 and 4.5). In Paragraph 4.6, the two options are compared.
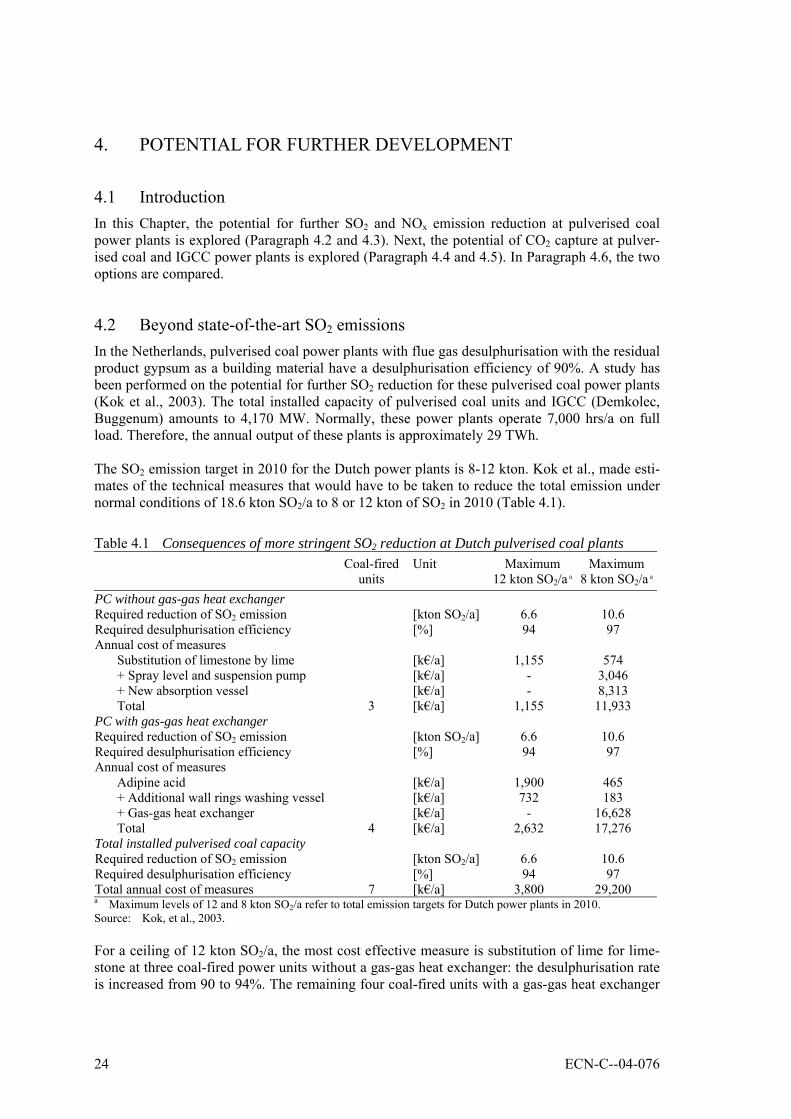
4.2 Beyond state-of-the-art SO2 emissions In the Netherlands, pulverised coal power plants with flue gas desulphurisation with the residual product gypsum as a building material have a desulphurisation efficiency of 90%. A study has been performed on the potential for further SO2 reduction for these pulverised coal power plants (Kok et al., 2003). The total installed capacity of pulverised coal units and IGCC (Demkolec, Buggenum) amounts to 4,170 MW. Normally, these power plants operate 7,000 hrs/a on full load. Therefore, the annual output of these plants is approximately 29 TWh. The SO2 emission target in 2010 for the Dutch power plants is 8-12 kton. Kok et al., made esti-mates of the technical measures that would have to be taken to reduce the total emission under normal conditions of 18.6 kton SO2/a to 8 or 12 kton of SO2 in 2010 (Table 4.1).
Table 4.1 Consequences of more stringent SO2 reduction at Dutch pulverised coal plants Coal-fired
units Unit Maximum
12 kton SO2/a a Maximum
8 kton SO2/a a PC without gas-gas heat exchanger Required reduction of SO2 emission [kton SO2/a] 6.6 10.6 Required desulphurisation efficiency [%] 94 97 Annual cost of measures Substitution of limestone by lime [k�/a] 1,155 574 + Spray level and suspension pump [k�/a] - 3,046 + New absorption vessel [k�/a] - 8,313 Total 3 [k�/a] 1,155 11,933 PC with gas-gas heat exchanger Required reduction of SO2 emission [kton SO2/a] 6.6 10.6 Required desulphurisation efficiency [%] 94 97 Annual cost of measures Adipine acid [k�/a] 1,900 465 + Additional wall rings washing vessel [k�/a] 732 183 + Gas-gas heat exchanger [k�/a] - 16,628 Total 4 [k�/a] 2,632 17,276 Total installed pulverised coal capacity Required reduction of SO2 emission [kton SO2/a] 6.6 10.6 Required desulphurisation efficiency [%] 94 97 Total annual cost of measures 7 [k�/a] 3,800 29,200 a Maximum levels of 12 and 8 kton SO2/a refer to total emission targets for Dutch power plants in 2010. Source: Kok, et al., 2003. For a ceiling of 12 kton SO2/a, the most cost effective measure is substitution of lime for lime-stone at three coal-fired power units without a gas-gas heat exchanger: the desulphurisation rate is increased from 90 to 94%. The remaining four coal-fired units with a gas-gas heat exchanger
24 ECN-C--04-076

may use adipine acid, an acid that enhances SO2 absorption (desulphurisation rate from 90 to 94%). Based on 7,000 hrs/a on full load, the cost of SO2 reduction is � 600/ton SO2. In the case of a ceiling of 8 kton SO2/a, the aforementioned measures are insufficient. For the three coal-fired units without a gas-gas heat exchanger three measures have to be taken: • Substitution of limestone by lime. • Installation of another spray level and an additional suspension pump in two absorption ves-
sels. • A new absorption vessel at one coal-fired unit. For the four coal-fired units with a gas-gas heat exchanger three measures have to be taken: • Addition of adipine acid. • Additional wall rings in absorption vessels. • Substitution of absorption vessel by a new one without leakage at one coal-fired unit. These measures increase the desulphurisation from approximately 90 to 97%. When the coal-fired units operate 7,000 hrs/a on full load, the cost of SO2 reduction is some � 3,000/ton SO2. The specific investment cost of a �wet gypsum� desulphurisation process is estimated at ap-proximately � 130/kW, related to the electrical capacity (Kaminski et al., 2003). This is in ac-cordance with the level that comes up from an analysis of the cost of desulphurisation and cata-lytic deNOx (SCR) by (Rubin et al., 2004). Rubin et al. show that the specific investment cost of desulphurisation has been reduced from approximately $ 250/kW in 1976 to approximately $ 130/kW ($1997) in 1995 (Figure 4.1).
10
100
1000
1 10 100 1000
[$1997/kW]
[GWe]
1976 1980
19821990
1995
Figure 4.1 Specific investment cost of desulphurisation as a function of installed capacity Source: Rubin et al., 1994. New pulverised coal power plants based on high-sulphur coal may apply a combined desul-phurisation/deNOx process (Schoubye et al., 2002), e.g. the SNOX Process (Topsøe A/S): • Up to 99% of SOx in the flue gas recovered as 94-96% H2SO4. • 90-95% NOx removal (e.g. from 300 to 30 ppmv). • Essentially all dust and particulates removed from the flue gas. • No consumption of materials and water, apart from NH3 for deNOx.
ECN-C--04-076 25

The investment cost of the SNOX process is approximately � 200/kW (50% more than �conven-tional� desulphurisation), equivalent to a capital cost of � 2.7/MWh. As the operational cost is 0.6/MWh (Schoubye et al., 2002), the sum of capital and operational cost is � 3.3/MWh.
4.3 Beyond state-of-the-art NOx (NO2) emissions The specific investment cost of catalytic deNOx based on Selective Catalytic Reduction (SCR) is estimated at � 60/kW (Table 4.2), in accordance with Rubin et al. (Figure 4.2).
1
10
100
1000
1 10 100 [GWe]
[$1997/kW]
1983 1989
1993 1995
1996
Figure 4.2 Investment cost of catalytic deNOx (SCR) as a function of installed capacity Source: Rubin et al., 1994. The investment cost of desulphurisation plus catalytic deNOx is estimated at � 190/kW: desul-phurisation � 130/kW, SCR � 60/kW (Table 4.2). The capital costs are then � 2.55/MWh. As the operational costs are � 2.15/MWh (Schoubye et al., 2002), the total costs are � 4.7/MWh.
Table 4.2 Efficiency, CO2, SO2, and NOx emissions and investment cost of PC with SCR Unit 1980 1990 2000 2010 2020 2050Net generating efficiency Conservative estimate [%] 40 42 44 48 50 51 Reasonably achievable [%] 40 42 44 50 53 55CO2 emission Conservative estimate [kg/MWh a] 837 797 761 698 670 656 Reasonably achievable [kg/MWh a] 837 797 761 670 632 609Desulphurisation efficiency [%] 90 90 90 90 90 90SO2 emission [kg/MWh b] 0.66 0.63 0.60 0.55 0.53 0.52NOx (NO2) emission [kg/MWh] 0.15 0.15 0.15 0.15 0.15 0.15Investment cost [�/kW] 1,500 1,440 1,260 1,205 1,150 1,100Operation and maintenance [�/kW/a] 95 80 50 48 46 44a Based on 93 kg CO2/GJ. b Based on a lower heating value of 26.5 GJ/ton and a sulphur content of 1%.
26 ECN-C--04-076

4.4 Advanced steam power plants with CO2 capture Public and private R&D spending on separation of CO2 from power plants is growing strongly. The main challenge of CO2 capture and storage is the high cost of technologies using current state-of-the-art. Separation and compression of CO2 are the most important cost factors. One of the most advanced technologies for separation of CO2 from the flue gas of a pulverised coal power plant is the amine absorption technology (Figure 4.3, Chakravarti et al., 2001).
Figure 4.3 Amine absorption process for CO2 recovery from flue gas Source: Chakravarti et al, 2001. Table 4.3 shows the effect of CO2 capture on efficiency, CO2 emission, and electricity price.
Table 4.3 Efficiency, CO2 emission, and generation cost of coal-fired power plants Institute Utrecht IEA GHG MIT Utrecht IEA GHG MIT (Main) author Hendriks Thambimuthu David Hendriks Thambimuthu David Year of study referenced 1994 2000 2001 1994 2000 2001 Power plant PC PC PC IGCC IGCC IGCC Generating efficiency Without capture [%] 41.0 45.6 42.4 43.6 46.3 47.8 With capture [%] 31.5 33.0 36.1 36.3 38.2 43.5 Energy penalty [%] 23 28 15 17 17 9 CO2 reduction Without capture [kg/MWh] 800 730 790 760 720 700 With capture [kg/MWh] 100 100 40 130 80 CO2 emission red. [%] 88 87 95 81 81 Cost of capture Capital charge rate [%] 7.1 15 7.1 15 Price without capture [¢/kWh] 3.7 3.9 4.1 3.8 4.9 4.1 Price with capture [¢/kWh] 6.1 6.5 6.3 5.1 7.0 5.1 Increase in price [%] 63 68 53 34 43 25 Cost of avoided CO2 [$/t CO2] 34 47 32 17 30 18 Sources: Hendriks, 1994; Thambimuthu, 2003; Strömberg, 2003; David, 2001.
ECN-C--04-076 27

According to (Hendriks, 1994), CO2 capture by means of amine absorption would reduce the generating efficiency of pulverised coal (PC) from 41.0 to 31.5% (23% increase of plant heat rate). The price of electricity would increase by 63% and the cost of avoided CO2 would be $ 34/metric ton of CO2. In case of an IGCC plant, CO2 capture would reduce the generating ef-ficiency from 43.6 to 36.3% (17% increase of plant heat rate). The price of electricity would in-crease by 34% and the cost of avoided CO2 would be $ 17/metric ton of CO2. (Thambimuthu, 2002b) and (Strömberg, 2003) show percentages increase of electricity prices for PC and IGCC comparable to (Hendriks, 1994), viz. 70% and 40% respectively. However, the cost of avoided CO2 is $ 47 instead of $ 34/metric ton of CO2 for PC, and $ 30 instead of $ 17 for IGCC. Also, data from an MIT study (David, 2001) are included in Table 4.3. In case of (David, 2001), the energy penalties are substantially lower than for (Hendriks, 1994) and (Thambimuthu, 2002b). According to (McCartney, 2001) the cost incurred by CO2 capture is as follows: • $ 1,130/kW export for a MEA (Mono Ethanol Amine) scrubbing plant. • $ 450/kW export for compression to pipeline pressure. When these costs are used to determine the specific investment cost of a �Pulverised coal power plant with CO2 capture�, the minimum cost level of a mature plant is estimated at � 1,500/kW in 2050 - in accordance with (Hendriks, 1994), (Thambimuthu, 2003) and (Strömberg, 2003). Ta-ble 4.4 gives tentative estimates efficiencies, CO2 emissions, and costs of pulverised coal power plants with CO2 capture based on amine absorption technology (chemical absorption).
Table 4.4 Efficiency, CO2 etc. emissions and investment cost of PC with CO2 capture Unit 2010 2020 2050 Net generating efficiency Conservative estimate [%] 39 41 42 Reasonably achievable [%] 41 44 46 CO2 emission CO2 capture [%] 90 90 90 Conservative estimate [kg/MWh a] 86 82 80 Reasonably achievable [kg/MWh a] 82 76 73 Desulphurisation [%] 90 90 90 SO2 emission [kg/MWh b] 0.68 0.64 0.63 NOx (NO2) emission [kg/MWh c] 1.2 1.2 1.2 Investment cost [�/kW] 1,800 1,700 1,500 Operation and maintenance [�/kW/a] 70 65 55 a Based on 93 kg CO2/GJ. b Based on a lower heating value of 26.5 GJ/ton and a sulphur content of 1%. c Based on 135 g NOx/GJ (low-NOx burners). For a much more detailed view on the pulverised coal power plant with CO2 capture, the reader is referred to (Göttlicher, 2004).
4.5 IGCC power plants with CO2 capture For CO2 capture at an IGCC, the higher pressure and higher CO2 concentration is very favour-able. This enables the application of physical instead of chemical absorption technologies. Fig-ure 4.4 shows a scheme for an IGCC with CO2 capture (Thambimuthu, 2002a).
28 ECN-C--04-076

CO2Separation
H2
CO2GasifierCoal
Shift Reactor Storage
GT CC
Air SeparationUnit
O2 N2
CO2Separation
CO2Separation
H2
CO2GasifierGasifierCoal
Shift Reactor
Shift Reactor StorageStorage
GT CCGT CC
Air SeparationUnit
Air SeparationUnit
O2 N2
Figure 4.4 Scheme of IGCC with CO2 recovery from fuel gas Source: Thambimuthu, 2002a. A few estimates of specific investment cost and generating efficiency of IGCCs with or without CO2 capture are shown in Figure 4.5. One estimate (see Table 4.3) is MIT (David, 2001). The other ones are IEA GHG, EPRI (Strömberg, 2003) and Politecnico di Milano (Chiesa, 2003).
32,5
37,5
42,5
47,5
1.000 1.250 1.500 1.750 2.000 2.250
IGCC without CO2 captureIGCC with CO2 capture
[Euro/kW]
[%]
MI
MIT
Chiesa 2
Chiesa 2
Chiesa 1
Chiesa 1
EPR
EPR
IEA
IEA IGCC without CO2 capt ureIGCC with CO2 capture
Figure 4.5 Specific investment cost and efficiency of state-of-the-art IGCC without and with
CO2 capture Sources: Thambimuthu, 2002b; Strömberg, 2003; Chiesa 2003; David, 2001. The lowest specific investment cost is from IEA GHG, viz. $ 1370/kW ($2003) without CO2 cap-ture and $ 1860/kW with CO2 capture. More conservative estimates are those from (Chiesa, 2003): $ 1395-1585/kW ($2002) without CO2 capture and $ 1810-2040/kW with CO2 capture. The difference between the IGCCs in (Chiesa, 2003) is the application of a quench cooler (�Chi-esa 1�) or a syngas (radiant) cooler (�Chiesa 2�) - the former is less efficient than the latter, but also less costly. Table 4.5 shows the investment cost and generating efficiency data on which Figure 4.5 is based, as well as data with regard to operation and maintenance cost (O&M cost).
ECN-C--04-076 29

Table 4.5 Efficiency, investment cost and O&M cost of IGCCs without/with CO2 capture Legend in Figure 4.5 MIT Chiesa 2
(Politecnico di Milano)
EPRI IEA GHG Chiesa 1 (Politecnico di Milano)
Year (currency) 2001 2002 2000 2003 2002 Generating efficiency Without capture [%] 47.8 46.63 45.2 43.1 42.95 With capture [%] 43.5 39.12 38.8 34.5 36.79 Energy penalty [%] 9 16 14 20 14 Specific investment cost Without capture [�/kW] 1,360 1,750 1,480 1,240 1,540 With capture [�/kW] 1,730 2,250 1,920 1,680 1,990 Operation & maintenance Without capture [�/kW.a] 47 62 N/A N/A 70 With capture [�/kW.a] 65 79 N/A N/A 89 Sources: Thambimuthu, 2003; Strömberg, 2003; Chiesa 2003; David, 2001. The higher pressure level and higher CO2 concentration for CO2 capture at an IGCC compared to a pulverised coal power plant means that the energy penalty due to CO2 capture at an IGCC is lower than in case of a pulverised coal plant. What is more, the cost of CO2 capture is lower. According to (Riahi, 2003) the so-called progress ratio for CO2 capture technologies would be 0.87; in other words, the learning rate is 13%: a cost reduction of 13% for each doubling of the cumulative installed capacity (Figure 4.6).
Flue Gas Desulfurization
0
50
100
150
200
250
300
0 50 100 150
Cumulative GWe treated with FGD of all types in U.S., Germany, Japan
Cap
ital C
osts
1976
1995
1990
19801982
Learning Curve for Carbon Capture technologies
y = 1.6354x -0.2047
R2 = 0.7878
10%
100%
1 10 100 1000
Cumulative GWe
Cap
ital C
osts
Learning rate ~ 13%
Figure 4.6 Learning rate of CO2 capture technologies Source: Riahi, 2003. This learning rate has to be factored in, when estimating the cost of IGCCs with CO2 capture. Table 4.6 shows data with regard to energy, environment, and economic parameters of IGCCs with CO2 capture. A distinction is made between the �conservative estimate� (little emphasis on R&D) and the �reasonably achievable level� (strong R&D effort). The specific investment cost of CO2 capture is assumed to decrease from � 350/kW in 2010 to � 300/kW in 2020, and � 225/kW in 205011, and the operation and maintenance cost from � 22/kW.a in 2010 to � 16/kW.a in 2050.
11 This presumes approximately three doublings of the cumulative capacity of power plants with CO2 capture. Start-
ing with approximately 125 GW (Figure 4.6), the cumulative capacity would amount to some 1,000 GW in 2050.
30 ECN-C--04-076

Table 4.6 Efficiency, CO2, etc. emissions and investment cost of IGCC with CO2 capture Unit 2010 2020 2050 Net generating efficiency Conservative estimate [%] 43 45 46 Reasonably achievable [%] 45 48 51 CO2 emission CO2 capture [%] 95 95 95 Conservative estimate [kg/MWh a] 39 37 36 Reasonably achievable [kg/MWh a] 37 35 32 Desulphurisation efficiency [%] 99 99 99 SO2 emission [kg/MWh b] 0.06 0.06 0.05 NOx (NO2) emission [kg/MWh c] 0.4 0.4 0.4 Investment cost [�/kW] 1,850 1700 1,475 Operation and maintenance [�/kW/a] 75 67 60 a Based on 93 kg CO2/GJ. b Based on a lower heating value of 26.5 GJ/ton and a sulphur content of 1%. c Based on 50 g NOx/GJ (low-NOx burners). For a much more detailed view on IGCC with CO2 capture, the reader is referred to (Göttlicher, 2004).
4.6 IGCC with CO2 capture compared to pulverised coal with CO2 capture The most striking difference between an IGCC and a pulverised coal (PC) power plant is the higher efficiency of the former. This also holds for IGCCs and PC power plants with CO2 cap-ture. The investment cost of IGCC with CO2 capture may become lower than that of a compara-ble PC plant. Figure 4.7 shows the specific investment costs of both power generation options based on the Tables 4.6 and 4.4, respectively.
1,250
1,500
1,750
2,000
2,250
2,500
1990 2000 2010 2020 2030 2040 2050
IGCC
PC
Chiesa 1
Chiesa 2
EPRI
MIT
IEA GHG
[Euro/kW]
Figure 4.7 Specific investment cost of pulverised coal and IGCC plants with CO2 capture Sources: Thambimuthu, 2003; Strömberg, 2003; Chiesa 2003; David, 2001.
ECN-C--04-076 31

In 2010, the specific investment cost of IGCC with CO2 capture is estimated at � 1,850/kW, which is in the range of cost estimates from the sources referenced (Figure 4.7). In 2050, the in-vestment cost could be 20% lower, viz. � 1,475/kW - quite comparable with the cost figure for a pulverised coal (PC) plant with CO2 capture (� 1,500/kW). However, the generating efficiency of an IGCC with CO2 capture may be boosted to 46-51% in 2050, compared to 42-46% for a PC coal plant. Therefore, IGCC seems to be a superior technology if CO2 capture has to be applied. However, IGCC is a more complex and innovative technology too.
32 ECN-C--04-076

5. CONCLUSIONS
Coal remains a very important fossil fuel, as it is the most abundant and widely spread fossil en-ergy resource on earth, and coal-fired power stations currently account for 38% of power pro-duced in the world. Although in the short term, the market for conventional power plants - among which coal-fired power - is regarded as difficult, due to a slowdown of economic growth rates, there is little doubt that the demand a lot of countries in the world will need new coal-fired power plants in the foreseeable future. As an input for discussions on new coal fired power plants, this report gives an overview of the main options for electricity generation from coal. There are (at least) four options for coal-fired power: Circulating or Pressurised Fluidised Bed Combustion (CFBC or PFBC), or pulverised coal (PC) based on the simple Rankine cycle (steam cycle) or Integrated Gasification Combined Cycle (IGCC) power plants, based on a combined cycle. The main options for the next decades seem to be the pulverised coal power plant and the IGCC power plant. Therefore, the focus is on these two options, and the extent to which they can contribute to climate policies. The state-of-the-art pulverised coal power plant has a generating efficiency of 46% for hard coal and 45% for lignite. There is a strong relationship between steam temperature and the generat-ing efficiency. Higher steam pressures and temperatures require improvements in high-strength alloys. Beyond 2010, advanced alloys for pipes, boiler, and headers may become available. In 2010, the generating efficiency of a pulverised coal power plant may be 48-50%. Development of new alloys for steam boilers and steam turbines could push the generating efficiency to 50-53% in 2020, and further development could offer 51-55% efficiency in 2050. There is a reasonable likelihood of only moderate additional specific capital requirements for advanced (ultra-supercritical) pulverised coal power plants over current state-of-the-art. As the pulverised coal power technology is rather mature, the specific investment cost may come down only steadily to � 1,100/kW in 2020 and � 1,050/kW in 2050 (currently ~ � 1,200/kW). Pulver-ised coal does not have the same potential for cost reduction as the IGCC has. IGCC plants can achieve up to 45% efficiency, greater than 99% SO2 removal and very low NOx emissions. IGCCs built in 2010 may have a generating efficiency of 50-52%. Continued R&D will make gas turbines and combined cycles more and more efficient. Also, high-temperature desulphurisation processes may be available in 2020. Therefore, the generating ef-ficiency of an IGCC may rise to 53-56% in 2020. If the conditions for the development of highly efficient IGCCs are there, an IGCC may be 3 percent points more efficient than the most efficient pulverised coal power plant in 2020, and possibly 5 percent points in 2050. This is a substantial difference, considering the proportionally lower CO2 emission from IGCCs. The specific investment cost of IGCC power plants built in the last decade hovered around � 2,000/kW. A cost reduction of 25% in 2010 seems to be achievable. Therefore, � 1,500 is a reasonable cost estimate for an IGCC in 2010. A decade later, the specific investment cost may have come down to � 1,400/kW, and the investment cost may be as low as � 1,250/kW in 2050. According to the projections in this study the gap between the investment costs of pulverised coal plants and IGCC plants may be narrowed to 25% in 2020, and 20% in 2050. Such a margin is not an impediment to commercialisation of IGCCs: the higher efficiency of an IGCC results in lower fuel cost, and lower CO2 emission per kWh - very important for climate policies. New pulverised coal power plants based on high-sulphur coal may apply a combined desul-phurisation/deNOx process, e.g. the SNOX Process (Topsøe A/S). The SNOX process may in-crease the overall specific investment cost of a pulverized coal power plant by another � 50/kW
ECN-C--04-076 33

(related to the electrical capacity). The total investment cost of conventional �wet gypsum� de-sulphurisation with catalytic deNOx (SCR) is estimated at � 190/kWe - � 130/kW for desulphuri-sation and � 60/kW for SCR. R&D spending on separation of CO2 from power plants is growing strongly. The main chal-lenge of CO2 capture and storage is the high cost of technologies using current state-of-the-art. Separation and compression of CO2 are the most important cost factors. In 2010, the specific investment cost of IGCC with CO2 capture is estimated at � 1,850/kW, which is in the range of cost estimates from the sources referenced (Figure 4.7). In 2050, the investment cost could be 20% lower, viz. � 1,475/kW - quite comparable with the cost figure for a pulverised coal (PC) plant with CO2 capture (� 1,500/kW). However, the generating efficiency of an IGCC with CO2 capture may be boosted to 46-51% in 2050, compared to 42-46% for a PC coal plant.
34 ECN-C--04-076

ANNEX A LIST OF ABBREVIATIONS
CC Combined Cycle CFBC Circulating Fluidised Bed Combustion CHP Combined Heat and Power EPDC Electric Power Development Company (Japan) EPRI Electric Power Research Institute (US) IEA International Energy Agency IGCC Integrated Gasification Combined Cycle MEA Mono Ethanol Amine OECD Organisation for Economic Cooperation and Development PC Pulverised Coal PFBC Pressurised Fluidised Bed Combustion RD&D Research Development & Demonstration SCR Selective Catalytic Reduction USC Ultra-Supercritical Conditions
ECN-C--04-076 35

REFERENCES
Audus, H. et al. (1995): Global warming damage and the benefits of mitigation. IEA GHG,
ISBN 1 898373 03 5, 1995.
Breton, D.L. et al. (2002): Comparative IGCC cost and performance for domestic coals. 2002 gasification technology conference, San Francisco, US, October 27-30, 2002. http://www.gasification.org/Presentations/2002.html.
Bugge, J. et al. (2002): Advanced 700°C PF power plant (AD700): Start of the phase 2 of the project. International conference on clean coal technologies for our future, Chia Laguna, Italy, October 21-23, 2002.
Chakravarti, S. et al. (2001): Advanced technology for the capture of carbon dioxide from flue gases. First national conference on carbon sequestration, Washington DC, US, May 15-17, 2001.
Chiesa, P. et al. (2003): Production of hydrogen, electricity, and CO2 from coal using commercially-ready technology. Second annual conference on carbon sequestration, Washington DC, US, May 5-8, 2003.
Coca, M.T. et al. (1998): Coal gasification - conception, implementation and operation of the Elcogas IGCC power plant. 17th WEC Congress Houston, US, September 13-18, 1998. http://www.worldenergy.org/wec-geis/publications/default/tech_papers/17th_congress/2_2_02.asp.
COORETEC (2003): Forschungs– und Entwicklungskonzept für emissionsarme fossil befeuerte Kraftwerke - Bericht der COORETEC-Arbeitsgruppen. Bundesministerium für Wirtschaft und Arbeit, December 2003, ISSN 0342 - 9288 (BMWA-Dokumentation). http://www.bmwa.bund.de.
David, J. et al. (2001): The cost of carbon capture. MIT, Cambridge, MA, US, 2001.
Doctor, R.D. et al. (1996): KRW Oxygen-Blown Gasification Combined Cycle: Carbon Dioxide Recovery, Transport, and Disposal. Argonne National Laboratory, ANL/ESD-34, 1996.
Energietechniek (1994a): Energietechniek, 72 (no. 2), February 1994, p. 75.
Energietechniek (1994b): Energietechniek, 72 (no. 3), March 1994, p. 143.
Energietechniek (1994c): Energietechniek, 72 (no. 6), June 1994, p. 357.
EPRI (1995): Conference on New Power Generation Technology. ANA Hotel San Francisco, California, October 25-27, 1995. Proceedings prepared by EPRI. http://www.europa.eu.int/�omm./energy_transport/atlas/htmlu/ccrepsumm.html.
Hannemann, F. et al. (2002): V94.2 Buggenum experience and improved concepts for syngas applications. 2002 Gasification Technology Conference, 28 October 2002. http://www.gasification.org/Presentations/2002.html.
Hannemann, F. et al. (2003): Pushing forward IGCC technology at Siemens. Gasification Technologies 2003, 13 October 2003. http://www.gasification.org/Docs/2003_papers/13Hann.pdf.
Göttlicher, G. (2004): The energetics of carbon dioxide capture in power plants. NETL, February 2004, updated license edition of �Energetik der Kohlendioxidrückhaltung in Kraftwerken�, Fortschritt-Berichte VDI Reihe 6 Nr. 421, VDI-Verlag, Düsseldorf 1999.
36 ECN-C--04-076

Grammelis, P. et al. (2002): The situation of coal-fired power plants in Europe and European Union’s priorities. International conference on clean coal technologies for our future, Chia Laguna, Italy, October 21-23, 2002.
Hendriks, C. (1994): Carbon dioxide removal from coal-fired power plants. Thesis University of Utrecht, the Netherlands, November 1994.
Henderson, C. (2003): Clean coal technologies. IEA Clean Coal Centre, October 2003.
IPG (2003a): International Power Generation, July 2003, p. 39.
IPG (2003b): International Power Generation, July 2003, p. 21.
IPG (2003b): International Power Generation, November 2003, p. 31.
Kaminski, J. et al. (2003): Technologies and costs of SO2 emissions reduction for the energy sector. Applied Energy, 75 (2003), p. 165-172.
Keeler, C.G. (2002): Operating experience at the Wabash River repowering project. 2002 Gasification Conference, October 28, 2002.
Kok, W.C. et al., (2003): SO2 emissies van de Nederlandse elektriciteitsproductiebedrijven en opties voor verdere reductie. KEMA, Arnhem, the Netherlands, July 9, 2003.
Logan, J. (2002): Electric power and climate change in China. Regional Electrification Initiative Workshop EPRI, Washington, DC, June 7, 2002.
Mariz, C.L. (1995): Carbon dioxide recovery: large scale design trends. Sixth Petroleum Conference of the South Saskatchewan Section, The Petroleum Society of CIM, Canada, 1995.
McCartney, M.S. (2001): CO2 Separation. Alstom, May 2001.
Meier, H.-J. (2002): Cleaner coal technologies - a new initiative for Europe. International conference on clean coal technologies for our future, Chia Laguna, Italy, October 21-23, 2002.
Méndez-Vigo, I. (2002): Operational experience of the Puertollano 330MW IGCC power plant. International conference on clean coal technologies for our future, Chia Laguna, Italy, October 21-23, 2002.
Noer, M. et al. (1998): Development of ultra super critical PF power plants in Denmark. 17th WEC Congress, Houston, US, September 13-18,1998. http://www.worldenergy.org/wec-geis/publications/default/tech_papers/17th_congress/2_2_02.asp.
O�Brien, J.N. et al. (2004): An analysis of the institutional challenges to commercialization and deployment of IGCC technology in the U.S. electric industry: recommended policy, regulatory, executive and legislative Initiatives. U.S. Department of Energy, March 2004.
Otter, N. (2002): Clean power generation technology for 21st century - a perspective from the power plant supply industry. International conference on clean coal technologies for our future, Chia Laguna, Italy, October 21-23, 2002.
Perrin Quarles Associates (2001): Review of potential efficiency improvements at coal-fired power plants. US EPA, April 17, 2001.
Puertollano IGCC Power Plant (2003): Puertollano IGCC Power Plant. CARNOT Online Case study: Conversion of Solid-Fuels, 2003. http://www.worldenergy.org/wec-geis/publications/default/tech_papers/17th_congress/2_3_13.asp?mode=print&x=0&y=4.
Riahi, K. (2003): Long-term technology strategies for CO2 emissions mitigation. CMI-Seminar, Princeton University, October 13, 2003.
ECN-C--04-076 37

Rubin, E.S. et al. (2004): Experience curves for power plant emission control technologies. Int. J. Energy Technology and Policy 2, 1/2, 2004, pp. 52-69.
Ruth, L.A. (2003): Advanced clean coal technology in the USA. National Energy Technology Laboratory, US Department of Energy, 2003.
Schoubye, P. et al. (2002): The SNOX process for power plants using high sulfur fuels. International Conference on Clean Coal Technologies for our Future, Chia Laguna, Italy, October 21-23, 2002.
Smeers, Y. et al. (2001): Coal options - evaluation of coal-based power generation in an uncertain context. UCL (Université catholique de Louvain) - CORE - Unité TERM, September 2001.
Smelser, S.C. et al. (1991): An engineering and economic evaluation of CO2 removal from fossil fuel-fired power plants. Energy 16, 11/12, 1991, p. 1293.
Stamatelopoulos, G.N. et al. (2002): CO2 control technologies: ABCD power approach. International Conference on Clean Coal Technologies for our Future, Chia Laguna, Italy, October 21-23, 2002.
Strömberg, L. (2003): CO2 capture and storage from coal based power generation. Third Nordic minisymposium on carbon dioxide capture and storage. Trondheim, Norway, October 2-3, 2003.
Tampa Electric (2002): Tampa Electric Polk Power Station IGCC Project - Final Technical Report, August 2002. http://www.lanl.gov/projects/cctc/resources/library/bibliography/demonstration/aepg/baepgig_tampaig.html.
Thambimuthu, K. et al. (2002a): Zeroing emissions with CO2 capture and storage. International conference on clean coal technologies for our future, Chia Laguna, Italy, October 21-23, 2002.
Thambimuthu, K. et al. (2002b): CO2 capture and reuse. IPCC workshop on carbon dioxide capture and storage, Regina, US, November 19-21, 2002.
Theis, K.A. et al. (2001): Increase of power plant efficiency. 18th WEC Congress, Buenos Aires, Argentina, October 20-25, 2001.
Topper, J. (2003): International Clean Coal Initiatives. IEA Clean Coal Centre, 2003.
Wabash River (2000): Wabash River Coal Gasification Repowering Project -Final Technical Report, August 2000. Http://www.lanl.gov/projects/cctc/resources/library/bibliography/demonstration/aepg/ baepgig_wabriv.html.
Worldbank: http://www.worldbank.org/html/fpd/em/power/EA/mitigatn/igccsubs.htm.
38 ECN-C--04-076