coachella valley water district
TRANSCRIPT

Coachella Valley Water District2007-08 Annual Review & Water Quality Report
Mission Statement: To meet the water related needs of the people through dedicated employees providing high quality water at reasonable cost.

10
10
111
86
74
111
3
5
1
2
4
IndioIndio
La QuintaLa Quinta
Lake Cahuilla
Dike 4
Mission Creek
Whitewater
Martinez Canyon
CoachellaCoachella
Palm SpringsPalm Springs
Palm DesertPalm DesertRancho MirageRancho Mirage
Cathedral CityCathedral City
Desert Hot SpringsDesert Hot Springs
Indian WellsIndian Wells
ThermalThermal
MeccaMecca
Desert ShoresDesert Shores
North ShoreNorth Shore
Salton SeaLegendGeneral District BoundaryDirectorial BoundariesHighwaysCoachella CanalRecharge Facilities
Senior AdministrationSteve Robbins General Manager-Chief EngineerMark Beuhler Assistant General ManagerDan Parks Assistant to the General ManagerJulia Hernandez Board Secretary
The Coachella Valley Water District is a government agency run by a five-member board of directors, elected at-large to represent the five divisions within CVWD’s
service area. The directors serve four-year terms.
Board meetings are open to the public and generally held on the second and fourth Tuesday of each month at 9 a.m. in Forbes Auditorium, at CVWD’s Coachella office.
Board of DirectorsPeter Nelson President, Division 4Patricia “Corky” Larson Vice president, Division 2John “Jack” McFadden Director, Division 1Tellis Codekas Director, Division 3Russell Kitahara Director, Division 5
Contact information Payment Address
P.O. Box 5000Coachella, CA 92236
Correspondence AddressP.O. Box 1058
Coachella, CA 92236Offices
75-525 Hovley Lane East, Palm Desert
85-995 Avenue 52, Coachella
Main switchboard (760) 398-2651
Job hot line (760) 398-2661 ext. 2103
Weather hot line (760) 398-7211
Fax: (760) 398-3711Web site: www.cvwd.org
Department HeadsRaul Aguirre Director of Service Amy Ammons Director of Finance Scott Coulson Director of Business & Technology Dan Farris Director of OperationsMark Johnson Director of EngineeringHeidi Keeran Director of Human ResourcesDennis Mahr Director of Communication & LegislationJavier Miranda Director of Trades & Support
The Water Quality Report on pages 10-14 is produced in accordance with state law and mailed to all bill payers and registered voters within the General District Boundary. This publication costs approximately 39 cents per issue to print and mail.

Above: The district’s largest wastewater reclamation plant, in Palm Desert, provides
recycled water to more than a dozen irrigation customers. Eventually, the Mid-Valley Pipeline
(pages 6-7), will carry imported water to the plant to be blended with the recycled water.
Together, there will be enough nonpotable water to serve up to 50 golf courses, so they will
no longer need to rely on precious groundwater.
Right: SilverRock Resort in La Quinta is irrigated with water from the Coachella Canal, which runs through the course on its way to Lake
Cahuilla. Employees periodically inspect canal gates to ensure the water is flowing
properly and not obstructed by debris.
2-3 General Manager’s Message
4-5 Groundwater Management
6-7 Mid-Valley Pipeline & Wastewater Reclamation
8-9 Conservation
10-14 Water Quality Report
15 Wastewater Collection
16-17 Public Outreach
18-19 Financial Statements
20-21 Agricultural Irrigation & Crop Report
22- 23 Coachella Canal
24 Stormwater Protection
Right: CVWD crews installed a new,
18-inch domestic water pipe along
Bob Hope Drive in Rancho Mirage in
2007. The pipeline was tied into the existing
system to increase water pressure in the
neighborhood.
The 2007-08 Annual Review is produced by CVWD’s Communication & Legislation staff.

Page 2
General Manager’s Message
General Manager-Chief Engineer Steve Robbins visits the construction site of the Mid-Valley Pipeline Project.
The Coachella Valley is blessed with a vast, natural aquifer, which the Coachella Valley Water District has been a trusted and proven steward of the aquifer since the district was formed in 1918. But managing the aquifer is like keeping a flying airplane full of gas, without letting it land. For every new program to help reduce demand on the aquifer and every large project to increase the amount of water recharged, the efforts are countered by an ever-growing population that needs to draw upon it.
The exciting news is that two large-scale projects will soon go into operation to help ensure the long-term viability of the aquifer. One project will decrease the number of large irrigators who rely on groundwater, while the other will increase the amount of water that CVWD recharges into the aquifer. You can learn more about these projects — the Mid-Valley Pipeline and Dike 4 Recharge Facility — on Pages 5-7.
These projects are among more than 50 identified in the district’s 2002 Water Management Plan (WMP), which provides a blueprint for groundwater management of the entire Coachella Valley for the next 35 years. That document is currently being updated with public input.
In 2007, CVWD and U.S. Geological Survey released a report that confirmed subsidence is occurring throughout the valley (Page 4). Subsidence, or dropping land elevations, can reduce aquifer storage, cause earth fissures and damage buildings, roads and utility infrastructure. Subsidence is often caused by groundwater overdraft.
CVWD recharges the groundwater at four locations, two of which are through a partnership with Desert Water Agency (DWA) of Palm Springs. CVWD and DWA are the only agencies in the valley that import State Water Project water, which is used for recharge. However, the availability of this
imported water has come into question. The condition of the Sacramento-San Joaquin River Delta, for example, is expected to cut the amount of water imported into the Coachella Valley in 2007-08 by more than half. Because of a federal judge’s ruling to protect the Delta smelt, a small fish, the reduced delivery of water could be experienced for years to come. Many of the reasons for the crisis — and the solutions — are hundreds of miles away, but the impact is beginning to be felt locally.
CVWD also has Colorado River water rights. While drought along the river is cause for concern, the Coachella Valley won’t see its supply reduced unless the drought reaches catastrophic proportions. This water is used for irrigation of farms and golf courses, as well as for recharge. We don’t know what the future holds when it comes to climate changes, but the outlook doesn’t seem good.
In response to threats to the imported water supply, CVWD continues to look at other alternative sources of water to reduce dependence on the aquifer. That’s why we are testing three water treatment technologies on Colorado River water to determine the possibility of someday using it as an alternative drinking water supply (Page 23).
Everyone knows that the Coachella Valley’s aquifer is in a state of overdraft, meaning more water is taken out annually than can be replaced. In order to eliminate overdraft, CVWD believes all valley stakeholders (from residents, businesses and municipalities to farmers and golf courses) must be efficient water users, receptive to new conservation programs and supportive of the water district’s groundwater recharge efforts. You can read more about the district’s newest innovative and effective water conservation and education programs on Pages 8-9 and 16-17.
I hope you take the time to read through this report and learn more about what the water district is doing to ensure long-term water reliability for the entire valley.
Sincerely,
Steve Robbins,General Manager-Chief EngineerCoachella Valley Water District

Page 3
Water leaders converge at county symposium
General Manager-Chief Engineer Steve Robbins addresses water leaders from throughout Riverside County, who gathered at the annual symposium to discuss water issues.
Community leaders from throughout Riverside County attended the fifth annual Riverside County Water Symposium in May 2008 to discuss common challenges, successes and goals.
CVWD was one of the event’s hosts and sponsors and General Manager-Chief Engineer Steve Robbins was both a panel speaker and moderator. Panel discussions included water’s impact on economic development and a look at new technology helping to improve water conservation efforts.
A sold-out crowd of 800 business and community leaders, politicians and officials from almost every water district and agency that serves Riverside County attended the one-day event, led by the Riverside County Water Task Force.
The water district is looking into the possibility of changing to a tiered rate structure for domestic customers as a way to promote conservation. A presentation was given to the district’s board of directors in March 2008, at which time board members supported further study of how it would be implemented.
Staff is looking at a water budget-based structure, rather than a standard tier structure. A water budget-based structure provides every customer enough water to meet their indoor and outdoor needs, based on lot size and weather. Since most of the water used by a household is used outside, lot size and weather contribute significantly to the amount of water a household needs.
If the customer uses less than the budgeted amount of water, they pay the base rate. If the customer uses more than the budgeted amount of water, they pay a higher rate. There would likely be between three and five tiers of rates. All water budgets would be reasonable and attainable, if the customers irrigate efficiently.
A standard tiered system would allocate the same amount of water to condo dwellers as it would to large homeowners. However, a budget-based system takes several contributing factors into consideration, including lot size and weather.
CVWD management is looking into a tiered rate system to encourage conservation by all water users. The district’s main motivation in pursuing tiered rates is to promote conservation. Other water districts that have moved to tiered rates have experienced 22% to 37% water savings.
CVWD staff have been studying the system used by Irvine Ranch Water District, in which 80 percent of customers saw no increase in their water bill. Some people saw a decrease through a lower, incentive tier for customers who use only 40% or less of their budgeted amount of water.
District staff will spend the next several months educating valley residents about the proposed change and soliciting feedback. Staff will also be studying a proposed rate structure and means of developing water budgets. If the board approves tiered rates, they wouldn’t go into effect until 2009, at the earliest.
District studying change to tiered rates

Page 4
Groundwater Management
USGS confirms valley subsidenceA 2007 study by the U.S. Geological Survey (USGS) confirmed that land subsidence – or dropping
land elevations – is occurring in areas of substantial groundwater use throughout the Coachella Valley.The two agencies initiated the study in 1996 when CVWD first believed subsidence was occurring
in the Coachella Valley. The study confirms those assumptions and underscores the importance of eliminating overdraft of the aquifer.
Scientists with the USGS California Water Science Center used Global Positioning System (GPS) surveying and a satellite mapping process (known as interferometric synthetic aperture radar or InSAR) to document the drop in elevation between 1996 and 2005. GPS measurements are taken on the ground at specific locations, or benchmarks, while InSAR provides an areawide elevation-change map or snapshot.
At all of the GPS benchmarks, some subsidence occurred between 1996 and 2005. At three benchmarks, the drop was less than an inch, while at three others the subsidence was about a foot. At one benchmark, near the intersection of 54th Avenue and Jackson Street near Coachella, the one-foot drop in land-surface elevation happened from 2000 to 2005.
The research, which has cost about $790,000 since 1995, has been funded by the USGS and the CVWD.
Since the 1920s, groundwater has been a major source of agricultural, municipal, and domestic supply in the Coachella Valley, resulting in significant groundwater pumping that has contributed to water-level declines of as much as 100 feet. The heavy groundwater use has led to subsidence, which can cause earth fissures and damage wells, buildings, roads and utility infrastructure.
Addressing declining water levels has been a priority for CVWD since it was formed in 1918. The water district’s Water Management Plan outlines a long-term plan for eliminating overdraft through water conservation, increased use of recycled water, increasing the amount of imported water and helping nonpotable water users switch from groundwater to other sources.
The USGS report, “Detection and Measurement of Land Subsidence Using Global Positioning System Surveying and Interferometric Synthetic Aperture Radar, Coachella Valley, California, 1996-2005,” can be found at the USGS California Water Science Center’s website at http://ca.water.usgs.gov.
-100
-50
0
50
100
150
200
250
300
350
400
1940
1945
1950
1955
1960
1965
1970
1975
1980
1985
1990
1995
2000
2005
2010
2015
2020
2025
2030
2035
2040
DATE
WA
TER
SU
RFA
CE
ELE
V (F
eet)
Historic Water LevelProjected Water Level (With Water Management Plan)Projected Water Level (Without Water Management Plan)Ground Surface
Groundwater Levels near Palm Springs Cemetery
-300
-250
-200
-150
-100
-50
0
50
100
1940
1945
1950
1955
1960
1965
1970
1975
1980
1985
1990
1995
2000
2005
2010
2015
2020
2025
2030
2035
2040
DATE
WA
TER
SU
RFA
CE
ELE
V (F
eet)
Historic Water Level At Adjacent WellHistoric Water LevelProjected Water Level (With Water Management Plan)Projected Water Level (Without Water Management Plan)Ground Surface
Groundwater Levels in Indio Area

Page 5
INDIO
LA QUINTA
RESERVOIR
SURFACE SAND
PERCHED WATER
BEDROCK
INDIO CITY HALL15 ft below Sea Level
LA QUINTA CITY HALL40 ft above Sea Level
DIKE 4 RECHARGE FACILITY0-87 ft above Sea Level
ARTESIAN WELL
N
COACHELLA
MECCA
LOWER AQUIFER
MARTINEZ CANYONRECHARGE FACILITY160 ft above Sea Level
SALTON SEA
MAP NOT TO SCALE
AQUITARD - PROTECTIVE CLAY LAYER
N
Dike 4 recharge facility being expandedWork to turn the Dike 4 Groundwater Recharge
Pilot Facility into a full-scale facility is underway, with the expanded operation expected to be complete by early 2009.
The Dike 4 Groundwater Recharge Facility is one of the major groundwater replenishment projects identified in the Coachella Valley Water District’s Water Management Plan (WMP). The pilot facility has been in operation since 1994, with more than 25,000 acre-feet of water recharged to date.
When fully operational, the facility will include 39 recharge basins on 165 acres near Avenue 62, within the city of La Quinta. This facility, named after its location behind the fourth in a series of stormwater dikes, will recharge the lower portion of the Whitewater River Groundwater Subbasin with approximately 40,000 acre-feet per year.
The lower portion of the aquifer is roughly from Washington Street to the Salton Sea. It is one of four geologically divided subbasins below the Coachella Valley.
The recharge water will be imported from the Coachella Canal via a new 48-inch pipeline. The total cost of the project is approximately $40 million.
Between 1988 and 1992, CVWD conducted several subsurface investigations to determine the most favorable sites for groundwater recharge and developed a groundwater model. These subsurface studies indicated that effective groundwater recharge was limited to the Dike 4 and Martinez Canyon areas. Suitable sites for recharge in the lower portion of the Whitewater River Groundwater Subbasin were further evaluated in the WMP and found to be limited to the extreme edges of the valley where recharge is not prevented by the presence of deep clay layers.
A successful pilot facility is also currently in operation at the Martinez Canyon site. Long-term plans call for it to be expanded into a full-scale facility, capable of recharging roughly 40,000 acre-feet of water annually, in approximately 2014.
The physics of groundwater recharge explain how the Dike 4 and Martinez Canyon Groundwater Recharge Facilities benefit the entire east valley.
By early 2009, the Dike 4 Groundwater Recharge Facility, located in south La Quinta, will be fully operational.
HOW RECHARGE BENEFITS THE LOWER PORTION OF THE GROUNDWATER SUBBASIN
Imagine the lower portion of the Whitewater River Groundwater Subbasin as
an air mattress. Now, imagine the air mattress laying on a surface that dips in the middle and is on a slight incline.
If you use a hose to slowly fill the mattress with water, the portion at the lowest elevation will fill up first. Then, the pressure will eventually force the water outward to fill the entire mattress.
Page 6
Mid-Valley Pipeline
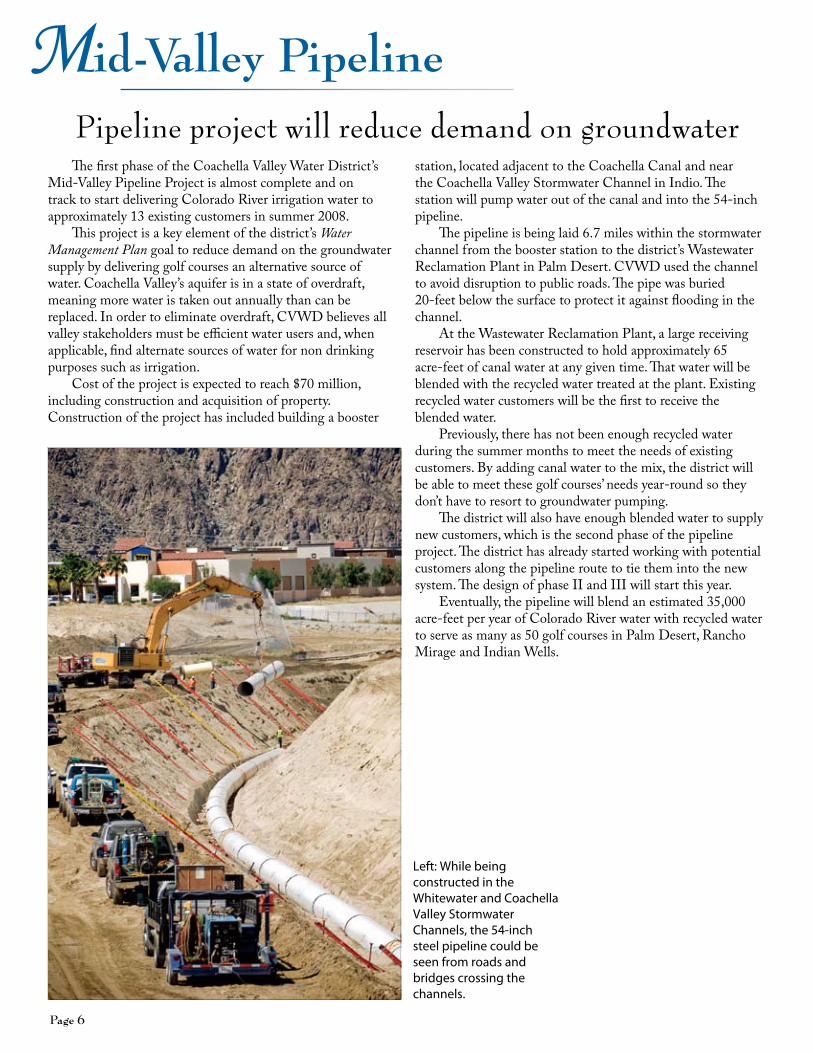
The first phase of the Coachella Valley Water District’s Mid-Valley Pipeline Project is almost complete and on track to start delivering Colorado River irrigation water to approximately 13 existing customers in summer 2008.
This project is a key element of the district’s Water Management Plan goal to reduce demand on the groundwater supply by delivering golf courses an alternative source of water. Coachella Valley’s aquifer is in a state of overdraft, meaning more water is taken out annually than can be replaced. In order to eliminate overdraft, CVWD believes all valley stakeholders must be efficient water users and, when applicable, find alternate sources of water for non drinking purposes such as irrigation.
Cost of the project is expected to reach $70 million, including construction and acquisition of property. Construction of the project has included building a booster
station, located adjacent to the Coachella Canal and near the Coachella Valley Stormwater Channel in Indio. The station will pump water out of the canal and into the 54-inch pipeline.
The pipeline is being laid 6.7 miles within the stormwater channel from the booster station to the district’s Wastewater Reclamation Plant in Palm Desert. CVWD used the channel to avoid disruption to public roads. The pipe was buried 20-feet below the surface to protect it against flooding in the channel.
At the Wastewater Reclamation Plant, a large receiving reservoir has been constructed to hold approximately 65 acre-feet of canal water at any given time. That water will be blended with the recycled water treated at the plant. Existing recycled water customers will be the first to receive the blended water.
Previously, there has not been enough recycled water during the summer months to meet the needs of existing customers. By adding canal water to the mix, the district will be able to meet these golf courses’ needs year-round so they don’t have to resort to groundwater pumping.
The district will also have enough blended water to supply new customers, which is the second phase of the pipeline project. The district has already started working with potential customers along the pipeline route to tie them into the new system. The design of phase II and III will start this year.
Eventually, the pipeline will blend an estimated 35,000 acre-feet per year of Colorado River water with recycled water to serve as many as 50 golf courses in Palm Desert, Rancho Mirage and Indian Wells.
Left: While being constructed in the Whitewater and Coachella Valley Stormwater Channels, the 54-inch steel pipeline could be seen from roads and bridges crossing the channels.
Pipeline project will reduce demand on groundwater

Giving golf courses an alternative source of water
Left: A pumping station was constructed to pull Colorado River water from the Coachella Canal and pump it into the pipeline.
Below left: 20 feet below the surface, workers securely weld the pieces of steel pipe together.
Below: After the pipe was constructed, dirt is placed and compacted on top to ensure the pipe won’t be affected by flooding or erosion.
Above: The receiving reservoir in Palm Desert will hold Colorado River water until it can be blended with recycled water and sent to golf courses.
Right: The pipeline is expected to deliver 35,000 acre-feet of irrigation water to golf courses annually, saving enough precious groundwater to serve approximately 35,000 households.
Page 8
ConservationLandscape ordinance
revised for more efficiencyIn August 2007, the district revised its landscape ordinance to
require all new developments and golf courses to use more water-efficient landscaping and smart controllers in an effort to conserve water. In order to protect the aquifer, all categories of water users are being asked to do their part to conserve.
Originally adopted in 2003, the ordinance has three key objectives: reduce overall water use; eliminate water waste flowing down the streets; and establish limited grass allowances for new golf courses. The following are some of the ordinance’s requirements:
• New developments must use irrigation systems run by smart controllers, such as weather-based controllers that self-adjust based on the climate changes.
• Grass areas in new developments that are irrigated with a spray system must be set back 2 feet from curbs, driveways and sidewalks in an effort to eliminate water runoff on sidewalks and streets.
• The maximum water allowance for landscapes in new developments has been reduced, which further restricts the amount of water use. Golf courses are limited to four acres of grass on average per golf hole and 10 acres of grass for the driving range and practice areas.
The new requirements apply only to new and rehabilitated golf courses and developments (including housing developments with five or more homes) within CVWD’s boundaries. The ordinance does not apply to existing developments or single-family homes where the homeowner provides the landscaping.
In drafting the revised ordinance, staff solicited input and support from representatives of the Building Industry Association, golf course superintendents, other area water districts, landscape architects and local municipalities.
We want to help you convert to water-efficient
landscapingThe majority of water being used by average Coachella Valley homeowners is used outside, therefore a major aspect of the district’s conservation efforts focuses on water-efficient landscaping. Here are some resources:
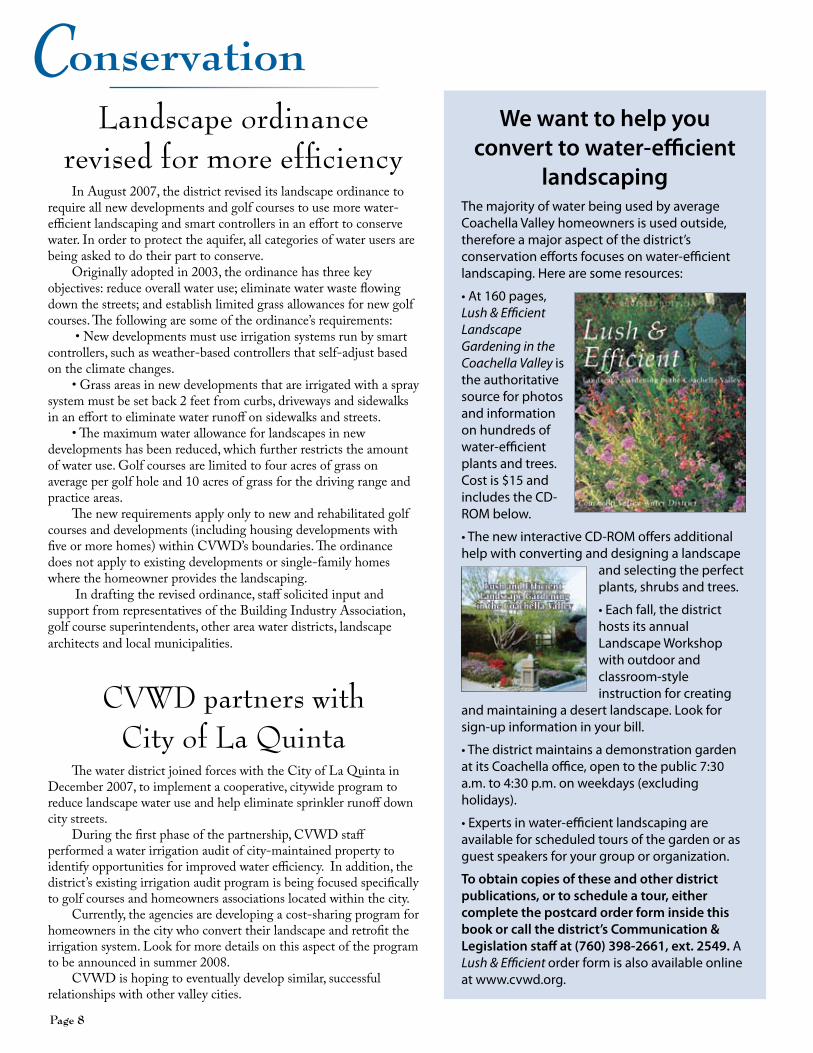
• At 160 pages, Lush & Efficient Landscape Gardening in the Coachella Valley is the authoritative source for photos and information on hundreds of water-efficient plants and trees. Cost is $15 and includes the CD-ROM below.
• The new interactive CD-ROM offers additional help with converting and designing a landscape
and selecting the perfect plants, shrubs and trees.
• Each fall, the district hosts its annual Landscape Workshop with outdoor and classroom-style instruction for creating
and maintaining a desert landscape. Look for sign-up information in your bill.
• The district maintains a demonstration garden at its Coachella office, open to the public 7:30 a.m. to 4:30 p.m. on weekdays (excluding holidays).
• Experts in water-efficient landscaping are available for scheduled tours of the garden or as guest speakers for your group or organization.
To obtain copies of these and other district publications, or to schedule a tour, either complete the postcard order form inside this book or call the district’s Communication & Legislation staff at (760) 398-2661, ext. 2549. A Lush & Efficient order form is also available online at www.cvwd.org.
CVWD partners with City of La Quinta
The water district joined forces with the City of La Quinta in December 2007, to implement a cooperative, citywide program to reduce landscape water use and help eliminate sprinkler runoff down city streets.
During the first phase of the partnership, CVWD staff performed a water irrigation audit of city-maintained property to identify opportunities for improved water efficiency. In addition, the district’s existing irrigation audit program is being focused specifically to golf courses and homeowners associations located within the city.
Currently, the agencies are developing a cost-sharing program for homeowners in the city who convert their landscape and retrofit the irrigation system. Look for more details on this aspect of the program to be announced in summer 2008.
CVWD is hoping to eventually develop similar, successful relationships with other valley cities.
Page 9
CVWD launched a new pilot program in 2007 to help large landscape customers, such as homeowner associations, reduce water waste and subsequently lower their monthly water bills.
The Large Landscape Smart Controller Rebate Pilot Program helps participants reduce landscape irrigation water use by offering a rebate for the installation of smart controllers.
Smart controllers save water by self-adjusting according to weather. For example, they are programmed to reduce irrigation in the fall and winter, whereas many homeowners and gardeners will keep a controller set to summer watering needs for the entire year.
The City of Indian Wells was one of the first participants, replacing all irrigation controllers around City Hall, in medians and other city-owned property. Other eligible participants include homeowner associations, schools, large churches and businesses.
Participants are responsible for purchasing and installing the smart controllers while district staff will inspect the installation and verify proper programming. Follow-up inspections and a one-year evaluation will also be available.
The rebate, based on the size of the landscaped area, is up to $750 per irrigated acre or 50 percent of the cost of the controller, whichever is less.
Water Management staff estimate the Large Landscape Smart Controller Rebate Pilot Program will save approximately 263 acre-feet of water annually.
This new program builds upon the success of the existing residential smart controller program for single-family homes, in which the water district and participating cities subsidize approximately 75 percent of the cost of the controller. Additionally, district staff install and program the controller to ensure maximum benefit.
More than 500 controllers have been installed to date with participants saving an average 30 percent on their water bill. Started as a pilot program in 2005, the residential smart controller program garnered CVWD a 2008 Community Service/Resource Efficiency Award from the California Municipal Utilities Association.
The annual award recognizes “innovative and effective programs that implement practices designed to save or efficiently use water resources.”
Smart controller program extended to large customers; garners statewide award
Anyone interested in participating in either the residential or large landscape smart controller programs, must first complete an application,
available at www.cvwd.org/conservation/conservation.php. In the meantime, use the irrigation guide below as a reminder to adjust
your irrigation system regularly.
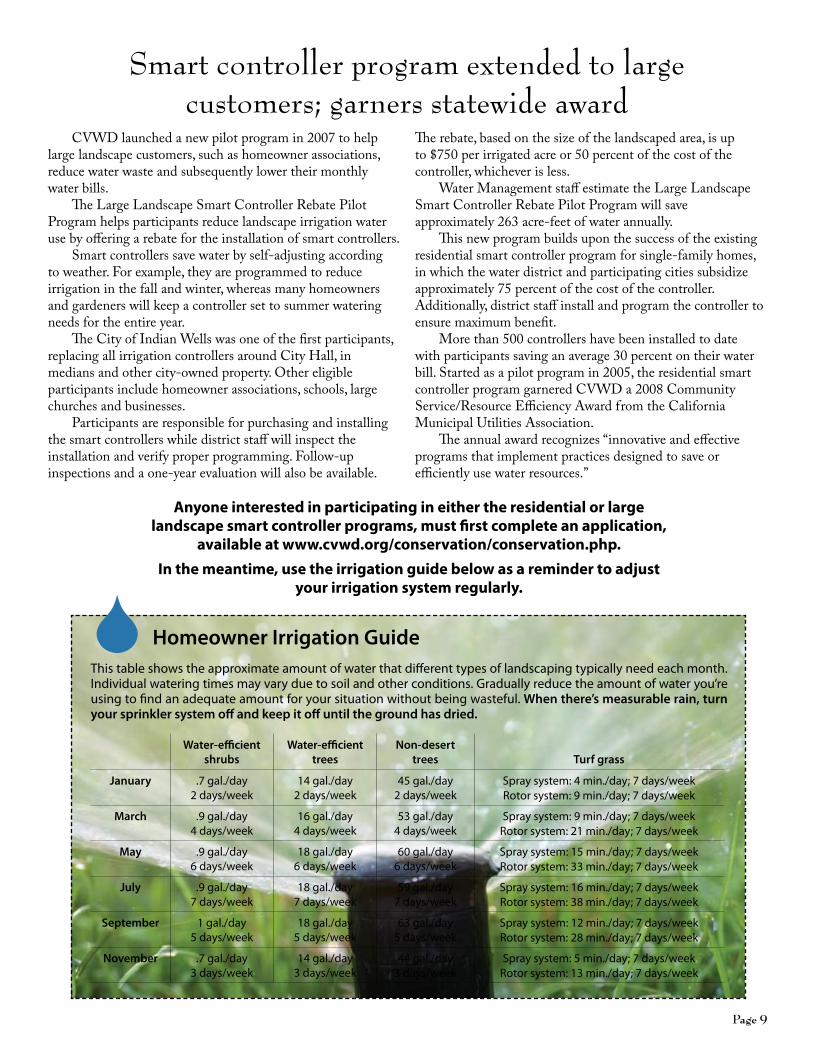
This table shows the approximate amount of water that different types of landscaping typically need each month. Individual watering times may vary due to soil and other conditions. Gradually reduce the amount of water you’re using to find an adequate amount for your situation without being wasteful. When there’s measurable rain, turn your sprinkler system off and keep it off until the ground has dried.
Homeowner Irrigation GuideWater-efficient
shrubsWater-efficient
treesNon-desert
trees Turf grass
January .7 gal./day2 days/week
14 gal./day2 days/week
45 gal./day2 days/week
Spray system: 4 min./day; 7 days/weekRotor system: 9 min./day; 7 days/week
March .9 gal./day4 days/week
16 gal./day4 days/week
53 gal./day4 days/week
Spray system: 9 min./day; 7 days/weekRotor system: 21 min./day; 7 days/week
May .9 gal./day6 days/week
18 gal./day6 days/week
60 gal./day6 days/week
Spray system: 15 min./day; 7 days/weekRotor system: 33 min./day; 7 days/week
July .9 gal./day7 days/week
18 gal./day7 days/week
59 gal./day7 days/week
Spray system: 16 min./day; 7 days/weekRotor system: 38 min./day; 7 days/week
September 1 gal./day5 days/week
18 gal./day5 days/week
63 gal./day5 days/week
Spray system: 12 min./day; 7 days/weekRotor system: 28 min./day; 7 days/week
November .7 gal./day3 days/week
14 gal./day3 days/week
44 gal./day3 days/week
Spray system: 5 min./day; 7 days/weekRotor system: 13 min./day; 7 days/week
Page 10
Water Quality
Delivering high quality water is top priorityCoachella Valley Water District is committed to delivering
high quality drinking water that meets stringent government standards. This annual report documents that the water served to all CVWD water users (obtained from wells drilled into the Coachella Valley’s vast groundwater basin) meets all drinking water standards.
The district’s Water Quality staff is tasked with ensuring that the drinking water meets all state and federal drinking water quality standards. These highly trained employees monitor the water systems and collect drinking water samples that are tested at the district’s state-certified laboratory. A few specialized tests are performed by other certified laboratories. In addition to the detected constituents listed in the table on pages 12-13, CVWD’s water quality staff monitors for more than 100 other regulated and unregulated chemicals. All of these are below detection levels in CVWD’s domestic water.
CVWD is governed by a locally elected, five-member board of directors who normally meet in public session at 9 a.m., on the second and fourth Tuesdays of each month at the district’s Coachella office at Avenue 52 & Highway 111.
While all of CVWD’s domestic water supply meets current requirements, drinking water supplied to some service areas does contain low levels of naturally occurring arsenic. The arsenic standard balances the current understanding of arsenic’s possible health effects against the costs of removing arsenic from drinking water. The U.S. Environmental Protection Agency continues to research the health effects of low levels of arsenic, which is a mineral known to cause cancer in humans at high concentrations and is linked to other health effects such as skin damage and circulatory problems.
With respect to the presence of arsenic in drinking water in excess of 10 ug/L but less than 50 ug/L — the state Department of Public Health warns that some people who drink water containing arsenic in excess of the maximum contaminant level (MCL) over many years could experience skin damage or problems with their circulatory system, and may have an increased risk of getting cancer.
All drinking water delivered by CVWD last year meets
the 10 ug/L standard.Radon is a naturally occurring, radioactive gas —
a by-product of uranium — that originates underground but is found in the air. Radon moves from the ground into homes primarily through cracks and holes in their foundations. While most radon enters the home through soil, radon from tap water typically is less than two percent of the radon in indoor air.
The U.S Environmental Protection Agency (USEPA) has determined that breathing radon gas increases an individual’s chances of developing lung cancer, and has proposed a maximum contaminant level of 300 picoCuries per liter (pCi/L) for radon in drinking water. This proposed standard is far less than the 4,000 pCi/L in water that is equivalent to the radon level found in outdoor air. The radon level in district wells ranges from none detected to 460 pCi/L, significantly lower than that found in the air you breathe.
Nitrate in drinking water at levels above 45 milligrams per liter (mg/L) is a health risk for infants younger than six months old. High nitrate levels in drinking water can interfere with the capacity of the infant’s blood to carry oxygen, resulting in serious illness; symptoms include shortness of breath and blueness of skin. Nitrate levels above 45 mg/L may
Continued on next page
To receive a summary of the district’s source water assessments, or for additional water quality data
or clarification, readers are encouraged to call the district’s Water Quality staff at (760) 398-2651.
Complete copies of source water assessments may be viewed at the Coachella Valley Water District
office, 85-995 Avenue 52, Coachella, CA 92236.
Este informe contiene información muy importante sobre su agua potable. Tradúzcalo ó hable con alguien que lo entienda bien. También puede llamar al distrito
de agua al número de teléfono (760) 398-2651.
“Some people may be more vulnerable to contaminants in drinking water than the general population. Immuno-compromised persons such as persons with cancer undergoing chemotherapy, persons who have undergone
organ transplants, people with HIV/AIDS or other immune system disorders, some elderly, and infants can be particularly at risk from infections.
These people should seek advice about drinking water from their health care providers.
USEPA/Centers for Disease Control (CDC) guidelines on appropriate means to lessen the risk of infection by Cryptosporidium and other microbial contaminants are available from the Safe Drinking Water Hotline
1-800-426-4791 or www.epa.gov/safewater.”
—California Department of Public Health Services

Page 11
Earlier this year, CVWD received results from an American Water Works Association research study to determine if pharmaceutical drugs and other specific compounds occur in drinking water at levels associated with health affects.
The nationwide research study, which attracted national media attention, concluded that pharmaceuticals and other compounds studied, when present in drinking water, occur in insignificantly low amounts.
Two of CVWD’s wells were tested as part of the study. In one well, no compounds were detected. In the other well, three compounds were found in the parts-per-trillion range. For the compounds found in this well, a person would have to drink 9,000 to 18 million liters of water each day over a lifetime before consuming an amount that researchers determined might cause health effects.
The study was initiated by the water industry because the long-term health effects of exposure to these miniscule amounts of pharmaceuticals has yet to be studied. Water agencies are not required to test drinking water for pharmaceuticals and only research laboratories like the ones that participated in this study are able to perform these advanced tests. CVWD does test more than 20,000 water samples annually to ensure compliance with all state and federal drinking water standards.
Level of pharmaceuticals in drinking water insignificant
Assistant General Manager Mark Beuhler fields media questions about pharmaceuticals in the drinking water.
Continued from previous page
Continued on Page 14
also affect the ability of the blood to carry oxygen in other individuals, such as pregnant women and those with certain enzyme deficiencies. If you are caring for an infant, or you are pregnant, you should ask advice from your health care provider.
Groundwater nitrate is the most closely monitored chemical in drinking water and nitrate levels do not change quickly in the district’s deep wells used to supply drinking water. If the nitrate level in a well begins to increase, CVWD increases its monitoring frequency and, if necessary, wells are taken out of service before they exceed the standard.
As noted, all drinking water served by CVWD comes from wells. The California Department of Public Health requires water agencies to state, however, “the sources of drinking water (both tap water and bottled water) include rivers, lakes, streams, ponds, reservoirs, springs and wells. As water travels over the surface of the land or through the ground, it dissolves naturally occurring minerals and, in some cases, radioactive material, and can pick up substances resulting from the presence of animals or from human activity.”
“Contaminants that may be present in source water include:“• Microbial contaminants, such as viruses and bacteria,
that may come from sewage treatment plants, septic systems, agricultural livestock operations and wildlife.
“• Inorganic contaminants, such as salts and metals, that can be naturally occurring or result from urban stormwater runoff, industrial or domestic wastewater discharges, oil and gas production, mining or farming.
“• Pesticides and herbicides that may come from a variety of sources such as agriculture, urban stormwater runoff and residential uses.
“• Organic chemical contaminants, including synthetic and volatile organic chemicals, that are by-products of industrial processes and petroleum production, and can also come from gas stations, urban stormwater runoff and septic systems.
“• Radioactive contaminants that can be naturally occurring or be the result of oil and gas production and mining activities.
“In order to ensure that tap water is safe to drink, USEPA and the state Department of Public Health (Department) prescribe regulations that limit the amount of certain contaminants in water provided by public water systems.”
Department regulations also establish limits for contaminants in bottled water that must provide the same protection for public health. “Drinking water, including bottled water, may reasonably be expected to contain at least small amounts of some contaminants. The presence of contaminants does not necessarily indicate that water poses a health risk. More information about contaminants and potential health effects can be obtained by calling the USEPA’s Safe Drinking Water Hotline (1-800-426-4791).”
Drinking Water Source Water AssessmentsThe district has conducted source water assessments that
provide information about the vulnerability of district wells to

Page 12 Page 13
Definitions & AbbreviationsAI or Aggressive Index — This is a measurement
of corrosivity. Sources with AI values of 12 or greater are non-corrosive. AI values between 10 and 12 are moderately corrosive and AI values less than 10 are corrosive.
AL or Regulatory Action Level — The concentration of a contaminant which, if exceeded, triggers treatment or other requirements which a water system must follow.
MCL or Maximum Contaminant Level — The highest level of a contaminant that is allowed in drinking water. Primary MCLs are set as close to public health goals or maximum contaminant level goals as economically and technologically feasible. Secondary MCLs are set to protect the odor, taste and appearance of drinking water.
MCLG or Maximum Contaminant Level Goal — Level of a contaminant in drinking water below which there is no known or expected risk to health. MCLGs are set by the U.S. Environmental Protection Agency.
mg/L — Milligrams per liter (parts per million)
MRDL or Maximum Residual Disinfectant Level — The level of a disinfectant added for water treatment that may not be exceeded at the consumer’s tap.
MRDLG or Maximum Residual Disinfectant Level Goal — The level of a disinfectant added for water treatment below which there is no known or expected risk to health. MRDLs are set by the U.S. Environmental Protection Agency.
N/A — Not applicable
NA — Not analyzed
ND — None detected
NL or Notification Level — Health based advisory level established by the California Department of Health Services for chemicals in drinking water that lack maximum containment levels (MLCs) as stated by CDHS.
None — The government has not set a Public Health Goal or Maximum Contaminant Level for this substance.
NTU — Nephelometric turbidity units (measurement of suspended material)
pCi/L — picoCuries per liter
PDWS or Primary Drinking Water Standard — MCLs and MRDLs for contaminants that affect health along with their monitoring and reporting requirements, and water treatment requirement.
PHG or Public Health Goal — Level of a contaminant in drinking water below which there is no known or expected risk to health. Public Health Goals are set by the California Environmental Protection Agency.
Secondary Drinking Water Standard — Based on aesthetics, these secondary maximum contaminant levels have monitoring and reporting requirements specified in regulations.
ug/L—Micrograms per liter (parts per billion)
uS/cm — Microsiemens per centimeter
Footnotes
(1) Includes the communities of Rancho Mirage, Thousand Palms, Palm Desert, Indian Wells, La Quinta and portions of Bermuda Dunes, Cathedral City and Riverside County.
(2) Effective Jan. 23, 2006, the federal arsenic MCL is 0.010 mg/L (or 10 ug/L). The initial compliance determination for this MCL began September 2007 for sources serving Mecca and Valerie Jean. A new state MCL has not yet been adopted and remains as 0.05 mg/L (or 50 ug/L).
(3) Unregulated contaminants are those for which EPA and the California Department of Health Services have not established drinking water standards. The purpose of unregulated contaminant monitoring is to assist both regulatory agencies in determining the occurrence of unregulated contaminants in drinking water and whether future regulation is warranted.
(4) The reported average represents the highest running annual average based on distribution system monitoring.(5) Reported values are 90th percentile levels for samples collected from faucets in water user homes. No sample exceeded
the regulatory action level.(6) Systems that collect more than 39 samples per month; (7) Systems that collect less than 40 samples per month.
1
Detected parameter, units
2
PHG or (MCLG)
3
Primary or (secondary)
MCL
4
Cove Communities (1)
Range (Average)
5
Indio Hills, Sky Valley & areas around
Desert Hot SpringsRange (Average)
6
Mecca, Bombay Beach, North Shore & Hot Mineral Spa
Range (Average)
7
Desert Shores, Salton Sea Beach
& Salton CityRange (Average)
8
Valerie JeanRange (Average)
9
ThermalRange (Average)
10
Major Source(s)
Aluminum, mg/L 0.6 1.0, (0.2) ND-1.6 (ND) Erosion of natural deposits
Arsenic, ug/L(2) 0.004 10 ND-4.7 (ND) ND-13 (5.4) ND-15 (7.9) 2.0-2.2 (2.1) Erosion of natural deposits
Boron, mg/L (3) None NL=1.0 0.3-0.4 (0.4) Erosion of natural deposits
Chloride, mg/L None (500) 6.7-49 (15) 12-22 (17) 6.4-62 (28) 180-270 (220) 7.5-8.8 (8.2) 7.5-17 (12) Leaching from natural deposits
Chlorine (as Cl2), mg/L (4) MRDLG 4.0
MRDL4.0 ND-2.1 (0.3) 0.1-0.6 (0.3) ND-1.2 (0.3) ND-0.9 (0.2) ND-0.5 (0.4) ND-0.3 (0.2) Result of drinking water chlorination
Chromium, ug/L (100) 50 ND-19 (ND) 13-20 (17) 14-18 (16) ND-19 (ND) Erosion of natural deposits
Chromium VI, ug/L (3) None None 1.5-18 (8.3) 9.1-19 (15) ND-6.7 (3.4) 8.1-13 (11) 21-22 (22) Erosion of natural depositsCopper, mg/L (5) [homes tested/ sites exceeding AL]
0.17 AL=1.3 0.12[55/0]
0.96[20/0]
0.13[22/0] Internal corrosion of household plumbing
Copper, mg/L None (1.0) ND-0.1 (ND) Leaching from natural deposits
Corrosivity, AI None (Non-corrosive) 11-13 (12) 12 11-12 (12) 12 11-12 (11) 12 Natural balance of hydrogen, carbon and oxygen
Fluoride, mg/L 1 2.0 ND-1.0 (0.5) 0.4-0.7 (0.5) 0.9-1.1 (1.0) 0.2-1.6 (0.9) 0.7-0.9 (0.8) 0.6-1.1 (0.9) Erosion of natural depositsGross alpha particle activity, pCi/L (Zero) 15 ND-13 (3.9) 3.5-14 (7.5) ND-3.0 (ND) ND-9.4 (4.2) ND-4.2 (ND) ND-4.8 (ND) Erosion of natural deposits
Hardness (as CaCO3), mg/L None None 27-310 (120) 120-200 (170) 14-20 (17) 170-230 (200) 9.6-16 (13) 25-57 (41) Erosion of natural deposits
Iron, ug/L None (300) ND-1.8 (ND) Leaching from natural depositsLead, ug/L (5)
[homes tested/ sites exceeding AL]2 AL=15 1.6
[55/ 0]Internal corrosion of household plumbing
Nitrate (as NO3), mg/L 45 45 ND-40 (6.0) ND-6.2 (3.8) 4.4-7.7 (5.7) ND-3.0 (ND) Leaching of fertilizer, animal waste, natural depositsOdor threshold, units None (3) ND-1.0 (ND) ND-1.0 (ND) Naturally occurring organic materials
pH, units None None 7.2-8.3 (7.8) 7.7-7.9 (7.8) 6.9-8.9(8.2) 7.7-8.0 (7.8) 8.8-9.1 (9.0) 7.7-8.0 (7.9) Physical characteristic
Sodium, mg/L None None 17-58 (28) 58-80 (66) 42-56 (46) 200-230 (220) 43-47 (44) 37-50 (44) Erosion of natural deposits
Specific conductance, uS/cm None (1,600) 220-730 (370) 570-780 (660) 240-320 (260) 1,400-1,700 (1,500) 220-240 (230) 260-300 (280) Substances that form ions when in water
Sulfate, mg/L None (500) 11-160 (38) 150-220 (170) 0.6-30 (15) 200-300 (240) 18-23 (20) 28-32 (30) Leaching from natural deposits
Tetrachloroethylene (PCE), ug/L 0.06 5 ND-1.5 (ND) Discharge from dry cleaners and auto shops
Total Coliform bacteria, positive samples/month (0) more than 5%(6)
more than 1(7)ND-0.5 (ND)
ND-1(ND)Naturally present in the environment
Total dissolved solids, mg/L None (1,000) 130-480 (220) 370-520 (430) 110-190 (150) 800-990 (880) 120-150 (140) 150-170 (160) Leaching from natural deposits
Total trihalomethanes, ug/L(4) None 80 1.8-2.9 (2.4) 7.1 1.4 4.8 9.4 0.7 By-product of drinking water chlorination
Turbidity, NTU None (5) ND-2.4 (ND) ND-1.3 (0.3) Leaching from natural deposits
Uranium, pCi/L 0.43 20 ND-12 (4.0) ND-11 (5.6) ND-2.6 (ND) 2.4-5.3 (3.6) 2.6-5.0 (3.8) 3.1-3.8 (3.5) Erosion of natural deposits
Vanadium, ug/L (3) None NL=50 4-39 (13) 5.8-26 (14) ND-19 (7.0) 6-21 (15) 20-34 (26) 22-25 (24) Erosion of natural deposits
CVWD 2007 domestic water quality summary
Page 13Page 12
CVWD analyzes more than 22,000 water samples annually to ensure that your drinking water meets state and federal standards. Every year, the district is required to analyze a select number of these samples for more than 100 regulated and unregulated substances. This chart lists those substances that were detected in the district’s six service areas. Shaded boxes indicate no substance was detected. The data on the chart, which summarizes results of the most recent monitoring completed between 1999 and 2007, shows that CVWD continues to deliver drinking water that meets all water quality standards.
To read this chart: First, determine in which service area you live (columns 4-9). Then move down the column, comparing the detection level of each chemical or other contaminant with the Public Health Goal, Maximum Contaminant Level Goal and Maximum Contaminant Level (columns 2-3). For example, if you live in La Quinta and want to know the level of fluoride detected in your service area, you would look down the Cove Communities column and stop at the fluoride row. The average fluoride level in that service area is 0.5 mg/L with the range of results varying between no detection and 1.0 mg/L. Compare these values to the MCL in Column 3. Fluoride levels in this water comply with the MCL of 2.0 [mg/L]. The range can show a level above the MCL and still comply with the drinking water standard when compliance is based on average levels found in each water source.

Page 14
contamination. In 2002, CVWD completed a comprehensive source water assessment that evaluated all groundwater wells supplying the district’s six public water systems. An assessment is performed on each new well added to CVWD’s system. Groundwater from these district wells are considered vulnerable to activities associated with urban and agricultural uses.
Urban land uses include the following activities: known contaminant plumes, dry cleaners, underground storage tanks, septic systems, automobile gas stations (including historic),
Continued from Page 11 automobile repair shops, historic waste dumps/landfills, illegal/unauthorized dumping, sewer collection systems and utility stations’ maintenance areas.
Agricultural land uses include the following activities: irrigation/agricultural wells, irrigated crops, pesticide/fertilizer/petroleum and transfer areas. The following activities have been associated with detected contaminants: known contaminant plumes, dry cleaners and irrigated crops.
The drinking water supplied by CVWD’s wells to our communities complies with all state and federal drinking water standards.
Emergency Preparedness & Drinking WaterIn the event of a natural disaster, such as an earthquake or flooding, Coachella Valley Water District’s water delivery system could be compromised and you could be advised not to drink the water. The following information will help guide you through such an emergency.
How do I know if my tap water becomes unsafe to drink?In the event of an emergency, CVWD may issue a boil water notice as a precautionary measure if water quality is in doubt. CVWD will test the water for contaminants. If the water is deemed unhealthful, a boil water notice will be issued until the problem is located and solved, and the water is tested again and shown to meet specific state and federal quality standards. Notification will be made through the media, the district’s web site (www.cvwd.org), posted fliers in public spaces and other means.
If my drinking water is unsafe, what do I do?1. You’re first choice for replacing tap water for drinking and cooking should be commercially bottled water. Everyone should include in their emergency supply kit a three to five day supply of bottled water (at least one gallon of water per person per day, plus extra water for pets). If you use your own storage containers, place a date on the outside, store in a cool, dark place and replace every six months. Bottled water can keep longer, but check the expiration date and replace as needed.
2. If you don’t have bottled water, you should use boiled tap water. Boiling water will kill most types of disease-causing organisms. If the water is unusually cloudy, murky or colored, filter it first through a clean cloth or allow it to settle and draw off the clear water for boiling. Then, bring to a rolling boil and leave for one minute.
3. If you’re unable to boil water, you’re next best choice is to disinfect it with household bleach. Bleach will kill some (but not all) types of disease-causing organisms. If the water is unusually cloudy, murky or colored, filter it first through a clean cloth or allow it to settle and draw off the clear water for disinfection. Then, add 1/8 teaspoon (or 8 drops) of regular, unscented liquid household bleach for each gallon of water, stir well and let it stand for 30 minutes before using. Store disinfected water in clean containers with covers.
Do not use scented, powdered or swimming pool bleach since these products may contain dangerous chemicals. A faint chlorine smell is normal.

Page 15
Wastewater Collection
A 3.5-mile sewer project to accommodate rapid development and future growth in northern Palm Desert, Rancho Mirage and Cathedral City, was completed in November 2007.
The 19-month sewer project included installation of a new, 33-inch sewer pipeline from the water district’s Wastewater Reclamation Plant on Cook Street, through busy Palm Desert streets to the intersection of Monterey Avenue and Country Club Drive.
Construction required significant lane closures along city streets to accommodate trenching to a depth of 24 feet in some locations. The project encountered some challenges along the way, including unexpected conflicts with underground utilities.
Cost of the project ended at approximately $16 million. Large sewer projects are funded through the district’s Sanitation Capacity Charge, a one-time sewer connection fee paid by homeowners and business customers when they first connect to the district’s sanitation system.
The district’s Sanitation System Master Plan is expected to be complete in mid-2008, providing a long-term blueprint for wastewater service within the district’s boundaries.
One of the key components to developing the Master Plan was a hydraulic model, providing a computer simulation model of the entire collection system. It then compared the system’s capabilities with population projections to help foresee sanitation needs into the year 2030.
As of Dec. 30, 2007, the Coachella Valley Water District provided sanitation service to approximately 97,000 homes and businesses in Cathedral City, Rancho Mirage, Palm Desert, Indian Wells, La Quinta and unincorporated areas of Riverside County. CVWD first started collecting wastewater in 1968 when it took over operation of a small, existing system in Palm Desert Country Club.
Carollo Engineers of Irvine is developing the initial Master Plan, which will be an evolving document that’s updated and revised regularly as the sanitation system is expanded and upgraded. The document has been two and one-half years in the making.
CVWD is already utilizing the data in the Master Plan to better determine priorities for future expansion and improvement projects to the sewer system. For example, the Avenue 62 corridor from La Quinta through Thermal is an area where a number of future developments are planned, but the existing system would not be able to accommodate them.
The design work has been completed for a 42-inch sewer pipeline along Avenue 62 from Monroe Street to the district’s Wastewater Reclamation Plant at Fillmore Street. Construction on this project is expected to start this summer.
Master Plan facilitates future planning
Sewer projects needed to serve growing population

Page 16
Public Outreach
In 2007 the Coachella Valley Water District celebrated 21 years of promoting and teaching desert landscaping through a combination of outdoor and classroom-style settings.
On average, the annual Landscape Workshop accommodates about 400 attendees over a two-day period. The workshop is a collaborative effort with experts from CVWD, The Living Desert and other valley agencies.
Teaching and promoting desert landscaping is key to the CVWD’s conservation efforts. The workshop features presentations by experts on desert landscape design, plant selection for low water-use gardens, desert horticultural techniques and efficient irrigation techniques. The information is educational for landscape professionals and home gardeners alike.
Outdoor water use can account for as much as 80 percent of a home’s water consumption. Workshop attendees receive valuable information to help develop and care for their desert gardens with the attractiveness of water-efficient plants. Look for sign up information in your water bill this fall.
New website devoted to kids
In addition to our two teachers, CVWD now has a website devoted to educating kids, teachers and parents about water-related issues.
The website has fun educational games, experiments, informative videos and teacher resources. The website covers information on water science, trivia and history. Kids can use the site as a resource, for research and information on water related school projects and reports. Teachers can use the site as a resource for incorporating water education into everyday lessons.
CVWD’s main site has undergone recent improvements, as well. The site is easier to navigate and contains more useful water conservation information. You will find water conservation tips, daily irrigation schedules, local events and issues, tools for educators, public documents, daily weather forecasts, information about the district’s weather-based controller program and more.
Landscape workshop celebrates 21 years
Main website: www.cvwd.org
Kid’s website: www.waterfun4kids.org
Spencer Knight, landscape manager for the City of Palm Desert, is among the experts who regularly lead workshops at the annual event.

Page 17
Museum features water exhibit
Popular among visitors and new residents looking to learn something about the history of their new community is the docent-operated Palm Desert Historical Society Museum.
The water district recently was invited to design and install an exhibit, which focuses on the history of water use in the valley, a profile of those who use our area’s most precious resource and a map detailing locations important to the delivery of water and related services to homes, farms and other businesses. The exhibit, located in a former fire station packed with artifacts, photographs and printed materials, also features a video.
The museum is located at 72-861 El Paseo Drive, not far from the famed shopping district. Call (760) 346-6588 for hours of operation and additional information.
Agencies work together for common message
In 2008, the district entered a cooperative partnership with other water providers in the Coachella Valley to send a unified message in promoting water conservation.
The group created a billboard to create awareness of wasted water on city streets and sidewalks. The billboard, which went up in January near the intersection of Dinah Shore and Date Palm drives in Cathedral City, will rotate during the year to six locations throughout the Coachella Valley.
The billboard featured the group’s new mascot, Sandy Lizard. All the valley water providers also participated in The Living Desert’s 2008 Party for the Planet event to celebrate Earth Day. In addition to CVWD, the group is comprised of representatives from Desert Water Agency, Mission Springs Water District and the cities of Coachella and Indio.
Hal Rover and Barbara Keedy, past and current presidents of the Palm Desert Historical Society, respectively, view the water district display at the docent-operated museum.

Page 18
(1) This table represents proposed water rates for the 2008-09 fiscal year. At the time this publication was printed, the water district’s board of directors had not yet approved the rate structure. Approval was pending the outcome of a public hearing and protest period. For confirmation of the most up-to-date rates, call CVWD at (760) 398-2651 or go online to www.cvwd.org/service/rates.php.
Coachella Valley Water District strives to keep water consumer rates low through fiscal responsibility and sensible financial management policies. In June 2008, the board of directors considered a $277 million budget for the 2008-09 fiscal year,
which includes approximately $62 million in capital improvements. The budget represents a 30 percent cut in spending from the prior year. The reductions were necessary to help offset the increasing costs of fuel, electricity and other factors.
Paying your bill• Water users can now pay their bills using
convenient drop boxes available at both the Palm Desert and Coachella offices (75-525 Hovley Lane East in Palm Desert and 85-995 Avenue 52 in Coachella).
• The district also now offers the convenience of having your monthly payment automatically deducted from your checking account. Simply complete an Automatic Payment Service Form, available at either office or on our web site at www.cvwd.org/service/payment.php.
•A recent upgrade to our computer systems also now allows us to receive payments electronically from customers using online or telephone banking systems. Payments can’t be made through CVWD’s website, but can be made through separate online banking sites.
For customers using this method to pay their monthly water bill, it is important that your water account number appears in your online banking provider’s system in the same format as it appears on your recent water statement. The account number should be 11 or 12 digits in length, with no commas, periods, spaces, dashes or alpha characters. An account number in an incorrect format may result in notification from your bank or payment service that they were unable to process your payment request due to an invalid account number. For more information, contact customer service at (760) 391-9600.
Mailed payments should be sent to P.O. Box 5000, Coachella, CA 92236.
Financial Statements
Rate SummaryAs of July 1, 2008 (1)
Domestic Water
Area of serviceMonthly
charge per 100 cubic feet
Monthly service charge
3/4” meter
Majority of the district, except areas noted below $0.94 $7.00
Service Area 26 (includes Sky Valley & Indio Hills) $1.15 $7.50
Service Area 23 (includes east Salton Sea areas of North Shore and Bombay Beach) $1.41 $7.50
Improvement District 11 (includes Salton City, Desert Beach and Desert Shores) $1.21 $7.50
Areas outside boundaries of the district or an improvement district, but served by the improvement district
$1.46 $17.50
Residential Sanitation
Area of service Monthly charge per dwelling unit
Service Area 41 (bounded generally by Jackson, Calhoun and Avenues 52 and 56) $26.05
Improvement District 80 (includes ID 53, 54, 57, Palm Desert Country Club and City of Indian Wells)
$22.50
Improvement District 81 (includes area along I-10 from Thousand Palms to Indio) $25.65
North Shore Beach $30.40
Bombay Beach $29.85
La Quinta and Mecca $27.05
Irrigation Water
Water rate per acre-foot $23.30
Quagga mussel mitigation surcharge 3$3.00
Gate charge per day $11.50

Page 19
Condensed Statement of Revenues & ExpendituresFiscal year ended June 30, 2007
Irrigation Domestic Sanitation Stormwater General Total
Revenues
Water sales $5,494,366 $54,279,180 $0 $0 $0 $59,773,546
Service charges 1,178,401 2,612,707 29,110,913 0 0 32,902,021
Availability charges 741,148 662,360 114,260 0 0 1,517,768
Taxes 1,760,782 165,598 4,744,570 12,910,127 22,736,167 42,317,244
Interest 111,090 2,770,496 2,952,426 2,269,777 3,383,234 11,487,023
Other revenues 75,506 3,150,188 208,655 571,054 (3) 16,000,016 20,005,419
Total $9,361,293 $63,640,529 $37,130,824 $15,750,958 $42,119,417 $168,003,021
Expenditures
Operation & maintenance $7,083,221 $41,619,451 $18,366,157 $2,938,958 $0 $70,007,787
General & administration 2,456,598 10,504,713 4,594,735 1,111,686 1,490,400 20,158,132
Contract & bond payments 0 0 1,397,644 1,437,909 34,257,672 37,093,225
New construction 720,317 9,593,838 7,468,430 1,047,397 6,371,343 25,201,325
Reserves (898,843) 1,922,527 5,303,859 9,215,008 0 (4)15,542,551
Total $9,361,293 $63,640,529 $37,130,824 $15,750,958 $42,119,417 $168,003,021
Comparative Condensed Balance SheetAssets June 30, 2007 June 30, 2006Current assets:
Cash and investments $159,571,080 $167,352,517Accounts receivable, inventory, prepaid expenses & other 48,825,273 37,965,838
208,396,353 205,318,355Property, plant & equipment:
All-American Canal & distribution system (participating equity)
34,874,505 34,874,502
State Water Project (participating equity) 111,041,496 125,258,822Land, facilities & equipment 914,647,590 869,936,445
1,060,563,591 1,030,069,769
Accumulated amortization & depreciation (342,071,159) (317,706,374)Construction work in progress 140,345,154 91,135,454
858,837,586 803,498,849Assets restricted for development & other purposes 184,010,707 165,681,216
Total Assets $1,251,244,646 $1,174,498,420
Liabilities & Equities
Current liabilities:(1) Accounts payable $7,416,732 $9,460,087Customer advances & deposits 8,814,663 9,188,448(1) Accrued salaries, interest, deferral & other expenses 25,860,455 22,592,861
42,091,850 41,241,396Long-term liabilities:
State Water Project & other 1,348,771 16,887,080Bonds payable & certificates of participation 16,495,000 18,580,000
17,843,771 35,467,080
Total liabilities 59,935,621 76,708,476(2) Taxpayer’ equity in assets 1,191,309,025 1,097,789,944
Total Liabilities & Equities $1,251,244,646 $1,174,498,420
(1) Prior period results have been restated to conform to current period presentation.
(2) Includes the taxpayers’ equity in canal and irrigation distribution facilities, wells and reservoirs, treatment plants and stormwater facilities. This value includes facilities paid for by others and donated to the district. The value has been reduced by any outstanding debt (liabilities).
(3) Majority is groundwater replenishment assessment fees — well owners’ proportionate shares of the cost of importing water to replenish the groundwater basin.
(4) Utilization of resources.

Page 20
Agricultural Irrigation
Decades-old lawsuit settled; CVWD receives $27 million
A decades-old lawsuit between the Coachella Valley Water District and Imperial Irrigation District ended in late 2007 with a court ordering IID to pay nearly $27 million. In its ruling, the state Court of Appeals upheld a Superior Court decision granting CVWD about 50 years’ worth of power revenues.
The dispute stemmed from a 1934 compromise between the two agencies prior to building the All-American Canal. The two agencies agreed that once the canal started producing hydroelectric power, IID could sell the power within CVWD’s boundaries and CVWD wouldn’t try to compete in the power business. In return, IID agreed to pay CVWD a total of 8 percent of its net power proceeds.
In 1994, the water district filed a lawsuit against IID, challenging the way the agency calculated the 8 percent cut. Among the disputes was that IID would remove interest earned on revenues, deduct internal loans for capital improvement projects and set aside reserve funds before figuring its net proceeds.
In 2004, a San Bernardino County Superior Court judge ruled in favor of CVWD, stating that IID should have been making larger payments for more than 50 years. The judge ruled that IID owed CVWD nearly $17 million.
IID appealed the case to the California 4th District Court of Appeals. The 2007 decision upheld the Superior Court decision, plus accrued interest, stating the agency now owed nearly $27 million.
The annual power payments have always been a source of revenue for CVWD’s irrigation system. The lawsuit settlement payment was used to reimburse legal fees associated with the case and invested back into the aging system, which is in desperate need of upgrades.
The water district’s irrigation delivery system is comprised of nearly 500 miles of pipeline. In 2007, the district delivered 257,548 acre-feet of Colorado River water via the Coachella Canal to 1,114 irrigation customers.
Lettuce remains one of the most popular crops grown in the Coachella Valley with 4,157 acres planted in 2007 for a total value of more than $26 million.

2007 Crop Report
All financial figures rounded off to the nearest dollar.
Calendar year figures for Coachella Valley land irrigated with Colorado River waterValue of year’s production: $527,610,500
Total acreage irrigated (includes double cropping): 64,049Average gross value per acre: $8,238
Crop Acreage Yield in tons Value per acre Total valueFruit 26,512 202,338.4 $8,196 $217,188,804
Cantaloupes 40 398.4 2,745 109,798Dates 7,373 33,178.5 7,110 52,422,030Figs 126 1,978.2 13,471 1,697,295Grapes (table) 9,076 51,551.7 10,748 97,552,750Grapefruit 1,143 16,270 6,437 7,357,308Lemons & limes 4,324 52,858.7 6,146 26,577,336Mangos 99 1,554 13,471 1,333,589Olives 99 1,554 13,471 1,333,589Oranges & tangerines 2,913 24,032.3 5,778 16,831,954Peaches 63 294.9 5,764 363,123Tomatoes 287 3,208.7 17,888 5,133,856Strawberries 274 1,837 12,052 3,302,250 Watermelons 695 13,622 4,567 3,173,926
Vegetables 24,163 276,747.7 $7,852 $189,742,951Beans 853 4,931.2 6,930 5,911,511Broccoli 1,448 8,038.6 3,704 5,363,334Cabbage 44 785.4 3,727 163,991Carrots 1,964 37,769.7 6,000 11,784,137Cauliflower 1,291 9,378.5 4,096 5,287,574Celery 331 10,157.9 8,458 2,799,515Corn (sweet) 2,227 864.1 2,797 6,228,429Cucumbers 39 393.5 6,226 242,795Greens 3,229 38,672.1 8,887 28,694,702Lettuce 4,157 37,687.4 6,312 26,237,903Misc. vegetables 2,846 34,146.3 9,968 28,368,728Onions (dry) 342 10,901.3 8,288 2,834,325Peppers 4,469 74,348.5 13,852 61,902,522Potatoes 525 5,013.8 3,587 1,883,165Squash 233 1,994.5 4,348 1,013,195Sugar beets 165 1,664.9 6,225 1,027,125
Forage 2,433 10,223 $501 $1,219,843Alfalfa hay 795 6,121 793 630,514Sudan hay 795 4,102 614 488,161
Pasture (irrigated) 843 9,526 animal units/ month
120 101,168
Nursery 1,412 — $25,134 $35,488,953Fish Farms 357 321.3 $1,620 $578,340Golf Courses 7,153 — $9,092 $65,034,861Polo Fields 475 — $9,092 $4,318,700Turf Grass 1,544 — $9,092 $14,038,048

Page 22
Coachella CanalQuagga mussels move closer to Coachella Valley
Although quagga mussels were first found in Lake Mead in January 2007, the small, destructive mollusk has not found its way into Coachella Valley’s canal or water delivery system. Yet.
All Colorado River water imported by California is stored in Lake Mead before it is returned to the river, then diverted into conveyance and natural or manmade storage facilities. Quaggas infested the Colorado River Aqueduct by way of Lake Havasu and now exist in many lakes in San Diego County. A few adult mussels have also been found at Imperial Dam.
The mussels are bound to find their way to the Coachella Canal and delivery system, but CVWD is pro-actively monitoring for their arrival while developing ways to combat a potential infestation. There is no known way to eradicate the quagga mussels, only methods that, when used elsewhere, have helped control their growth.
The district is investigating the use of canal water turbulence to destroy the quagga larvae (also called veligers), but only one veliger surviving this technique could result in a system infestation. A quagga releases millions of veligers in its brief lifetime.
Chlorine has been used effectively in other water systems to control quagga mussels. Treatment that controls them before they attach to something is crucial, because quaggas stuff themselves into a pipe so thoroughly that water flow is severely restricted, even stopped. If they are killed after becoming affixed to something, they can leave behind millions of difficult-to-remove shells.
CVWD is also considering using liquid chlorine to kill veligers as they enter the conveyance system. The annual cost for this procedure could exceed $1 million. Therefore, the district’s board of directors in June will consider adding a $3 per-acre-foot quagga control surcharge to irrigation water rates, an increase that could go into effect at the start of the next fiscal year. Long-term solutions could involve the use of chlorine at all 65 laterals.
CVWD and other agencies throughout California are working closely to monitor the advance of the quagga mussel and its cousin, the zebra mussel. Legislation also has been introduced in Sacramento and several lakes have been closed to watercraft that is not permanently docked on the waterway.
Quagga Facts
Name — Quagga mussels are named after a species of zebra hunted into extinction more than 100 years ago.
Size — 2-3 centimeters wide.
Lifespan — Adult mussels can survive out of water for as long as a week. It’s believed they found their way into the Colorado River as unwanted stowaways on a boat.
Potential effects — The quagga will attach themselves to virtually any surface and can completely clog pipes used to deliver irrigation water to area farms and golf courses.
Quagga mussels will attach to anything in which they come in contact, including canals, pipes and water treatment facilities. They haven’t entered the Coachella Canal system yet, but employees are monitoring for their existence using cinder blocks, placed at six different stations along the stretch of the 122-mile canal.

Page 23
Facility tests canal water treatment CVWD started operating a pilot
surface water treatment facility in 2007, to test three promising technologies to treat Colorado River water for domestic use.
The district’s long-term water management plans call for the treatment and distribution of as much as 32,000-acre-feet of Colorado River water for domestic use annually.
Millions of Southern California and Las Vegas residents have been drinking and using treated Colorado River water in their homes and businesses for nearly 80 years. As the Coachella Valley’s population continues to grow, treatment and distribution of Colorado River water for domestic purposes will help decrease the valley’s dependence on an already overdrafted groundwater supply.
Environmental engineering firm Malcolm Pirnie was hired to complete the year-long study. Work included hosting an expert panel workshop, developing water treatment goals, development of the pilot testing program, design and construction of the pilot facility and operating the facility.
The pilot facility, which is located in north Indio alongside the Coachella Canal, tested three technologies side-by-side for three months. Approximately 105 gallons of water per minute were treated daily and tested for compliance with current and potential future water quality regulations. The treated water was not used for drinking during this testing period.
Colorado River water was first imported into the Coachella Valley in 1949, but its use has been limited to irrigation and groundwater replenishment. Untreated water is delivered by an underground system from the 122-mile canal to farms and golf courses or diverted for groundwater recharge at the Dike 4 and Martinez Canyon pilot recharge facilities.
Awards line up for Canal Lining ProjectThe San Diego Section of the American Society of Civil Engineers (ASCE) honored the
Coachella Canal Lining Project as its prestigious Project of the Year for 2008. Recognition is part of the society’s Civil Engineering Project Awards program. Coachella Valley Water District, San Diego County Water Authority, the Bureau of Reclamation and two consultants on the project, MWH and GEI Consultants, Inc., were honored.
The $110 million project involved the construction of a parallel, concrete-lined canal nearly 36 miles in length to replace the remaining, earthen sections of the original canal. Construction took two years to complete.
Also in 2008, the project was recognized by the Western Council of Construction Consumers for an Outstanding Achievement Award. The award recognized CVWD and San Diego for their “strong commitment to excellence (in) the engineering, design and construction of quality cost-effective and innovative construction projects.”
The entire canal is 122 miles in length and responsible for delivering what historically has been about 300,000 acre-feet of Colorado River water annually to the Coachella Valley, predominately to agriculture. The concrete lining is saving approximately 26,000 acre-feet of water annually previously lost to seepage.
Assistant to the General Manager Dan Parks, left, tours the pilot surface water treatment facility with Megan Brown, assistant domestic engineer.

Page 24
Stormwater Protection
Heavy rain during the winter of 2007-08 caused water to flow down the Whitewater River and Coachella Valley Stormwater channel. Above, Miles Avenue runs through the channel while water is carried through the valley to the Salton Sea in January 2008. The valley’s complex flood protection system was built to protect homes from flooding by diverting rain water and mountain runoff.
Levee certification project continuesCVWD is in the second year of working to recertify all of its stormwater levees depicted on
Flood Insurance Rate Maps, as required by Federal Emergency Management Agency (FEMA). In order for a levee to be certified, FEMA must be satisfied that it will provide protection against a 100-year flood.
All district-owned and maintained flood control facilities are undergoing hydraulic and geotechnical analysis, as required for recertification. Analysis of two of the facilities is nearing completion with positive results. In all, six flood control facilities are being analyzed, including portions of the Whitewater River/Coachella Valley Stormwater Channel and the levee that protects the Coachella Canal.
FEMA’s flood map modernization project was initiated to provide communities with up-to-date and accurate flood hazard information. If a levee is not certified, the homes in the area will be designated as being inside a floodplain and homeowners will be required to purchase flood insurance.
The water district has an August 2009 deadline to complete the analysis.

General InformationCoachella Valley Water District is a local government agency formed in 1918 by the registered voters
within the district. Governing board: Five directors, elected at-large to four-year terms and representing five divisionsService area: 639,857 acres; stormwater unit 377,776 acresEmployees: 550Fields of service: Domestic water supply, treatment and distribution; wastewater collection and
treatment; recycled water distribution; regional stormwater/flood protection; irrigation water importation and distribution; irrigation drainage collection; groundwater management and promotion of water conservation.
Property valuation: Property within CVWD boundaries had a total combined assessed value in 2007 of $57,138,070,411 as fixed by Riverside and Imperial County assessors and state officials. This figure is used to determine property tax funding for the district.
Domestic WaterService information
Population served 279,717Active meters 105,948Average daily demand 118 mgdTotal water delivered 131,603 af
System informationActive wells 115Total well capacity 243 mgdDistribution reservoirs 59Storage capacity 120 mgDistribution piping system 1,884 miles
Irrigation WaterService information
Total irrigable acres 78,530Active accounts 1,114Total water delivered 257,548 afAverage daily demand 706 afMaximum daily demand 1,207 af
System informationReservoirs 2Storage capacity 1,301 afDistribution system: 485 milesPumping plants 19Length of canal 122 miles
Agriculture DrainageTotal on-farm drains 2,298 milesAcreage with farm drains 37,425District open drains 21 milesDistrict pipe drains 166 miles
mgd = million gallons per day. af = acre-feet. An acre-foot of water is equal to 325,851 gallons,
or enough water to cover one acre of land one foot deep.
Stormwater ProtectionSystem information
Number of stormwater channels 16Length of Whitewater River/ Coachella Stormwater Channel 49 milesLength of all regional flood protection facilities 134 miles
Wastewater Collection Service information
Population served 257,340Active accounts 97,479Average daily flow 18.3 mgd
System informationWastewater reclamation plants 6Total daily capacity 31 mgdCollection piping system 1,078 miles
Recycled WaterService information
Active accounts 16Average daily flow 7.7 mgd
System informationWastewater reclamation plants
producing recycled water 3Total daily capacity 18 mgdDistribution piping system 15 miles
Groundwater Management (In cooperation with Desert Water Agency)
Recharge facilities 4Recharge from imported water 22,795 afImported supply since 1973 2,164,866 af
B y the NumbersAs of Dec. 31, 2007

Coachella Valley Water District2007-08 Annual Review & Water Quality Report
Mission Statement: To meet the water related needs of the people through dedicated employees providing high quality water at reasonable cost.