co2 emissions and energy calculations work update: january ...stakeholder-meeting... · •...
TRANSCRIPT

Life Cycle Assessment: CO2 Emissions and Energy Calculations
Work Update: January 2016

Process Map for a Typical Cement Plant in India – Ordinary Portland Cement (OPC)
Major raw materials: Limestone, Coal, Pet coke, LigniteOther significant inputs: Electricity (from the grid), Alternative fuels, Gypsum,
Clay, Water, Plant and equipment
Important sub-processes: Limestone extraction, Raw meal preparation, Clinkerization, Blending, Packing and dispatch, Power generation
Products: Bulk cement, Cement bags, Clinker

Process Map for a Typical Cement Plant in India – Fly Ash Based Portland Pozzolana Cement (PPC)
Major raw materials: Limestone, Fly ash, Coal, Pet coke, LigniteOther significant inputs: Electricity (from the grid), Alternative fuels, Gypsum,
Clay, Water, Plant and equipment
Important sub-processes: Limestone extraction, Raw meal preparation, Clinkerization, Fly ash transport, Blending, Packing and dispatch, Power generation
Products: Bulk cement, Cement bags, Clinker

Major raw materials: Limestone, Kaolinitic clay, Coal, Pet coke, LigniteOther significant inputs: Electricity (from the grid), Alternative fuels, Gypsum,
White clay, Water, Plant and equipment
Important sub-processes: Limestone extraction, Raw meal preparation, Clinkerization, Clay calcination, Blending, Packing and despatch, Power generation
Products: Bulk cement, Cement bags, Clinker
Potential Process Map for LC3 Production in a Typical Indian Cement Plant

System Boundaries Considered
• Ground-to-Gate (Cradle-to-Gate)• From mines to gate of the cement plant• Energy requirements and CO2 emissions (direct and
indirect) are considered from all processes involved in the production of cement, including
• Extraction and transportation of all fuels & raw materials
• Energy and emission in the production of electricity• Energy and emission from production of alternative fuel
and fly ash consumed are excluded.

System Boundaries Considered
• Gate-to-Gate • Processes undertaken by the cement plant• All direct raw material and energy requirements, and
emissions are considered from all processes undertaken by the cement plant, including
• Extraction of Limestone• Transportation of fly ash, clay, gypsum, and filler
limestone.• Extraction and transportation of fuel are excluded

System Boundaries Considered
• CSI (Cement Sustainability Initiative, WBCSD) System*** • From mines to gate of the cement plant• Energy requirements and CO2 emissions from fuels
within the cement plant (Only company owned activities)
• Extraction of raw materials and transportation outside the plant, and impacts of alternative (biomass and waste) fuels are excluded
*** As per CO2 and Energy Accounting and Reporting Standard for the Cement Industry, CSI, 2011.

Impact Assessment - Case Study (Reddipalayam,Ariyalur)
• Ariyalur, Tamil Nadu, India, has rich limestone deposits. Consequently, many cement plants are located there.
• It is considered that the plant has been leased limestone quarries adjacent to its location. Since the limestone is soft in this region, it is extracted by excavation without blasting. The material used has a composition with about 44% CaO, 12.5% SiO2, 10% moisture and 35.5% loss on ignition.
• It is considered that Class F Fly ash is transported from the MetturPower Plant (over 200 km), with a composition of 61% SiO2 , 27% Al2O3 and 4% Fe2O3.
• It is considered that waste phosphogypsum is transported from Tutticorin (385 km)

Impact Assessment - Case Study (Reddipalayam,Ariyalur)
• Most of the energy required is obtained by burning coal and pet coke. 10% of the energy in the cement kiln is produced by burning biomass and alternative fuels
• Most of the electricity (80%) is considered as generated by a captive thermal power plant burning pet coke (88% contribution in terms of power produced) and lignite (11%). The plant also produces some fly ash that is added to the limestone for the raw meal
• Water consumption of the plant is about 0.2 m3 per ton of cement

Values Assumed for LC3 Calculations• LC3 has the composition of 50% clinker, 30% calcined clay, 15% crushed
limestone and 5% gypsum
• Mass loss in clay during calcination (including drying and dehydroxilation) is 13%
• Energy consumption for calcination of clay is taken as 2.6 MJ/kg (including 30% losses)
• Coal is assumed to be used for the calcination of the clay, and emissions are calculated based on the carbon content of coal.
• Electricity required for calcining rotary kiln is assumed to be 0.04 kWh/kg of raw clay or 0.15 MJ/kg of clay
• Fuel consumption for transportation is based on trucks or bunkers with 23 ton freight capacity and 3km/litre and 4km/litre mileage when full loaded and empty loaded.
• Hypothetically, it is assumed that clay can be sourced from Dharmapuri (104 km away), and transported to and calcined at the cement plant

Only direct emissions are considered. Emissions and energy consumption during extraction and transportation
of raw materials and all fuels are excluded. Emissions and energy consumed due to the production of electricity
(both purchased and produced) is excluded. Provides data for comparison with CSI database Based on measurable quantities at the plant level and avoids almost all
assumptions that are not relevant to local conditions and materials.
*values shown for comparison
Cements: CSI System Calculations
Impact OPC PPC LC3 CSI (India, 2012): 70.5% clinker factor
Energy consumed(MJ/ton of cement)
2585 1935 2320 2400*
Emission of CO2(kg/ton of cement)
695 520 475 580*

Processwise Energy Consumption (CSI System)
12
2585
1936
1422
897
0
500
1000
1500
2000
2500
3000
OPC PPC LC3
Ener
gy C
onsu
mpt
ion
in M
J/to
n of
cem
ent
Calcination (from fuel)
Clinkerisation (from fuel)
2585
1935
2320

Processwise CO2 Emissions (CSI System)
13
233175
129
463
347
260
85
0
100
200
300
400
500
600
700
800
OPC PPC LC3
CO2
Emis
sion
s in
Kg C
O2/
ton
of c
emen
t
Calcination (from fuel)
Clinkerisation (from raw material)
Clinkerisation (from fuel)
695
520475

LCA Ground-to-Gate Calculations: Concrete
14

Distances from raw material locations are as follows:
COMPONENTS ORIGIN DISTANCE
(km)Cement Ariyalur 307
Sand Villupuram 192
Fly ash Mettur 360
Coarse Aggregate Kanchipuram 75
Gypsum Tutticorin 400
Clay Dharmapuri 10415
Assumptions

Mix Designs: M30
COMPONENTS(kg) M30 OPC M30 PPC
(FA30) M30 LC3
Cement 310 310 310Water 159 142 155
Coarse Aggregate 1222 1232 1222
Fine aggregates 706 716 715
LC3-50 (56) (2:1) IB 01/15
16

kgCO2-equivalent for M30 concrete
17
142176
25850 14
1354 56
5540 40
40
0
50
100
150
200
250
300
350
400
LC³ PPC OPC
kgC
Oշ
equi
vale
nt
M30 Concrete
Others
Electricity
Transportation
Aggregates
Processes in cementproduction*Clinker
*Includes contribution of processes in cement production in kg COշ other than clinker

Mix Designs: M50
COMPONENTS(kg) M50 OPC M50 PPC
(FA30) M50 LC3
Cement 360 380 340Water 144 133 136
Coarse Aggregate 1193 1188 1220
Fine aggregates 703 699 704
18
LC3-50 (56) (2:1) IB 01/15
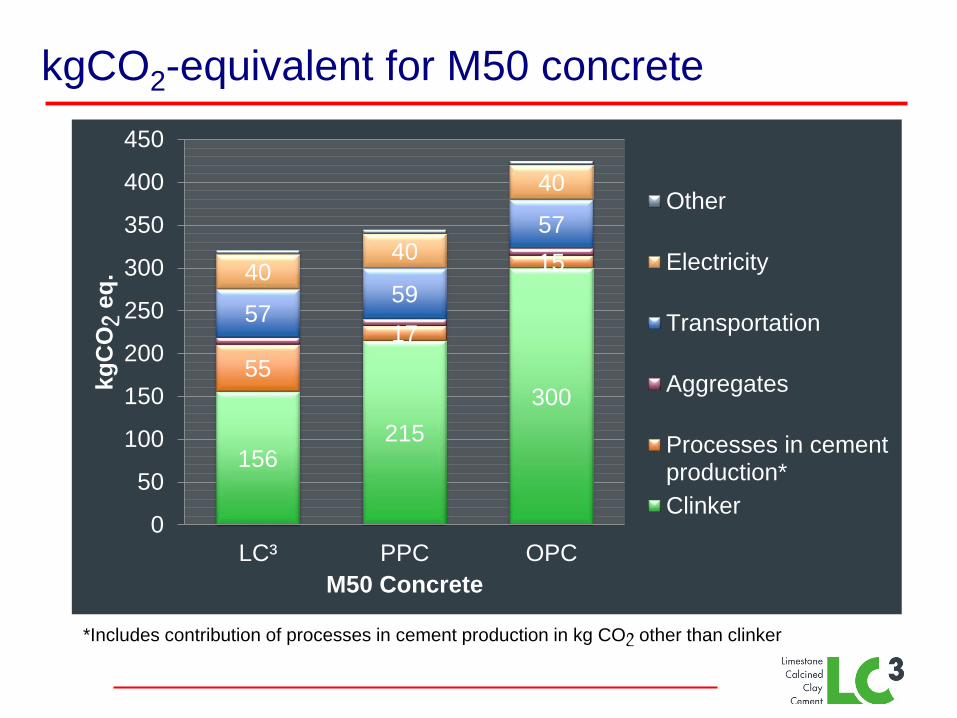
kgCO2-equivalent for M50 concrete
19
*Includes contribution of processes in cement production in kg COշ other than clinker
156215
30055
17
15
5759
57
4040
40
0
50
100
150
200
250
300
350
400
450
LC³ PPC OPC
kgC
Oշ
eq.
M50 Concrete
Other
Electricity
Transportation
Aggregates
Processes in cementproduction*Clinker
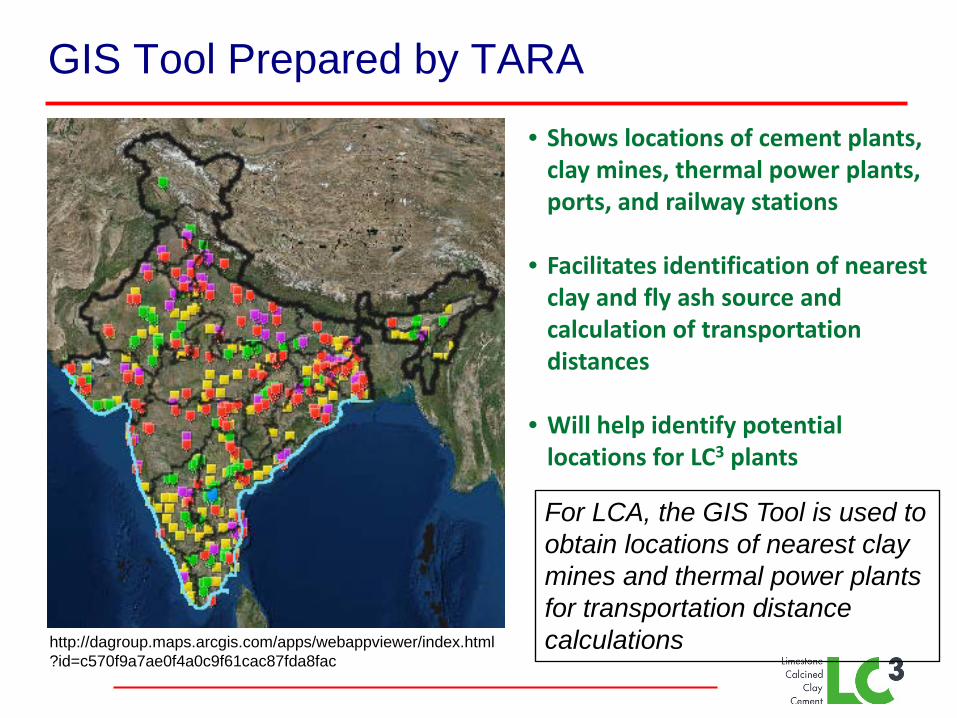
GIS Tool Prepared by TARA
• Shows locations of cement plants, clay mines, thermal power plants, ports, and railway stations
• Facilitates identification of nearest clay and fly ash source and calculation of transportation distances
• Will help identify potential locations for LC3 plants
http://dagroup.maps.arcgis.com/apps/webappviewer/index.html?id=c570f9a7ae0f4a0c9f61cac87fda8fac
For LCA, the GIS Tool is used to obtain locations of nearest clay mines and thermal power plants for transportation distance calculations

Plant Visits - Status
J.K. Laxmi,Sirohi
Shree Cement, Ras
Ultratech(Grinding Unit)Arrakonam
Ultratech,Tadipatri
Calcom,Umrangso
AdhunikCement (Dalmia), Thangskai
ACC Cement,Chandrapur
Satna
Lafarge, Pilerne
ACC Cement, Bangalore
Dalmia and UltratechAriyalur
DalmiaBhubaneshwar
Visited
Proposed to be visited

THANK YOU
LCA Team
IIT Madras: Ravindra Gettu, Sivakumar Palaniappan, SanoopPrakasan, Aanchal Patel, Anusha S. B.
TARA: Soumen Maity, Vaibhav Rathi, Krithi Nagrath, Avanindra Kumar
IIT Delhi: Shashank Bishnoi
Advice given by Guillaume Habert is gratefully acknowledged
Software used: SimaPro (PRé Consultants bv)

23

Work Progress
System Boundary
Inventory Analysis
Impact Assessment
Comparative Analysis
Data from Primary and Secondary Sources
SIMAPRO LCA

Inventory of Inputs
Raw Materials
Limestone
Clinker
Calcined Clay
Fly Ash
Gypsum
White Clay
Iron Ore
Shale
Bauxite
Haematite
Fuels
Coal
Pet Coke
Diesel
Petrol
Alternative Fuels (Tyres, Plastics, etc.)
Biomass Fuels (Wood, Paper, etc.)
Electricity
Purchased from Grid
Generated Onsite
Minor contributions: Infrastructure, Equipment

Conversion Factors
Calculation of energy content of fuels
Calculation of CO2 EmissionsHigh Priority
Low Priority
• Experimental data – Bomb Calorimetry• Cement plant• EPA – 2014• IPCC 2006• Ecoinvent 3 database
• Experimental data – CHNS analyzer• EPA – 2014• CSI Protocol• IPCC 2006• Ecoinvent 3 database
High Priority
Low Priority
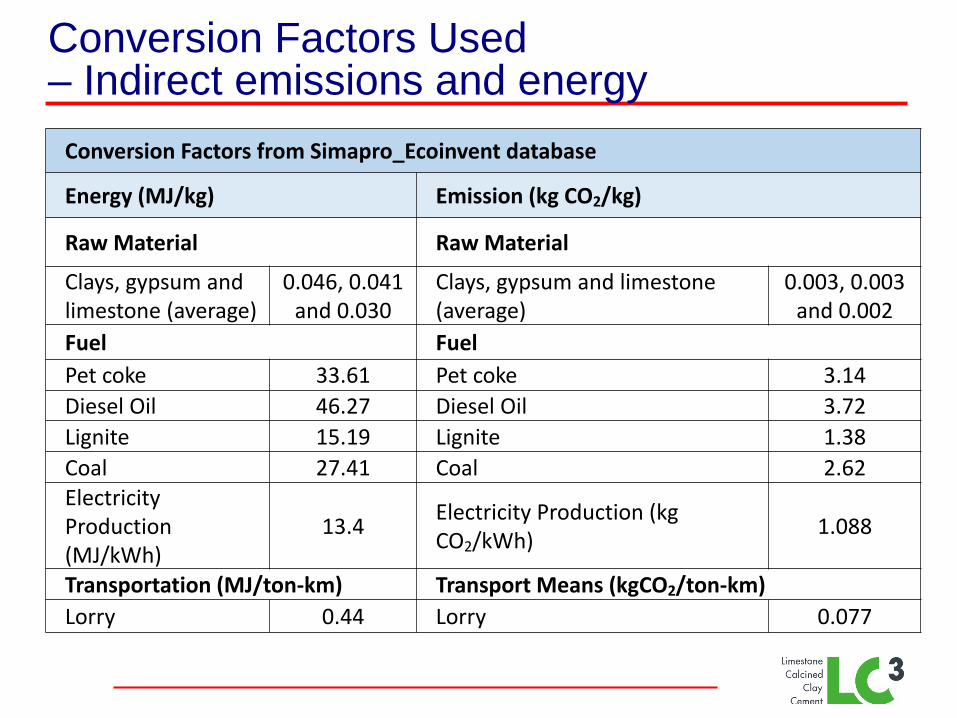
Conversion Factors Used – Indirect emissions and energy
Conversion Factors from Simapro_Ecoinvent database
Energy (MJ/kg) Emission (kg CO2/kg)
Raw Material Raw Material
Clays, gypsum and limestone (average)
0.046, 0.041and 0.030
Clays, gypsum and limestone (average)
0.003, 0.003and 0.002
Fuel FuelPet coke 33.61 Pet coke 3.14Diesel Oil 46.27 Diesel Oil 3.72Lignite 15.19 Lignite 1.38Coal 27.41 Coal 2.62Electricity Production (MJ/kWh)
13.4 Electricity Production (kg CO2/kWh) 1.088
Transportation (MJ/ton-km) Transport Means (kgCO2/ton-km)Lorry 0.44 Lorry 0.077

Material Input for 1 kg of CementInput Unit OPC PPC LC3Materials/FuelsLimestone kg 1.31 0.99 0.73Gypsum kg 0.04 0.04 0.05White Clay kg 0.06 0.04 0.39China Clay kg - - 0.34Filler limestone kg 0.05 - 0.15Fly Ash kg 0.29 -Lignite kg 0.03 0.02 0.02Tyre kg 0.001 0.001 0.0003Plastic kg 0.007 0.005 0.0042Paint Sludge kg 0.002 0.001 0.0013Coal kg 0.0001 0.0007 0.0005Pet Coke kg 0.054 0.04 0.03Diesel kg 0.00004 0.00003 0.00002Electricity/HeatElectricity, Medium voltage (IN) kWh 0.083 0.066 0.066DistanceClay km 5 - -Fly Ash km - 200 -Gypsum km 400 400 400China Clay km - - 104
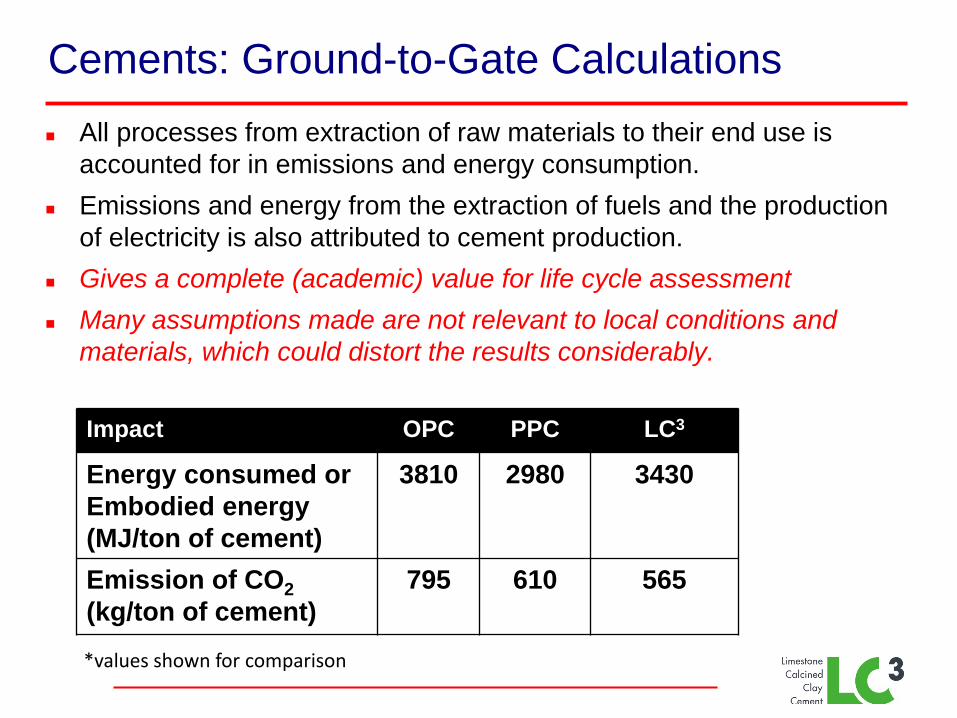
Cements: Ground-to-Gate Calculations All processes from extraction of raw materials to their end use is
accounted for in emissions and energy consumption. Emissions and energy from the extraction of fuels and the production
of electricity is also attributed to cement production. Gives a complete (academic) value for life cycle assessment Many assumptions made are not relevant to local conditions and
materials, which could distort the results considerably.
Impact OPC PPC LC3
Energy consumed or Embodied energy (MJ/ton of cement)
3810 2980 3430
Emission of CO2(kg/ton of cement)
795 610 565
*values shown for comparison

Processwise breakup for OPC – Ground to gate
35 2 1
20
5
720
30
5
OPC CO2 Emissions kg/ton of Cement
Raw materialExtraction
Fuel Extraction
Transport of RawMaterials and Fuels
Limestone Crushing
Raw material grinding
Coal preparation
Clinkerisation
Supplementarymaterials
Cement Grinding
Packing and Services
40 40 3010
280
60
2930
3
350
60
OPC Energy Consumption (MJ/ton of Cement)
Raw materialExtraction
Fuel Extraction
Transport of RawMaterials and Fuels
Limestone Crushing
Raw material grinding
Coal preparation
Clinkerisation
Supplementarymaterials
Cement Grinding
Packing and ServicesTotal CO2 Emissions: 795 kg/ton of Cement
Total Energy Consumption: 3810 MJ/ton of Cement
Clinkerisation
Cement Grinding Raw Material
Grinding

Processwise breakup for PPC – Ground to gate
26 6
1
17
4
540
30
4
PPC CO2 Emissions kg/ton of Cement
Raw MaterialExtraction
Fuel Extraction
Transport of RawMaterials and Fuels
Limestone Crushing
Raw material grinding
Coal preparation
Clinkerisation
Supplementarymaterials
Cement Grinding
Packing and Services
31 50 75
9
210
50
2195
2
320
50
PPC Energy Consumption (MJ/ton of Cement)
Raw MaterialExtraction
Fuel Extraction
Transport of RawMaterials and Fuels
Limestone Crushing
Raw material grinding
Coal preparation
Clinkerisation
Supplementarymaterials
Cement Grinding
Packing and ServicesTotal CO2 Emissions:
610 kg/ton of CementTotal Energy Consumption:
2980 MJ/ton of Cement
Clinkerisation
Cement Grinding Raw Material
Grinding

Processwise breakup for LC3
– Ground to gate
3 10 4113
3
400
100
25
3
LC3 CO2 Emissions kg/ton of Cement
Raw materialExtraction
Fuel Extraction
Transport of RawMaterials and Fuels
Limestone Crushing
Raw material grinding
Coal preparation
Clinkerisation
Calcination
Supplementarymaterials
Cement Grinding
Packing and services
40 8560
7
155
30
1610
1080
7
320
40
LC3 Energy Consumption (MJ/ton of Cement)
Raw materialExtraction
Fuel Extraction
Transport of RawMaterials and Fuels
Limestone Crushing
Raw material grinding
Coal preparation
Clinkerisation
Calcination
Supplementarymaterials
Cement Grinding
Packing and services
Total CO2 Emissions: 565 kg/ton of Cement
Total Energy Consumption: 3430 MJ/ton of Cement
Clinkerisation
Calcination
Cement Grinding Raw Material
Grinding

Processwise CO2 emissions
33C
linkeisation
Clinkerisation
Clinkerisation
Calcination
795
610565

Processwise energy consumption
34C
linkerisation
Clinkerisation
Clinkerisation
Calcination
3800
2990
3400

Emissions and energy consumption during extraction of limestone, and transportation of limestone, clay, fly ash and gypsum are attributed to the cement production
Emissions and energy related to extraction of clay, and the extraction and transportation of fossil fuels, and production of electricity are excluded.
Provides data for more reliable comparisons Avoids assumptions that are not relevant to local conditions and
materials.
Impact OPC PPC LC3
Energy consumed (MJ/ton of cement)
3740 2860 3280
Emission of CO2(kg/ton of cement)
790 595 550
Cements: Gate-to-Gate Calculations
Work Planned Fine tuning of calcination energy for LC3 as per Indian
context. Visiting 6 more cement plants covering all geographical
directions of India and conduct LCA to find out regional differences in CO2 emissions and energy consumption by production of cement.
Experimenting and addition of conversion factors for Indian context.
Parametric studies with the models of the cement and concrete