co2 dissociation using the versatile atmospheric ... · (dbd) with a simple, zero dimensional (0-d)...
TRANSCRIPT

ORIGINAL RESEARCH ARTICLEpublished: 26 September 2014doi: 10.3389/fphy.2014.00055
CO2 dissociation using the Versatile atmospheric dielectricbarrier discharge experiment (VADER)Michael A. Lindon and Earl E. Scime*
Department of Physics and Astronomy, West Virginia University, Morgantown, WV, USA
Edited by:
Antonio D’Angola, Università dellaBasilicata, Italy
Reviewed by:
Michael Keidar, George WashingtonUniversity, USAJ. P. Sheehan, University ofMichigan, USA
Dissociation of CO2 is investigated in an atmospheric pressure dielectric barrier discharge(DBD) with a simple, zero dimensional (0-D) chemical model and through experiment.The model predicts that the primary CO2 dissociation pathway within a DBD is electronimpact dissociation and electron-vibrational excitation. The relaxation kinetics followingdissociation are dominated by atomic oxygen chemistry. The experiments includedinvestigating the energy efficiencies and dissociation rates of CO2 within a planar DBD,while the gas flow rate, voltage, gas composition, driving frequency, catalyst, and pulsemodes were varied. Some of the VADER results include a maximum CO2 dissociationenergy efficiency of 2.5 ± 0.5%, a maximum CO 6
2 dissociation rate of 4 ± 0.4 ×10− molCO2/s (5 ± 0.5% percent dissociation), discovering that a resonant driving frequencyof ∼30 kHz, dependent on both applied voltage and breakdown voltage, is best for efficientCO2 dissociation and that TiO2, a photocatalyst, improved dissociation efficiencies by anaverage of 18% at driving frequencies above 5 kHz.
Keywords: plasma chemistry, plasma chemical model, dielectric barrier discharge, atmospheric plasmas, CO2
dissociation, CO2 reduction, plasma physics
1. INTRODUCTIONGlobal warming is one of the foremost technological issues inthe beginning of the 21st century. The consequences of globalwarming include ocean acidification, a reduction in arctic ice capthicknesses and a global increase in severe weather events [1].Sixty percent of the current global warming trends can be cor-related with increased CO2 emissions from the industrializationof countries and 90% of CO2 emissions come from the burningof fossil fuels [2]. The largest source of CO2 emission is from largeemission sources, such as power plants (∼41%).
There are two principal methods for reducing CO2 emissionsfrom large emission sources: carbon capture and sequestration(CCS) and carbon capture and utilization (CCU). CCS is the pro-cess of collecting CO2 from the flue of a reactor or power plantusing CO2 absorbers or chemical processes, followed by trans-porting the gas to a reservoir to be permanently stored [3]. CCSentails many complications, including finding a suitable reser-voir that does not adversely affect the surrounding environmentand which permanently contains the gas and a large energy costfor separation, transportation, and pumping. Even so, research iscurrently being done to overcome these barriers.
CCU entails converting CO2 into different chemicals that canbe stored or used commercially. Research into this method of CO2
remediation has taken many forms, including growing bio-fuelalgae and converting CO2 directly into hydrocarbons or com-mercial products using different combinations of heat, pressure,catalysts and plasma [4, 5]. Each of these methods come withtheir own set of issues, which most often stem from low energyefficiencies and poor chemical selectivity. This work focuses onthe efficacy of atmospheric plasma CCU, specifically using aDielectric Barrier Discharge (DBD), and photocatalysts for the
dissociation of CO2 into its constituents as a precursor to theformation of value added chemicals.
The first step to understanding CCU using a DBD plasma isunderstanding the chemistry of non-thermal, atmospheric pres-sure plasmas. Section 2 reviews the dissociation chemistry of CO2,followed by a set of models of the DBD dynamics and chemistryimportant for CO2 dissociation. The model was compared to theresults of the Versatile Atmospheric dielectric barrier DischargeExpeRiment (VADER). The VADER experimental setup is dis-cussed in Section 3 and the experimental results are in Section 4.The results include the CO2 dissociation efficiencies, dissocia-tion rates and the different variables that affect efficiency. For fulldetails about the models and experiments, see Lindon [6].
While the work herein focuses on CO2 dissociation, it shouldbe noted that the techniques and analyses shown can be general-ized to other plasma chemical reactions, specifically endothermicreactions within a plasma.
2. THEORY2.1. CO2 DISSOCIATION CHEMISTRYThe simplest dissociation pathways for CO2 are:
CO2 + heat → CO + O
�H ∼ 532.2kJ
mol= 5.52 eV/molecule. (1)
where �H is the change in enthalpy. The oxygen atom (O) reactswith other oxygen atoms or CO2 to form O2
2O −→ O2 �H ∼ 32.8kJ
mol= −5.16 eV (2)
www.frontiersin.org September 2014 | Volume 2 | Article 55 | 1
PHYSICS
Annarita Laricchiuta, Istituto diMetodologie Inorganiche et deiPlasmi, Italy
*Correspondence:
Earl E. Scime, Department ofPhysics and Astronomy, WestVirginia University, Box 6315, 135Willey St., Morgantown, WV 26506,USAe-mail: [email protected]
Lindon and Scime CO2 dissociation using VADER
or
O + CO2 −→ O2 + CO �H ∼ 32.8kJ
mol= 0.34 eV. (3)
Combining the above equations give the full reaction [7]
CO2 −→ CO + 1
2O2 �H ∼ 283.3
kJ
mol= 2.94 eV. (4)
Activation energy is the minimum input energy needed to starta reaction. The activation energy for CO2 dissociation is ∼5.52electron volts (eV). After energy equal to or greater than the acti-vation energy is supplied, either 2.58 eV of input energy per O isrecovered through oxygen recombination or an additional 0.34 eVis spent to remove an oxygen from a CO2 molecule; easily attain-able in a plasma. Thus, the minimum energy cost for dissociatinga single CO2 molecule into carbon monoxide (CO) and half anoxygen molecule (O) is 2.94 eV.
These chemical equations only include the most basic and effi-cient dissociation paths. They do not include the many single andmultistep reaction paths that occur within a CO2 plasma, nor anychemical and system inefficiencies, including quenching, energyrecuperation, energy deposition in the molecular energy states,and higher energy reaction pathways.
Quenching refers to the rate at which reactants are cooled inan effort to halt or slow down reverse and/or unwanted reac-tions. If a CO2 plasma isn’t properly quenched, reverse reactions(like CO + 1
2 O2 −→ CO2 �H ∼ −2.94 eV/molec) will dom-inate the system kinetics as the gas cools [8]. The best way tosuppress these reverse reactions is to use a system with a very largequenching rate or to use an intrinsically low temperature system,like a DBD or corona discharge, for dissociation.
Energy recuperation is linked to quenching and is the abilityof a system to reuse the input and reaction energies of a chem-ical system for other purposes. In the case of CO2 dissociation,not recuperating any of the reaction energies is equivalent tolosing 2.58 eV per CO2 dissociated; due to oxygen atom recom-bination (5.16 eV, Equation 2). Energy recuperation is partiallyaddressed with the inclusion of a photocatalyst into the reactionchamber (discussed in Subsection 4.2.6), however, cooling andenergy losses outside of the reaction chamber were not addressed.Therefore, CO2 dissociation in VADER is guaranteed to requireenergies greater than 2.94 eV per reaction.
In a molecule there are four reservoirs (states) into whichenergy can be deposited: the vibrational, electronic, rotationaland kinetic states. Energy in each of these reservoirs enable a dif-ferent path for dissociation with a different efficiency. Accordingto theory, the most efficient CO2 dissociation path puts all ofthe energy into vibrational excitation, while keeping kinetic, elec-tronic and rotational energies at a minimum [8–10]. For example,by exciting the asymmetric vibrational states of CO2 with amicrowave discharge at moderate pressures (50–200 Torr), CO2
was dissociated with an energy efficiency of up to 90% [8, 11].However, direct excitation of vibrational modes using electro-magnetic radiation has several issues at atmospheric pressures,including relatively low energy efficiencies and problematic opti-cal access in carbon-rich processing systems.
DBDs and corona discharges preferentially excite electronicstates. However, electron energy is efficiently mode-converted tovibrational energy during collisions with CO2. The electronic-vibrational cross-section for CO2 peaks at electron ener-gies between 3 and 6 eV with a cross-section greater than1 × 10−16 cm2 for 1 eV< Te <10 eV; allowing for an effectivepathway for vibrational excitation and CO2 dissociation [12].Electronic excitation also allows for additional dissociation path-ways, the most common of which are dissociative attachment,impact dissociation, and dissociative ionization [13, 14]. Theseadditional reaction paths have considerably smaller cross-sectionsas compared to vibrational excitation, but can occur at lowerelectron energies. For instance, dissociative attachment occurs atelectron energies as low as 3.4 eV [12, 15, 16].
Another form of energy deposition inefficiency stems from thenumerous dissociative pathways within a plasma. Longer path-ways require larger energy input, which take energy away fromdissociative processes and increase the need for energy recupera-tion. The majority of these higher energy dissociative pathways ina CO2 plasma come from radical chemistry and ionization pro-cesses, for instance oxygen (O) relaxation; CO+
2 , CO+, and O+ionization and recombination; and charge exchange [6].
2.2. DIELECTRIC BARRIER DISCHARGES (DBDs)The DBD was first developed in 1857 by Ernst Werner VonSiemens for use in ozone production and was originally calledthe “silent discharge” [17]. The DBD is a high pressure, non-LTE(non-local thermodynamic equilibrium), transient, low temper-ature plasma discharge. Given their operating temperatures, highplasma densities, and high electron excitation efficiencies, DBDsare an attractive candidate for CO2 dissociation (see Table 1). Thedesign of a DBD is similar to an arc plasma (two electrodes andan air gap). However the DBD has a high breakdown voltagedielectric placed between the electrodes to impede arcing. TheDBD discharge is a short lived (1–100 nanosecond scale) elec-tron cascade brought on by the large electric fields created withinthe air gap [18–23]. The cascade is self-terminating and onlyrepeats when the applied voltage changes sign, because the elec-tron cascade charges the dielectric surface and shields the electricfield from the air gap. Therefore, typically a DBD consists of onegrounded electrode and the other is attached to a high frequency(60 Hz–500 kHz), high voltage (0–500 kV) power source.
Each DBD cascade leaves a population of high energy par-ticles in its wake. If the driving frequency is sufficiently high(>1 kHz), the remaining energized particles fuel the next cascade.The repeated reignition of the plasma in the same location createsa streamer plasma, the most common discharge in a DBD (oth-ers include the atmospheric pressure glow discharge). A streamer
Table 1 | General characteristics of an atmospheric pressure streamer.
ne 1014–1015 cm−3 Filament radius ∼10−3–10−4 m
Te 1–10 eV Streamer duration 1–10 ns
Tg <400 K Peak current 0.1–1 A
Density and temperature values listed are for the center of the discharge and
the magnitudes decrease with distance from the center of the streamer [24].
Frontiers in Physics | Plasma Physics September 2014 | Volume 2 | Article 55 | 2

Lindon and Scime CO2 dissociation using VADER
FIGURE 1 | The anatomy of a single DBD streamer with dielectric
covering one electrode.
is an oscillating, non-LTE, filament-like plasma created by a largeelectric field and consists of three regions: two surface dischargeregions and a micro-discharge channel (see Figure 1). The sur-face discharge regions are where the plasma is in contact witheither a dielectric or electrode surface and generally has a diame-ter between 1 cm and 1 mm. The surface discharge is due to theopposing electric field of the charges on the dielectric surfacewhich deflect impinging particles. The surface discharge diameteris reduced on electrode surfaces due to electrons being conductedout of the system. The micro-discharge channel is a thin channelof plasma outside of the surface discharge regions and is simi-lar to the initial cascade of an arc plasma, consisting of a verythin dense column of plasma connecting the two surface dis-charges. The typical plasma characteristics of the streamer arelisted in Table 1 [24]. Due to the localized nature of streamers, it iscommon for multiple streamers to form across the electrode sur-faces. The number of streamers that form, and in turn the plasmavolume, is dependent on many variables including the appliedvoltage, driving frequency, gas pressure, gas composition, systemgeometry, electrode and dielectric materials. In general, higherpotentials across the air gap and low ionization energy gases leadto higher streamer densities. A detailed description of streamerdynamics is given in Lindon [6].
2.3. DBD PLASMA CHEMICAL MODELTo understand the chemistry of CO2 dissociation within a DBD,a simple, 0-D DBD plasma chemical model based on streamerdynamics within a micro-discharge channel was developed. Themodel calculates the electron, ion and chemical reaction ratesbased on the three overlapping stages of a streamer: the cascadephase, the afterglow phase and the ground state phase [18, 25].The parameters of the model were based on VADER param-eters with a flow rate of 200 standard cubic centimeters perminute (SCCM) passing through a 0.3175 cm2 inlet cross-sectionand a driving frequency of 30 kHz. The model was compared toone of VADER’s best experimental results in which 5% of CO2
was dissociated using the above parameters (a gas compositionof 92.5% CO2, 5% CO and 2.5% O2); which corresponds toan ∼4×10⁻⁶ mol/s conversion rate and a volumetric reaction
rate, r, of ∼1.25×10⁻⁶ mol/cm3 s. Therefore, reaction rates sig-nificantly below these rates are ignorable. This same analysis andreaction rate metric was applied to a plasma with a gas compo-sition of 56.5% CO2, 40% Ar, 3% CO, 1.5% O2 to compare toexperimental results with 40% argon.
2.3.1. The cascade phaseThe cascade phase encompasses streamer formation (the cas-cade) and shielding of the external electric field. Within the firstnanoseconds of the cascade, the electron and ion densities reacha maximum of anywhere from 1012–1015 cm−3 with average elec-tron temperatures between 1 and 10 eV. Once the cascade reachesthe electrode/dielectric, it dissipates due to shielding. Duringthese several nanoseconds (10 ns in the model) of high energyand high density electrons, electron impact reactions dominateand endothermic reactions are possible.
The reaction rates during the cascade phase were calculatedusing
r
(moles
cm3 s
)=
∫ ∞
0f (ve)σ (ve)ve[A]dve × L (5)
where r is the reaction rate, ve is the electron velocity, f (ve) isthe Druyvestyn electron velocity distribution function (f (v) =e− (mv2)2
(2kTe)2 , as suggested in Carman and Mildren [26]), σ (ve) isthe relevant electron-CO2 cross-section, [A] is the target ion orneutral density, and L is the time the plasma is within the cas-cade phase over the time in the afterglow and neutral phase. Therelevant electron-CO2 collision reactions and their correspond-ing cross-sections are tabulated in Lindon [6]. The cross-sectionswere obtained from Itikawa [12], Anzai et al. [27], Seiersen et al.[28], McConkey et al. [15], Itikawa [29], Peverall et al. [30],Sheehan and St Maurice [31], Rosén et al. [32], Rapp and Briglia[33], Schulz [34], Zecca et al. [35], Rejoub et al. [36], Deraiet al. [37], Flesch and Ng [38], and Flesch et al. [39]. A mini-mum electron density of ne = 1012 cm−3 was assumed to providea lower limit on the important reaction rates occurring withinthe streamer. All reaction rates scale linearly with electron den-sity, except for reactions involving charged particles which scalewith n2
e .
2.3.2. The afterglow phase and neutral phaseOnce the electric field is shielded during the cascade phase, thestreamer enters the afterglow phase. The afterglow phase is domi-nated by free radical chemistry. Free radicals are created followingthe recombination of electrons with ions and the high energyreactions within the cascade phase [18, 25]. During this phase, theelectron temperature and density quickly drop as electrons collidewith particles and recombine at a high rate. Approximately 1 msafter the initial discharge, the population of free radicals becomessmall enough that ground state chemistry dominates. Due to thesmall neutral temperatures found in a DBD, CO2 neutral chem-istry is slow and the chemistry favors reverse reactions. Therefore,DBDs for CO2 dissociation and other endothermic reactions areoften pulsed at frequencies such that time in the ground statephase is minimized (>500 Hz).
www.frontiersin.org September 2014 | Volume 2 | Article 55 | 3
Lindon and Scime CO2 dissociation using VADER
The free radical, recombination and neutral reaction rates forgas temperatures (Tg) between 300 and 3000 K were calculatedusing the rate equation
r = dn
dt= k[R1][R2][R3] (6)
where k is the rate coefficient and [R1], [R2], and [R3] are themolar densities of reactants 1, 2, and 3 ([R3] = 1 for second orderreactions). A list of the relevant reactions and correspondingrate coefficients are in Lindon [6]; the rate coefficients weretabulated from Derai et al. [37], Seiersen et al. [28], Rosén et al.[32], Seiersen et al. [40], Sheehan and St Maurice [31], Peverallet al. [30], Tsang and Hampson [41], Hippler et al. [42], Heimerland Coffee [43], Shaw [44], Atkinson et al. [45], Pshezhetskiiet al. [46], Harteck and Dondes [47], Toby et al. [48], Arin andWarneck [49], and Mick et al. [50]. CO2, CO, O2 and Ar densitieswere scaled to atmospheric pressure densities (n = 2.454 ×1019 cm−3) based on their individual partial pressures. A densityof ne = 1012 cm−3 was assumed to determine the minimum elec-tron reaction rates. CO+
2 , CO+, and O+2 densities were scaled to
the electron density based on their partial pressures. The O den-sity was assumed to be 3.43 × 1014 cm−3, as this is the minimumO density needed for ∼5% dissociation in VADER at 200 SCCMand 30 kHz (4 × 10⁻⁶ mol/s). Therefore, the calculated reactionrates including O are minimum reaction rates. Ozone was notdetected in any of the VADER experiments. However, ozonequickly breaks down even at low temperatures and ozone was
found to be a favorable reaction even with minimal amountsof atomic oxygen. Therefore, the ozone density was scaled tothe ozone production rate (O2 + O + M → O3 + M) and thedriving frequency, yielding an ozone density of ∼1013 cm−3.
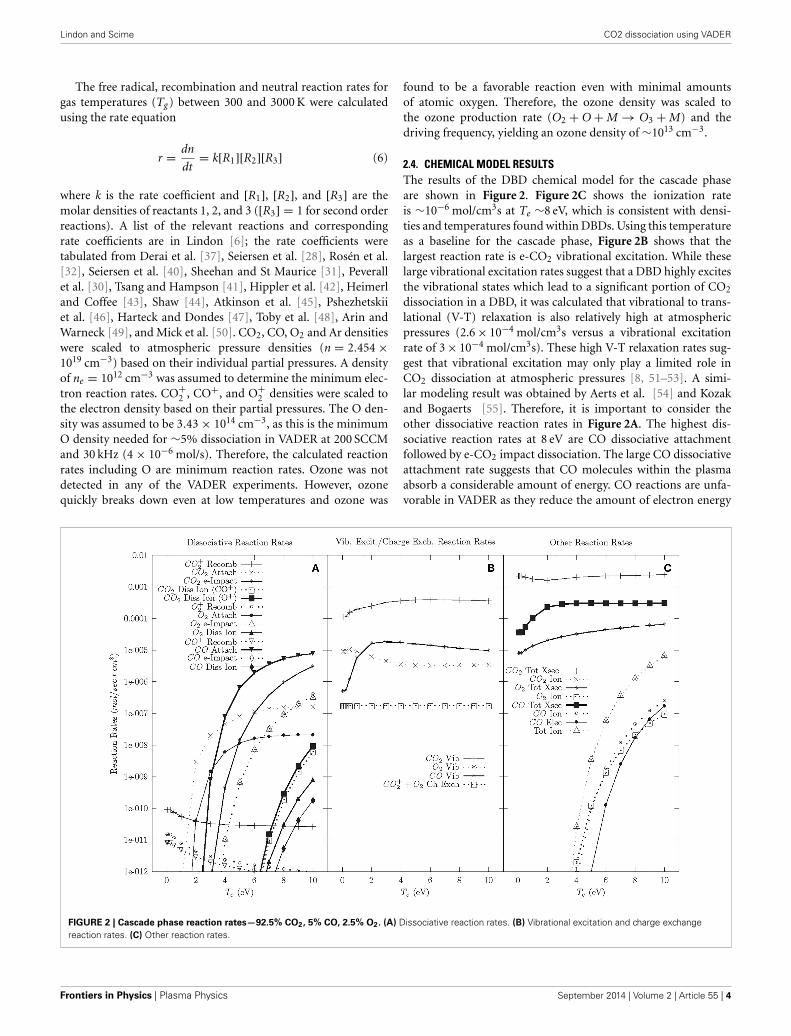
2.4. CHEMICAL MODEL RESULTSThe results of the DBD chemical model for the cascade phaseare shown in Figure 2. Figure 2C shows the ionization rateis ∼10−6 mol/cm3s at Te ∼8 eV, which is consistent with densi-ties and temperatures found within DBDs. Using this temperatureas a baseline for the cascade phase, Figure 2B shows that thelargest reaction rate is e-CO2 vibrational excitation. While theselarge vibrational excitation rates suggest that a DBD highly excitesthe vibrational states which lead to a significant portion of CO2
dissociation in a DBD, it was calculated that vibrational to trans-lational (V-T) relaxation is also relatively high at atmosphericpressures (2.6 × 10⁻⁴ mol/cm3s versus a vibrational excitationrate of 3 × 10⁻⁴ mol/cm3s). These high V-T relaxation rates sug-gest that vibrational excitation may only play a limited role inCO2 dissociation at atmospheric pressures [8, 51–53]. A simi-lar modeling result was obtained by Aerts et al. [54] and Kozakand Bogaerts [55]. Therefore, it is important to consider theother dissociative reaction rates in Figure 2A. The highest dis-sociative reaction rates at 8 eV are CO dissociative attachmentfollowed by e-CO2 impact dissociation. The large CO dissociativeattachment rate suggests that CO molecules within the plasmaabsorb a considerable amount of energy. CO reactions are unfa-vorable in VADER as they reduce the amount of electron energy
FIGURE 2 | Cascade phase reaction rates—92.5% CO2, 5% CO, 2.5% O2. (A) Dissociative reaction rates. (B) Vibrational excitation and charge exchangereaction rates. (C) Other reaction rates.
Frontiers in Physics | Plasma Physics September 2014 | Volume 2 | Article 55 | 4

Lindon and Scime CO2 dissociation using VADER
that goes toward CO2 dissociation. However, for the purposes offorming value-added chemicals, the carbon atoms created duringCO dissociative attachment could be used to form longer carbonchains. Additionally, CO and O2 vibrational excitation similarlytake energy away from CO2 dissociation and have similar reactionrates to CO attachment, thereby creating an additional energy lossmechanism in VADER.
In the wake of the cascade, plasma temperatures decreaseand lower electron temperature chemistry becomes important.Figure 2A shows that at lower electron temperatures (<4 eV), thedissociation reaction rate drops significantly and CO2 attachmentdominates. Below 2 eV, dissociative reaction rates are negligible.There is also considerable vibrational excitation, but at lower elec-tron temperatures it is presumed that far fewer of those reactionswill initiate dissociation.
Once the electron cooling has finished, the plasma entersthe afterglow phase; which is initially dominated by the relax-ation of charged particles (see Figure 3A). The model showsthat this relaxation is dominated by CO+
2 charge exchange withO2 (CO+
2 + O2 → CO2 + O+2 ). This charge exchange process
reduces the CO+2 population, which reduces CO+
2 recombina-tion (e + CO+
2 → CO + O) and encourages O+2 recombination
(e + O+2 → O + O); a reverse reaction.
Once the charged particles are neutralized, the neutral andradical reactions dominate (Figure 3B). At a Tg > 500 K, thereverse reactions are preferred. O and O2 preferentially react withCO to reform CO2, given a small population of CO and O2
background gas. At Tg < 500 K, the preferred reaction is theformation of ozone. Looking at the reaction rates for ozone, ozone
preferentially decays into O2 at lower temperatures (<500 K).This suggests that the preferred relaxation pathway for CO2 dis-sociation in DBDs involves the formation and decay of ozone,similar to what is seen in ozonizers [56].
The cascade phase reaction rates with argon are shown inFigure 4. Modeling with argon doping was performed because ofthe significant gain in CO2 dissociation efficiency with the addi-tion of argon observed in the experiments. The model shows thatthe dissociative reaction rates and ionization rates are minimallyaffected by the addition of argon. The one significant change dueto the addition of argon is the Ar+-CO2 charge exchange rate,which is more than 100 times larger than other charge exchangerates. While not quantitative, this suggests that Ar+-CO2 chargeexchange could be responsible for increased CO+
2 populations,which results in dissociation following electron-CO+
2 recombi-nation. Due to the large binding energies of argon, argon has aminimal effect on the afterglow/neutral phases beyond affectingthe charge exchange reactions and reducing the overall reactionrates.
3. VADER DESIGNThe Versatile Atmospheric Dielectric barrier dischargeExpeRiment (VADER) was designed to examine the vari-ables that affect CO2 dissociation within a DBD. The detaileddesign is described within Lindon [6]. VADER is a planar DBD atthe center of a 20.32 cm Lesker 6 way CF cross. A diagram of thesystem is shown in Figure 5.
To control the gas flow within the reaction volume, the VADERDBD was created by sandwiching a custombuilt reaction box
FIGURE 3 | Afterglow and Neutral phase reaction rates—92.5% CO2, 5% CO, 2.5% O2. (A) Ion and electron reactions. (B) Radical and neutral reactions.
www.frontiersin.org September 2014 | Volume 2 | Article 55 | 5

Lindon and Scime CO2 dissociation using VADER
FIGURE 4 | Cascade phase reaction rates—56.5% CO2, 40% Ar, 3% CO, 1.5% O2. (A) Dissociative reaction rates. (B) Vibrational excitation and chargeexchange reaction rates. (C) Other reaction rates.
FIGURE 5 | A schematic of the VADER system.
between a stainless steel (SS) high voltage electrode and a SSground electrode. The DBD, in layered order, consisted of a 5 cmdiameter HV electrode, a 0.3175 cm thick quartz dielectric, a0.3175 cm air gap and a 5.7 cm diameter ground electrode giv-ing a total reaction volume of ∼3.2 cm3. The ground electrodewas slightly larger than the HV electrode to increase uniformity.
For experiments using a catalyst, the quartz disk was replaced by aquartz disk with a thin film, <0.025 cm thick, of P25 TiO2 appliedto a ∼5 cm diameter patch at the center of the disk.
Gas flow through the reaction volume was regulated using a setof MKS 500 and 100 SCCM mass flow controllers supplying CO2
and Ar, respectively. The pressure within the reaction box was
Frontiers in Physics | Plasma Physics September 2014 | Volume 2 | Article 55 | 6
Lindon and Scime CO2 dissociation using VADER
monitored with an Ashcroft compound vacuum pressure gaugeand regulated using a throttling valve (needle valve) attached toa Pfeiffer Xtra dry vacuum pump. To measure the output gasproperties, a two stage capillary leak system connected to a resid-ual gas analyzer (RGA) was teed off the exhaust line ahead ofthe throttling valve. The capillary leak was designed by VacuumTechnology Incorporated (VTI) and was connected to a StanfordResearch Systems (SRS) RGA100. The first stage pressure was reg-ulated using a Pfeiffer Xtra dry vacuum pump (760 Torr to 10−2
Torr) and the second stage was regulated using a Pfeiffer TSH-521 turbo pump (10−2 Torr to 10−8 Torr). The pressures in thesecond stage were measured with an SRS ion pressure gauge andConvectronTM gauge. The RGA was calibrated by flowing Ar, COand air into the system at varying pressures and recording theRGA’s response. Before and after each experimental run the entiregas system was flushed with new gas.
Two HV power supplies were used to power VADER’s HV elec-trode: a TREK 10/10B HV power amplifier with signal input froma HP 33120A 15 MHz Waveform Generator and a DIDRIV10power supply from amazing1.com. The TREK power amplifieroutputted ±10 kV over the frequency range 0–2.5 kHz with a cur-rent limit of 10 mA and a max output power of 50 W. At higherdriving frequencies, the voltage dropped linearly with frequencysuch that at 7 kHz the output voltage was ±5 kV. Due to thesevoltage limitations, all experimental runs using the TREK powersupply were performed at the maximum voltage available. Outputpower from the TREK power supply was measured using its built-in current and voltage monitors. The DIDRIV10 power supplyoutputted a maximum voltage of 1.9 kV and 513 mA at 28.4 kHzand ±1.7 kV and 455 mA at 30 kHz, these were the only two fre-quencies that consistently formed a plasma. Due to the variationin maximum voltages with frequency, the voltage readings for theDIDRIV10 power supply are reported as either 100% (the max-imum voltage setting) and 90% (90% of the maximum voltage).Output power from the DIDRIV10 power supply was measuredusing a Rogowski coil and a voltage divider.
4. RESULTS AND DISCUSSION4.1. EXPERIMENTAL SETUPThe VADER experiments focused on the effects of multiple vari-ables on the dissociation rate and efficiency within a DBD. Thetested parameters are listed in Table 2. The dissociation rate(dN/dt) was calculated using the change in partial pressures ofCO and O2 (�p) measured by the RGA and the ideal gas law(PV = NRT),
dNCO2
dt= C
u�p
RT(7)
where C is a chemical constant (1 for CO and 2 O2, becauseCO2 → CO + 1/2O2), u is the volumetric flow rate through thereaction volume (dV/dt), R is the ideal gas constant and T is thesystem temperature (∼298 K for all runs). The CO2 dissociationefficiency (η) was calculated from
η = 2.94
[eV
molec
]dN
dt
1
P, (8)
where P is the forward power of the power supply. The majorsources for error in the results come from the RGA readings,which give an error of ∼14% and ∼10% for O2 and CO mea-surements, respectively.
Different experimental setups were compared using the per-cent difference in dissociation rate and efficiency due to a singlevariable. For instance, the percent difference in energy efficiencydue to the addition of a catalyst was calculated using
% Diff = ηCatalyst − ηNo Catalyst
(ηCatalyst + ηNo Catalyst)/2(9)
where ηCatalyst is the average energy efficiency for one experimen-tal setup using a catalyst and ηNo Catalyst is the average energyefficiency of the same experimental setup without a catalyst. Byapplying this calculation to every combination of variables andusing a bin size of 2.5%, a statistical distribution of the effectsof the catalyst is created. The same analysis is applied to eachset of system variables for both energy efficiency and dissocia-tion rate. Since different experimental setups are being compared,the appropriate analysis metrics are the mean, standard deviation(SD) and G1 sample skewness for each distribution; the results ofwhich are tabulated in Table 3. Figure 6 is an example of a percentdifference distribution comparing forward power between differ-ent gas mixtures (see [6] for graphical representations of all of thedata) [57, 58].
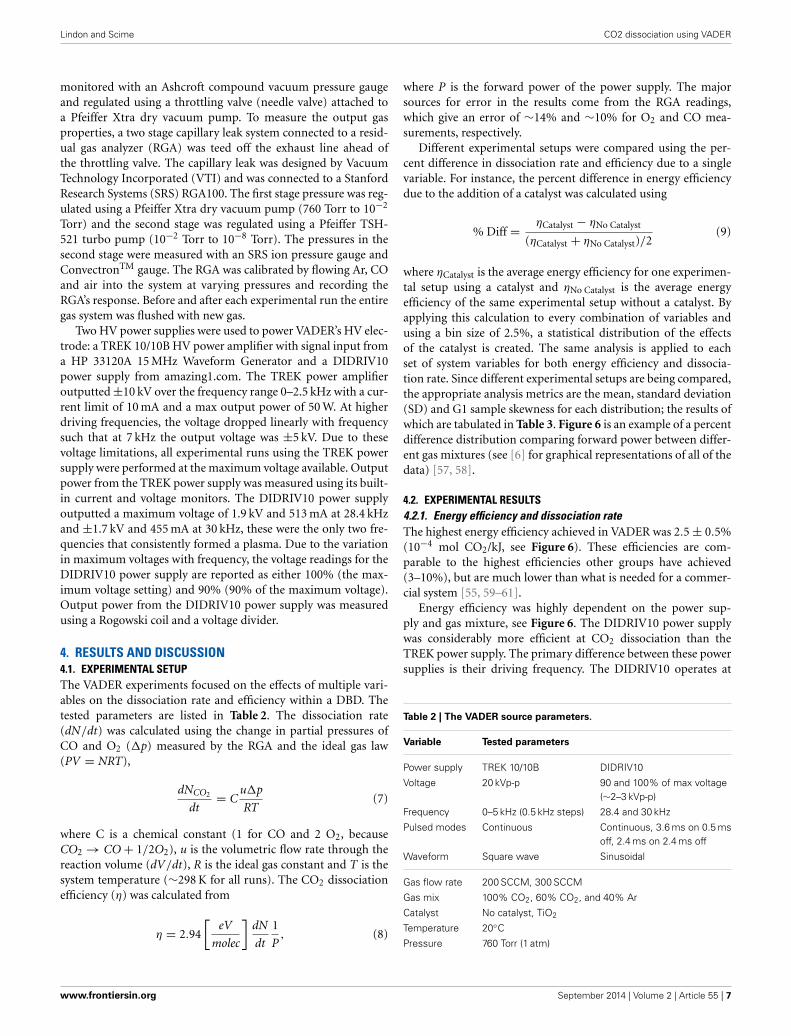
4.2. EXPERIMENTAL RESULTS4.2.1. Energy efficiency and dissociation rateThe highest energy efficiency achieved in VADER was 2.5 ± 0.5%(10−4 mol CO2/kJ, see Figure 6). These efficiencies are com-parable to the highest efficiencies other groups have achieved(3–10%), but are much lower than what is needed for a commer-cial system [55, 59–61].
Energy efficiency was highly dependent on the power sup-ply and gas mixture, see Figure 6. The DIDRIV10 power supplywas considerably more efficient at CO2 dissociation than theTREK power supply. The primary difference between these powersupplies is their driving frequency. The DIDRIV10 operates at
Table 2 | The VADER source parameters.
Variable Tested parameters
Power supply TREK 10/10B DIDRIV10
Voltage 20 kVp-p 90 and 100% of max voltage(∼2–3 kVp-p)
Frequency 0–5 kHz (0.5 kHz steps) 28.4 and 30 kHz
Pulsed modes Continuous Continuous, 3.6 ms on 0.5 msoff, 2.4 ms on 2.4 ms off
Waveform Square wave Sinusoidal
Gas flow rate 200 SCCM, 300 SCCM
Gas mix 100% CO2, 60% CO2, and 40% Ar
Catalyst No catalyst, TiO2
Temperature 20◦C
Pressure 760 Torr (1 atm)
www.frontiersin.org September 2014 | Volume 2 | Article 55 | 7

Lindon and Scime CO2 dissociation using VADER
Table 3 | Mean, standard deviation and skew for the percent difference distributions.
Parameter Power supply Energy efficiency Dissociation rate
Mean (%) SD (%) Skew Mean (%) SD (%) Skew
Gas flow rate (200 SCCM→300 SCCM, 100 CO2) TREK −0.2 6.7 −0.11 +4 5.6 +0.05
Gas flow rate (200 SCCM→300 SCCM, 60 CO2) TREK −10.1 3 −0.14 −0.2 3.1 −0.46
Gas flow rate (200 SCCM→300 SCCM) DIDRIV10 +3.7 6.3 +0.04 +5.4 6.6 +0.03
Catalyst (No catalyst→Catalyst) TREK +3.6 6 0.14 −0.2 5.2 +1.23
DIDRIV10 +17.7 7 +0.29 +11.6 5.9 −0.31
Gas composition (100 CO2→60 CO2 40 Ar) TREK +34.4 10.7 +1.29 +25 9.8 +1.36
DIDRIV10 +53.4 25.7 +0.36 +31.1 26.6 +0.36
Voltage (90→100) DIDRIV10 +24.8 19.5 +0.89 +42.7 17.8 +0.84
Frequency (30 →28.4 kHz, 100 CO2, 100 V) DIDRIV10 +22 6.9 −0.49 +54.9 5.6 −0.84
Frequency (30 →28.4 kHz, 60 CO2, 100 V) DIDRIV10 −12.9 6.1 −0.6 +20.5 2.9 −0.63
Frequency (30 →28.4 kHz, 100 CO2, 90 V) DIDRIV10 +53.9 9 −0.4 +82.3 8.5 −0.62
Frequency (30 →28.4 kHz, 60 CO2, 90 V) DIDRIV10 +0.1 4.6 +0.28 +32.8 3.9 −0.18
Pulse mode (2.4 ms on 2.4 ms off→Continuous) DIDRIV10 −7.9 8.5 −1.27 +55.3 6 −1.15
Pulse mode (3.6 ms on 0.5 ms off→Continuous) DIDRIV10 −5.7 9.4 −1.41 +5.9 7.1 −1.68
Pulse mode (2.4 ms on→3.6 ms on) DIDRIV10 −2.2 5.3 −0.08 +49.9 3.9 +0.35
Note, the percent difference is the percent change in dissociation rate and energy efficiency between two experimental settings (for instance going from 200 to
300 SCCM) and does not retain information about the experimental energy efficiency or dissociation rate.
FIGURE 6 | Energy efficiency vs. power and dissociation rate vs.
power. Blue squares (�) correspond to experimental runs with 60%CO2 and 40% Ar using the DIDRIV10 power supply, red plus signs
(+) correspond to 100% CO2 DIDRIV10 data, green x’s (x)correspond to 60% CO2 TREK data and purple diamonds (�)correspond to 100% CO2 TREK data.
higher frequencies than the TREK power supply (28.4–30 kHzversus 0–7 kHz, respectively), which suggests that higher driv-ing frequencies (in the range of 30 kHz) are significantly moreefficient than lower frequencies (0–7 kHz). A similar effect wasreported by Paulussen et al. [59]. This frequency dependenceis attributed to the amount of time the plasma spends inthe afterglow neutral phase going through reverse reactions.At lower driving frequencies, the discharge spends consider-ably more time within the afterglow neutral phase. The effectof replacing 40% of the CO2 with argon also greatly improveddissociation efficiencies (by >50%) and is further discussed inSection 4.2.4.
The largest dissociation rate achieved in VADER was 4 ± 0.4 ×10⁻⁶ mol/s (5 ± 0.5% of the input CO2), see Figure 6. The disso-ciation rate correlates directly with forward power, which is againconsistent with the results of Paulussen et al. [59]. The reasonfor the correlation with power is that forward power increaseswith increasing applied voltage, which controls the streamer den-sity and reaction volume. An increase in the reaction volumemeans more gas is being processed and reduces the time duringwhich the gas cools between streamers. While not seen in theseresults, Wang et al. [60] showed that there is a point of saturationabove which increasing the voltage no longer increases the disso-ciation rate; presumably due to a saturation of streamer density.
Frontiers in Physics | Plasma Physics September 2014 | Volume 2 | Article 55 | 8
Lindon and Scime CO2 dissociation using VADER
Figure 6 also indicates that argon and higher frequencies signifi-cantly improve dissociation rates (see Sections 4.2.4 and 4.2.5 formore details).
4.2.2. Gas flow rateThe gas flow rate is inversely proportional to the residence timeof the gas within the reaction volume. Wang et al. [60] has shownthat DBD efficiencies decrease with higher percentages of CO2
dissociated. Therefore, it was expected that a decrease in residencetime would increase dissociation efficiencies. However, the per-cent difference results for changing the flow rate from 200 to 300SCCM (residence time of 0.97–0.64 s) in VADER showed a mini-mal effect on the dissociation efficiency and rate (see Table 3). Forthe DIDRIV10 power supply, higher flow rates yielded a 4% witha standard deviation of 6% (i.e., 4% SD 6%) shift toward higherenergy efficiencies. For the TREK power supply there was a 10%SD 3% decrease in energy efficiency in cases with argon and nochange with pure CO2. We believe these results are caused by abuildup of energy in the molecular energy states and product gasdensities within the plasma, which encourage the dissociation ofthe product gases. For lower frequency power supplies, productdensities within a streamer stay small and there is limited energyaccumulation. Therefore, cold plasmas with small product den-sities stay in a regime where the re-use of excited species in thedischarge is more beneficial to CO2 dissociation than the effects ofproduct buildup and heating. The effects of energy accumulationin the plasma are enhanced with argon due to the slow recom-bination rates of argon and the longer mean free path of excitedparticles.
4.2.3. VoltageThe characteristics of a streamer are invariant to driving voltage(to an extent). Therefore, the voltage determines the number anddensity of streamers in a DBD [62, 63]. The invariance is due tothe short lifetime of a streamer (10 s of nanoseconds) in compar-ison to the relatively slow changes in voltage even at the higherfrequencies used in VADER (∼33 µs for one cycle at 30 kHz) [64].The density of streamers affects the amount of time a volume ofgas is processed within streamers (as opposed to between stream-ers), which changes the length of time a gas is highly excitedand experiences the neutral phase and its concomitant reversereactions. This reduction in reverse reactions explains the largeincreases in energy efficiency (+25% SD 19.5%) and dissociationrate (+43% SD 18%) as voltage was increased in the DIDRIV10experiments (see Table 3). These results run counter to thosereported by Paulussen et al. [59], Wang et al. [60], and Zhenget al. [61]. However, the frequency and voltages used in VADERwere much different than those groups’ DBD parameters. Note,the large variance in the percent difference values for the volt-age’s effect is because voltage, gas composition and frequency areinterrelated; which is further discussed in Section 4.2.5.
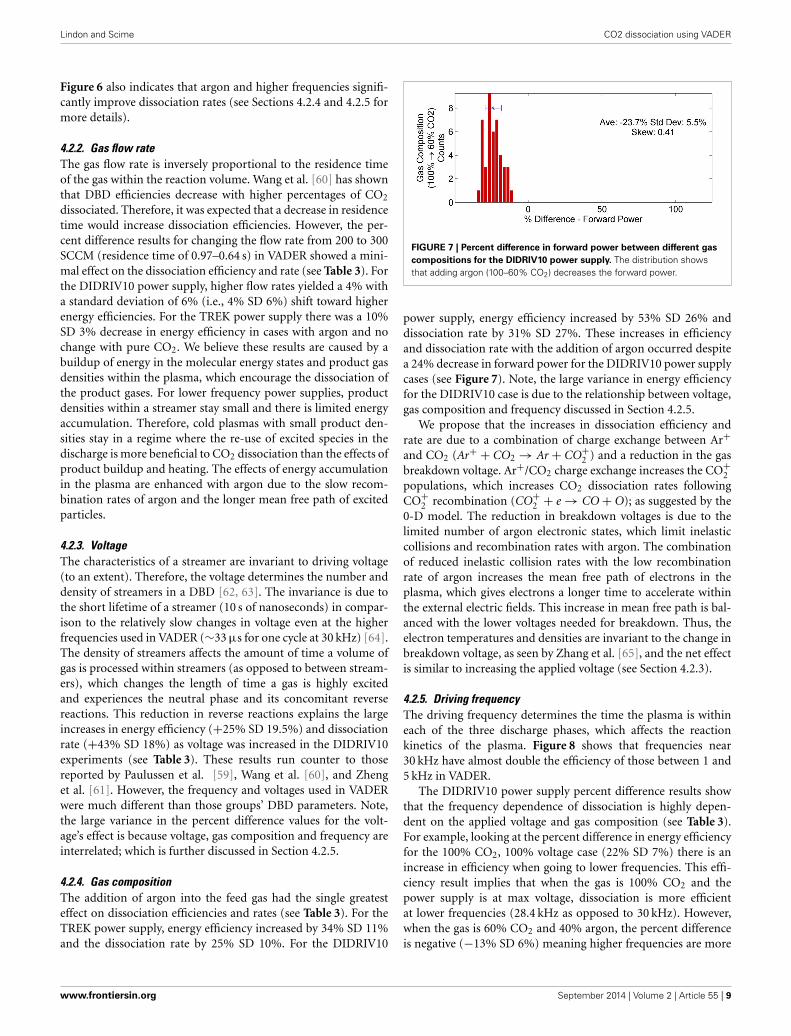
4.2.4. Gas compositionThe addition of argon into the feed gas had the single greatesteffect on dissociation efficiencies and rates (see Table 3). For theTREK power supply, energy efficiency increased by 34% SD 11%and the dissociation rate by 25% SD 10%. For the DIDRIV10
FIGURE 7 | Percent difference in forward power between different gas
compositions for the DIDRIV10 power supply. The distribution showsthat adding argon (100–60% CO2) decreases the forward power.
power supply, energy efficiency increased by 53% SD 26% anddissociation rate by 31% SD 27%. These increases in efficiencyand dissociation rate with the addition of argon occurred despitea 24% decrease in forward power for the DIDRIV10 power supplycases (see Figure 7). Note, the large variance in energy efficiencyfor the DIDRIV10 case is due to the relationship between voltage,gas composition and frequency discussed in Section 4.2.5.
We propose that the increases in dissociation efficiency andrate are due to a combination of charge exchange between Ar+and CO2 (Ar+ + CO2 → Ar + CO+
2 ) and a reduction in the gasbreakdown voltage. Ar+/CO2 charge exchange increases the CO+
2populations, which increases CO2 dissociation rates followingCO+
2 recombination (CO+2 + e → CO + O); as suggested by the
0-D model. The reduction in breakdown voltages is due to thelimited number of argon electronic states, which limit inelasticcollisions and recombination rates with argon. The combinationof reduced inelastic collision rates with the low recombinationrate of argon increases the mean free path of electrons in theplasma, which gives electrons a longer time to accelerate withinthe external electric fields. This increase in mean free path is bal-anced with the lower voltages needed for breakdown. Thus, theelectron temperatures and densities are invariant to the change inbreakdown voltage, as seen by Zhang et al. [65], and the net effectis similar to increasing the applied voltage (see Section 4.2.3).
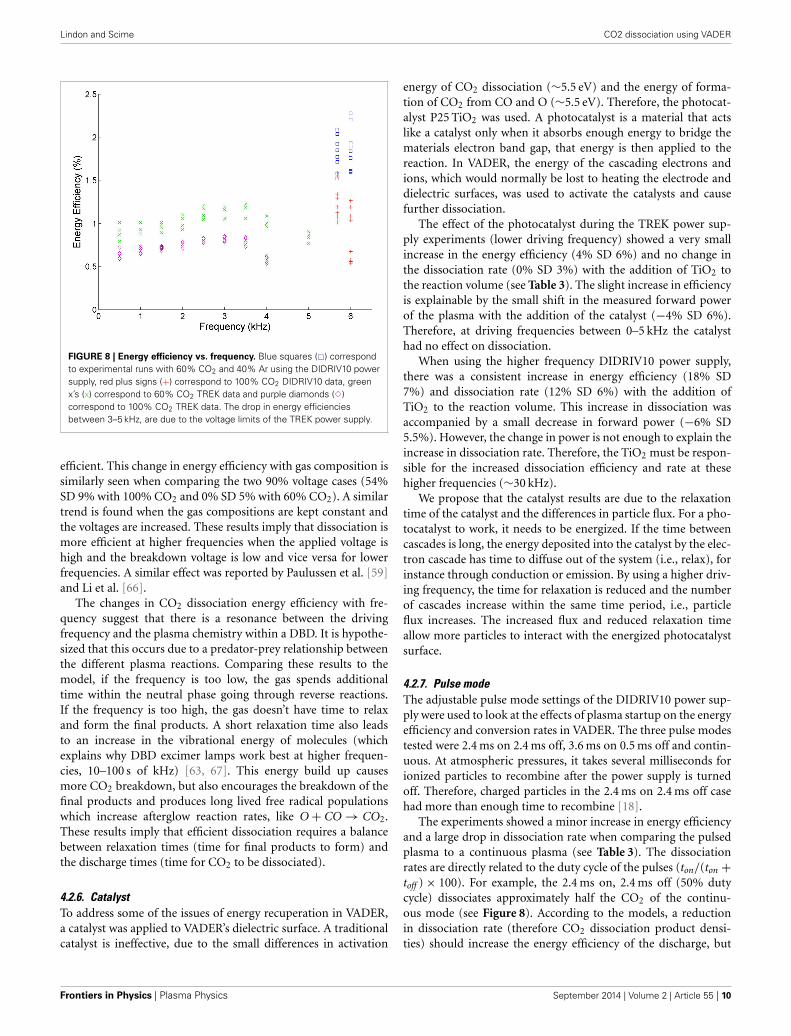
4.2.5. Driving frequencyThe driving frequency determines the time the plasma is withineach of the three discharge phases, which affects the reactionkinetics of the plasma. Figure 8 shows that frequencies near30 kHz have almost double the efficiency of those between 1 and5 kHz in VADER.
The DIDRIV10 power supply percent difference results showthat the frequency dependence of dissociation is highly depen-dent on the applied voltage and gas composition (see Table 3).For example, looking at the percent difference in energy efficiencyfor the 100% CO2, 100% voltage case (22% SD 7%) there is anincrease in efficiency when going to lower frequencies. This effi-ciency result implies that when the gas is 100% CO2 and thepower supply is at max voltage, dissociation is more efficientat lower frequencies (28.4 kHz as opposed to 30 kHz). However,when the gas is 60% CO2 and 40% argon, the percent differenceis negative (−13% SD 6%) meaning higher frequencies are more
www.frontiersin.org September 2014 | Volume 2 | Article 55 | 9
Lindon and Scime CO2 dissociation using VADER
FIGURE 8 | Energy efficiency vs. frequency. Blue squares (�) correspondto experimental runs with 60% CO2 and 40% Ar using the DIDRIV10 powersupply, red plus signs (+) correspond to 100% CO2 DIDRIV10 data, greenx’s (x) correspond to 60% CO2 TREK data and purple diamonds (�)correspond to 100% CO2 TREK data. The drop in energy efficienciesbetween 3–5 kHz, are due to the voltage limits of the TREK power supply.
efficient. This change in energy efficiency with gas composition issimilarly seen when comparing the two 90% voltage cases (54%SD 9% with 100% CO2 and 0% SD 5% with 60% CO2). A similartrend is found when the gas compositions are kept constant andthe voltages are increased. These results imply that dissociation ismore efficient at higher frequencies when the applied voltage ishigh and the breakdown voltage is low and vice versa for lowerfrequencies. A similar effect was reported by Paulussen et al. [59]and Li et al. [66].
The changes in CO2 dissociation energy efficiency with fre-quency suggest that there is a resonance between the drivingfrequency and the plasma chemistry within a DBD. It is hypothe-sized that this occurs due to a predator-prey relationship betweenthe different plasma reactions. Comparing these results to themodel, if the frequency is too low, the gas spends additionaltime within the neutral phase going through reverse reactions.If the frequency is too high, the gas doesn’t have time to relaxand form the final products. A short relaxation time also leadsto an increase in the vibrational energy of molecules (whichexplains why DBD excimer lamps work best at higher frequen-cies, 10–100 s of kHz) [63, 67]. This energy build up causesmore CO2 breakdown, but also encourages the breakdown of thefinal products and produces long lived free radical populationswhich increase afterglow reaction rates, like O + CO → CO2.These results imply that efficient dissociation requires a balancebetween relaxation times (time for final products to form) andthe discharge times (time for CO2 to be dissociated).
4.2.6. CatalystTo address some of the issues of energy recuperation in VADER,a catalyst was applied to VADER’s dielectric surface. A traditionalcatalyst is ineffective, due to the small differences in activation
energy of CO2 dissociation (∼5.5 eV) and the energy of forma-tion of CO2 from CO and O (∼5.5 eV). Therefore, the photocat-alyst P25 TiO2 was used. A photocatalyst is a material that actslike a catalyst only when it absorbs enough energy to bridge thematerials electron band gap, that energy is then applied to thereaction. In VADER, the energy of the cascading electrons andions, which would normally be lost to heating the electrode anddielectric surfaces, was used to activate the catalysts and causefurther dissociation.
The effect of the photocatalyst during the TREK power sup-ply experiments (lower driving frequency) showed a very smallincrease in the energy efficiency (4% SD 6%) and no change inthe dissociation rate (0% SD 3%) with the addition of TiO2 tothe reaction volume (see Table 3). The slight increase in efficiencyis explainable by the small shift in the measured forward powerof the plasma with the addition of the catalyst (−4% SD 6%).Therefore, at driving frequencies between 0–5 kHz the catalysthad no effect on dissociation.
When using the higher frequency DIDRIV10 power supply,there was a consistent increase in energy efficiency (18% SD7%) and dissociation rate (12% SD 6%) with the addition ofTiO2 to the reaction volume. This increase in dissociation wasaccompanied by a small decrease in forward power (−6% SD5.5%). However, the change in power is not enough to explain theincrease in dissociation rate. Therefore, the TiO2 must be respon-sible for the increased dissociation efficiency and rate at thesehigher frequencies (∼30 kHz).
We propose that the catalyst results are due to the relaxationtime of the catalyst and the differences in particle flux. For a pho-tocatalyst to work, it needs to be energized. If the time betweencascades is long, the energy deposited into the catalyst by the elec-tron cascade has time to diffuse out of the system (i.e., relax), forinstance through conduction or emission. By using a higher driv-ing frequency, the time for relaxation is reduced and the numberof cascades increase within the same time period, i.e., particleflux increases. The increased flux and reduced relaxation timeallow more particles to interact with the energized photocatalystsurface.
4.2.7. Pulse modeThe adjustable pulse mode settings of the DIDRIV10 power sup-ply were used to look at the effects of plasma startup on the energyefficiency and conversion rates in VADER. The three pulse modestested were 2.4 ms on 2.4 ms off, 3.6 ms on 0.5 ms off and contin-uous. At atmospheric pressures, it takes several milliseconds forionized particles to recombine after the power supply is turnedoff. Therefore, charged particles in the 2.4 ms on 2.4 ms off casehad more than enough time to recombine [18].
The experiments showed a minor increase in energy efficiencyand a large drop in dissociation rate when comparing the pulsedplasma to a continuous plasma (see Table 3). The dissociationrates are directly related to the duty cycle of the pulses (ton/(ton +toff ) × 100). For example, the 2.4 ms on, 2.4 ms off (50% dutycycle) dissociates approximately half the CO2 of the continu-ous mode (see Figure 8). According to the models, a reductionin dissociation rate (therefore CO2 dissociation product densi-ties) should increase the energy efficiency of the discharge, but
Frontiers in Physics | Plasma Physics September 2014 | Volume 2 | Article 55 | 10
Lindon and Scime CO2 dissociation using VADER
it is unclear if the energy efficiency gains are due to pulsing ora reduction in product density. However, since the energy effi-ciency change by pulsing was expected to be relatively small andthe change in energy efficiency was also small, the effects of CO2
products on dissociation in VADER must also be small.
5. SUMMARYUsing models and experiments, the important chemistry andplasma dynamics of a DBD for CO2 dissociation was investigated.To better understand the dynamics of the plasma chemistry, a 0-D plasma chemical model was developed. The model included theimportant reaction rates during each phase of the discharge andhow they relate to the CO2 dissociative process. Key predictionsof the model are that:
1. CO2 dissociation is controlled by a combination of vibrationalexcitation, electron impact and recombination reactions. Therates of these reactions are highly dependent on electron tem-perature, with higher CO2 dissociation rates achievable athigher electron energies.
2. Once CO2 is dissociated into CO and O, the relaxation of Oduring the afterglow phase and neutral phase determine thefinal chemical state of the gas. Relaxation of O (in a CO2
plasma) usually ends in the formation of O2, ozone or CO2.When CO and O2 are present (> 0.001% of total gas) themodel shows that O2 is preferentially formed through a reac-tion path following ozone formation and decay, which occursefficiently at gas temperatures below 500 K.
3. As more CO2 is dissociated in a DBD, the CO and O2 densitiesinfluence the chemistry by absorbing large portions of electronenergy that would otherwise go toward CO2 dissociation. Thissame effect has been reported by other groups [59–61].
Further improvements to the chemical model would entail incor-porating the temporal evolution of the discharge, expansion froma 0-dimensional to a multi-dimensional model, and the inclusionof more chemical reactions and surface chemistry. The PlasmantGroup in Germany is currently developing a more advanced 0-dchemical model that takes into account vibrational excitation andexcimer formation in a CO2 DBD [54, 55].
The key experimental results were:
1. Energy efficiency of CO2 dissociation in VADER was low,never exceeding ∼2.5 ± 0.5%.
2. The CO2 dissociation rates in VADER were modest, witha maximum dissociation rate of ∼4 × 10⁻⁶ ± 0.5 × 10⁻⁶
mol/sec and a maximum CO2 percent conversion of ∼5%.3. When the gas breakdown voltage (gas composition) and driv-
ing frequency are held relatively constant, the dissociation ratein VADER was found to increase linearly with power. Wanget al. [60] has shown that at higher powers this linear trendplateaus, due to an increase in product densities.
Experiments in which the effects of variations in the gas flow rate,driving voltage, gas composition, frequency, photocatalyst, andpulse sequence demonstrated that:
1. The gas residence time (flow rate) and pulse mode were foundto have a small effect on dissociation efficiencies and rates.We propose that the effects of gas residence time on disso-ciation are dependent on the plasma driving frequency andgas composition due to the buildup of dissociation productsand energy in molecular states with longer residence times.Consistent with the gas residence time, the pulse mode resultsrevealed that the amount of product gases created withinVADER have a small effect on CO2 dissociation rates andefficiencies.
2. Increasing the driving voltage and adding argon to the feed gassignificantly improved CO2 dissociation efficiencies and ratesin VADER. We propose that these increases in efficiency andrate are due to an increase in streamer densities and in thecase of argon, increased Ar-CO+
2 charge exchange. We notethat because other groups have shown that there is a limit inthe number of streamers that can be formed within a volume,these gains in dissociation efficiency and rate are likely to belimited [60].
3. For each applied voltage and gas composition, there appearsto be a resonant driving frequency that yields the best CO2
dissociation efficiencies and rates. We hypothesize that the res-onant frequency is due to a predator-prey relationship betweenCO2 dissociation rates and product gas formation rates (COand O2).
4. For the first time, a photocatalyst has been shown to improveCO2 dissociation within a DBD plasma. These improvementsin dissociation efficiency and rate were found to only occurat driving frequencies above 5 kHz, which is likely due to therelaxation rate of the catalyst and the increased particle flux tothe catalyst surface with higher frequencies.
Further research into CO2 dissociation using a DBD shouldexpand on the results listed above. These experiments should becarried out with more commercially viable DBD designs; a DBDwith a cylindrical geometry for instance. A larger range of flowrates should also be investigated to verify the effects of the gasresidence time on dissociation. A power supply with a larger andmore stable range of frequencies, voltages and power is neededto quantify the relationship between resonance frequencies, volt-ages and gas compositions. Since these experiments demonstratedthat dissociation rates improve with a reduction in gas breakdownvoltage, it would be prudent to look at the effects of adding dif-ferent gases to a DBD; including further studies into convertingCO2 into a value added chemical. Many groups have done testsusing various structures, foams, etc. for incorporating differentcatalysts into their experiments [66, 68–71]. Similar experimentsusing TiO2 should also be attempted.
FUNDINGDOE contract - DE-AC26-04NT41817.
ACKNOWLEDGMENTWe would like to acknowledge the National Energy TechnologyLaboratory, specifically Dushyant Shekhawat, Michael Gallagherand Dave Berry, and the National Research Center for Coal andEnergy for both funding and supporting this research.
www.frontiersin.org September 2014 | Volume 2 | Article 55 | 11
Lindon and Scime CO2 dissociation using VADER
REFERENCES1. IPCC. The fourth assessment report of the intergovernmental panel
on climate change - climate change 2007. In: Parry ML, Canziani OF,Palutikof JP, van der Linden PJ, Hanson CE, editors. Impacts, Adaptationand Vulnerability. Cambridge University Press (2007). Available onlineat: http://www.ipcc.ch/publications_and_data/publications_ipcc_fourth_assessment_report_wg2_report_impacts_adaptation_and_vulnerability.htm
2. Raupach MR, Marland G, Ciais P, Le Quéré C, Canadell JG, Klepper G, et al.Global and regional drivers of accelerating CO2 emissions. Proc Natl Acad SciUSA (2007) 104:10288–93. doi: 10.1073/pnas.0700609104
3. EPA. Carbon Dioxide Capture and Sequestration (2013). Available online at:http://www.epa.gov/climatechange/ccs/index.html
4. Styring P, Jansen D. Carbon Capture and Utilisation in the Green Economy.In: Using CO2 to Manufacture Fuel, Chemicals and Materials. Centre for LowCarbon Futures (2011). Available online at: http://www.lowcarbonfutures.org/reports/carbon-capture-and-utilisation-green-economy-1
5. Global CCS Institute. Accelerating the Uptake of CCS: Industrial use ofCaptured Carbon Dioxide. The Global CCS Institute, Parsons Brinckerhoff(2011). Available online at: http://www.globalccsinstitute.com/publications/accelerating-uptake-ccs-industrial-use-captured-carbon-dioxide
6. Lindon M. CO2 Dissociation using the Versatile Atmospheric Dielectric BarrierDischarge Experiment (VADER). Copyright ProQuest, UMI DissertationsPublishing (2014). Available online at: http://pqdtopen.proquest.com/pqdtopen/doc/1527497509.html?FMT=ABS
7. Darwent B. Bond Dissociation Energies in Simple Molecules. National Bureauof Standards (1970). Available online at: http://www.nist.gov/data/nsrds/NSRDS-NBS31.pdf
8. Fridman A. Plasma Chemistry. New York, NY: Cambridge University Press(2008). doi: 10.1017/CBO9780511546075
9. Rusanov VD, Fridman AA, Sholin GV. The Physice of a chemicallyactive plasma with nonequilibrium vibrational excitation of molecules.Soviet Phys Uspekhi (1981) 24:447–74. doi: 10.1070/PU1981v024n06ABEH004884
10. Capezzuto P, Cramarossa F, D’Agostino R, Molinari E. Contribution ofvibrational excitation to the rate of carbon dioxide dissociation in electricaldischarges. J Phys Chem. (1976) 80:882–8. doi: 10.1021/j100549a024
11. Silva T, Britun N, Godfroid T, Snyders R. Optical characterization of amicrowave pulsed discharge used for dissociation of CO2. Plasma Sources SciTechnol. (2014) 23:025009. doi: 10.1088/0963-0252/23/2/025009
12. Itikawa Y. Cross sections for electron collisions with carbon dioxide. J PhysChem Refer Data (2002) 31:749–67. doi: 10.1063/1.1481879
13. Rond C, Bultel A, Boubert P, Cheron BG. Spectroscopic measurements ofnonequilibrium CO2 plasma in RF torch. Chem Phys. (2008) 354:16–26. doi:10.1016/j.chemphys.2008.09.006
14. Polak L. Elementary chemical processes and kinetics in a non-equilibriumand quasi-equilibrium plasma. Pure Appl Chem. (1974) 39:307–42. doi:10.1351/pac197439030307
15. McConkey JW, Malone CP, Johnson PV, Winstead C, McKoy V, Kanik I.Electron impact dissociation of oxygen-containing molecules:A critical review.Phys Reports (2008) 466:1–103. doi: 10.1016/j.physrep.2008.05.001
16. Christophorou LG, Stockdale JAD. Dissociative electron attachment tomolecules. J Chem Phys. (1968) 48:1956–60. doi: 10.1063/1.1668997
17. Kogelschatz U, Eliasson B, Egli W. From ozone generators to flat televisionscreens: history and future potential of dielectric-barrier discharges. Pure ApplChem. (1999) 71:1819–28. doi: 10.1351/pac199971101819
18. Eliasson B, Egli W, Kogelschatz U. Modelling of dielectric bar-rier discharge chemistry. Pure Appl Chem. (1994) 66:1275–86. doi:10.1351/pac199466061275
19. Steinle G, Neundorf D, Hiller W, Pietralla M. Two-dimensional simulation offilaments in barrier discharges. J Phys D (1999) 32:1350. doi: 10.1088/0022-3727/32/12/311
20. Barni R, Esena P, Riccardi C. Chemical kinetics simulation for atmosphericpressure air plasmas in a streamer regime. J Appl Phys. (2005) 97:073301. doi:10.1063/1.1879081
21. Li J, Dhali SK. Simulation of microdischarges in a dielectric-barrier discharge.J Appl Phys. (1997) 82:4205–10. doi: 10.1063/1.366223
22. Eliasson B, Hirth M, Kogelschatz U. Ozone synthesis from oxygen in dielec-tric barrier discharges. J Phys D (1987) 20:1421. doi: 10.1088/0022-3727/20/11/010
23. Kulikovsky AA. Positive streamer in a weak field in air: a movingavalanche-to-streamer transition. Phys Rev E (1998) 57:7066–74. doi:10.1103/PhysRevE.57.7066
24. Kogelschatz U. Fundamentals and Applications of Dielectric-Barrier Discharges.ABB Corporate Research Ltd. (2000). Available online at: www.coronalab.net/wxzl/plasma-16.pdf
25. Kogelschatz U. Dielectric-barrier Discharges: their history, discharge physics,and industrial applications. Plasma Chem Plasma Proc. (2003) 23:1–46. doi:10.1023/A:1022470901385
26. Carman R, Mildren R. Electron energy distribution functions for mod-elling the plasma kinetics in dielectric barrier discharges. J Phys D (2000)33:L99–L103. doi: 10.1088/0022-3727/33/19/101
27. Anzai K, Kato H, Hoshino M, Tanaka H, Itikawa Y, Campbell L, et al. Crosssection data sets for electron collisions with H2, O2, CO, CO2, N2O and H2O.Eur Phys J D (2012) 66:1–8. doi: 10.1140/epjd/e2011-20630-1
28. Seiersen K, Al-Khalili A, Heber O, Jensen MJ, Nielsen IB, Pedersen HB, et al.Dissociative recombination of the cation and dication of CO2. Phys Rev A(2003) 68:022708. doi: 10.1103/PhysRevA.68.022708
29. Itikawa Y. Cross sections for electron collisions with oxygen molecules. J PhysChem Refer Data (2009) 38:1–20. doi: 10.1063/1.3025886
30. Peverall R, Rosén S, Peterson JR, Larsson M, Al-Khalili A, Vikor L, et al.Dissociative recombination and excitation of O+
2 : cross sections, productyields and implications for studies of ionospheric airglows. J Chem Phys.(2001) 114:6679–89. doi: 10.1063/1.1349079
31. Sheehan CH, St. Maurice JP. Dissociative recombination of N+2 , O+
2 , and NO+:Rate coefficients for ground state and vibrationally excited ions. J Geophys ResSpace Phys. (2004) 109:1884–2015. doi: 10.1029/2003JA010132
32. Rosén S, Peverall R, Larsson M, Le Padellec A, Semaniak J, Larson A, et al.Absolute cross sections and final-state distributions for dissociative recombi-nation and excitation of CO+(v = 0) using an ion storage ring. Phys Rev A(1998) 57:4462–71. doi: 10.1103/PhysRevA.57.4462
33. Rapp D, Briglia DD. Total cross sections for ionization and attachment ingases by electron impact. II. Negative-Ion formation. J Chem Phys. (1965)43:1480–9. doi: 10.1063/1.1696958
34. Schulz GJ. Cross sections and electron affinity for O− Ions from O2,CO, and CO2 by electron impact. Phys Rev. (1962) 128:178–86. doi:10.1103/PhysRev.128.178
35. Zecca A, Karwasz G, Brusa R. One century of experiments on electron-atomand molecule scattering: a critical review of integral cross-sections - Atomsand diatomic molecules. La Rivista del Nuovo Cimento (1996) 19:1–146. doi:10.1007/BF02742990
36. Rejoub R, Lindsay BG, Stebbings RF. Determination of the absolute partial andtotal cross sections for electron-impact ionization of the rare gases. Phys Rev A(2002) 65:042713. doi: 10.1103/PhysRevA.65.042713
37. Derai R, Kemper PR, Bowers MT. Effect of reactant ion internal and transla-tional energy on the rate constants of the charge exchange reactions: CO+
2 +O2 → O+
2 + CO2 and O+2 + O2 − − > O2 + O+
2 . J Chem Phys. (1985)82:4517–23. doi: 10.1063/1.448706
38. Flesch GD, Ng CY. Absolute state-selected and state-to-state total cross sectionsfor the Ar+(2P3/2,1/2)+CO2 reactions. J Chem Phys. (1992) 97:162–72. doi:10.1063/1.463616
39. Flesch GD, Nourbakhsh S, Ng CY. Absolute state-selected and state-to-statetotal cross sections for the Ar+(2P3/2,1/2)+CO reactions. J Chem Phys. (1991)95:3381–6. doi: 10.1063/1.460843
40. Seiersen K, Heber O, Jensen MJ, Safvan CP, Andersen LH. Dissociative recom-bination of dications. J Chem Phys. (2003) 119:839–43. doi: 10.1063/1.1579470
41. Tsang W, Hampson RF. Chemical kinetic data base for combustion chem-istry. Part I. Methane and related compounds. J Phys Chem Refer Data (1986)15:1087–279. doi: 10.1063/1.555759
42. Hippler H, Rahn R, Troe J. Temperature and pressure dependence of ozoneformation rates in the range 1–1000 bar and 90–370 K. J Chem Phys (1990)93:6560–9. doi: 10.1063/1.458972
43. Heimerl JM, Coffee TP. The unimolecular ozone decomposition reaction.Combustion Flame (1979) 35:117–23. doi: 10.1016/0010-2180(79)90015-4
44. Shaw R. Estimation of rate constants as a function of temperature for the reac-tions W + XYZ = WX + YZ, where W, X, Y, and Z are H or O atoms. Int J ChemKinetics (1977) 9:929–41. doi: 10.1002/kin.550090608
45. Atkinson R, Baulch DL, Cox RA, Crowley JN, Hampson RF, Hynes RG, et al.Evaluated kinetic and photochemical data for atmospheric chemistry: volume
Frontiers in Physics | Plasma Physics September 2014 | Volume 2 | Article 55 | 12

Lindon and Scime CO2 dissociation using VADER
I - gas phase reactions of Ox , HOx , NOx and SOx species. Atmospheric ChemPhys. (2004) 4:1461–1738. doi: 10.5194/acp-4-1461-2004
46. Pshezhetskii SY, Morozov NM, Kamenetskaya SA, Siryatskaya VN, Gribova EI.Kinetics of the thermal decomposition of ozone. Russ J Phys Chem. (1959)33:328–30.
47. Harteck P, Dondes S. Reaction of carbon monoxide and ozone. J Chem Phys.(1957) 26:1734–7. doi: 10.1063/1.1743612
48. Toby S, Sheth S, Toby FS. Reaction of carbon monoxide with ozone and oxygenatoms. Int J Chem Kinetics (1984) 16:149–57. doi: 10.1002/kin.550160206
49. Arin LM, Warneck P. Reaction of ozone with carbon monoxide. J Phys Chem.(1972) 76:1514–6. doi: 10.1021/j100655a002
50. Mick HJ, Burmeister M, Roth P. Atomic resonance absorption spectroscopymeasurements on high-temperature CO dissociation kinetics. AIAA J. (1993)31:671–6. doi: 10.2514/3.11602
51. Blauer JA, Nickerson GR. A Survey of Vibrational Relaxation Rate Data forProcesses Important to CO2-N2-H2O Infrared Plume Radiation. Ft. Belvoir, VA:Air Force Rocket Propulsion Laboratory (1973).
52. Gower MC, Carswell AI. Laser-induced plasma perturbation studies of energytransfer in CO[sub 2] glow-discharge lasers. J Appl Phys. (1974) 45:3922–9.doi: 10.1063/1.1663888
53. Huetz-Aubert M, Tripodi R. Rate equations for the vibrational relaxation ofCO[sub 2][single bond]N[sub 2] or CO[sub 2]- noble gas mixtures— applica-tion to comparison of spectrophone data with results from other experimentaltechniques. J Chem Phys. (1971) 55:5724–34. doi: 10.1063/1.1675743
54. Aerts R, Martens T, Bogaerts A. Influence of Vibrational States on CO2
Splitting by Dielectric Barrier Discharges. J Phys Chem C (2012) 116:23257–73.doi: 10.1021/jp307525t
55. Kozak T, Bogaerts A. Splitting of CO 2 by vibrational excitation in non-equilibrium plasmas: a reaction kinetics model. Plasma Sources Sci Technol.(2014) 23:045004. doi: 10.1088/0963-0252/23/4/045004
56. Vezzu G, Lopez JL, Freilich A, Becker KH. Optimization of large-scale ozone generators. Plasma Sci IEEE Trans. (2009) 37:890–6. doi:10.1109/TPS.2009.2015452
57. Joanes DN, Gill CA. Comparing measures of sample skewness and kurtosis. JR Stat Soc D (1998) 47:183–9. doi: 10.1111/1467-9884.00122
58. Bulmer G. Principles of Statistics, Dover Books on Mathematics Series. New York,NY: Dover Publications (1979).
59. Paulussen S, Verheyde B, Tu X, Bie CD, Martens T, Petrovic D, et al. Conversionof carbon dioxide to value-added chemicals in atmospheric pressure dielec-tric barrier discharges. Plasma Sources Sci Technol. (2010) 19:034015. doi:10.1088/0963-0252/19/3/034015
60. Wang JY, Xia GG, Huang A, Suib SL, Hayashi Y, Matsumoto H. CO2
decomposition using glow discharge plasmas. J Catal. (1999) 185:152–9. doi:10.1006/jcat.1999.2499
61. Zheng G, Jiang J, Wu Y, Zhang R, Hou H. The mutual conversion of CO2 andCO in dielectric barrier discharge (DBD). Plasma Chem Plasma Process. (2003)23:59–68. doi: 10.1023/A:1022464702294
62. Kogelschatz U. Filamentary, patterned, and diffuse barrier discharges. IEEETrans Plasma Sci. (2002) 30:1400–8. doi: 10.1109/TPS.2002.804201
63. Kogelschatz U. Excimer lamps: history, discharge physics, and industrial appli-cations. Proc SPIE (2004) 5483:272–86. doi: 10.1117/12.563006
64. Guikema J, Miller N, Niehof J, Klein M, Walhout M. Spontaneous pattern for-mation in an effectively one-dimensional dielectric-barrier discharge system.Phys Rev Lett. (2000) 85:3817–20. doi: 10.1103/PhysRevLett.85.3817
65. Zhang Y, Wen XH, Yang WH. Excitation temperatures of atmospheric argonin dielectric barrier discharges. Plasma Sources Sci Technol. (2007) 16:441. doi:10.1088/0963-0252/16/3/003
66. Li R, Yamaguchi Y, Yin S, Tang Q, Sato T. Influence of dielectric barrier mate-rials to the behavior of dielectric barrier discharge plasma for CO2 decompo-sition. Solid State Ionics (2004) 172:235–8. doi: 10.1016/j.ssi.2004.02.036
67. Sosnin EA, Oppenlander T, Tarasenko VF. Applications of capacitive and bar-rier discharge excilamps in photoscience. J Photochem Photobiol C PhotochemRev. (2006) 7:145–63. doi: 10.1016/j.jphotochemrev.2006.12.002
68. Rico VJ, Hueso JL, Cotrino J, Gallardo V, Sarmiento B, Brey JJ, et al. Hybridcatalytic-DBD plasma reactor for the production of hydrogen and preferentialCO oxidation (CO-PROX) at reduced temperatures. Chem Commun. (2009)41:6192–4. doi: 10.1039/b909488a
69. Kraus M, Eliasson B, Kogelschatz U, Wokaun A. CO2 reforming of methaneby the combination of dielectric-barrier discharges and catalysis. Phys ChemChem Phys. (2001) 3:294–300. doi: 10.1039/b007015g
70. Wen Y, Jiang X. Decomposition of CO2 using pulsed corona discharges com-bined with catalyst. Plasma Chem Plasma Process. (2001) 21:665–78. doi:10.1023/A:1012011420757
71. Suib SL, Brock SL, Marquez M, Luo J, Matsumoto H, Hayashi Y. Efficientcatalytic plasma activation of CO2, NO, and H2O. J Phys Chem B (1998)102:9661–6. doi: 10.1021/jp9822079
Conflict of Interest Statement: The authors declare that the research was con-ducted in the absence of any commercial or financial relationships that could beconstrued as a potential conflict of interest.
Received: 02 July 2014; accepted: 27 August 2014; published online: 26 September2014.Citation: Lindon MA and Scime EE (2014) CO2 dissociation using the Versatileatmospheric dielectric barrier discharge experiment (VADER). Front. Phys. 2:55. doi:10.3389/fphy.2014.00055This article was submitted to Plasma Physics, a section of the journal Frontiers inPhysics.Copyright © 2014 Lindon and Scime. This is an open-access article distributedunder the terms of the Creative Commons Attribution License (CC BY). The use,distribution or reproduction in other forums is permitted, provided the originalauthor(s) or licensor are credited and that the original publication in this jour-nal is cited, in accordance with accepted academic practice. No use, distribution orreproduction is permitted which does not comply with these terms.
www.frontiersin.org September 2014 | Volume 2 | Article 55 | 13