co x - nasa · tests were performed at a simulated mach number of 0.8, over a range of engine inlet...
TRANSCRIPT

N A S A T E C H N I C A L
M E M O R A N D U M
COinCOix
NASA TM X-3537
INLET REYNOLDS NUMBER
AND TEMPERATURE EFFECTS ON
THE STEADY-STATE PERFORMANCE
OF A TFE731-2 TURBOFAN ENGINE
George A. Bobula and Roy A. Lottig
Lewis Research Center
and
Lewis Directorate,
U.S. Army Air Mobility R&D Laboratory
Cleveland, Ohio 44135
NATIONAL AERONAUTICS AND SPACE ADMINISTRATION • WASHINGTON, 0. C. • MAY 1977
https://ntrs.nasa.gov/search.jsp?R=19770017194 2020-03-28T06:54:59+00:00Z

1. Report No.
NASA TM X-3537
2. Government Accession No. 3. Recipient's Catalog No.
4. Title and Subtitle INLET REYNOLDS NUMBER AND TEMPERATURE
EFFECTS ON THE STEADY-STATE PERFORMANCE OF
A TFE731-2 TURBOFAN ENGINE
5. Report Date
May 19776. Performing Organization Code
7. Author(s)
George A. Bobula and Roy A. Lottig8. Performing Organization Report No.
E-8941
9. Performing Organization Name and Address
NASA Lewis Research Center andU.S. Army Air Mobility R&D LaboratoryCleveland, Ohio 44135
10. Work Unit No.
505-0511. Contract or Grant No.
12. Sponsoring Agency Name and Address
National Aeronautics and Space AdministrationWashington, D. C. 20546
13. Type of Report and Period Covered
Technical Memorandum14. Sponsoring Agency Code
15. Supplementary Notes
16. Abstract
Effects of varying engine inlet Reynolds number index (0.75, 0.50, 0.25, and 0.12) and temper-ature (289 and 244 K) on a TFE731-2 turbofan engine were evaluated. Results were classifiedas either compression system effects or effects on overall performance. Standard performancemaps are used to present compression system performance. Overall performance parametersare presented as a function of low rotor speed corrected to engine inlet temperature.
17. Key Words (Suggested by Author(sl)
Turbofan engine; Reynolds number effects;Temperature effects; Steady-state perform-ance
18. Distribution Statement
Unclassified - unlimitedSTAR Category 07
19. Security Classif. (of this report)
Unclassified20. Security Classif. (of this page)
Unclassified21. No. of Pages
49
22. Price*
A03
' Foi sale by the National Technical Information Service,"Springfield. Virginia 22161

INLET REYNOLDS NUMBER AND TEMPERATURE EFFECTS ON
THE STEADY-STATE PERFORMANCE OF A
TFE731-2TURBOFAN ENGINE
by George A. Bobula and Roy A. Lottig
Lewis Research Center andU. S. Army Air Mobility R&D Laboratory
SUMMARY
An experimental investigation to determine the effects of engine inlet Reynolds num-ber and temperature on a moderately high bypass ratio turbofan engine, the TFE731-2,was conducted at the Lewis Research Center. Tests were conducted at a constant Machnumber of 0. 8, engine inlet Reynolds number indices of 0. 75, 0. 50, 0. 25, and 0.12,and inlet temperatures of 289 and 244 K.
Decreased engine inlet Reynolds number resulted in decreased corrected engineairflows and compression efficiencies, and increased bypass ratio, compression systemtemperature ratio, interturbine temperature ratio, turbine exit temperature ratio, andcorrected fuel flow. Decreased engine inlet temperature resulted in decreased cor-rected engine airflow, fan hub efficiency and corrected fuel flow, and increased com-pression temperature ratio, turbine exit temperature ratio, and interturbine tempera-ture ratio. Speed match was affected by Reynolds number only at the 244 K inlettemperature where a reversal in trend occurred.
INTRODUCTION
An experimental investigation was performed to determine the effects of engine inletReynolds number and temperature on the steady-state performance of a TFE731-2 tur-bofan engine. Variations of engine inlet Reynolds number and temperature which occurwith changes in aircraft flight condition affect gas turbine engine performance. Sucheffects on turbojet and turbofan engines are documented, for example, in references 1to 9. The literature concerned with these effects on turbofan engines is more limited,

however. An investigation into the engine inlet Reynolds number and temperature ef-fects on the TFE731-2 engine, which has several unique design features, can thereforecontribute to the understanding of turbofan engine performance.
The engine reported herein is a moderately high bypass ratio, two spool gas turbinewith a geared front fan. It has an axial low pressure compressor, a centrifugal highpressure compressor, and a reverse flow annular combustor.
Tests were performed at a simulated Mach number of 0.8, over a range of engineinlet Reynolds number index from 0.12 to 0. 75, and at engine inlet temperatures of289 and 244 K (520° and 440° R). Reynolds number index is defined as the ratio of thelocal Reynolds number at the flight condition to that at standard sea-level conditions.
APPARATUS AND PROCEDURE
Engine
The AiResearch Model TFE731-2 (serial number 7306 Build No. 2) turbofan enginetested in this program is a 15 600-newton (3500-lb) thrust, moderately high bypassratio, two spool gas turbine with a geared front fan. The 0. 556 gear reduction designalso results in the fan rotating counter to the low pressure compressor. The single-stage fan and four-stage axial low pressure compressor are driven by a three-stageaxial turbine. The single-stage centrifugal high pressure compressor discharges into areverse flow, annular combustor. The high spool is driven by a single-stage axial tur-bine which also drives the accessory gearbox. Fan and core flows discharge through
2 2coannular separated flow nozzles of areas 1262 and 617 cm (195. 6 and 95. 6 in. ), re-spectively. Figure l(a) is a schematic diagram depicting the airflow paths. Refer-ence 10 presents further details of the engine design.
Instrumentation
The instrumentation configuration for data reported in this text is shown in figure 1.Engine inlet temperature was measured upstream of the bellmouth at station 1. Totalengine airflow was based on the temperature measured at station 1.0 and a pressuresurvey at station 1.2. The majority of the instrumentation divided the compressionsystem into fan tip (stations 2 to 9), fan hub (2 to 22), low pressure compressor (22 to24), and high pressure compressor (24 to 3). The remaining probes were placed toevaluate overall engine performance (stations 5, 7, 8, 11, and 12).
Pressure, temperature, speeds, and other reported parameters were recorded onthe Lewis Central Automatic Digital Data Encoder (CADDE) (ref. 11).

Engine Installation
The engine installation in the altitude test chamber is shown in figure 2. The in-stallation was of a conventional direct-connect type, with the inlet bellmouth located ina plenum upstream of the engine chamber. The plenum was isolated from the test cham-ber by the front bulkhead (fig. 2(b)). Conditioned air was supplied to the inlet plenumto yield the desired engine inlet Reynolds number index and temperature. The air con-sumed by the engine was discharged through the exhaust nozzles and, with any test cellcooling air, passed into the exhaust collector (fig. 2(c)). The test chamber altitudepressure was controlled by valves downstream of the installation.
Test Procedure
During these tests, a constant ram pressure ratio PT 2/pALT of 1< 525' corre"spending to a simulated Mach number MQ of 0. 8, was maintained. (Symbols are de-fined in appendix A.) Testing was conducted at engine inlet total temperatures of 289and 244 K (520° and 440° R). At a given inlet temperature, inlet pressure was adjustedto achieve the desired engine inlet Reynolds number index while altitude pressure wasadjusted to maintain ram pressure ratio.
Operating line data were obtained at the following combinations of inlet temperatureTT 2 and Reynolds number index RNI2: TT 2 = 289 K, RNIg =0 .75 , 0.50, 0.25;TT' 2 = 244 K, RNI2 = 0. 50, 0.25, 0.12. The possibility of an effect of inlet tempera-ture was thus evaluated at RNI0 values of 0.50 and 0.25. The 244 K T™ 0 also per-
£t A y tt
mitted acquisition of limited data at 0.12 RNL, and of the higher corrected speed datafor 0. 50 and 0. 25 RNI2 without encountering turbine temperature limits.
RESULTS AND DISCUSSION
The first section of results presents the engine inlet Reynolds number index andtemperature effects on the fan, low pressure compressor, and high pressure compres-sor performance. These results are followed by the engine inlet Reynolds number indexand temperature effects on some of the engine performance parameters. All data pre-sented were referred to the highest power setting tested at the 0. 75 RNI2 condition.
Component Performance
Fan performance. - The fan tip and fan hub performance maps are presented in
figure 3. The open symbols represent the 289 K TT 2 data and the shaded symbolsrepresent the 244 K TT 2 data.
The data of figures 3(a) and (b) show that the fan tip and hub pressure ratios wereindependent of RNLj and TT 2 at a given corrected speed until RNI2 reached 0.12.At 0.12 RNL,, the fan tip pressure ratio fell 1.5 percent below the higher RNI2 data at95 percent reference fan speed.
The data of figures 3(c) and (d) show that for a given fan tip or fan hub pressureratio, corrected airflow decreased as RNL, decreased. The data indicate no signi-ficant TT 2 effect at 0. 50 RNI2; while at 0. 25 RNI2, the 244 K data was 1 to 1. 5 per-cent lower in airflow than the 289 K data. The same trend in corrected airflow occurredwith RNI2 and TT 2 at a given corrected speed (fig. 3(e)).
Fan tip and fan hub efficiencies (figs. 3(f) and (g)) generally decreased with decreas-ing RNI2. Fan hub efficiency also decreased with decreasing TT 2- The majority ofthe data indicated that near 103 percent of the reference corrected speed, all but the0.12 RNI2 fan tip efficiency data approached a value near 100 percent of the referencefan tip efficiency. The lower fan tip efficiency at 0.12 RNL, accompanied the drop inpressure ratio previously noted. The fan hub efficiency data showed a merging at highercorrected speeds, but the trend was not quite as strong in this case. Because of thegeneral drop in efficiency as RNI2 and TT 2 were lowered, it is to be expected thatmore turbine work would be necessary to maintain a given speed. This will be dis-played later in the text.
Low pressure axial flow compressor performance. - Low pressure compressorLPC performance is presented in figure 4. The data of figure 4(a), the LPC pressureratio-corrected speed relationship, showed no dependence on either RNL, or T™ <,.In figures 4(b) and (c), corrected airflow dropped as RNI2 decreased either at a givenpressure ratio or corrected speed, as previously noted in the fan. There was no effectof TT 2 on LPC airflow.
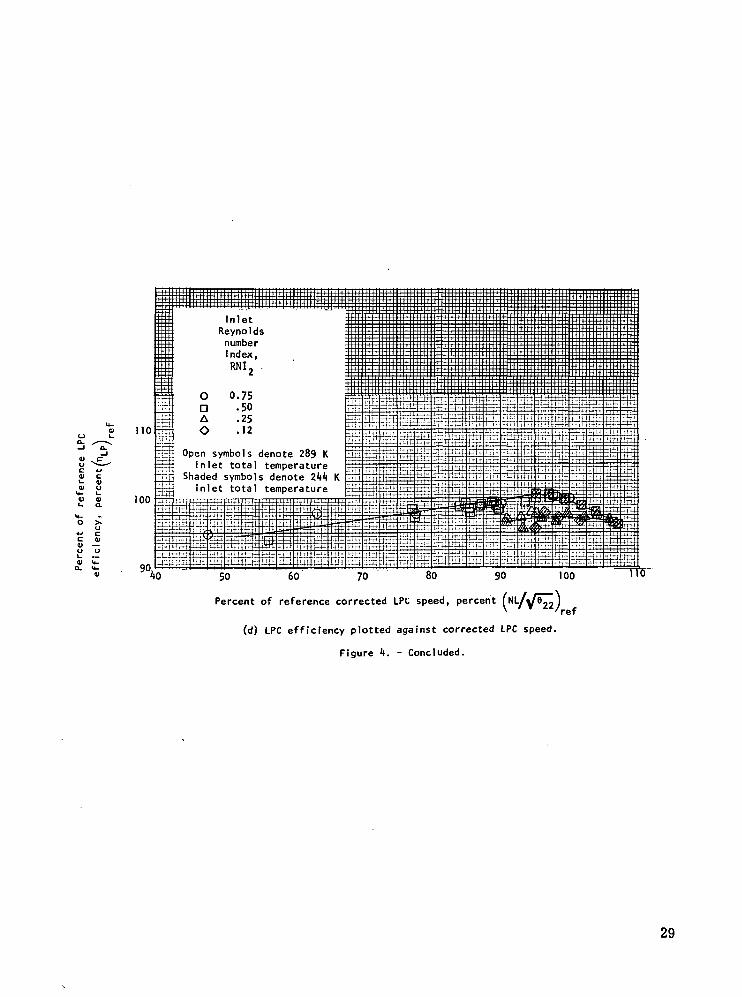
The major variation of LPC efficiency, shown in figure 4(d), occurred between0. 50 RNI2 and 0. 25 RNI2, the lower RNI2 data falling 2 to 2. 5 percent below thehigher RNL, data up to 100 percent reference corrected speed. Near 105 percentspeed, the efficiencies were equal.
High pressure centrifugal compressor performance. - The high pressure compres-sor HPC performance is presented in figure 5. Once again, the pressure ratio-corrected speed relationship (fig. 5(a)) was independent of RNL^ and TT 2- DecreasedRNL, at a given pressure ratio or corrected speed resulted in decreased correctedairflow (figs. 5(b) and (c)). No effect of TT 2 on corrected airflow was noted.
HPC efficiency plotted against corrected speed (fig. 5(d)) showed that lower RNI2
yielded lower efficiency above 97 percent reference corrected speed for the data avail-able. Instrumentation problems prevented determination of HPC efficiency at

0.12 RNIg and at 0.25 RNI2 with a TT 2 of 289 K. There was no effect of TT 2 onefficiency.
The presentation of inlet Reynolds number index and temperature effects on the in-dividual compression system components has indicated primarily a drop in both cor-rected airflow and efficiency as RNI« was reduced. Only the fan was affected by TT 2
variation, these secondary effects being a further drop in total corrected airflow and anadditional decrease in fan hub efficiency as Trp 2 decreased.
All components but the fan tip showed pressure ratio independent of RNLj. At0.12 RNL,, the fan tip pressure ratio fell below the higher RNL, data.
Effects on Engine Performance
The low rotor speed corrected to engine inlet temperature was chosen as the inde-pendent variable against which engine performance parameters would be plotted. Thischoice was made because the low rotor is related to both fan and core performance.Data comparisons will be made at a corrected low rotor speed of 95 percent of reference,unless it is noted otherwise. A tabulation is made of the comparison data in table I.
Compression system overall performance. - Figure 6 presents the overall perform-ance of the compression system. Since low rotor speed and fan speed are related by aconstant, normalized corrected fan speed is equal to normalized corrected low rotorspeed. Therefore, figure 6(a) is identical to figure 3(e). Figure 6(a) is shown to com-plete the presentation. The figures show that decreasing RNI2 from 0.75 to 0. 50 at289 K TT 2 decreased airflow by 0. 5 percent. A further decrease in RNL, to 0.25yielded a further drop in airflow of 0. 7 percent. TT 2 had essentially no effect at0. 50 RNI2, while at 0. 25 RNLj, the 244 K data was 1. 5 percent lower in airflow thanthe 289 K data. Part of this change in airflow may be due to changes in the engine matchwith TT 2 changes.
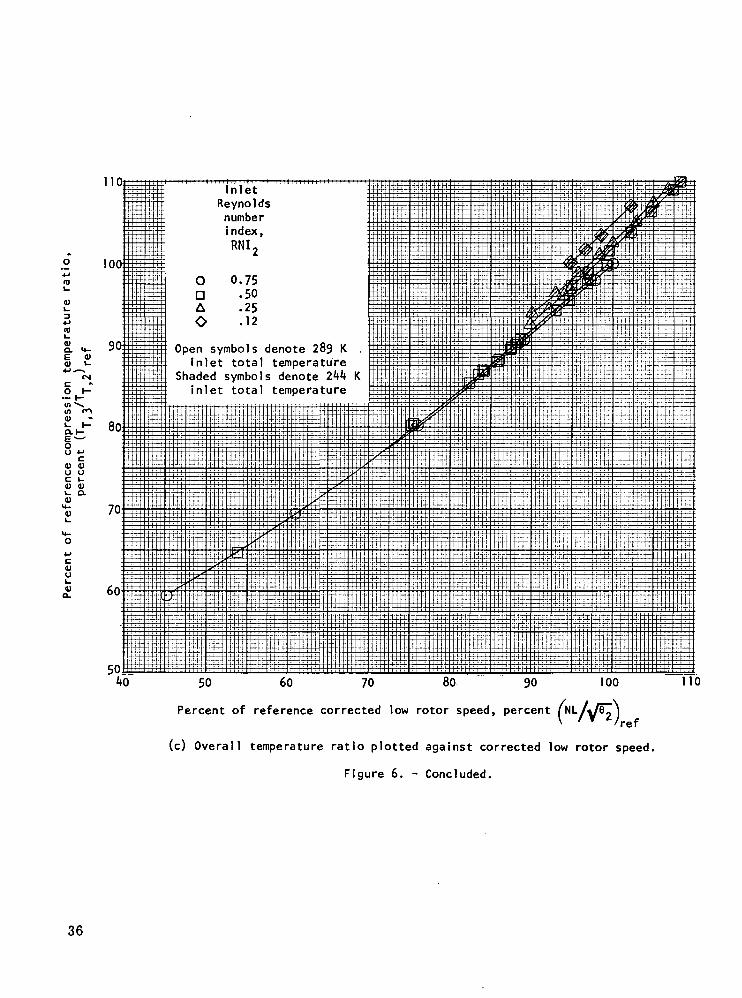
The core compression system overall pressure ratio P^ 3/P-j- 2 (fig- 6(b)) wasessentially independent of both RNI2 and TT 2 throughout the range of corrected lowrotor speed tested. However, with fan and compressor efficiencies dependent on engineinlet conditions, figure 6(c) shows the resulting effect on core compression system totaltemperature ratio. As RNI2 was decreased from 0. 75 to 0. 50, TT 3/TT 2 increased0. 5 percent. Decreasing RNI2 further to 0. 25 resulted in an additional rise in tem-perature ratio of 1.0 percent at 289 K TT 2-
At 244 K TT 2' the increase was 2-2 Per~cent between 0. 25 and 0.12 RNI2- It was also noted that the 244 K TT 2 data at 0. 50and 0. 25 RNL, were 1.2 percent and 0.9 percent higher in TT 3/TT 2 than the re-spective data at 289 K TT 2-
Energy requirements. - Figure 7 shows the effects of RNI2 and TT 2 on theenergy requirements within the engine. The lower compression efficiencies that

resulted with decreased RNI2 should require increased turbine work to operate theengine at the same corrected low rotor speed. Energy input to the engine, as reflectedin corrected fuel flow (fig. 7(a)), increased 3.2 percent as RNI2 decreased from 0.75to 0. 50 and interturbine temperature ratio (fig. 7(b)), TT 5/TT 2, increased 1. 6 per-cent, indicating an increased turbine energy level was required to maintain 95 percentcorrected low rotor speed.
Corrected fuel flow and interturbine temperature ratio also showed the effects ofinlet temperature variation. Corrected fuel flow decreased 3. 2 percent at 0. 5 RNI«and 6. 2 percent at 0. 25 RNI2 as TT 2 was decreased from 289 to 244 K. Interturbinetemperature ratio increased 1.2 percent and 3 percent for the same TT 2 changes.Aside from possible engine match changes previously mentioned, specific heat andspecific heat ratio variations with temperature through the engine are believed to be acontributing factor to these effects. The parameters used to refer speeds, fuel flows,airflows, and temperatures to standard conditions are derived from dimensional analy-sis and assume negligible specific heat effects. By basing correction parameters ondynamic similarity, specific heat variations can be accounted for (refs. 12 and 13). Ina report on this engine (ref. 14) the authors suggested modified correction parameters,both theoretically and empirically determined. These parameters, while offering abetter correlation of data at the same RNI2 but different TT 2 values, did not bringabout total agreement. With the limited inlet temperature variation of this test, newmodified correction parameters were not evaluated. It was only determined that therewas an effect of inlet temperature on some parameters.
Overall cycle performance. - Figure 8 presents the effects of engine inlet condi-tions on overall cycle pressure and temperature ratios. In figures 8(a) and (b) fan ducttotal pressure ratio PT jj/P-p 2 and engine pressure ratio PT 7/PT 2 are seen tobe independent of RNL, and TT 2. The fan duct total temperature ratio (fig. 8(c)) wasessentially independent of RNLj and TT ,,. Only the 0.12 RNL, data appeared todiffer, being at most 0. 5 percent higher than the rest of the data. The core engine totaltemperature ratio (fig. 8(d)) showed the result of operating at a constant corrected lowrotor speed, and therefore constant cycle pressure ratio, while decreasing RNLj. Thedecreasing component efficiencies and increasing heat addition, resulting in entropyincreases, yielded a higher final enthalpy state. Thus, as RNL, decreased from 0.75to 0.50, turbine exit temperature ratio TT ij/Trr, 2 rose 1.7 percent. DecreasingRNI2 further to 0.25 yielded an additional TT 7/TT 2 rise of 4.3 percent. The lowertemperature data showed similar trends.
The only parameter in figure 8 showing an effect of TT 2 was TT 7/TT 2- De-creasing TT 2 from 289 to 244 K at 0.50 RNI2 yielded negligible change; while at0.25 RNI2, the ratio increased 1.9 percent.
Core and fan stream matching. - The match between core and fan streams is eval-uated using bypass ratio (BPR) and also the speed match. Bypass ratio is the ratio of
the airflow bypassed through the fan duct to the airflow entering the engine core. The
core inlet airflow was determined from core exhaust gas flow, fuel flow, and cooling
flows. The core exhaust gas flow was based on measurements of exhaust gas condition
and nozzle model calibration test results. The model tests were performed by the en-
gine manufacturer and verified during the altitude-performance testing of reference 14.
Fan duct airflow was calculated as total engine airflow minus core inlet airflow.
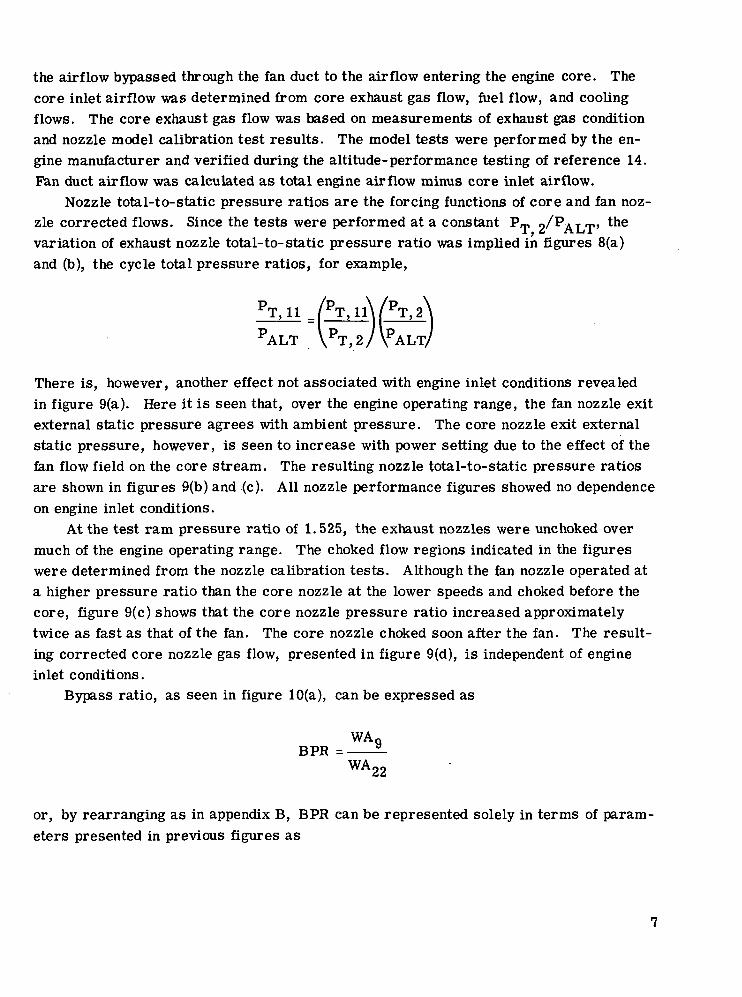
Nozzle total-to-static pressure ratios are the forcing functions of core and fan noz-
zle corrected flows. Since the tests were performed at a constant PT 2/PALT' tne
variation of exhaust nozzle total-to-static pressure ratio was implied in figures 8(a)
and (b), the cycle total pressure ratios, for example,
PALT
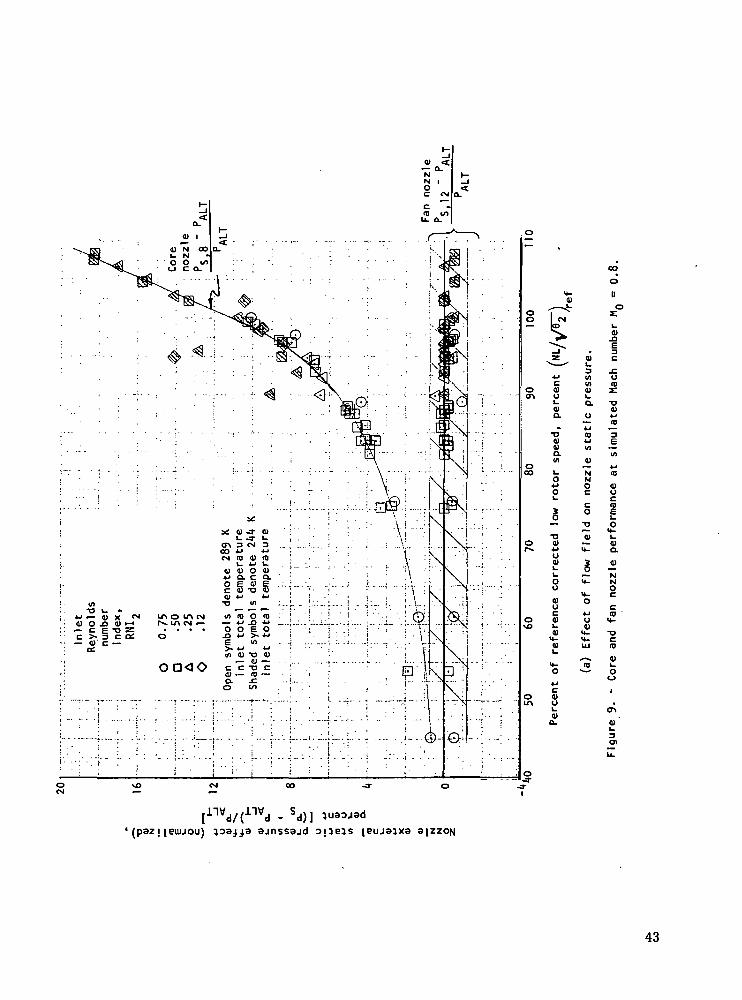
There is, however, another effect not associated with engine inlet conditions revealed
in figure 9(a). Here it is seen that, over the engine operating range, the fan nozzle exit
external static pressure agrees with ambient pressure. The core nozzle exit external
static pressure, however, is seen to increase with power setting due to the effect of the
fan flow field on the core stream. The resulting nozzle total-to-static pressure ratios
are shown in figures 9(b) and (c). All nozzle performance figures showed no dependence
on engine inlet conditions.
At the test ram pressure ratio of 1.525, the exhaust nozzles were unchoked over
much of the engine operating range. The choked flow regions indicated in the figures
were determined from the nozzle calibration tests. Although the fan nozzle operated at
a higher pressure ratio than the core nozzle at the lower speeds and choked before the
core, figure 9(c) shows that the core nozzle pressure ratio increased approximately
twice as fast as that of the fan. The core nozzle choked soon after the fan. The result-
ing corrected core nozzle gas flow, presented in figure 9(d), is independent of engine
inlet conditions.
Bypass ratio, as seen in figure 10(a), can be expressed as
WABPR =
WA22
or, by rearranging as in appendix B, BPR can be represented solely in terms of param-
eters presented in previous figures as

BPR =
K
(EPR)
- 1
Bypass ratio increased 1.3 percent as RNI2 decreased from 0.75 to 0. 50 and 2. 1 per-cent as RNI2 decreased from 0.50 to 0.25. Examination of the behavior of the variousparameters in the second representation for BPR revealed that only TT 7/TT 2
WF/( t/07 6«>) were affected in such a way by decreasing RNL, so as to yield an in-crease in BPR. Examining the relative magnitudes of the effect of these parameters onBPR showed that the BPR increase was due mainly to increased TT 7/TT 2-
The speed match of figure 10(b) shows no dependence on RNI2 at 289 K TT 2- At244 K TT 2, however, effects of RNI2 were seen. The 244 K TT 2 data at 0. 50 RNI2
was 1. 3 percent higher in corrected high rotor speed than the 289 K data. The cold0. 25 RNI2 data fell 0. 5 percent below the cold 0. 50 RNI2 data, while the 0. 12 RNI2
data was 0. 9 percent above that at 0. 50 RNL,. This reversal is believed to be genuineas data recorded at a later date repeated the trend.
It is believed that the speed match trends were due to turbine performance andmatching changes. Sufficient turbine instrumentation was not available to verify this,however.
SUMMARY OF RESULTS
An investigation was undertaken to determine the effects of engine inlet Reynoldsnumber and temperature on the fan, compressor, and overall engine performance of aTFE731-2 turbofan engine. Inlet Reynolds number indices of 0. 75, 0. 50, 0.25, and0.12 were examined at inlet temperatures of 289 and 244 K (520° and 440° R), at a rampressure ratio of 1.525. The summarized results are as follows:
1. A reduction of inlet Reynolds number index RNI2 resulted in decreased fan andcompressor corrected airflow and efficiency at a given corrected speed.
2. Fan and compressor total pressure ratios were independent of RNL, to valuesof 0.25; and at 0.12 RNI2, only fan tip pressure ratio suffered a loss.
3. Fan airflow decreased with decreasing inlet total temperature TT 2, the effectbeing more noticeable at 0. 25 RNL,.

4. Fan hub efficiency decreased with decreasing TT 2-5. The compressor operating lines were unaffected by T™ 0.1,66. The overall fan/compressor total pressure ratio, engine pressure ratio, and
fan duct total pressure ratio were essentially independent of RNL, and TT 2 at agiven corrected low rotor speed.
7. Overall core compression system temperature ratio, interturbine temperatureratio, turbine exit temperature ratio, and corrected fuel flow increased as RNI2 de-creased at a fixed corrected low rotor speed.
8. Decreased engine inlet temperature resulted in increased core compressionsystem temperature ratio, interturbine temperature ratio and turbine exit temperatureratio, and a decreased corrected fuel flow at a given corrected low rotor speed.
9. Bypass ratio increased as RNI2 decreased but was independent of TT 2-10. Speed match was independent of RNI2 at 289 K TT 2- At 244 K TT 2, de-
creasing RNL> showed an initial drop in corrected high rotor speed, followed by a re-versal and increase in high rotor speed as RNI2 continued to drop.
Lewis Research Center,National Aeronautics and Space Administration,
andU. S. Army Air Mobility R&D Laboratory,
Cleveland, Ohio, November 19, 1976,505-05.
APPENDIX A
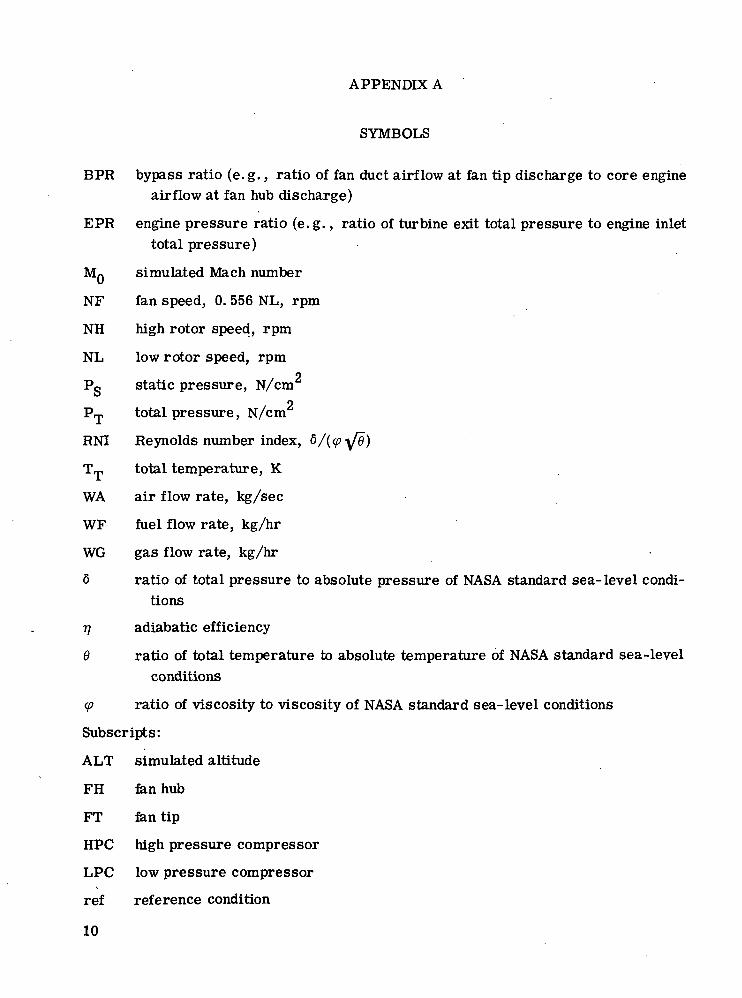
SYMBOLS
BPR bypass ratio (e.g., ratio of fan duct airflow at fan tip discharge to core engineairflow at fan hub discharge)
EPR engine pressure ratio (e.g., ratio of turbine exit total pressure to engine inlettotal pressure)
MQ simulated Mach number
NF fan speed, 0. 556 NL, rpm
NH high rotor speed, rpm
NL low rotor speed, rpmo
PS static pressure, N/cmn
PT total pressure, N/cm
RNI Reynolds number index, 6/(<p\/0)
TT total temperature, K
WA air flow rate, kg/sec
WF fuel flow rate, kg/hr
WG gas flow rate, kg/hr
6 ratio of total pressure to absolute pressure of NASA standard sea-level condi-tions
77 adiabatic efficiency
9 ratio of total temperature to absolute temperature of NASA standard sea-levelconditions
tp ratio of viscosity to viscosity of NASA standard sea-level conditions
Subscripts:
ALT simulated altitude
FH fan hub
FT fan tip
HPC high pressure compressor
LPC low pressure compressor
ref reference condition
10

2 fan inlet
3 HPC discharge
5 interurbine
7 turbine discharge
8 core nozzle discharge
9 fan tip discharge
11 fan nozzle inlet
12 fan nozzle discharge
22 fan hub exit and LPC inlet
24 LPC discharge and HPC inlet
11

APPENDIX B
BYPASS RATIO DEPENDENCY
While bypass ratio BPR was defined for this report as WAg/WA22, its calculationwas somewhat more involved. The calculations are detailed below:
WAfBPR =
WA22
WAg = WA2 - WA22
where WA2 was based on an airflow survey at station 1. 2 and WA22 was based oncore exhaust nozzle calibration information, fuel flow, and bleed flows.
The dependence of BPR on other parameters reported herein may be further de-veloped as follows:
WAQ WA9 - WA99 WA9BPR = 2- = £ ££ = £_ - 1
WA22 WA,22 WA22
1 + BPR =WA,
WA22
- K(WA7) = K(WG? - WF)
where K is an empirically determined constant accounting for bleed flows. Thus,
wA
1 + BPR =WA.
WA22K -I—± (WG7 - WF) K
12
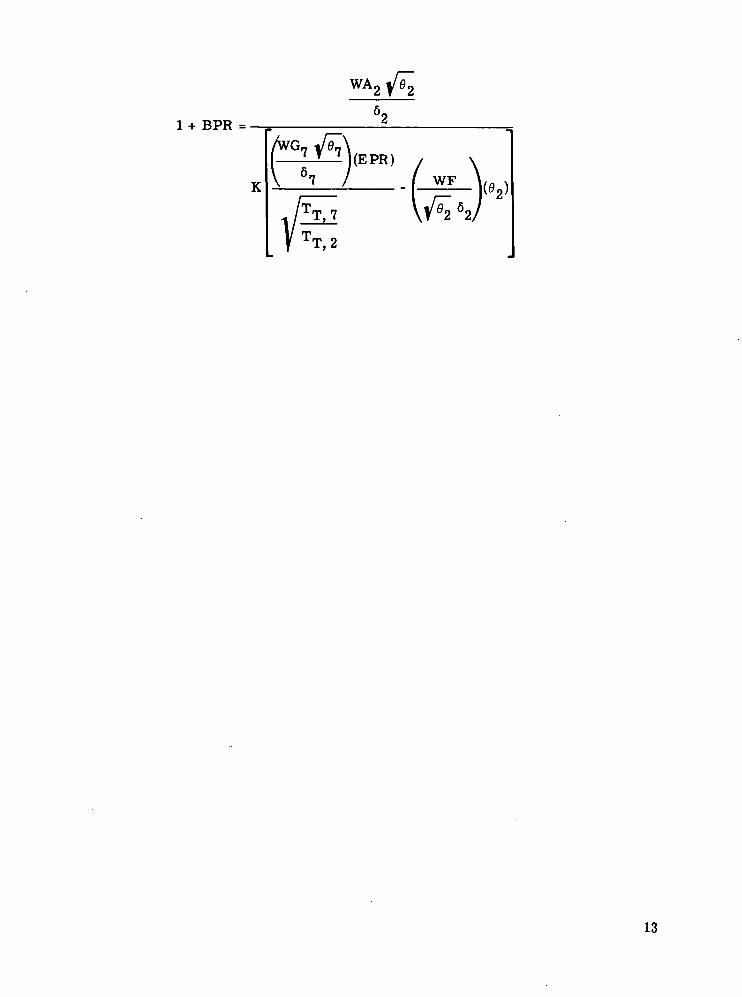
1 + BPR =
(EPR)
K WF
13

REFERENCES
1. Denser, W. A.; Finger, H. B.: Com press or-Stall Problems in Gas-Turbine TypeAircraft Engines. SAE Paper 751, Apr. 1956.
2. Campbell, Carl E.; and Sobolewski, Adam E.: Altitude-Chamber Investigation ofJ73-GE-1A Turbojet Engine Component Performance. NACA RM E53108, 1954.
3. Wallner, Lewis E.; and Fleming, William A.: Reynolds Number Effect on Axial-Flow Compressor Performance. NACARME9G11, 1949.
4. NACA Conference on Aircraft Propulsion Systems Research. NACA, 1950.
5. Sanders, Newell D.; and Behun, Michael: Generalization of Turbo jet-Engine Per-formance in Terms of Pumping Characteristics. NACA TN 1927, 1949.
6. Walker, Curtis L.; Huntley, S. C.; and Braithwaite, W. M.: Component and Over-All Performance Evaluation of an Axial-Flow Turbojet Engine Over a Range ofEngine-Inlet Reynolds Numbers. NACA RM E52B08, 1952.
7. Seashore, Ferris L.; and Corrington, Lester C.: Component Performance ofJ71-A-2 (600-D1) Turbojet Engine at Several Reynolds Number Indices. NACARME56B14, 1956.
8. Campbell, Carl E.: Performance of Basic XJ79-GE-1 Turbojet Engine and ItsComponents. NACA RM E58C12, 1958.
9. Biesiadny, Thomas J.; Grey, Rudolph E.; and Abdelwahab, Mahmood: AltitudePerformance of a Low-Noise-Technology Fan in a Turbofan Engine With andWithout a Sound Suppressing Nacelle. NASA TM X-3385, 1976.
10. Steele, M. C.; and Roberts, F. L.: Highlights of the Design and Development of aModern Geared-Fan Jet Engine. SAE Paper 720351, Mar. 1972.
11. Central Automatic Data Processing System. NACA TN 4212, 1958.
12. Glassman, Arthur J., ed.: Basic Turbine Concepts. Turbine Design and Applica-tion. NASASP-290, Vol. 1, 1972, pp. 21-68.
13. Lancaster, O. E., ed.: Jet Propulsion Engines. Vol. XII, Princeton Univ. Press,1959.
14. Dixon, G. J.; Davenport, W. R.; and Steele, M. A.: Engineering Test Report ofAltitude - Performance Test Conducted at NASA Lewis Research Center onAiresearch Model TFE 731-2 Turbofan Engine. PE-8296-R, AiResearch Mfg.Co., 1972.
14

TABLE I. - CHANGES IN ENGINE PERFORMANCE
PARAMETERS FROM VALUE AT RNIg = 0. 75
AND NL/ f/02~ = 95 PERCENT (NL/ f^)ref
[+ indicates increases; - indicates decreases.]
Parameter
WA2 \^/62
TT,3/TT,2WF/(V^ 62)
TT,5/TT,2TT, 11/TT,2TT, 7/TT, 2BPR
NH/ Y/e^
Inlet Reynolds number index, RNLj
0.50 0.25 0.12
Inlet total temperature, TT 2, K
289
-0.5
+.5
+3.2
+1.6
0
+1.7
+1.3
0
244
-0.5
+1.7
0
+2.8
0
+1.7
+1.3
+1.3
289
-1.2
+ 1.5
+6.2
+4.7
0
+6.0
+3.4
0
244
-2.7
+2.4
0
+7.7
0
+7.9
+3.4
+.8
244
-5.2
+4.6
+6.2
+ 15.7
+.5
+ 18.3
+5.5
+2.2
15

LPC-, HPC-,( ,Fan reduction gears-x Fan-, \ \ rHPT
Combustor
/^LPT ^Fan nozzle
Core nozzle
12(a) Station locations and flow/path.
O Total pressureO Static pressure+ Total temperature:
Station 1.0Bellmouth inlet
Station L 2Airflow measurement
Station 2'Fan inlet
Station 9.0Fan tip discharge
Station 22Fan hub exit and LPC inlet
Station 24LPC discharge and HPC inlet
Station 3.0HPC discharge
Station 5.0Interturbine
Station 7Turbine discharge
Station 8.0Core nozzle discharge
Station 11.0Fan nozzle inlet
Station iaoFan nozzle discharge
(b) Individual station layouts (looking upstream).
Figure 1. - Schematic of TFFJ31-2 engine and instHrmentation.CD-12065-07
16

C-71-3593
(a) Installation in altitude facility.
Cooling air torus
•Front bulkhead
(b) Front bulkhead and inlet ducting.
Figure 2. - Engine installation.
17

18

0)u4)a.
4>4)a.inc(D
4)U
4)
4)
4)
i4)
CL
•a4)4)a.VI
c<D
U0)
8VIC
<0
TJ4)
4) —4J au4) O
L. 4-1o <oU U
4)L.
L.Q.
O 4--
CO•
O
uo
4)jQ
UID
4)4-1ID
3
VI
4)U
(D
U4)a.
C(D 4)LL. L.
3x-» 01
ID —
'O|4ej d\ i
19

•o0)<uQ.en
c(0
•oa>4-1o<D
8
10O>(0
o"a.o
10
V
a.
C(D
c
ocj
0)L.3
ajnssajd qnq ue.j
20

in0)
OO
4)a.O
4-1 t)L.
C 3(D O>
ajnssajd d|5 UBJ .jo
21

0)
CV4<O
0)u
O. —
• O)
t 2.- «(0 Q.
^_ oto .a« 3o ^
u£uou
U
VL.0)
0)uu0)a.
•a3C
O
0)u3O)
sjnssajd qnq ue^
22

4)u4)Q.
•o4>4>Q.
•o0)4->u4)
uou0)u0)
0)14-4>
4)U
V4)Q.V)
cn
•o0)<->u4)
V.
in T3C 0)
ID Co» —IQ 4-1
•o o4) O4J4-> I
3 I
ID4->O
•a4)4->U4)
uOo
pajoajjoo aouaja.jaj
23

0)o
0><uQ.I/)
0)4-1o<ut.oo0)o0)
0)<4-0)
4-1
§<uQ.
0)0)o.incID
o4)
L.
8
(001(D
TJ0)
OO
o— 0)Q. L.
>- OlO —
a>a.
cID
d j j jo
24

4)O1_4)O.
T3(1)4)Q.I/I
C<0
•a4>oa>
84)uC0)
4)y-4)
a>u4)Q.
•o0)4)a.in
•Da>4-1U4)
UO T3U 0)
-o4J 3in •—c uID OO> O<D
T34>
O
"o.
u4)
'o
4)L.
qnij uej jo
25

c<U 4JI. C(U -9)
InletReynoldsnumberindex,RNI
Open symbols denote 289 Kinlet total temperature
Shaded symbols denote 2kk Kinlet total temperature
20.50 60 70 80 90
Percent of reference corrected LPC speed, percent
(a) LPC pressure ratio plotted against corrected LPC speed.
Figure 4.-Low pressure compressor (LPC) performance at simulated Mach number MQ = 0.8.
26

120
<u «*•U 0)Q. 1.
O 4->I- C0) 0)u- o<U I-i- <U
Q.
InletReynoldsnumberindex,RNI2
O 0.75D .50A .25O .12
Open symbols denote 289 Kinlet total temperature
Shaded symbols denote 2M Kinlet total temperature
30 'lO 50 60 70 80
Percent of reference corrected LPC airflow,, percent
(b) Operating lines.
Figure 4. - Continued.
110
ref
27

InletReynoldsnumberindex,RNI
O 0.75Q .50A .25O -12
speed, percent
60 70
Percent of reference corrected LPC
(c) Corrected airflow plotted against corrected LPC speed.
Figure I*. - Continued.
28
>•uCHI
InletReynoldsnumber!ndex,RNI
Open symbols denote 289 Kinlet total temperature
Shaded symbols denote 2kb Kinlet total temperature
50 60 70 80 90 100
Percent of reference corrected LPC speed, percent (NL/i/6,9 IV ' V ZZ'ref
(d) LPC efficiency plotted against corrected LPC speed.
Figure A. - Concluded.
29

110
tou
<ut-3I/I</)0>i-
0)
-3-— CNTO
oQ-
0)O 4->c c<U 0>I- U0) 1-
M- 0)0) Q.
C(Uuu0)a.
100
90
80
70
-—• '
; • • | • ;
• : i . • . .
::::
. . . .
.......
^
^\f:
... j ....
:::(::::::.]•::.:-|;;;:
• •/•/:-.:
"!~~
... i
•
1i
....
—£
mF
•—:-:
:!::
....
. ; i
WTW~M '
OFsi-
\\. : :
InletReynoldnumberindex,RNI2
0 0.75a .50A .25O .12
)en symbols <inlet totalladed symbol;inlet total
Hip -p
i - - .
S
Jenote 289 Ktemperature
> denote 2kktemperature
:;:;h*
-
K :
:1:u.6080 90 100 110Percent of reference corrected HPC speed,
percent (NH/ 2»t )^ ref
(a) HPC pressure ratio plotted against corrected HPC speed.
Figure 5- ~ High pressure compressor performance at simu-lated Mach number M, 0.8.
30

1 10
pre
ssu
re
rati
o
're
f
0 o
- i; 90*J .0 h-*j a.o rr\a.1 i-
a.0)
c <-, 80<u c0) U
0) 0)«- Q.
O
c 70U
<oa.
60
-I ', '. ;.
rfrrr* :••-
-:- "r
TTTT
— -
4-U.-.-
fe£. j^.!-:•'*-
trj±
SEE
±i±rj — :.i.
B-t,.
......
: i : :
._....
" i~'iT'
- - - t "
•*T
;...: _
r' '-
iEE:;.:-__..
j .;-.-.
~—
..
lJ.i.1-
:tt:.
j-hr:
-U4.
3i
- • •
• ;.,-,
....,-,
il""!"
.1. _u
- --r r-
IS:
— — *-4
.-1.J-J-
, i- 1
•-H-r;;- tr
n::.:-;... ;,_
•:ir.
.... ._
r : • •
nt*'' -*•
— T— J-
rUr
.;-. . .
M-;-l-J
;/
V-'lLfrp:
"p'fr
'irtrr!_L; i.
4Tr*,:
~
1:_:±
i. ...... -
" r~*"
wT;-?.}., .-,..,.
— ^f —
--Vt-*-
^•M--•—
irTj.::.
... —
. Mll-
.,.__
z;'i7..__^:;;r;r
''-CTa
_ 11_
*~J.-
^r~
•::::-.
—
T
N— —
— .._-' — '
oaA0
Openinl
Sh adeinl
"r • • • -
— r-j"-
t -H-
....,-..•:~r-
— -!-
....
--— ;•
-. .
~t —
j
-i-rr
-~-
^zizrx
~nzz
—i — t-
Inlet :Reynolds •
numberindex,RNI2
0.75.50.25.12
symbols denote 289 Ket total temperatured symbols denote 2kk K jet total temperature j
80 90 100 110
Percent of reference corrected HPC
airflow, percent /WA^, 077/6.
(b) Operating line
Figure 5- " Continued.
ref
31

CJ M-O- <D31 U
0)
CM
C —^
U 4-1d) c
M- 0)
<uM_ Q.O
•t
S g
8cL. I-Q) —
;u..|li:|;UUiU-U4-U^U4.jJli
InletReynolds
numberindex,RNI 2
O 0.75D -50A .25
Open symbols denote 289 Kinlet total temperature ;
Shaded symbols denote 2kk K:inlet total temperature
- — -.-----80 90 100 110
, Percent of reference corrected HPC
refspeed, percent
(c) Corrected airflow plotted against corrected HPC speed.
Figure 5- ~ Continued. £*
32

uc0)
<u0)
Q. vx: a.<u (=o -~^c£ c0) »-U <U
Q.
C0)u1_(UQ.
110
100
90
80
::#, . .
:::...
—
• : : : :
I l l l l l l l l l l l l l l l l l l l l l l l l l l l lHl l i l l l l l l l l l l
InletReynolds
numberindex,RNI2
0 0.75D -50A .25O .12
Open symbols denote 289 Kinlet total temperature
Shaded symbols denote 244inlet total temperature
~~
/•:_^--:::(£):::
li
• • • /
fi'-'-'A
/•'••
• •
—: : : * 5
/:.:
2^:
mfegPu&
— —
M:
m
K !-:..:.-J. 1
' . ' . : ' :
".'.'..
. .u . . .
-i-H-
80 90 100 110
Percent of reference corrected HPC
speed, percent (NH/ ")
(d) HPC efficiency plotted againstcorrected HPC speed.
Figure 5- ~ Concluded.
33

00
o
4)J3
3C
-a<uID*3
a)U
i.4)Q.
U4)
O
4)4->in>»in
O
inin4)
4)
O)
[e}ca
34

140
o4->
as
V)V)
Q. 1.
c '"CM
in a.
in —a) ff\i_ «Q. I-E a-O ^-'o
4J0) Co vc o(U uI- 01<o a.14-0)
o1.a>a.
120
100
80
60
40
20
II ' ! • '
-:::
•.:::
.1.
if
:::,
i ,ii . — ..i — i .. i. — TI ri
Inlet !
;oF
iSh
....
i . . .4 ...
3rfr
. : . .
ODAO
eninladeinl::::
r*T^ -
R«r
synetd set
*
synclumtndeRN1
0.1_ c
<
'.•
iboltot
>ymttot
.
>1d<>ersx,
2
'51052
s cal
>o1<al
r" :-: l:
J
encter
; d<ter
Jtenpet;notnpei
u
285•ati:e :•ati
^
) Kire>Mjre
••?*
... ..
i
K
• • ~ -
"HI ' '
....
I'-ll '.
.....
::L:
Pjp-
!-4d
' • • •
•l-r
v*
TTtT
wj
Hi
-
feLp....
" \ ~
fc
LTTT
i!::
--
....j....
i...
.:...
-~-
;~r
-Hi
....
.....
,r!;
.,_,.
"-r.L r.
:.T~
Hi
•"-JTrHRr
4
— -
•=r.
rtrr
ir
•znr
Ti«
litr
fcrtt
itri
TT™
mi
r:.:i
d
irt
tEH
40 50 60 70 80 90 100
Percent of reference corrected low rotor speed, percent
(b) Overall pressure ratio plotted against corrected low rotor speed.
Figure 6. - Continued.
110
ref
35
<o1-
roi_<uo. t-£ <0«) 1-*•>.—•.
CM
i- I—Q.I-
O 4Jc
a) a)o oc u0) Vi- a.
<uu0)a.
InletReynolds
numberindex,
RNI
Open symbols denote 289 Kinlet total temperature
Shaded symbols denote 2kk Kinlet total temperature
5050 60 70 80 90
Percent of reference corrected low rotor speed, percent
(c) Overall temperature ratio plotted against corrected low rotor speed.
Figure 6. - Concluded.
36

140
r>4«o
LO"
coo1.
34-
I.8<uuca)i.<a
cVuI.01o.
120
100
80
60
40
20
InletReynoldsnumberindex,RNI
O 0.75D .50A .25O .12
Open symbols denote 289 Kinlet total temperature
Shaded symbols denote 244 Kinlet total temperature
40 50 60 70 80 90 100
Percent of reference corrected low rotor speed, percent
(a) Corrected fuel flow plotted against corrected low rotor speed.
Figure 7- ~ Energy requirements at simulated Mach number M. = 0.8.
110
37

1 iU .
i in
0 1 f\A ; . ; ; •
4-t ; ; ; ;
L. ::.:
3 : : : : :
TO : : : .
E •*- '.".':Q) QJ• M I - : . : : .
c - ': : :.— t— • • • •JQ h— — i —i. ' : ' .3 LTV
« ,_- 80 — r-4-) •»--' — — --
<U <l) : .'o o .: :.<o Q> : : : :»-o. . ; • • - _« 70 -—«> :::: .
14-
4JC —v r." ~:^ 60 == =
Q- : : : ; : :
50 =r-
i : inlet ;;;; ::; : ; : ; ; ; ; ; : . : ; . : ; : ; ;:;:: Reynolds :::: :::: :::: .:.: :::: .::: :
number • ' •:'. index
O O 7C : ' : : .:.
.; a .50 ; ; ; ; : :; : . . :" : ; • . . . '•.-. : :
A .257? 0 -12
;; Open symbols denote 289 K ; :;; ; ; ; ; ;;:; ; ; ; : • ; ; ; ; ; : ; ;•;
: Shaded symbols denote 2M K : ' • ' • ' • ' ' • • ' • ' - ' • ' • ' • ' • ' • ' ' • ' ' • ' • ' ' • ' ' • ' ' • ' • ' • ' • ' • ' ' • ' ' • ' • ' • ' •: inlet total temperature i ;:;; ;;;; ;;;; :;:; ;;;; ;;:; ;:;
~r -.—: TT: : : : : : : • : : : .
- —-4-~-~ -: : ::
> • •
:: :::: :::: ::^':\ l i ::
linn
• - • ' ; - f K l' ; * | I Hj*
::L:|::-:|::::|::;:|::::|::::|::::L
'.: :::: :::: : : T: :::: :::: ::;: liy • yS. :::. : : • • : ' : ' .
: ': i;:: ' : • - ' • :- '- '^' ^i: '.':: i'^Jkfy \ \ \ \ i i i i I ' . ' l ':':':
^msSlM±
iWlj iiiift- : : : : : : : T T T T : : : i:i: :::::::: i:;-. : : : ; ; • : : : : : : : : :
: : : : : : ! : ::i;:;:ft;J?^^P;iii; ; ; ; ; : i ! i :^^i::;^§°^T
:::. .: iiS¥ -: : : :<:a : ' A:: ::::
- -yQs / fZ
: : : : :::: : &: •:•:•• /•: ^ :;;: : : • •
::;: . : :..i;;:;^||ffl:;;;::::: • : ; • • : : ; j/'iaiifii : • : : : • : • ::: :
. ; . . : :^^T^^;;:; ;:;; ;:::
: "; -^ sjP :^ ; :::i :::: ::::
:::: ^Py17::;: ;. : :i ;;:: ;;;;: |S :;:; !::i. ::;: ini • : : :^ : V^:::: ; : ; ; : : : : ;:;; i:: : ;:!:i-£/^ Hi; :i:: !;:: : : : : iii; iii; :::;
- -.-:'- TT- ~- — - — - -rr rrrr rrr- r^r
; • • ' •• • • • • ' t::-
46 50 60 70 80 90
Percent of reference corrected low rotor speed, percent
100 110
(b) Inter-turbine temperature ratio plotted against corrected low rotor speed.
Figure 7. ~ Concluded.
38

o4J<Dl-
<Ul_3in
<O
O I-D Q-•o --.
C —ra
oC 4-"«) ci. o4) o««- 1-<u <u1_ Q.
c0)oL.(1)Q_
InletReynoldsnumberindex,RNI
O 0.75D -50A .25O .12
Open symbols denote 289 Kinlet total temperature
Shaded symbols denote 2kk Kinlet total temperature
50 60 70 80 90
Percent of reference corrected low rotor speed, percent
(a) Fan Duct pressure ratio plotted against corrected low rotor speed.
Figure 8. - Overall cycle performance at simulated Mach number MQ = 0.8.
39

130
o
rai_
o>i.3in «-t/i o)0) v.
110
o> .C 0.
— --^O> I—.C4) t-
Q-<U^0C 4-10) Cl. <u01 O<t- l_01 <U1- Q.
C0)oL.0)Q.
N. 90
70
50
30
InletReynoldsnumberindex,RNI2
O 0.75D -50A .25O .12
Open symbols denote 289 Kinlet total temperature
Shaded symbols denote 2M Kinlet total temperature
I
50 60 70 80 90 100 110
refPercent of reference corrected low rotor speed, percent ( NL/W6. \
(b) Engine pressure ratio plotted against corrected low rotor speed.
Figure 8. - Continued.
40

em
pe
ratu
re
rati
o,
ref
o
CM
0 1-3 1-
C .—(0t- 1-t-0)-—UC 4Ja) c.L. 1)0) O«4- t- Q/\(1)<1) "O1
\- a.»4-04->
C<uU
0) Q/y
T
-
,-
~
-
-
~=
^ - -
"
:-~
— <
40
DAO
Open sinle
Shadedinle
'J ~
50
InletReynoldsnumberindex,RNI2
0.75.50.25.12
ymbols denote 289 Kt total temperaturesymbols denote 2kk
t total temperature
— &— i — •" — — •—
|
0"_ ,
K
_-— •~-
\\
-
-
-
&~-~ ~- .
TRjm
-
= ]0f
\Ss
ygi
^
1
|
1
1
1
(
'
60 70 80 90 100 "
Percent of reference corrected low rotor speed, percent [NL/./6, )V I* */ref
(c) Fan duct temperature ratio plotted against corrected low rotor speed.
Figure 8. - Continued.
41

o+JID
<UCL
0)
4-1 <*-._ VX l-<U^-x
CM(Uc h-
34J I-
UC *-»O C
Cmuu<U
Q-
InletReynolds
numberindex,RNI
Open symbols denote 289 Kinlet total temperature
Shaded symbols denote 2M Kjinlet total temperature
50 60 70 80 90
Percent of reference corrected low rotor speed, percent
(d) Turbine exit temperature ratio plotted against corrected low rotor speed.
Figure 8. - Concluded.
42
CO
O
D
O
L.0)J3
3C
T)0)
Ein
4)Q.
NNO
C(D
[invd/(i1vd -' (paz j (euijou) ajnssajd OIJBJS [eujaixa
43

O
4->n>i_<Ut_VIin<t)i_Q.
14-V 0)
N COOc ino.
o) -~«i- t-~
8 HQ.
0) ^OC *J01 Cl- <U0) Ou- u0) 0)1- O-
c<uOl_
0)Q.
I/U
no
100
90
80
70
60
50
40k
-
—
-
e
_
"
c1
II
0
-Ml1
u(
~ff
h 4
-
—
,11
)ore nozzle:hokedtystipzstiy ft/at.
i
&i"
4
YffCore nozzle
"V-
Line.
_
--
-
loki
—
—
:d
r"S-S
50
r
.--'
'
.-•*-
t
!H
~ >i
.1
"
W
- 1
' 1
t-
~
^
1
60
, ••i
;0p
Ch
/
- -
,1 IH.HH
InletReynolds
numberIndex,RNI2
0 0.75D -50A .250 .12
en symbols cinlet totaladed symbolsinlet total
/
>/
{X
70
r
"
i
enotemde
tenLT
/
r til Jjr
te 289 Kperaturenote 2kkperature
//
»i**Q
i
JB
t-
i
y
,,<f
_
^j'Tl-
t-4--
_p
-
1
(4.
-,
Z
/y>
v
I*itit
^%-h
J
H-
1
-"-f-
rif-H-H
f7!r _j
f
1
i
,JB
tt^ J.
T-1' .]+-t , *
1-1-
Jji!5H-5fe^a1
lh
}14/«fr•flB
?-ir^K itjl
»
/
fa
80 90
-
—
_
i
i
- ^
—•
"~
-„
^
T^i^4 +
•*— t <
•rl1
t±ftr
•^-
^
~~
100
I'a JJ ' ijj
f-tithi-4-im1 i ' i tfSi! •:JM?tJ4£
il-^r _
i J-
-
i
_ T
U.1,4
— t
-
*
-
: :
-~ ~_
_r
-
:
"
-
-
-
—
—
fG
4sJ- r• J-(~
^T_^
— -r"
-~
-
- -
.tl
—
-
— ;
~^- j.
-i.
-~^
^— Xj.
*I
—
~
11
Percent of reference corrected low rotor speed, percent (NL/./62 j
(b) Core nozzle pressure ratio plotted against corrected low rotor speed.
Figure 9. - Continued.
44

120
no
win<Di~a.0)
TiNo
C —CO —
<O O-U >
<u *->i- cv <a4- o0) V.L. <U
o.
cooI.(Ua.
•S 'oo
90
80
70
60
:-.-.:: :--± ::::::::-.: :g I:::::::::::::::::::: |;;|;;;;;;::;;; inlet ; ; ; : : ; : ; : ; ;
::::::::::::::: RNI2 :::::::::::
;:;;;:;;;;;:;;; o 0.75 ;;;;; ; ; ; ; : : ;::::::::::::::: D -50 ! : : : ; ; : : : : : :zle:;;;;;|; A .25 > ; ; ; : ; ; ; ; : ;
timm o .12 1 1 il II
zle..... ..-Open symbols denote 289 K :::::::::::::: inlet total temperature :::::::: :
' } ' • - | | j - • •
. . ^ .....i j i i l i . . . j
:: Core :;!":
::i!:ji i::::::::
! ; j ! Fan;;;;;;
50 60 70 80 90
Percent of reference corrected low rotor speed, percent
100 110
ref
(c) Fan nozzle pressure ratio plotted against corrected low rotor speed.
Figure 9. - Continued.
45

InletReynoldsnumberindex,RNI
Open symbols denote 289 Kinlet total temperature
Shaded symbols denote-244 Kinlet total temperature
1*040 50 60 70 80 90 100
Percent of reference corrected low rotor speed, percent (N
(d) Core nozzle corrected gas flow plotted against corrected low rotor speed.
Figure 9. - Concluded.
110
ref
46

Q.OD
pe
rce
n
IDO.>-
JO
a)oc<ui_<uu-<u
Vf.
o4Jc<0o
au
200
180
160
140
120
1 nn
fin
•• i: (i .
. ; i . - . : •
: • i:
' : • i
--— -T
—
-——r
M .:;•Kl
:: |.:\. ! . . '
:.:: ;..
: - J : - .i
: • : ! : • = '
""t
: . : 1 : : . :
::'.: ""'
:-: : i
: : : ' ] : . : :
;•:;!;";. . . . .
t :.
40
j
"i"•^••:
\j a
: . >
. . i
: ; - - • : . :.... . . .
-7
; •
: ; ! :
:;:;|.Y. . . . ( .
- - |. . - - ] : : :
r '
\
\ ' : \ .
Kv\
. . . .
• - X:' 1 ' : ' :
'...'.
':'•": ! : : :i - • •
:;:;|: i; i- : • : ! . : • :
. : . • :!::
: : : • ( ' : .
: : : : : : i;• . : : ! • • : ;
:::|
: : : !
; j . .
: : : | :-:;
~T
'•'.:'
'''--
. 1
\i: \ . : . '&'];::>K\: " i ^^
• : ' . " - : : :
. ' ! '
; . • : :V
; i : ' j : i : ;
: ' : ' . ' • : ' • ' :
: • : : ' [ • • • .. . . . } . .
; : - -
;::!l:"i
j
. ':.^.
: : - i : • . :' . • : : :.
•I
-i
vs
.::"
--.;;~T~
1 •
' " :! :
" !! :
' t - •
•:" 1 .
i . :
"^-^v ' i: '-:j_ 'KxJ^
: : . •1
50 60
S^\\i \,
f-
—
0
• • • : s:
InletReynolds
numberindex,RNI2
0 0.75a .soA .25O .12
Ben symbols denote 289 Kinlet total temperature
Taded symbols denote 244inlet total temperature
: ,' i .. - : :
• ;•
::: i:
'.' . . .'. :
'• ' :::
: - : . j .
- 1 -
... i .
70
. / ::^
i ' ' ; .
'.:.' ..".
\ •"%B
• j. -
• ; ; ' . : '..
. -.! '
• i " - .
• ' : : -
• • T"r*2): . - : i ! i : :
• ( • •
^U :/fL
';
i .
,
• ' ' i
: . - j
& : • • ! . . : •
::: :'
: : • I / : -"1: .:
S l
^^• i
'i
r^
80 90 100
.....
-
'
-
Kl_
• : ; . | ' . : .• • / K:;;: :;;
i -
:.: i l :
:-:i.-
1
Percent of reference corrected low rotor speed, percent ( NL/«/6T)V '» 2/ref
(a) Bypass ratio plotted against corrected low rotor speed.
Figure 10. - Flow split at simulated Mach number MQ = 0.8.
47

•O<D<UQ.
O4JO
<u cO 0>c .u0) l-C. <a0) Q.
c<uO1_<u
Q.
InletReynolds
numberi ndex,RNI
Open symbols denote 289inlet total temperature
Shaded symbols denote 2M Kinlet total temperature
40 50 60 70 80 90 100 110
Percent of reference corrected low rotor speed, percent (NL/«/6r-)V /V Z/ref
(b) Speed match; corrected high rotor speed plotted against corrected low rotor speed.
Figure 10. - Concluded.
48 NASA-Langley, 1977 E-8941

NATIONAL AERONAUTICS AND SPACE ADMINISTRATION
WASHINGTON. D.C. 2O546
OFFICIAL BUSINESS
PENALTY FOR PRIVATE USE $3OO SPECIAL FOURTH-CLASS RATEBOOK
POSTAGE AND FEES PAIDNATIONAL AERONAUTICS AND
SPACE ADMINISTRATION4S1
POSTMASTER : If Undeliverable (Section 158Postal Manual) Do Not Return
"The aeronautical and space activities of the United States shall beconducted so as to contribute . . . to the expansion of human knowl-edge of phenomena in the atmosphere and space. The Administrationshall provide for the widest practicable and appropriate disseminationof information concerning its activities and the results thereof."
—NATIONAL AERONAUTICS AND SPACE ACT OF 1958
NASA SCIENTIFIC AND TECHNICAL PUBLICATIONSTECHNICAL REPORTS: Scientific andtechnical information considered important,complete, and a lasting contribution to existingknowledge.
TECHNICAL NOTES: Information less broadin scope but nevertheless of importance as acontribution to existing knowledge.
TECHNICAL MEMORANDUMS:Information receiving limited distributionbecause of preliminary data, security classifica-tion, or other reasons. Also includes conferenceproceedings with either limited or unlimiteddistribution.
CONTRACTOR REPORTS: Scientific andtechnical information generated under a NASAcontract or grant and considered an importantcontribution to existing knowledge.
TECHNICAL TRANSLATIONS: Informationpublished in a foreign language consideredto merit NASA distribution in English.
SPECIAL PUBLICATIONS: Informationderived from or of value to NASA activities.Publications include final reports of majorprojects, monographs, data compilations,handbooks, sourcebooks, and specialbibliographies.
TECHNOLOGY UTILIZATIONPUBLICATIONS: Information on technologyused by NASA that may be of particularinterest in commercial and other non-aerospaceapplications. Publications include Tech Briefs,Technology Utilization Reports andTechnology Surveys.
Details on the availability of these publications may be obtained from:
SCIENTIFIC AND TECHNICAL INFORMATION OFFICE
N A T I O N A L A E R O N A U T I C S A N D S P A C E A D M I N I S T R A T I O N
Washington, D.C. 20546