co to co - the royal society of chemistry
TRANSCRIPT
-S1-
ELECTRONIC SUPPLEMENTARY INFORMATION
Nickel(II) macrocycles: highly efficient electrocatalysts for the selective reduction of CO2 to CO
Jacob Schneider,*a Hongfei Jia,b Kazuya Kobiro,c Diane E. Cabelli,a James T. Muckerman,a and Etsuko Fujita*a
a Chemistry Department, Brookhaven National Laboratory, Upton, NY 11973-5000, USA. b Materials Research Department, Toyota Research Institute of North America, Toyota Motor Engineering & Manufacturing North America, Inc., 1555 Woodridge, Ann Arbor, MI 48105, USA. c School of Environmental Science and Engineering, Kochi University of Technology, Tosayamada, Kami-city, Kochi 782-8502, Japan.
E-mail: [email protected], [email protected]
I. Supplementary Information for CV and LSV experiments
II. Supplementary Information for bulk electrolysis experiments
III. Supplementary Information for pulse radiolysis experiments
IV. Supplementary Information for calculations, calibrations, etc.
Electronic Supplementary Material (ESI) for Energy & Environmental ScienceThis journal is © The Royal Society of Chemistry 2012

-S2-
I. SUPPLEMENTARY INFORMATION FOR CV AND LSV EXPERIMENTS
0.0 -0.5 -1.0 -1.5
0
2
4
6
8
10
0.0 -0.5 -1.0 -1.5
0
2
4
6
8
10
[Ni(cyclam)]2+ under Ar
[Ni(cyclam)]2+ under CO2
Background under Ar Background under CO
2
j / m
A c
m-2
Potential vs NHE / V
[Ni(MCC)]2+ under Ar
[Ni(MCC)]2+ under CO2
0.0 -0.5 -1.0 -1.5
0
2
4
6
8
100.0 -0.5 -1.0 -1.5
0
2
4
6
8
10
Potential vs NHE / V
[Ni(TM)]2+ under Ar
[Ni(TM)]2+ under CO2
j / m
A c
m-2
[Ni(HTIM)]2+ under Ar
[Ni(HTIM)]2+ under CO2
Figure S1. CVs of 1.6 mM solutions of [Ni(L)]2+ in 0.1 M NaClO4, pH 5, purged with Ar (solid lines) and CO2 (dashed lines), scanning at 100 mV s-1, SMDE working electrode (area = 0.0104 cm2). Background scans are shown in the panel with [Ni(cyclam)]2+ (top left). Arrows indicate the direction of the applied potential.
Electronic Supplementary Material (ESI) for Energy & Environmental ScienceThis journal is © The Royal Society of Chemistry 2012

-S3-
-0.6 -0.8 -1.0 -1.2 -1.4
0
3
6
9
12
j / m
A c
m2
Potential / V vs NHE
Ar 0.1% CO
2
3% CO2
9.9% CO2
30.3% CO2
100% CO2
Ar blank
0.00 0.05 0.10 0.15 0.200
2
4
6
8
10
j at
-1.1
3 V
/ m
A c
m-2
[CO2]1/2 / M1/2
R2 = 0.99769
Figure S2. CVs of [Ni(MTC)]2+ under different concentrations of CO2 (left panel); 0.1% (0.036 mM), 3% (1.08 mM), 9.9% (3.56 mM), 30.3% (10.9 mM), and 100% CO2 (36 mM). The right panel shows the linear correlation between the current densities at –1.13 V versus the square root of the concentration of CO2. Conditions: ca. 1 mM [Ni] in 0.1 M NaClO4, pH 4-5; SMDE working (area = 0.0104 cm2), Pt wire auxiliary, and Ag/AgCl (satd KCl) reference electrodes; 100 mV s-1 scan rate. Nitrogen is the gas balance for CO2 at different concentrations.
Electronic Supplementary Material (ESI) for Energy & Environmental ScienceThis journal is © The Royal Society of Chemistry 2012

-S4-
-1.5 -1.0 -0.5 0.0 0.5-0.7
-0.6
-0.5
-0.4
-0.3-1.5 -1.0 -0.5 0.0 0.5
-0.7
-0.6
-0.5
-0.4
-0.3
-1.5 -1.0 -0.5 0.0 0.5-0.7
-0.6
-0.5
-0.4
-0.3
η / V
slope = - 89
- 0.55 V
- 0.41 V
η / V slope = - 89
- 0.55 V
- 0.41 V
η / V
log j / mA cm-2
slope = - 122
- 0.55 V
- 0.41 V
Figure S3. Plots of the overpotential (η) for CO2 reduction at pH 5 versus the log of the current density (j) for [Ni(MTC)]2+ (top), [Ni(MCC)]2+ (middle) and [Ni(TM)]2+ (bottom). LSVs run in CO2 saturated solutions containing 1 mM [Ni(L)]2+ in 0.1 M NaClO4, 2 mV s-1 scan rate, SMDE working electrode (area = 0.0104 cm2). Here, η is calculated from the thermodynamic potential for CO2 reduction to CO at pH 5 (–0.41 V vs NHE). The horizontal dotted lines correspond to potentials used in bulk electrolysis experiments (see Bulk electrolysis section in manuscript). The vertical dashed lines correspond to the pre-wave due to [Ni(L)]+ adsorption and geometric rearrangement.
Table S1. Selected data from the LSV slow scan analysisa.
L
mA cm-2 at
η = –0.41 V
mA cm-2 at
η = –0.55 V
cyclam 0.014 0.766
HTIM 0.009 0.971
MTC 0.014 0.764
MCC 0.014 0.639
TM 0.007 0.125 a The thermodynamic overpotential (η) for the reduction of CO2 to CO is taken to be –0.41 V vs NHE at pH 5.
Electronic Supplementary Material (ESI) for Energy & Environmental ScienceThis journal is © The Royal Society of Chemistry 2012

-S5-
II. SUPPLEMENTARY INFORMATION FOR BULK ELECTROLYSIS EXPERIMENTS
0.00 0.25 0.50 0.75 1.00
0
5
10
15
20
25
- 0.96 V vs NHEpH 5
q /
C
Time / h
blank cyclam HTIM MTC MCC TM
L q / C F.E. (%) CO:H2
cyclam 3.6 ± 0.1 84 ± 4 Trace H2
HTIM 22 ± 3 88 ± 7 No H2
MTC 15 ± 0 88 ± 7 No H2
MCC 3.3 ± 0.1 92 ± 2 No H2
TM 0.87 ± 0.22 42 ± 4 Trace H2
blank 1.4 ± 0.3 64 ± 12 0.4 ± 0.3
Figure S4. Bulk electrolysis at –0.96 V vs NHE (η = –0.55 V) for 50 μM [Ni(L)]2+ in 0.1 M NaClO4, pH 5; CO:H2 is the ratio (mol CO / mol H2), as quantified by GC analysis after 1 h electrolysis.
Electronic Supplementary Material (ESI) for Energy & Environmental ScienceThis journal is © The Royal Society of Chemistry 2012

-S6-
0 1 2 3 4 50
5
10
15
Cycle 474% F.E.
Cycle 383% F.E.
Cycle 282% F.E.
Cycle 186% F.E.
Cycle 579% F.E.
[Ni(MTC)]2+ at - 0.96 V vs NHE
q /
C
Time / h
Figure S5. Bulk electrolysis of 50 µM [Ni(MTC)]2+ in 0.1 M NaClO4, pH 5, at –0.96 V vs NHE cycled five times with the same solution; 1 h each cycle. After Cycle 4, the mercury pool electrode was cleaned and the [Ni(MTC)]2+ solution kept overnight in a vial before use in Cycle 5.
0 3 6 9 120
20
40
60
80
- 0.96 V vs NHE
q /
C
Time / h
5 μM HTIM
Figure S6. Bulk electrolysis data for a 5 µM solution of [Ni(HTIM)]2+ in 0.1 M NaClO4, pH 5, electrolysing at –0.96 V for ca. 12 h.
Electronic Supplementary Material (ESI) for Energy & Environmental ScienceThis journal is © The Royal Society of Chemistry 2012

-S7-
0.00 0.25 0.50 0.75 1.00
0.0
0.2
0.4
0.6
0.8
- 0.82 V vs NHEpH 5
q /
C
Time / h
cyclam HTIM MTC MCC blank
L q / C F.E.(%) CO:H2
cyclam 0.26 Trace CO and H2
HTIM 0.12 No CO or H2
MTC 0.24 Trace CO and H2
MCC 0.26 Trace CO and H2
TM - - -
blank 0.68 ± 0.01 87 ± 10 No CO
Figure S7. Bulk electrolysis at –0.82 V vs NHE (η = –0.41 V) for 50 μM [Ni(L)]2+ in 0.1 M NaClO4, pH 5; CO:H2 is the ratio (mol CO / mol H2), as quantified by GC analysis after 1 h electrolysis.
Electronic Supplementary Material (ESI) for Energy & Environmental ScienceThis journal is © The Royal Society of Chemistry 2012

-S8-
0 10 20 30
0
5
10
15
20
25
- 0.96 V vs NHEpH < 2
q /
C
Time / min
blank cyclam HTIM MTC MCC TM
L q / C F.E.(%) CO:H2
cyclam 4.60 80 0.4
HTIM 23.2 88 0.8
MTC 23.7 82 0.6
MCC 10.5 83 0.1
TM 4.20 79 0.04
blank 2.85 64 No CO
Figure S8. Bulk electrolysis at –0.96 V vs NHE for 5 μM [Ni(L)]2+ in 0.1 M NaClO4, pH < 2; CO:H2 is the ratio (mol CO / mol H2), as quantified by GC analysis after 0.5 h electrolysis.
Electronic Supplementary Material (ESI) for Energy & Environmental ScienceThis journal is © The Royal Society of Chemistry 2012

-S9-
0 2 4 6 8 10
8
12
16
8
12
16
μV
Time / min
pH < 2
H2
μV
pH 5
O2
N2
CO
TCD
20
40
60
0 2 4 6 8 10
20
40
60
CO
pA
pH 5
FID
pA
Time / min
pH < 2
Figure S9. Chromatograms (TCD at left, FID at right) corresponding to gaseous product analysis after bulk electrolysis (–0.96 V vs NHE) at pH 5, 50 uM [Ni(MTC)]2+ after 1 h electrolysis (top panels), and at pH < 2, 5 uM [Ni(MTC)]2+ after 0.5 h electrolysis (bottom panels).
Electronic Supplementary Material (ESI) for Energy & Environmental ScienceThis journal is © The Royal Society of Chemistry 2012

-S10-
-0.5 -1.0 -1.5
0
5
10
-0.5 -1.0 -1.5
0
10
20
-1.0 -1.2 -1.4
0.0
0.5
electrolyte only, 100 mV s-1
50 mV s-1
100 mV s-1
200 mV s-1
500 mV s-1
pH 5, under CO2
pH 5, under Ar
j / m
A c
m-2
Potential vs NHE / V
electrolyte only, 100 mV s-1
50 mV s-1
100 mV s-1
200 mV s-1
500 mV s-1
-0.5 -1.0 -1.5
0
10
20
-0.5 -1.0 -1.5
0
5
10
j / m
A c
m-2
Potential vs NHE / V
electrolyte only, 100 mV s-1
50 mV s-1
100 mV s-1
200 mV s-1
500 mV s-1
pH 2, under CO2
pH 2, under Ar
electrolyte only, 100 mV s-1
50 mV s-1
100 mV s-1
200 mV s-1
500 mV s-1
Figure S10. Scan rate dependence of the current density (j) vs applied potential for 1 mM solutions of [Ni(HTIM)]2+ in 0.1 M NaClO4 under Ar and CO2, pH 5 (left panel) and pH 2 (right panel), with SMDE working electrode (area = 0.0104 cm2); 10 mM phosphate buffer added to pH 2 study, pH adjusted with concentrated HClO4. Notice that when the system is under Ar, the peak current densities are significantly higher and are shifted to more positive potential at pH 2 compared to at pH 5. When the system is under CO2, however, the peak current densities and their respective potentials are comparable at either pH.
Electronic Supplementary Material (ESI) for Energy & Environmental ScienceThis journal is © The Royal Society of Chemistry 2012
-S11-
III. SUPPLEMENTARY INFORMATION FOR PULSE RADIOLYSIS EXPERIMENTS
0 100 200 3000
2
4
6
8
10
k = 3.3 x 10⁹ M-1s-1, R2 = 0.99367k = 3.9 x 10⁹ M-1s-1, R2 = 0.99941k = 6.4 x 10⁹ M-1s-1, R2 = 0.99964k = 7.1 x 10⁹ M-1s-1, R2 = 0.99161
HTIM MTC MCC TM
k ob
s (38
0 n
m)
/ s-1 x
105
[Ni] / μM
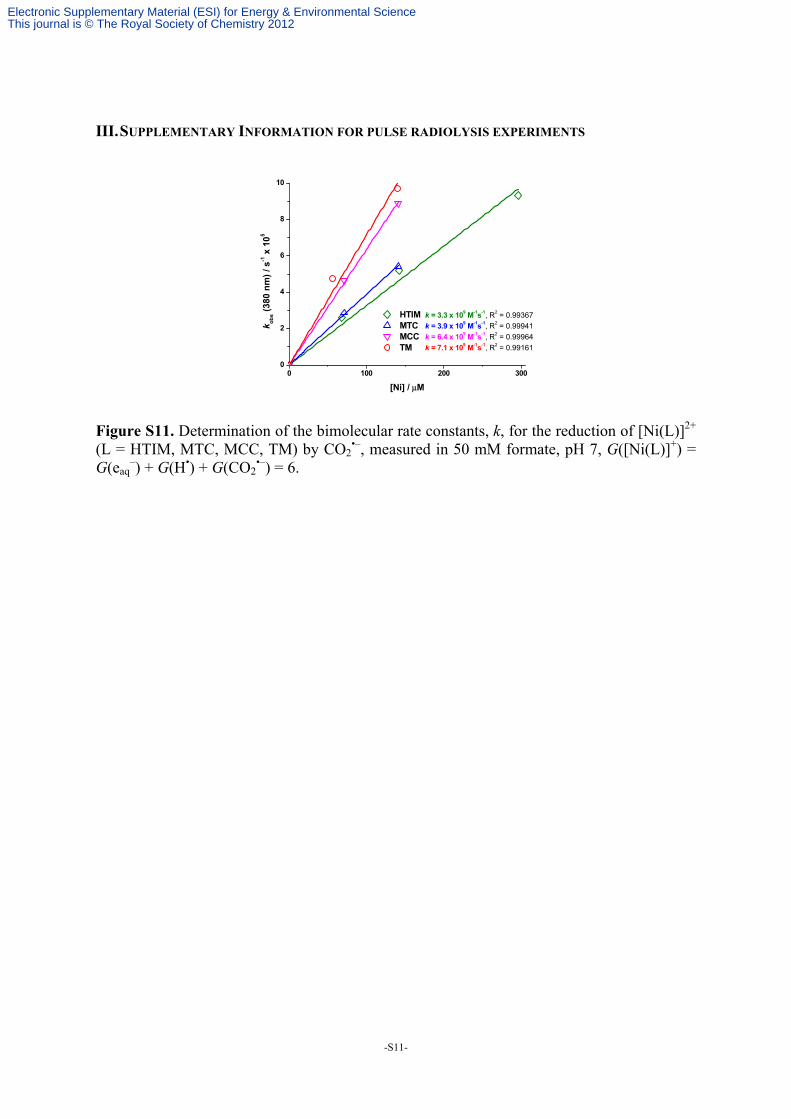
Figure S11. Determination of the bimolecular rate constants, k, for the reduction of [Ni(L)]2+ (L = HTIM, MTC, MCC, TM) by CO2
•–, measured in 50 mM formate, pH 7, G([Ni(L)]+) = G(eaq
–) + G(H•) + G(CO2•–) = 6.
Electronic Supplementary Material (ESI) for Energy & Environmental ScienceThis journal is © The Royal Society of Chemistry 2012

-S12-
300 400 500 600 7000
1
2
3
300 400 500 600 7000
1
2
3
Ar, 100 mM formate, pH 5 CO
2, 100 mM formate, pH 5
εn
orm
alis
ed a
t 38
5 n
m
Wavelength / nm
Ar, 100 mM formate, pH 5 CO
2, 100 mM formate, pH 5
εn
orm
alis
ed a
t 38
0 n
m
Figure S12. Transient spectra of [Ni(TM)]+ (top panel) and [Ni(HTIM)]+ (bottom panel) obtained by pulse radiolysis in 0.1 M formate under Ar and CO2.
Electronic Supplementary Material (ESI) for Energy & Environmental ScienceThis journal is © The Royal Society of Chemistry 2012
-S13-
(A)
2400 2800 3200 3600 40000
50
100
150
ε 380
* [C
O2]
/ cm
-1
ε380
/ dm3 mol-1 cm-1
R2 = 0.99989
K = -0.076 +/- 0.001 M
2400 2800 3200 3600 40000
50
100
150
R2 = 0.98917
K = -0.115 +/- 0.008 M
ε 385
* [C
O2]
/ cm
-1
ε385
/ dm3 mol-1 cm-1
(B)
0 2 4 6 8
-40
-20
0
20
40
60
Ar 9.9% CO
2
30.3% CO2
100% CO2
Ab
s x
103
Time / μs
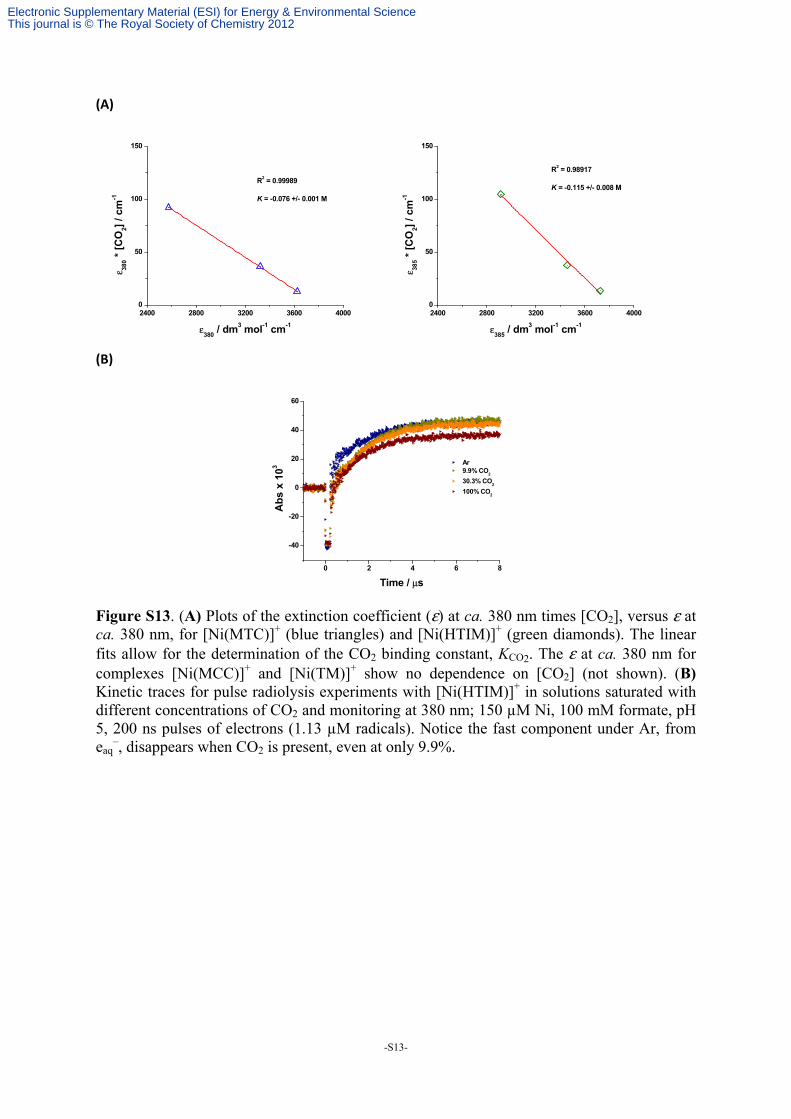
Figure S13. (A) Plots of the extinction coefficient (ε) at ca. 380 nm times [CO2], versus ε at ca. 380 nm, for [Ni(MTC)]+ (blue triangles) and [Ni(HTIM)]+ (green diamonds). The linear fits allow for the determination of the CO2 binding constant, KCO2. The ε at ca. 380 nm for complexes [Ni(MCC)]+ and [Ni(TM)]+ show no dependence on [CO2] (not shown). (B) Kinetic traces for pulse radiolysis experiments with [Ni(HTIM)]+ in solutions saturated with different concentrations of CO2 and monitoring at 380 nm; 150 µM Ni, 100 mM formate, pH 5, 200 ns pulses of electrons (1.13 µM radicals). Notice the fast component under Ar, from eaq
–, disappears when CO2 is present, even at only 9.9%.
Electronic Supplementary Material (ESI) for Energy & Environmental ScienceThis journal is © The Royal Society of Chemistry 2012

-S14-
IV. SUPPLEMENTARY INFORMATION FOR CALCULATIONS, CALIBRATIONS, ETC.
N-RRRS-[Ni(cyclam)]2+
or Trans II, < 1%N-RSRS-[Ni(cyclam)]2+
or Trans I, 15%N-RRSS-[Ni(cyclam)]2+
or Trans III, 85%N-RRRR-[Ni(cyclam)]2+
or Trans V, < 1%N-RSSR-[Ni(cyclam)]2+
or Trans IV, < 1%
H
H
N
HNHN N
H
HN
HN
HNN
H
H
NH
N
H
N N
H HN
HN
HN
N
H
H
H
HN
N
NN
H HN
HN
HN
N
H
H
HH
N N
NN
H HN
HN
HN
N
H H
N
H
N
H
N
N
HHN
HN
HN
N
Ni2+
Ni2+
Ni2+
Ni2+
Ni2+
Ni2+
Ni2+
Ni2+
Ni2+
Ni2+
Figure S14. Conformational isomers of [Ni(cyclam)]2+ present in solution and their relative abundance at equilibrium.
Figure S15. Side view (left) and bottom view from the ‘mercury surface’ looking up (right) of N-RSRS-[Ni(cyclam)(CO2)]
+ adduct adsorbed to ‘mercury surface’ in CPCM of water solvent, where the ‘mercury surface’ is represented by a single Hg atom in the sixth coordination position of Ni. Atom colors: Ni (yellow), C (orange), H (white), N (cyan), O (red), Hg (yellow). Quite similar results were obtained using the B3LYP and the LC-ωPBE functionals with the 6-31+G(d,p) basis for Ni, C, N, O and H, and the SBKJC ECP basis for Hg.
Electronic Supplementary Material (ESI) for Energy & Environmental ScienceThis journal is © The Royal Society of Chemistry 2012

-S15-
0 1 2 3 4 50
250
500
750
1000
Are
a C
O P
eak
(FID
)
mL CO added to cell (10 mL soln)
y = (183 +/- 5) x, R2 = 0.99286
mL CO = Area CO Peak / 183
0.0 0.5 1.0 1.5 2.0 2.50
7
14
21
28
35y = (0.0134 +/- 0.0004) x, R2 = 0.99359
μL H2 = Area H
2 Peak / 0.0134
Are
a H
2 P
eak
(TC
D)
mL H2 added to cell (10 mL soln)
Figure S16. Calibration plots for measuring CO and H2 produced during bulk electrolysis experiments, the gases were quantified by FID and TCD detectors, respectively. Calibration is for 10 mL solution present in the electrolysis cell.
Figure S17. Example calculation for determining the Faradaic efficiency (F.E.) of a typical bulk electrolysis experiment.
Electronic Supplementary Material (ESI) for Energy & Environmental ScienceThis journal is © The Royal Society of Chemistry 2012