co-sponsorship networks of minority-supported legislation in the
TRANSCRIPT

Co-Sponsorship Networks of Minority-Supported Legislation in the House∗
David EpsteinDepartment of Political Science
Columbia University
James FowlerDepartment of Political Science
University of California, San Diego
Sharyn O’HalloranDepartment of Political Science and SIPA
Columbia University
August 21, 2006
Abstract
Works that measure the substantive representation of minority interests based solely onroll call data have been criticized for ignoring more behind-the-scenes activities that legislatorsmight perform on behalf of their constituents. We thus focus in this paper on cosponsorship asa proxy for the degree to which members maneuver to create coalitions that will advance thesubstantive policy goals of the minority community. We find, consistent with previous work,that minority legislators tend to provide more of these types of activities than do other types oflegislators, but maximizing cosponsorship benefits for bills that pass Congress involves creatingdistricts of about 45% black voting age population.
∗Paper prepared for presentation at the American Political Science Association Meetings, held September 1–3,2006 in Philadelphia, Pennsylvania. Preliminary draft; comments welcome.
1

1. Introduction
Substantive representation comprises the variety of actions that elected officials undertake on
their constituents’ behalf. These include easily measurable activities, such as voting for or against
a given policy. Elected officials also undertake many less easily observed activities, such as setting
agendas, working against less-favored legislation, constituency service, trading favors, and generally
forming bonds with fellow legislators to move policy in the desired direction.
These informal components of substantive representation become particularly important when
we think of the position of minorities in a democratic system. The defining feature of being a minor-
ity under majority rule is that to enact policies the group must perforce build coalitions. Therefore
the many informal ways in which policy is made come into play, through building alliances, helping
to further a group’s agenda, and horse trading to achieve the best possible results.
The first wave of scholarly studies on race and substantive representation focused on legislative
voting behavior; that is, the extent to which a member votes in favor of minority-preferred policy
positions (Cameron, Epstein and O’Halloran 1996; Whitby 1997; Lublin 1997). Using roll call
voting as an exclusive measure of substantive representation, though, has been criticized for not
incorporating the many other important actions that legislators undertake on their constituents’
behalf (Young 1990; Hall 1996; Williams 1998; Mansbridge 1999; Grofman 2006). Indeed, other
authors posit that minority legislators provide benefits outside of the work done to pass legislation:
bill introduction and cosponsorship (Canon 1999; Sinclair-Chapman 2003), constituency service
(Fenno 2003), general voter satisfaction with their performance (Tate 2003), and agency oversight
(Minta 2006). Therefore it is argued that measures focusing solely on final policy passage may
underestimate the impact of electing minorities to offices as opposed to electing a legislative body
that is, on average, supportive of minority goals.
We tackle this problem by investigating another means by which legislators can help further
minorities’ policy goals: cosponsoring legislation, a topic which has received increased attention in
the legislative literature (Mayhew 1974; Campbell 1982; Fowler 2006a). For our purposes, the key
question is whether cosponsorship activity is a reasonable proxy for the extent to which legislators
work behind the scenes on their constituents’ behalf. On this question, a key article is Kessler and
2

Krehbiel (1996), which examines the dynamics of cosponsorship and concludes that the decision
to cosponsor can best be thought of as a signal to fellow legislators, rather than as an indication
of a representative’s position on the bill itself. Recent work by Goodliffe, Rothenberg and Sanders
(2004), though, casts doubt on these conclusions, arguing that cosponsorship is actually a type of
position taking, meant to please constituents. In this paper we explicitly endorse this latter view,
similar to the stance taken by previous analysts of cosponsorship and race.
Our project has a normative as well as positive purpose. Many of the works cited above,
including previous studies of race and cosponsorship, find a significant correlation between the race
of a representative and degree of substantive representation they afford their constituents, and
take this as a strong argument for the retention of majority-minority districts designed to elect a
candidate of choice of the minority community. We take issue with these interpretations on two
accounts. First, a number of these works, including Tate (2003), do not take into account the
racial composition of a district. The finding that constituents living in majority-black districts are
generally more satisfied with the quality of their representation may thus simply reflect that fact
that any representative from such a district, black or white, would have to pay a good deal of
attention to the policy preferences of the district’s black population.
Second, it is not enough to say that since minority representatives provide more of substantive
representation activity X, minority constituents are best served by electing more minorities to office.
These districts come at a cost; namely, the removal of minority voters from surrounding districts.
The question, then, should not be whether one type of representative provides more of X than
another, but at which point the gains in X from adding more minority voters to one district just
balance the losses of X in surrounding districts. Thus, similar to our previous work in this area
(Cameron, Epstein and O’Halloran 1996; Epstein and O’Halloran 2006), we calculate the districting
patterns that maximize the provision of cosponsorship benefits.
We also take advantage of the fact that cosponsorship activity can tell us much about the policy
networks that form within Congress. Which sets of legislators, that is, tend to work closely together
via mutual cosponsorship, and where do clear divisions appear? Are minority legislators cohesive
in their cosponsorship activity? Are they well connected to other Democrats and/or members
3

from across the aisle? Which members are more likely to cosponsor bills proposed by minority
legislators, and how does the accrual of cosponsors affect a bill’s probability of success? We answer
these questions through the application of modern network analysis techniques to the cosponsor
data, with some intriguing results.
The next section describes our data set and the network-based techniques we use to analyze
it. We then look at the position of black democrats within the various networks of bill cosponsors
over time. The next section looks at the districting schemes that maximize various network-based
measures of substantive representation, while the final section concludes.
2. Data Definitions
Data for the legislative cosponsorships is available in the Library of Congress Thomas legislative
database (see Fowler 2006a, 2006b for detailed descriptions of this data). For the purposes of this
study we include each cosponsorship tie from the cosponsor to the sponsor for all 113,223 House
non-private bills and amendments that were introduced from the 96th to the 108th Congress. Black
members of Congress were sponsors on 5,096 of these bills (we will generically refer to both bills
and amendments as bills). In addition, we focus on the 14,091 bills that passed in a floor vote in
the House, 661 of which were sponsored by Black legislators.
Figure 1 illustrates some basic trends in bill sponsorship. Black Democrats have gradually
increased the total number of bills they sponsor, primarily as their numbers in the Congress have
risen over time. White Democrats sponsored more bills when they held the majority, but they
were overtaken by Republicans with the change in majority control in the 104th. Overall, Black
Democrats introduced an average of 325.5 pieces of legislation per congress under Democratic
control, as opposed to 414.4 under Republican control. Thus, even when they were both a partisan
and ethnic minority, they continued to sponsor a significant amount of legislation.
These totals are strongly related to the number of white and black Democrats and Republicans in
each Congress. However, as we can see when we examine the average bills sponsored per legislator,
partisan control of the Congress appears to correlate with individual sponsorship activity as well.
The average black Democrat sponsored nearly twice as many bills in the 99th Congress under
4

Figure 1: Sponsorship trends. Note: White circle = white dem, black circle = black dem, blacktriangle = republican.
5

Democratic control than in the 104th under Republican control. White Democrats also became
less active than Republicans after the 104th.
The chance that these bills pass the floor of the house appears to be affected by partisan
control. Bills sponsored by white and black Democrats were about twice as likely to pass prior to
the 104th Congress, when the rate of passage of Republican-sponsored bills skyrocketed to 28% and
the rate for Democrats fell to 12%. However, the change for Black Democrats was less dramatic.
Under Democratic control 13.7% of bills proposed ultimately passed, as opposed to 11.2% under
the Republicans.
One can measure cosponsorship activity in a number of ways. The most basic distinction
is between “inward cosponsorship” — measuring the degree to which other members cosponsor
legislation that you sponsor — and “outward cosponsorship” — the degree to which you cosponsor
others’ legislation. One can also measure activity in terms of unique cosponsors, meaning the
number of the 434 other members of the House that engage in cosponsoring activity relative to a
given member, or total cosponsors. If a member sponsors 10 bills in a given congress, then, the
maximum number of unique cosponsors is 434, while the maximum total cosponsors is 4,340. We
also distinguish between cosponsor activity with respect to the black members in a given congress
as opposed to the non-black members.1 Finally, weighted measures scale each cosponsoring relation
by the total number of cosponsors, as explained in the following section. A list of different cosponsor
measures is provided in Table 1.
3. The Network of Cosponsorship
We first examine the structure of cosponsorship networks in the House, and the evolution of
the position of blacks within these networks over time. The three network representations in
Figure 2 are for the 103rd, 104th, and 108th Congresses, respectively, corresponding to Clinton’s
first Congress with unified democratic control, his second Congress, where the republicans took
control of the House and Senate, and finally unified republican control under Bush.1When constructing these measures, we count only black democrats, as black republicans usually act like other
republicans in their voting and cosponsorship behavior. We also use the term “white” to refer to all non-blackmembers of congress, although this category can obviously contain hispanics and members of other nationalities aswell.
6

Variable Decription
sponsored number of bills sponsoredinu unique inward cosponsorsinub unique inward black cosponsorsinuw unique inward white cosponsorsoutu unique outward cosponsoredoutub unique outward blacks cosponsoredoutuw unique outward whites cosponsoredinb total inward cosponsor signaturesinbb total inward black cosponsor signaturesinbw total inward white cosponsor signaturesoutb total outward cosponsor signaturesoutbb total outward black cosponsor signaturesoutbw total outward white cosponsor signaturesinw total weighted inward cosponsor signaturesinwb total weighted inward black cosponsor signaturesinww total weighted inward white cosponsor signaturesoutw total weighted outward cosponsor signaturesoutwb total weighted black outward cosponsor signaturesoutww total weighted white outward cosponsor signatures
Table 1: Definition of Cosponsorship Variables. Note: “unique” means number of individuals whocosponsored or were cosponsored at least once. Signatures are the sum of all cosponsors on all billssponsored.)
7

103rd
104th
108th
Figure 2: Strength of social ties via cosponsor networks. Separated by legislator type: Republicans(squares), White Democrats (light circles), and Black Democrats (dark circles).
8

These graphs utilize the “connectedness” measure introduced by Fowler (2006a, 2006b) to in-
dicate the degree to which one legislator supports another. Unlike traditional social tie measures,
connectedness takes advantage of two pieces of information that are helpful for determining the
strength of social relationships in the cosponsorship network. First, as the total number of cospon-
sors on a bill increases, it becomes more likely that the cosponsor is recruited by an intermediary
other than the sponsor, increasing the possibility that there is no direct connection at all. Thus,
bills with fewer total cosponsors probably provide more reliable information about the real so-
cial connections between two legislators than bills with many cosponsors. Fowler posited that the
strength of the connection between i and j on a given bill b with total cosponsors cb is 1/cb.
Second, legislators who frequently cosponsor bills by the same sponsor are more likely to have a
real social relationship with that sponsor than those who cosponsor only a few times. To incorporate
this information with the assumption about the effect of the number of cosponsors into a measure
of connectedness, let aijb be a binary indicator that takes the value 1 if legislator i cosponsors a
given bill b sponsored by legislator j and is otherwise 0. The weighted quantity of bills cosponsored
is then given by the sum
wij =∑
b
aijb
cb. (1)
Applying the connectedness measure to all the legislators in the network, Fowler found that
legislators with high connectedness scores tend to sponsor more legislation and acquire more cospon-
sors, but some manage to score highly by being connected to other legislators who are themselves
well-connected. Moreover, connectedness appears to outperform other network measures in pre-
dicting the number of successful amendments proposed by each legislator and the likelihood other
legislators will vote for their bills in final roll calls.
To generate the graphs in Figure 2, we used the universe of bills that passed the floor of the
House to calculate the connectedness of each pair of legislators in each congress and then used the
Kamada-Kawai algorithm to place each legislator in the network. This algorithm attempts to keep
each legislator at a fixed distance away from all other legislators that is inversely proportional to
the strength of the ties between them. Legislators at the center of the network are likely to have
9

strong connections with other influential legislators.
Note that the black democrats were central figures in the 103rd Congress, but they became
significantly more marginalized in the following two, along with the other democrats. This is not
too surprising; democrats of all types would be expected to become less pivotal in the passage of
legislation under a republican-controlled congress. Notice also that blacks became more dispersed,
suggesting that mutual support on important legislation declined.
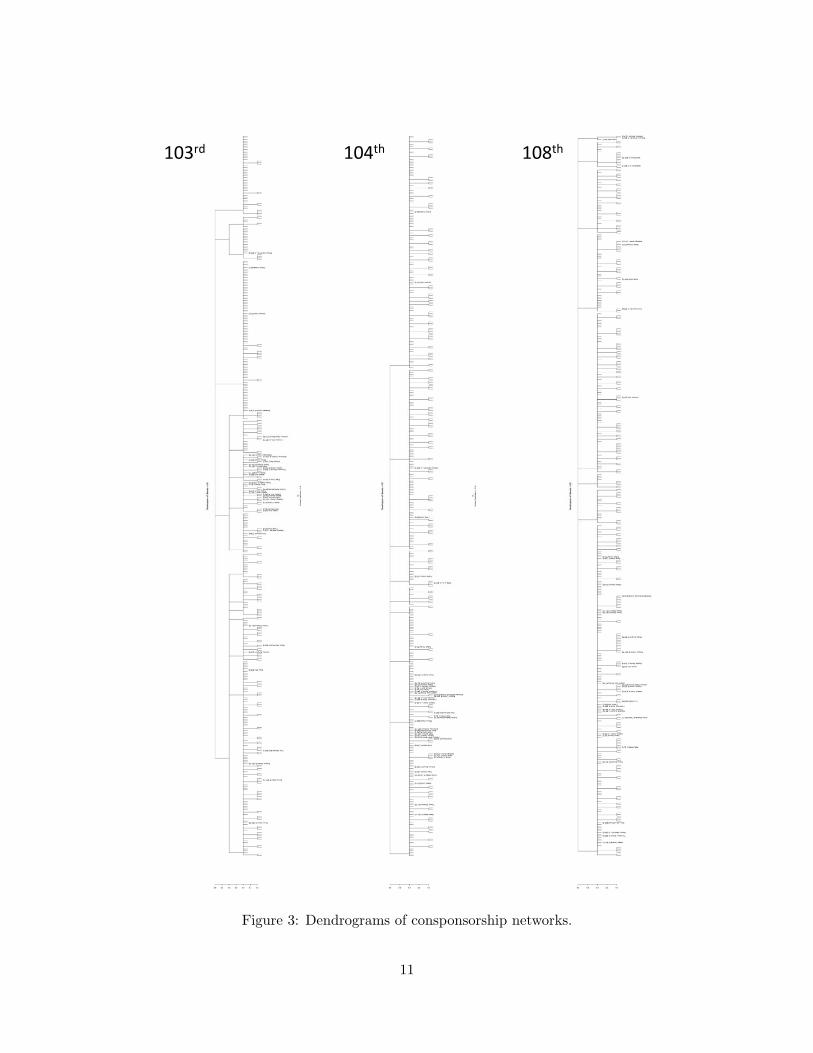
Figure 3 tells a similar story using dendrograms from a divisive hierarchical clustering procedure
(“diana”–see Kaufman and Rousseeuw 1990, ch. 6) to identify social cliques. This procedure
assumes a connection exists between i and j if i cosponsored any of j’s bills (that passed) or vice
versa.2 For clarity of exposition, only the black representatives are named in the dendrograms.
Notice, again, how much more diffuse blacks are in the 108th Congress than in the 103rd or 104th.
This suggests either that the interests of black legislators are becoming less uniform or they have
been decreasingly able to coordinate their policy actions as a minority.
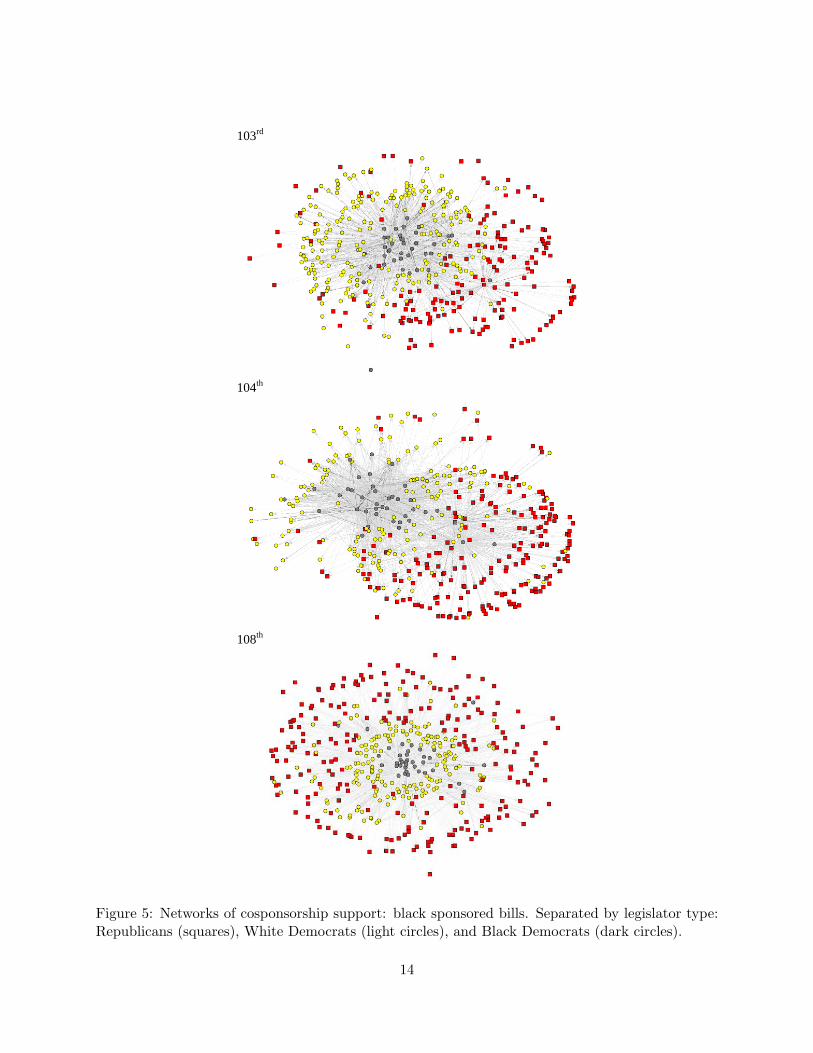
To explore further the evolution of coalitions in Congress, Figures 4 and 5 present network
graphs that omit some information to increase clarity. In these figures we assume that tie strength
is equal to the sum of bills sponsored by i and cosponsored by j (whether they passed or not) and
vice versa. Tie darkness is proportional to the number of bills mutually cosponsored.
In Figure 4 we omit all ties in which legislators mutually cosponsored one another less than five
times, and then use the Kamada-Kawai algorithm to represent the network. Notice that although
there are cohesive partisan groups in the 103rd Congress, there are still many Democrats (a few
of them black) that maintain cosponsor relationships within the Republican coalition, and a few
Republicans within the Democrat coalition. This mixing begins to decline in the 104th and by
the 108th is almost completely gone. Democrats and Republicans become sharply polarized and
a strongly connected group of blacks lies at the core of the Democratic coalition. In the 103rd
and 104th many black Democrats existed at the margins, but by the 108th the vast majority were
strongly connected to the center of the party.
In Figure 5 we do not omit any ties, but we do omit all bills sponsored by whites so we can2When other measures were used as the basis of the dendrograms, the resulting figures displayed a much larger
number of levels, making interpretation difficult.
10
103rd 104th 108th
Figure 3: Dendrograms of consponsorship networks.
11

103rd
104th
108th
Figure 4: Networks of cosponsorship support: all legislator pairs with at least five mutual cospon-
sorships. Separated by legislator type: Republicans (squares), White Democrats (light circles), andBlack Democrats (dark circles).
12

observe the network of black-sponsored legislation. Here notice that the 103rd congress shows a
core of mutual support for black Democrats surrounded by a layer of white Democrats. Some
Republicans are placed near the core of this group, but many lie at the extremes and a large group
focuses its support on a couple of black Democrats and a lone black Republican. In the 104th,
the difference in groups that support black Democrats and black Republicans becomes even more
pronounced, and the coalition of white Democrat support weakens as many distance themselves
from the core group of black Democrats. By the 108th these differences have mostly disappeared
again, primarily because no black Republicans remain in office. Distance from black sponsors
becomes strongly aligned with partisanship. Ideology also plays a role — the white Republican
near the core (Chris Shays) is from liberal Connecticut and the extreme topmost white Republican
(Tom Delay) is one of the architects of the neo-conservative revolution.
From this analysis we draw two conclusions. First, the republican takeover of the House in the
104th Congress marginalized black democrats — literally and figuratively — in the policymaking
process. They have gone from central members of the ruling democratic coalition to fringe players,
loosely connected to the major figures in the republican power structure. Second, partisan divisions
have intensified since the early 1990’s, meaning that there are fewer liberal republicans or conser-
vative democrats, at least with respect to cosponsoring minority-supported legislation. For our
analysis below, these trends reinforce the negative impact on minority substantive representation
that results from republicans controlling the key policy levers in Congress.
4. Optimizing Cosponsorship Measures
We now turn to the relationship among district composition, representative type, and sub-
stantive representation via cosponsorship activities. We begin by examining “triangle” plots of
cosponsorship and bill passage, as shown in Figure 6. To generate the plots, for each bill sponsored
by a black democrat, the proportion of the cosponsoring coalition that was republican, white demo-
crat, and black democrat was calculated. In each of the three figures, the black democrat proportion
of the cosponsoring coalition for each bill is shown on the left-hand side, white democrats are on
the right hand side, and republicans run along the bottom. The relative proportion of each type for
13
103rd
104th
108th
Figure 5: Networks of cosponsorship support: black sponsored bills. Separated by legislator type:Republicans (squares), White Democrats (light circles), and Black Democrats (dark circles).
14

every proposed bill appears as a circle on the graph; bills that passed are shaded. The solid lines
divide the triangle into three regions: in the top region the biggest proportion of cosponsorships
come from black democrats; in the lower right the plurality comes from white democrats, and in
the bottom left, from republicans.
What patterns in these coalitions should we expect to see under changing partisan control
of government? Assume that legislators’ ideal points fall in a simple one-dimensional space, and
that minority legislators all have ideal points far to the left (liberal), relative to the median voter.
Consider for a moment which patterns of cosponsorship one would expect for both legislation that
passes, and legislation that fails to pass. In the latter case, assuming full information, the sponsor
might as well propose her ideal point, and in doing so she will gain the support of her fellow
minority legislators and perhaps moderate white democrats, but not the median voter. In terms
of the triangle plots, we would expect such bills to fall on the right side of the graph, where few or
no republicans are in the cosponsoring coalition.
If the legislation is meant to pass, though, there are three possibilities. First, if the status quo
is even further to the left than are the black democratic legislators, then the proposal will receive
universal support, no matter who controls the House. In the more likely scenario where the status
quo is to the right of the median voter, the proposal will be set strategically to gain the support
of the median voter and all legislators to his left, meaning that the bill will need to have some
republicans cosponsors if the republicans control the House. Or if the status quo is far to the right,
then the cosponsoring coalition will contain more republicans as well as white democrats. And if
Republicans control the White House too, then a proposal that passes will usually have to be moved
even further to the right to get the president’s signature, meaning that more House republicans are
likely to cosponsor as well.
In fact these predictions are borne out remarkably well in Figure 6. In all congresses, proposals
that did not pass were located heavily to the right side of the figure. In the 103rd Congress, with
unified democratic control, the proposals that passed still had mostly democratic cosponsors. In the
104th Congress, more republicans were in the sponsoring coalition of passed bills, and even more so
in the 108th, with unified republican control of Congress and the presidency. Another implication
15

.8
1 0
.2
103rd Congress
.2
.4
.6 .4
.6
.8
Black Dem. White Dem.
0
.2 .8
1
0.2.4.6.81Republican
106th Congress
.6
.8
1 0
.2
.4
106th Congress
0
.2
.4 .6
.8
1
Black Dem. White Dem.
0.2.4.6.81 Republican
1 0108th Congress
.4
.6
.8 .2
.4
.6Black Dem. White Dem.
0
.2 .8
1
0.2.4.6.81Republican
Figure 6: Percent of cosponsor support coming from Republicans, White Democrats and BlackDemocrats for bills sponsored by Black Democrats. Passed bills are shaded.
16

of the model is that republican cosponsors should be positively related to the probability that
a proposed bill passes, and indeed a simple logit model of passage on types of cosponsors gives
exactly these results. So the cosponsorship patterns observed in the data are consistent with a
simple theoretical model of strategic bill proposal.
For this section of the analysis, we began by defining dependent variables that capture the
degree of cosponsor support with respect to minority legislators. For inward support we used the
variable inbb from Table 1, the total black cosponsor signatures receive, both on all bills and only
those bills that passed. Similarly, we used outbb for our outward cosponsor support measure,
the total signatures given to black-sponsored legislation, again for both all bills and passed bills.
Finally, we used factor analysis on the measures in Table 1 and found two dominant factors, the first
relating to the outward support measures and the second to inward support. We used the first of
these — which we term the “outward factor score” — as another indicator of support for minority-
sponsored legislation.3 We also collected information on the black voting age population in each
district (BVAP), the member’s party, region, bills sponsored, and voting support for minorities.
Summary statistics of all measures are given in Table 2.
Variable Mean Std. Dev. Min. Max. N
Black Voting Age Population 0.11 0.14 0 0.9 6598Republican 0.43 0.5 0 1 6607South 0.3 0.46 0 1 6607Black 0.06 0.24 0 1 6598Voting Support 0.54 0.29 0 1 6598Bills Sponsored 17.16 17.47 0 257 6598Inward Support, All Bills 15.44 26.65 0 388 6598Inward Support, Passed Bills 10.31 14.26 0 146 6598Outward Support, All Bills 1.68 5.83 0 121 6598Outward Support, Passed Bills 1.66 2.36 0 19 6598Outward Factor Score 0.00 0.99 -2.11 7.56 6598
Table 2: Summary Statistics
A few words are in order about the role of race in determining cosponsorship behavior. In3The outward cosponsorship measures also have a greater correlation with the degree of roll call voting support for
minority favored legislation than the inward measures, and they correspond more nearly to the measures of cosponsorsupport used in previous studies. Hence we focus most of the further analysis on these measures.
17

general, it is difficult to distinguish the independent effect that the race of a representative has
on legislator actions, since minority representatives tend to be elected almost exclusively in the
high-BVAP districts. Since the 103rd Congress, for instance, 92% of the elections held in districts
with BVAP greater than 45% were black, while only 2% of the elections in under-45% BVAP
districts resulted in a black taking office. Thus our inferences on what would happen were a white
representative to be elected from a majority black district are based on extrapolations from their
behavior in low-BVAP districts, which is not an ideal situation for forecasting.
Also, when examining the data one finds that although blacks generally have higher cospon-
sorship scores than whites, this pattern is far from absolute. In the 108th Congress, for example,
neither the fifth nor the sixth ranked representatives according to their outward cosponsor (outbb)
scores were black. The first of these, Martin Frost [TX-24], had a combined latino plus black
population of over 50%. The second, Raul Grijalva [AZ-7] comes from a 44% latino district. But
others, such as 11th ranked Jim McDermott [WA-7] and 13th ranked Dennis Kucinich [OH-10] have
few minorities of any type in their districts, but they cosponsor legislation in general at high rates
and have high voting support scores for black legislation as well. In fact, 15 of the top 40 by this
ranking are non-blacks, and the lowest-ranked black, Denise Majette [GA-4] is only 88th on the
list. Partisan difference are nearly absolute, though; the highest-ranked republicans, Mark Foley
[FL-16], is tied for number 146 on the list.
To see which variables affect members’ levels of cosponsorship support for minorities, Table 3
reports the results from negative binomial regressions of two support measures — inbb and outbb
— for the early and late portions of our sample period. In all cases the values of the overdispersion
parameter α were high enough to reject a Poisson distribution in favor of the negative binomial
specification.
The results show that for predicting inward support — that is, the degree to which minority
legislators cosponsored a given member’s bills — democrats, non-southerners and blacks receive
more support than their counterparts in both periods, while the black voting age population of the
district had no independent impact. Moreover, the marginal impact of each variable on the number
of cosponsorships received was roughly constant in the early and late periods.
18

Cosponsor Measure Inward Inward Outward Outward
Congresses 96–103 104–108 96–103 104–108
Black Voting Age Population -.158 .162 1.017 .560(.292) (.369) (.195)∗∗ (.193)∗∗
Republican -1.263 -.571 -1.082 -1.616(.050)∗∗ (.063)∗∗ (.036)∗∗ (.035)∗∗
South -.719 -.552 -.724 -.192(.055)∗∗ (.067)∗∗ (.041)∗∗ (.038)∗∗
Black 1.044 .689 .925 .790(.165)∗∗ (.181)∗∗ (.111)∗∗ (.096)∗∗
Obs. 4397 2196 4397 2196Pseudo-R2 .031 .017 .06 .137α 2.243 1.696 1.037 .433
Table 3: Negative binomial regressions of cosponsor network support levels. ** = 0.05.
For outward cosponsorships, all four independent variables are highly significant in both peri-
ods, including district BVAP. Here, the marginal impact of being a southern representative falls
significantly from the early to late period, while the impact of being republican rises. Thus parti-
sanship begins to dominate sectional differences in the more recent analysis of our key measure of
cosponsorship support.4
So far, our results have mirrored those of previous studies, showing significant partisan and racial
differences in the provision of substantive representation benefits. We conclude our analysis by
examining the levels of BVAP that would maximize these different measures of cosponsor support.
For this part of the analysis, we take a hypothetical state with 25% black population and consider
districting schemes with a target maximum BVAP of x ≥ 0.25. Then we construct as many districts
with x percent BVAP as possible, and spread the remaining black voters equally across all remaining
districts. We estimate the impact of BVAP on the type of representative elected — republican,
white democrat or black democrat — via an ordered probit regression, yielding P (θ|BV APi) for
θ = 0, 1, 2 in district i. We also estimate the expected level of coponsorship support variable c
Rep(c|θ, BV APi) via robust linear regression. Finally, we calculate the average cosponsor support4In fact, if one performs a negative binomial regression using outward support for passed bills (poutbb) as the
dependent variable, only the coefficients on party and race of representative are significant for the later period, whileBVAP and south are insignificant.
19

Congress 96–102 103 104 108
Inward Cosponsorships 0.73 0.41 0.38 0.25Outward Cosponsorships 0.79 0.57 0.57 0.41Outward Cospon. (South) 1.00 0.52 0.48 0.46Outward Cospon. (Weighted) 0.83 0.61 0.51 0.43Outward Factor Score 0.77 0.52 0.55 0.35
Table 4: Levels of BVAP in most concentrated districts that maximize various cosponsorship-basedmeasures of substantive black representation
score across districts as:
maxx
∑i
P (θ|BV APi) ∗ Rep(c|θ, BV APi),
for a given cosponsor measure c, and where the relation between BV APi and x is implicit.5 Note
that this approach automatically takes into account the fact that putting more minority voters in
one district means removing them from surrounding districts, thus capturing both the benefits and
costs of concentrated minority districting schemes.
The results from this maximization exercise are given in Table 4 for five different measures c
of cosponsorship support. As indicated, in the early congresses very high levels of BVAP were
optimal, up to 100% black in the south. In this era the gap between minority and non-minority
support for black legislation was so great that maximizing substantive representation was achieved
at levels of BVAP that nearly guaranteed the election of a black representative.
But in more recent periods this optimal level of BVAP has fallen, to the point where it is now
uniformly under 50%, even in the south. This is not because racial and sectional differences in
representation have disappeared; rather, it is due to the rise of the Republicans’ electoral fortunes
and the fact the growing gap between the level of support offered by white democrats and the level
offered by republicans.
5. Conclusion
One way to read the results presented above is that they confirm once again the conventional
wisdom in this area: minority legislators do provide more substantive benefits than do their non-5This methodology was first used in Cameron, Epstein and O’Halloran (1996).
20

minority counterparts, but the hazard rate of electing Republicans is now so great, especially in
the South, that districting schemes designed to maximize substantive representation allocate no
more than 45% BVAP to any one district. There are benefits to electing minority representatives,
that is, but there are costs as well in surrounding districts, and responsible redistricting strategies
cannot ignore half of this equation.
Another way to view our findings, though, is to use them as a window into the realm of what it
takes to pass legislation that advantages minority voters. This is a generally underdeveloped field,
and we can only make a few tentative conclusions from the work presented here, but we see hints
of some broader themes emerging.
Namely, the recent partisan shifts have had just as dramatic an effect on cosponsorship networks
as they have had on policy proposals and voting. Whereas blacks were once key members of the
ruling democratic coalition, centrally located within the network of cosponsors even though they had
relatively extreme policy preferences, now they are completely marginalized. Partisan differences
dominate the landscape, adding another piece of evidence for the damage that majority republican
control has done to substantive black representation in Congress.
21

REFERENCES
Canon, David T. 1999. Race, Redistricting, and Representation: The Unintended Consequences
of Black Majority Districts. Chicago: University of Chicago Press.
Fowler, James H. 2006a. “Connecting the Congress: A Study of Cosponsorship Networks.” Po-
litical Analysis 14 (4): xxx.
Fowler, James H. 2006b. “Legislative Cosponsorship Networks in the U.S. House and Senate.”
Social Networks 28 (4): 454-465.
Fenno, Richard. 2003. Going Home: Black Representatives and Their Constituencies. Chicago:
University of Chicago Press.
Grofman, Bernard. 2006. “Operationalizing the Section 5 Retrogression Standard of the Voting
Rights Act in the Light of Georgia v. Ashcroft: Social Science Perspectives on Minority
Influence, Opportunity and Control.” Election Law Journal 5 (3): 250-282.
Hall, Richard. 1996. Participation in Congress. New Haven, Connecticut: Yale University Press.
Mansbridge, Jane. 1999. “Should Blacks Represent Blacks and Women Represent Women? A
Contingent Yes.” The Journal of Politics 61: 628-657.
Sinclair-Chapman, Valeria. 2003. “Transforming Politics: Advocating Black Interests Through
Bill Sponsorship.” Paper delivered at the University of Rochester’s Conference on New Per-
spectives on the Study of Race and Political Representation, Rochester, New York.
Williams, Melissa S. 1998. Voice, Trust, and Memory: Marginalized Groups and the Failings of
Liberal Representation. Princeton: Princeton University Press.
Young, Iris Marion. 1990. Justice and the Politics of Difference. Princeton: Princeton University
Press.
22