co-226 creating a gis application for retail planning in saudi arabia murad a
TRANSCRIPT

CO-226
CREATING A GIS APPLICATION FOR RETAIL PLANNING IN SAUDI ARABIA
MURAD A.
King Abdulaziz University, JEDDAH, SAUDI ARABIA
ABSTRACT
Geographical Information Systems (GIS) are used today to provide advanced analysis tools and complete
data packages for analyzing retail and demographic information. These tolls help retail planners in taking
important retail planning decisions such as choosing retail locations, identifying and reaching potential
customers, finding new markets, performing customer or store prospecting, defining customer-based or
store trade areas, and identifying best retail locations. The aim of this paper is create a GIS application for
retail planning in Saudi Arabia. Jeddah city has been selected as a case study representing a major
commercial city in Saudi Arabia. The first part of the paper discusses recent world wide GIS applications
in retail planning field. The second part of the paper focuses on the created GIS application and defines the
created data base for all retail centers located in Jeddah city. The outputs of the application help retail
planners in Jeddah city to evaluate the location and the spatial distribution of retail centers. In addition, the
created application helps retail planners in analyzing the catchment area of retail centers. Several GIS
functions are used in this paper including feature classification, address geo-coding, network and overlay
analysis.
1. INTRODUCTION
Geographical Information Systems (GIS) are used today at several planning applications including land
use planning, health care planning, and transportation planning. Retail planning is considered as one of the
planning fields that could benefit from using this novel technology. Retail planners are faced today with
many issues that can be better handled with GIS. These include constructing demographic, sales and
competitive analysis, finding the best locations for new retail stores, creating effective marketing
campaigns (Olson et al, 2005) , scheduling and route deliveries (Ganesh and Narendran, 2005), and
providing better customer care information system (Razmi et al, 2006). The development of large-scale
commercial formats also introduced some specific problems in the agenda of retailers, planners, and other
important participants in the city development process ( Spilkova and Sefrna, 2010). The most frequently
discussed problems in connection with suburban shopping centers are the decline of city centers and the
outflow of commercial functions to the outskirts of cities, traffic problems, particularly the problem of
parking, liquidation of small retailers by strong international retail chains, the aesthetic aspect of newly
constructed outlets and centers and also radical changes in the shopping behavior of customers (ibid).
GIS application in retail field is acknowledged and used by several international retailers. For example,
Minute Man Company, uses GIS for products delivery at the USA. It uses GIS and Global Position
Systems (GPS) to point out the location of delivery customers, select the most appropriate vehicle type
located closest to the collection point and provides a displayed map to driver showing the most efficient
path to delivery of pick up point (Grimshaw, 2000). Accordingly GIS is used to point out the location of
delivery customers, select the most appropriate vehicle type located closest to the collection point and
provides a display map to driver showing the most efficient path to delivery of pickup points (ibid), A
second example is found in the application of Maps Guide software which is used in Germany to calculate
optimum routes on defined rules. In addition, the Auto route software is used in the UK for defining routes
between many retail locations (Dibb and Simkin, 1991).
Miracle supermarket in Ontario, Canada has used GIS software for assessment of new sites, and the
processing of customer survey for existing stores. In this example, trade areas were defined based on
distances from existing stores (ibid).
Based on the above discussion, GIS is considered as very useful technology in many retail applications.
There are several studies that have discussed the advantages of using GIS in retail planning. For example,
Murad (2003), and Murad (2009), has pointed that GIS functions such as Buffer and Thiessen can be used
in retail planning field for catchment area definition. Birkin et al (2002), have presented the use of GIS for
sales territory planning. In this example, GIS is used to identify business potentials for each postal sector at
the UK, and then individual territories are created that include areas of 2000 business within a 15-minute
drive time. Another GIS application is found in the study of identifying potential sites of discount stores
across the UK. Using the average number of socio-economic group D and E households (the lowest socio-
economic categories in the UK census), a potential demand map is created which shows the number of

postal sectors that have 500 or more D and E households within 5 minutes drive time of their centroids
(ibid). Maatta-Juntunen et al (2010), have discussed a GIS application for measuring retail location
accessibility in Finland and utilize GIS tools to assess store locations in terms of CO2 emissions from
private cars used for consumer traffic. Birkin et al (1996), have used GIS to study changes in market
penetrations for a new retail store and showed how GIS is used to find out the opportunities for locating
new store at the South coast of England at the town of Hastings. This example indicates that the analysis of
market penetration is one of the main retail analysis that can be made using GIS. Murad (2003) have
presented similar GIS application that calculates market penetration for two retail centers at Jeddah - Saudi
Arabia. The results of such study indicate that there are areas of good and poor performance and pointed
that shopping developers can use those results to try to attract more customers from areas with low
performance.
The use of GIS in modeling demand flows to retail location is another very important retail issue. Here,
GIS is used together with spatial interaction models to calculate the interaction between retail location and
residential areas. The interaction results are ruled by the size of demand, the attractiveness of retail
location and the cost of travel between location j and area i. This approach is used by several studies (e.g.
Suarez-Vaga et al, 2010, Murad, 2003, Birkin et al, 1996, Clarke & Clarke, 2001, and Bullas & Clarke
2000).
In a summary, It can be said that GIS is applied at several retail studies and these studies varies from
defining retail territories and analyzing market penetrations up to modeling the flows of the retail demand.
This paper will discuss how to use GIS for retail location assessment in Jeddah city, Saudi Arabia.
2. BACKGROUND
GIS technology is appropriate for a variety of usages including resource management, land surveying, and
business planning. Businesses use GIS technology to solve problems, find solutions for marketing,
delivering better services, and making good decisions. In addition, GIS technology has been implemented
in service management for displaying large volumes of diverse data pertinent to various local and regional
planning activities (Chen, 2007).
GIS is considered as a useful tool for retailers because it can help them in understanding their market,
customers and competitors. This can be achieved through the analysis of market data such as sales data,
demographics and competitors locations, census boundaries and sales territories. The main feature of GIS
making it important for retail planners is related to its ability of providing answers to several retail location
questions including: (a) evaluating the existing retail branch performance, (b) assessing the returns from an
increase/decrease in store size, (c) presenting the best set of locations to target overseas market, (d)
launching new product locations most likely to maximize sales, (e) finding the best geographical fit for
possible retail margin, (f) optimizing the branch network of two or more retail organizations following
merger/acquisition, (g) finding the spatial impacts of store closures or relocations, and (h) finding optimum
store territories (Birkin et al, 2002).
A retailer can develop a map of its store using GIS software to calculate the actual Dimensions of a store.
This can even handle multilevel stores and shelf depths. When a retailer has the store mapped, a consumer
can view the map on a live website, and know the exact location of the item within the store. GIS might
allow planners to create maps for specific use, while another GIS might be able to determine the size of
wetlands necessary to be protected against damages and pollution from new district development (Cheng
and Ling Yu, 2007). The diffusion of GIS in retail organizations can be traced to a number of factors
relating to supply and demand of retail services. The demand factors include location of retail stores and
maximizing profitability. Meanwhile, the supply factors are related to location of competitors and the
visualization of consumer behavior. GIS are used by the vast majority of major retail chains across North
America and Europe to provide decision support for a range of location-based decisions. The most
common retail GIS applications include customer spotting, trade area analysis (e.g., demographic reporting
for given trade areas), customer profiling, competitor analysis, hot-spotting, sales forecasting and
consumer behaviour modeling. These can be applied to a number of decision events, from relatively low-
risk store openings, renovations and merchandising decisions to major high-risk decisions, such as,
corporate acquisition of competing chains or international expansion through merger activities (Hernandez,
2007). GIS could also be used to identify specific developmental sites based on a set of criteria using
economic, social, environmental, and business-related data. In addition, GIS could be used to identify
specific developmental sites based on a set of criteria using economic, social, environmental, and business-
related data.
The simplest GIS tool that can be used at every retail GIS application is related to displaying and querying
spatial and attribute data. For example, ArcGIS software has several functions that can be used for data

query and display. This software can display attributes in relation to points, lines or polygons, otherwise
known as thematic mapping (Grimshaw, 2000). Retailers can use thematic mapping technique to present
any collection of tabular data such as the size population within 30-min drive-time from a selected retail
centre. Data query tools in GIS can be applied on a single attribute field such as the number of retail
customers, or on a multiple attribute data field such as retail demand and retail supply. A number of
studies have used GIS in order to examine spatial inequalities of services using accessibility measures (e.g.,
Langford, 2007, McLafferty & Grady, 2004; Phillips et al, 2000; Rushton, 1999). Such measures typically
involve counting the number of services contained within census tract boundaries (e.g., Lin, 2004), or
reporting the number of facilities inside a given Euclidean or travel-time distance of demand points.
Previous techniques for measuring accessibility to retailing can be categorized by two primary approaches
(Song and Sohn, 2007). The first approach calculates the distances from the housing unit to the relevant
Central Business District (CBD), regional employment and commercial centers, or the nearest commercial
store. The second approach measures accessibility as a function of the percentage of commercial land uses
within each residential neighborhood. In this method, neighborhoods are defined by census tracts or
blockgroup boundaries (ibid). GIS can be used for measuring accessibility to these two approaches. For
example, Vandenbulcke et al (2009), focuses on the measurement of accessibility and limits the
application to car accessibility and its spatial variation within Belgium and discussed two types of
destinations (cities and railway stations) as well as two types of time periods (peak and off-peak).
3. METHODOLOGY
The purpose of the presented paper is to discuss a GIS application for retail centers at Jeddah city, Saudi
Arabia. The created application covers macro and micro scale retail planning issues. In order to build this
application, several data sets were captured and built using ArcGIS software. These are as following:
a- Points data One of the prime objectives of this application is to define retail market based on real
demand locations. Accordingly, a survey was made on a sample of 500 retail customers which aimed at
defining the spatial distribution of selected retail customers. Their locations were converted in the GIS as
point features with a city district resolution. In addition, the exact location of retail centers are modeled in
the GIS as points features.
b- Polygon and line data. In addition to making point features, the present application created polygon
features showing city district boundaries as well as line features showing city road network. These two
basic GIS features were used with point data to define and model the market area of retail centers at
Jeddah city. For each of these features the relevant attributes were linked at the feature attribute table.
4. THE CITY SCALE ANALYSIS OUTPUTS
4.1 Classification of retail centers
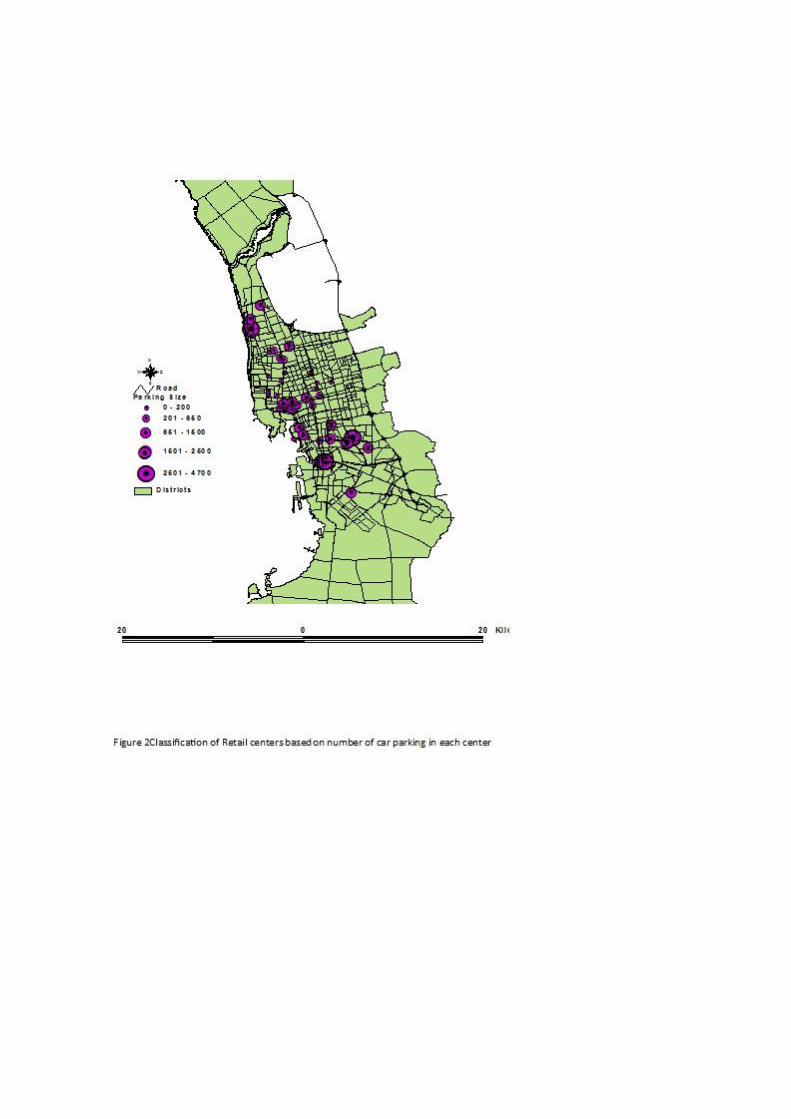
In order to evaluate the location of retail centers in Jeddah city, GIS simple and advanced functions were
used for defining the spatial distribution of retail centers and for defining the growth direction of retail
centers in Jeddah city. Retail centers in Jeddah city can by classified based on different attribute data such
as center name, land area, GLA, and parking size. These data were collected and saved in the geo-database
and can be used for identifying the characteristics of retail centers in Jeddah city. Using the graduated
symbol function of ArcGIS software, retail centers in Jeddah city were classified and the results of this
type of analysis are shown in figures1 and 2. Looking at these figures retail planners can easily identify the
location of large or small centers. Drawing quantities by graduated symbols is considered as an effective
way to visually present a numeric attribute. This method is suitable for numeric data that represents a rank
or progression of values. It draws larger symbols first and smaller symbols afterward. This is so that
features with large values do not obscure features with smaller values. The graduated symbols method is
used to map discrete locations or lines. Accordingly, graduated point symbols are drawn as the locations of
individual features to show the magnitude of the data value. The presented study has applies the graduated
symbol tool on the collected data and as a result of this function (figure 3) retail planners can easily
identify the location of large or small retail centers in Jeddah city (eg. Red sea mall is one the large centers
located north of the city with 500 retail shops, meanwhile, Sylaimania center is a small center located in
the city center with 86 shops). Based on the results of this function, retail centers are classified at three
groups called small centers (has less than 100 shops), medium centers (has 100-200 shops) and large
centers ( has more than 200 shops). This type of GIS classification tool can also be used with multiple
attributes such as comparing retail center size with car parking area. This type of comparison can identify
retail centers that has large amount of shops but not providing enough car parking area for retail demand.
4.2 Measuring orientation and direction of retail location
Measuring orientation and direction of retail centers help retail planners in abstracting the spatial trends in
the distribution of retail centers. GIS spatial statistic functions can be used to measure whether-and to what
extent- the distribution of features crates a pattern. The resulted direction of pattern can be used for several
purposes. For example; one can calculate the degree to which student test scores in a city are clustered.
Another example is found in the application of regional transportation network where planners need to
identify the direction of manufacturing, retail and financial activities. In another example retail planner
might want to use this function to see whether different types of businesses such as financial and
manufacturing have similar trends or corridors in the city.
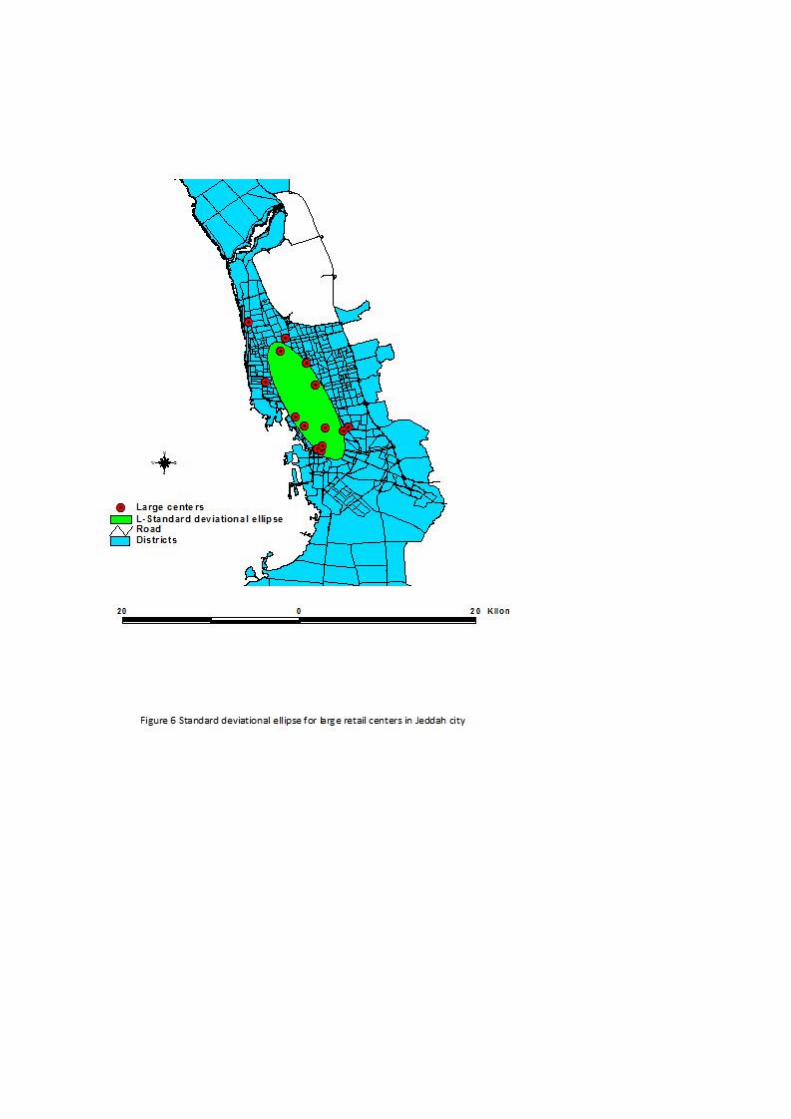
GIS spatial statistic tools can define the direction and orientation of points, polygons and lines features.
For the presented application, points features showing retail centers location are selected and used within
ArcGIS spatial statistical tools to define the orientation of retail centers in Jeddah city. The result of this
type of analysis is presented in the form of an ellipse shape. It is produced by calculating standard distance
in the x and y directions and by defining the axes of an ellipse encompassing the distribution of features.
The ellipse is referred to as the standard deviation ellipse which allows the analyst to see if the distribution
of features is elongated and hence has a particular orientation (ibid).
The standard deviation ellipse measures the standard deviation of the features from the mean center
separately for the x-coordinates and the y-coordinates. The length of the ellipse axes are calculated in the
east-west (x- axis) and north-south (y-axis) directions in distance unites (meters). Since the standard
deviation is measured in each direction from the mean center, the total length of each axis is twice its
standard deviation (ibid).
The presented study has calculated the standard deviation ellipse for every retail center group (large,
medium and small). The resulted ellipse for every retail center group is shown in figures 4-6. Based on this
result retail planner can easily identify the pattern and trends of all retail centers in Jeddah city. It is clear
that orientation of retail growth in Jeddah city is toward the northern city districts and accordingly, any
future retail development should follow this direction for the purpose of attracting large retail demand.
Alshatee and Almohamdia are two districts located north of the city are considered to be the potential
location for any future retail development in Jeddah city.
5. THE RETAIL CENTER MARKET AREA ANALYSIS OUTPUTS
5.1 Market area definition
Looking at the various types of GIS-based market area definition techniques, the presented paper has
selected the simple ring method and then added to it a location of retail demand. Accordingly, the first step
to produce this output was to plot and map the locations of retail customers that were interviewed in the
course of this study. One of the useful GIS functions to be used for this purpose is known as Address
Geocoding. It refers to the process of creating map features from addresses, place names, or similar
information (Ormsby et al, 2004). In order to use this function, ArcGIS software requires that the user
should have an address table containing a list of addresses stored as a data-base table or a text file as well
as a set of reference data such as streets on which the addresses can be located. Using city-district shape
file as a reference data and address table of retail customers, our application produced point features
describing the spatial distribution of retail customers in Jeddah city (Fig.7).
This output shows the dissemination of the market area of the selected center. It is evident that there are
some parts of the city (Al Bawadi, Al-Rabwah, and Al-Salamah) which produce remarkable retail
customers to this center. These areas are actually falling within the 5-km ring defined around the selected
center (Fig. 8). This output forms the primary market area of Al Hijaz Center and can be used by retail
developers to define the parts of the city providing a larger amount of customers to this center. These parts
should always be monitored and evaluated by retailers to make sure that these already attracted customers
are regularly visiting this center.
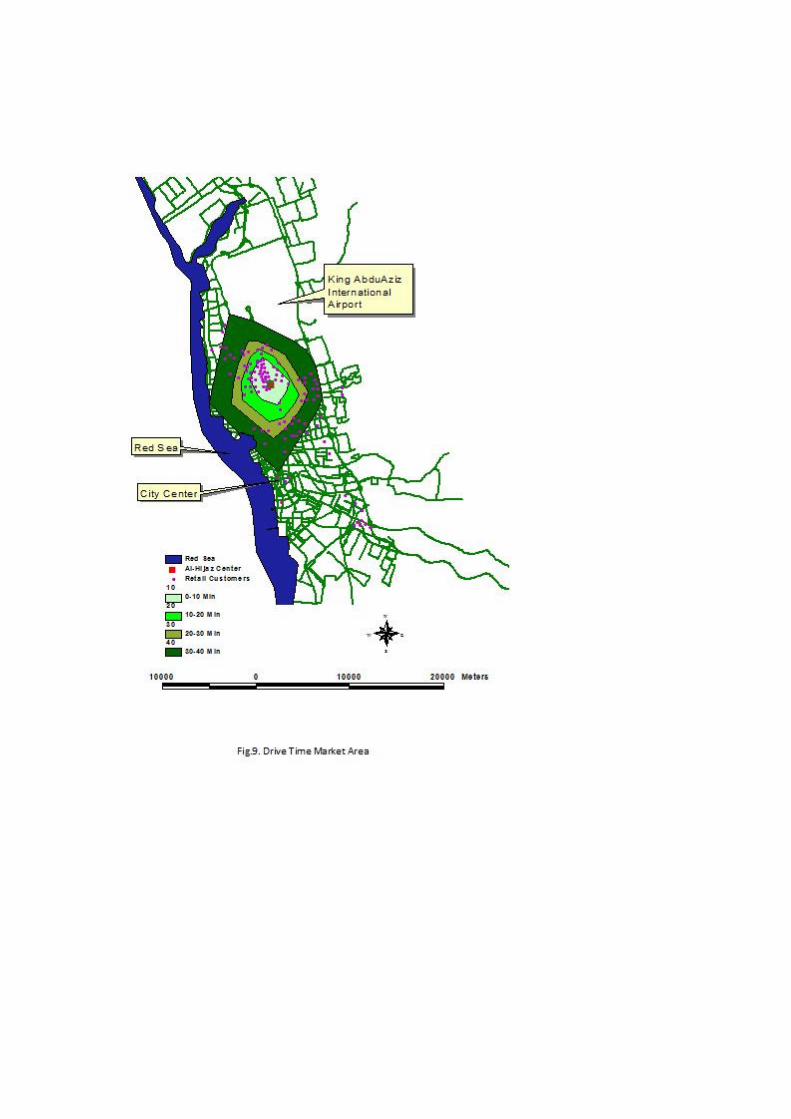
5.2 Market area analysis
This part of the paper discusses how GIS can be applied to meet the objective of expanding the existing
retail market. There are several GIS-based techniques to be used by retailers for preparing policies in this
respect. One of them is based on drive-time analysis demonstrated by the present application. ArcGIS
software is applied to create market areas based on drive-time bands. In order to make these drive bands
(0-10, 10-20, 20-30, and 30-40 min.), data about road speed were captured into the road network attribute
table and used to produce these drive time-based market areas. Customer locations’ data were overlaid
with the resulted drive-time bands to analyze these locations according to their nearness to the chosen
center (Fig. 9). A key finding of this analysis is that there are different amounts of customers visiting Al-
Hijaz center according to the drive-time bands. In order to classify these customers, GIS overlay functions

are used to subdivide each customer location according to its localization within the drive-time band. This
type of GIS functions is defined as the process of comparing spatial features in two or more map layers
(Grimshaw, 2000). GIS applied the input coverage and the overlay one to produce output coverage based
on selected logic Boolean functions which can be used by different applications. They are the following:
intersect, not intersect, union, all but A or B, union levels, and A not B (Davis, 1996). This part of the
application deals with the intersect function demonstrating only the portion of the input coverage that falls
inside the intersect one. Here an input coverage is the location of all the retail customers and an intersect
coverage is the resulted drive-time band pattern. If the input coverage is a point one, as in our case, the
intersect function will result in an output coverage of point feature, too (Chou, 1997). This output is useful
for retail planners as it defines the extent of the retail market. Besides it can be applied to advise retail
managers concerning the locations where no desired size of customers is produced, and, accordingly, to
focus on these locations and try to expand the already existing retail market to cover such less attracted
areas. For this retail center, city districts such as Al-Mohamadia, Al-Aziziayah, Al-Safa, and Al-Andalus
are located within the less attracted bands. Therefore, retail managers should approach these districts more
closely and introduce their center goods and services to people living in such areas so that they could be
more attracted to this center.
The results of the created GIS application are considered as valuable tools for increasing the efficiency of
retail center management and for evaluating the performance dynamics of retail center. The created
application can be used by any retail center managers in Jeddah city for evaluating retail market and for
identifying market segments that the retail center is under-serving. Large retail centers in Jeddah city such
as Al-Tahlya mall or Hera center can apply the same created GIS models to evaluate their existing market
sizes and to improve their performances.
6. CONCLUSION
GIS is considered as useful and important analytical tool in many retail planning applications such as
market penetration, business forecast, consumer behavior/profile tracking and prediction. The current
paper presents a GIS application for defining the spatial distribution of retail centers in Jeddah city. The
application classify retail centers based on shopping sizes and produce three types of retail centers named
as large, medium and small centers. For each of these three centers types, GIS spatial statistics are
calculated. In addition, This paper discusses how GIS could be implemented as a tool for defining and
analyzing the retail market of Al-Hijaz Center in Jeddah city based on customer location. Finally, a market
area investigation has been performed based on GIS drive-time analysis technique and by using GIS
overlay analysis function. This methodology could help retail planners in defining both strongly and less
attracted parts of Jeddah city.
REFERENCES
Birkin, M., Clarke, G. and Clarke, M. (2002) Retail Geography & Intelligent Network Planning, Wiley,
Chichester.
Birkin, M., Clarke, G., Clarke, M., Wilson, A., (1996) Intelligent GIS, Geoinformation International,
Cambridge.
Bullas, D., Clarke, G., (2000) ‘GIS and microsimulation for local labor market analysis’ Computers.
Environ. Urban Syst. Vol. 24, No.4, pp. 305–331.
Chen, R, (2007) ‘Geographic information systems (GIS) applications in retail tourism and teaching
curriculum’ Journal of Retailing and Consumer Services, Vol. 14, pp. 289–295.
Cheng, E, and Ling Yu, H, (2007) ‘ A GIS approach to shopping mall location selection Building and
Environment’ Vol. 42, pp. 884–892.
Clarke G. and Clarke M., (2001) ‘Applied spatial interaction modeling’ in G.P. Clarke, and M. Madden
(Eds) Regional Science in Business, Springer, Berlin.
Dibb, S., Simkin, J., (1991) Targeting, segments and positioning. , Int. J. Retail Distrib. Manag. Vol.19,
No.3, pp. 4–10
ESRI, (2009) ArcGIS® 9.3 Geocoding Technology, ESRI, Redlands.
Grimshaw D., (2000) Bringing Geographical Information Systems into Business, Wiley, New York.
Ganesh, K, and Narendran, T.T, (2005) ‘CLOSE: a heuristic to solve a precedence-constrained travelling
salesman problem with delivery and pickup’ International Journal of Services and Operations Management
2005 - Vol. 1, No.4 pp. 320 - 343.
Hernandez, T, ( 2007) ‘Enhancing retail location decision support: The development and application of
geovisualization’, Journal of Retailing and Consumer Services, Vol. 14, pp. 249–258.
Langford, M. (2007). Rapid facilitation of dasymetric-based population interpolation by means of raster
pixel maps. Computers Environment and Urban Systems, Vol. 31, pp. 19–32.
Lin, S. J. (2004). Access to community pharmacies by the elderly in Illinois: A geographic information
systems analysis. Journal of Medical Systems, Vol.28, No.3, pp. 301–309.
McEntee, J and Agyeman, J ( 2010) ‘Towards the development of a GIS method for identifying rural food
deserts: Geographic access in Vermont, USA’ Applied Geography, Vol. 30, pp. 165–176.
McLafferty, S. L., & Grady, S. (2004). Prenatal care need and access: A GIS analysis. Journal of Medical
Systems, Vol. 28, No.3, pp. 321–333.
Maatta-Juntunen, H, Antikainen, H, Ossi , K, and Rusanen, J, (2010) ‘Using GIS tools to estimate CO2
emissions related to the accessibility of large retail stores in the Oulu region, Finland’ Journal of Transport
Geography, In-Press
Mitchell, A. (2005) The ESRI Guide to GIS Analysis Volume 2: Spatial measurements & Statistics, ESRI,
Redlands.
Murad, A, (2009) ‘Using Customers Data for Defining Retail Market Size: A GIS Approach’ International
Journal of Business Information Systems, Vol. 4,No. 3, pp. 340-359.
Murad, A, (2007) ‘Using GIS for Retail Planning in Jeddah City’ American Journal of Applied Sciences
Vol. 4 No.1, pp. 821-827.
Murad, A. (2003) ‘Creating a GIS application for retail centers in Jeddah City’, International Journal of
Applied Earth Observation and Geoinformation, Vol. 4, No. 4, pp.329–338.
Phillips, R. L., Kinman, E. L., & Lindbloom, E. J. (2000). Using Geographic Information Systems to
Understand Health Care Access. Archives Family Medicine, Vol. 9, pp. 971–978.
Olson, D, Chae, B, and Sheu, C (2005) ‘ Issues in multinational ERP implementation’ Int. J. of Services
and Operations Management 2005 - Vol. 1, No.1 pp. 7 - 21.
Razmi, J, Zairi,M, and Gunasekaran,A, (2006) The application of analytical hierarchy process in
classification of material planning and control systems, Int. J. of Services and Operations Management
2006 - Vol. 2, No.4 pp. 352 - 366.
Rushton, G. (1999). Methods to evaluate geographic access to health services. Journal of Public Health
Management and Practice, Vol.5, No.2, pp. 93–100.
Song, Y, and Sohn, J, ( 2007) ‘Valuing spatial accessibility to retailing: A case study of the single family
housing market in Hillsboro, Oregon’ Journal of Retailing and Consumer Services, Vol. 14, pp. 279–288.
Spilkova, J, and Sefrna, L (2010) ‘Uncoordinated new retail development and its impact on land use and
soils: A pilot study on the urban fringe of Prague, Czech Republic’ Landscape and Urban Planning 94
(2010) 141–148.
Suarez-Vega, R, Santos-Penate, D, Dorta-Gonzalez, P, and Rodriguez-Diaz, M, (2010) ‘A multi-criteria
GIS based procedure to solve a network competitive location problem’ Applied Geography, In-Press
Zeiler, M. (1999) Modeling our World: The ESRI Guide to Geodatabase Design, ESRI, Redlands.
Vandenbulcke, G, Steenberghen, T, and. Thomas, I (2009) Mapping accessibility in Belgium: a tool for
land-use and transport planning?, Journal of Transport Geography Vol. 17, pp. 39–53.