cnn orc nevada poll 2-17-16
TRANSCRIPT

8/20/2019 Cnn Orc Nevada Poll 2-17-16
http://slidepdf.com/reader/full/cnn-orc-nevada-poll-2-17-16 1/45
Nevada
Interviews with 1,006 adult Nevadans conducted by telephone by ORC
International on February 10 - 15, 2016. The margin of sampling error for
results based on the total sample is plus or minus 3 percentage points.
The sample also includes 245 who were likely to participate in the
Republican presidential caucus and 282 who were likely to participate in
the Democratic presidential caucus.
This sample includes 606 interviews among landline respondents and 400
interviews among cell phone respondents.
EMBARGOED FOR RELEASE:
Wednesday, February 17 at 6:00 a.m.
8/20/2019 Cnn Orc Nevada Poll 2-17-16
http://slidepdf.com/reader/full/cnn-orc-nevada-poll-2-17-16 2/45
3
POLL -2- February 10-15, 2016
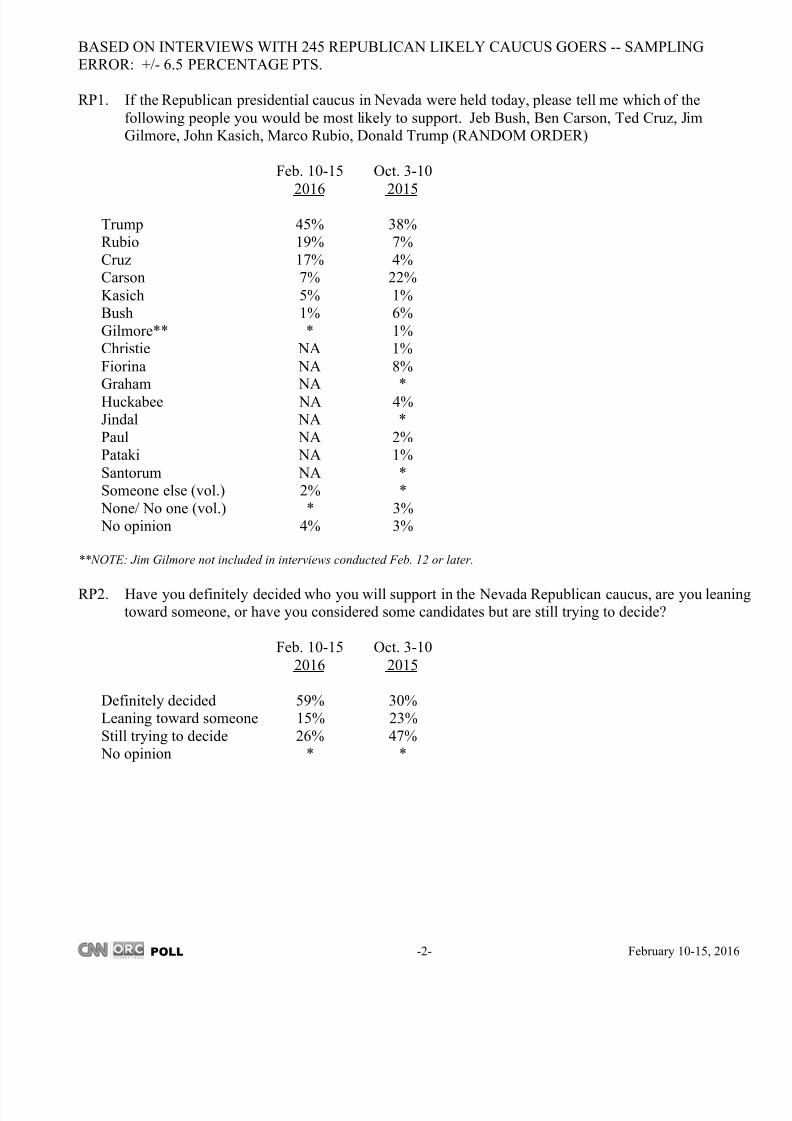
BASED ON INTERVIEWS WITH 245 REPUBLICAN LIKELY CAUCUS GOERS -- SAMPLINGERROR: +/- 6.5 PERCENTAGE PTS.
RP1. If the Republican presidential caucus in Nevada were held today, please tell me which of the
following people you would be most likely to support. Jeb Bush, Ben Carson, Ted Cruz, JimGilmore, John Kasich, Marco Rubio, Donald Trump (RANDOM ORDER)
Feb. 10-15 Oct. 3-10
2016 2015
Trump 45% 38%Rubio 19% 7%
Cruz 17% 4%Carson 7% 22%
Kasich 5% 1%Bush 1% 6%
Gilmore** * 1%Christie NA 1%
Fiorina NA 8%Graham NA *
Huckabee NA 4%Jindal NA *
Paul NA 2%Pataki NA 1%
Santorum NA *Someone else (vol.) 2% *
None/ No one (vol.) * 3% No opinion 4% 3%
**NOTE: Jim Gilmore not included in interviews conducted Feb. 12 or later.
RP2. Have you definitely decided who you will support in the Nevada Republican caucus, are you leaningtoward someone, or have you considered some candidates but are still trying to decide?
Feb. 10-15 Oct. 3-10
2016 2015
Definitely decided 59% 30%Leaning toward someone 15% 23%
Still trying to decide 26% 47% No opinion * *

8/20/2019 Cnn Orc Nevada Poll 2-17-16
http://slidepdf.com/reader/full/cnn-orc-nevada-poll-2-17-16 3/45
3
POLL -3- February 10-15, 2016
RP3. Now I'm going to mention a few issues and for each one, please tell me which Republican candidateyou think would best handle that issue if he or she were elected president. Please feel free to name a
candidate even if you may not be voting for that person. Which Republican candidate do you thinkwould do the best job handling: (RANDOM ORDER)
The economy
Feb. 10-15 Oct. 3-10
2016 2015
Trump 61% 67%Cruz 14% 2%
Rubio 11% 4%Kasich 5% 2%
Carson 4% 6%Bush 3% 6%
Gilmore** * *Christie NA 1%
Fiorina NA 7%Graham NA 1%
Huckabee NA 1%
Jindal NA *Paul NA 3%Pataki NA *
Santorum NA *Someone else (vol.) 1% *
None/No one (vol.) * * No opinion 1% 1%
Illegal immigration
Feb. 10-15 Oct. 3-10
2016 2015
Trump 58% 55%Cruz 17% 6%
Rubio 14% 13%Bush 3% 5%
Kasich 3% *Carson 2% 8%
Gilmore** * *Christie NA *
Fiorina NA 3%Graham NA 1%
Huckabee NA 3%Jindal NA *
Paul NA 2%Pataki NA *
Santorum NA *Someone else (vol.) * 1%
None/No one (vol.) 1% 1% No opinion 2% 3%
**NOTE: Jim Gilmore not included in interviews conducted Feb. 12 or later.

8/20/2019 Cnn Orc Nevada Poll 2-17-16
http://slidepdf.com/reader/full/cnn-orc-nevada-poll-2-17-16 4/45
3
POLL -4- February 10-15, 2016
RP3. Now I'm going to mention a few issues and for each one, please tell me which Republican candidateyou think would best handle that issue if he or she were elected president. Please feel free to name a
candidate even if you may not be voting for that person. Which Republican candidate do you thinkwould do the best job handling: (RANDOM ORDER)
Foreign policy
Feb. 10-15 Oct. 3-10
2016 2015
Trump 42% 34%Cruz 20% 6%Rubio 17% 13%
Bush 7% 12%Kasich 5% *
Carson 3% 11%Gilmore** * *
Christie NA 2%Fiorina NA 7%
Graham NA 2%Huckabee NA 3%
Jindal NA *Paul NA 5%
Pataki NA *Santorum NA 1%
Someone else (vol.) 2% 1% None/No one (vol.) * 1%
No opinion 4% 2%
Social issues, such as abortion and same-sex marriage
Feb. 10-15 Oct. 3-10
2016 2015
Trump 28% 25%Cruz 21% 4%
Rubio 20% 7%Carson 12% 23%
Kasich 6% 1%Bush 3% 8%
Gilmore** * *Christie NA 1%
Fiorina NA 9%Graham NA 1%
Huckabee NA 5%Jindal NA 1%
Paul NA 4%Pataki NA *
Santorum NA *Someone else (vol.) 2% 2%
None/No one (vol.) 3% 2% No opinion 6% 6%
**NOTE: Jim Gilmore not included in interviews conducted Feb. 12 or later.

8/20/2019 Cnn Orc Nevada Poll 2-17-16
http://slidepdf.com/reader/full/cnn-orc-nevada-poll-2-17-16 5/45
3
POLL -5- February 10-15, 2016
RP3. Now I'm going to mention a few issues and for each one, please tell me which Republican candidate
you think would best handle that issue if he or she were elected president. Please feel free to name acandidate even if you may not be voting for that person. Which Republican candidate do you think
would do the best job handling: (RANDOM ORDER)
ISIS
Feb. 10-15 Oct. 3-10
2016 2015Trump 55% 46%Cruz 16% 5%
Rubio 13% 13%Bush 6% 10%
Kasich 5% *Carson 2% 6%
Gilmore** * *Christie NA 2%
Fiorina NA 5%Graham NA 3%
Huckabee NA 2%Jindal NA *
Pataki NA *Paul NA 4%
Santorum NA 1%Someone else (vol.) * *
None/No one (vol.) * 2% No opinion 3% 1%
**NOTE: Jim Gilmore not included in interviews conducted Feb. 12 or later.

8/20/2019 Cnn Orc Nevada Poll 2-17-16
http://slidepdf.com/reader/full/cnn-orc-nevada-poll-2-17-16 6/45
3
POLL -6- February 10-15, 2016
RP4. Now I’m going to read you a few phrases which describe the candidates, and for each one, tell mewhich Republican candidate you think that phrase best describes, regardless of who you are voting
for. Which Republican candidate do you think: (RANDOM ORDER)
Best represents the values of Republicans like yourself
Feb. 10-15 Oct. 3-10
2016 2015
Trump 35% 34%Cruz 22% 10%Rubio 20% 9%
Carson 9% 19%Kasich 6% 1%
Bush 4% 7%Gilmore** * *
Christie NA 2%Fiorina NA 7%
Graham NA 1%Huckabee NA 4%
Jindal NA *Pataki NA *
Paul NA 4%Santorum NA *
Someone else (vol.) 2% * None/No one (vol.) 1% *
No opinion 2% 2%
Has the best chance of winning in the general election in November
Feb. 10-15 Oct. 3-10
2016 2015
Trump 56% 47%Rubio 18% 10%
Cruz 16% 5%Kasich 4% *
Carson 1% 16%Bush * 7%
Gilmore** * *Christie NA 1%
Fiorina NA 3%Graham NA *
Huckabee NA 2%Jindal NA 1%
Pataki NA *Paul NA 2%
Santorum NA *Someone else (vol.) * 1%
None/No one (vol.) * * No opinion 5% 4%
**NOTE: Jim Gilmore not included in interviews conducted Feb. 12 or later.

8/20/2019 Cnn Orc Nevada Poll 2-17-16
http://slidepdf.com/reader/full/cnn-orc-nevada-poll-2-17-16 7/45
3
POLL -7- February 10-15, 2016
RP4. Now I’m going to read you a few phrases which describe the candidates, and for each one, tell me
which Republican candidate you think that phrase best describes, regardless of who you are votingfor. Which Republican candidate do you think: (RANDOM ORDER)
Is most likely to change the way things work in Washington.
Feb. 10-15
2016
Trump 64%Cruz 13%
Rubio 9%Carson 5%
Kasich 2%Bush 1%
Gilmore** *Someone else (vol.) *
None/No one (vol.) 3% No opinion 2%
**NOTE: Jim Gilmore not included in interviews conducted Feb. 12 or later.

8/20/2019 Cnn Orc Nevada Poll 2-17-16
http://slidepdf.com/reader/full/cnn-orc-nevada-poll-2-17-16 8/45
3
POLL -8- February 10-15, 2016
BASED ON INTERVIEWS WITH 282 DEMOCRATIC LIKELY CAUCUS GOERS -- SAMPLINGERROR: +/- 6 PERCENTAGE PTS.
DM1. If the Democratic presidential caucus in Nevada were held today, please tell me which of the
following people you would be most likely to support. Hillary Clinton or Bernie Sanders.(RANDOM ORDER)
Feb. 10-15 Oct. 3-10
2016 2015
Clinton 48% 50%Sanders 47% 34%
Biden NA 12%Chafee NA *
Lessig NA *O'Malley NA *
Webb NA *Someone else (vol.) 1% *
None/No one (vol.) * 1% No opinion 5% 1%
DM2. Have you definitely decided who you will support in the Nevada Democratic caucus, are you leanintoward someone, or have you considered some candidates but are still trying to decide?
Feb. 10-15 Oct. 3-10
2016 2015
Definitely decided 62% 30%Leaning toward someone 13% 11%
Still trying to decide 25% 58% No opinion * *

8/20/2019 Cnn Orc Nevada Poll 2-17-16
http://slidepdf.com/reader/full/cnn-orc-nevada-poll-2-17-16 9/45
3
POLL -9- February 10-15, 2016
DM3. I’m going to mention a few issues and for each one, please tell me who you think would best handlethat issue if he or she were elected president. Please feel free to name a candidate even if you may
not be voting for that person. Which Democratic candidate do you think would do the best jobhandling: (RANDOM ORDER)
The economy
Feb. 10-15 Oct. 3-102016 2015
Clinton 48% 46%
Sanders 47% 31%Biden NA 15%
Webb NA 2%Chafee NA *
Lessig NA *O'Malley NA *
Someone else (vol.) 2% * None/No one (vol.) 1% 2%
No opinion 2% 3%
Health care
Feb. 10-15 Oct. 3-10
2016 2015
Clinton 55% 49%Sanders 39% 32%
Biden NA 10%Webb NA 3%
Chafee NA 1%Lessig NA *
O'Malley NA *Someone else (vol.) 1% *
None/No one (vol.) 2% 3% No opinion 3% 2%
Race relations
Feb. 10-15 Oct. 3-102016 2015
Clinton 58% 50%
Sanders 38% 27%Biden NA 17%
Chafee NA *Lessig NA *
O'Malley NA *Webb NA *
Someone else (vol.) 1% * None/No one (vol.) * 1%
No opinion 3% 5%

8/20/2019 Cnn Orc Nevada Poll 2-17-16
http://slidepdf.com/reader/full/cnn-orc-nevada-poll-2-17-16 10/45
POLL -10- February 10-15, 20163
DM3. I’m going to mention a few issues and for each one, please tell me who you think would best handlethat issue if he or she were elected president. Please feel free to name a candidate even if you may
not be voting for that person. Which Democratic candidate do you think would do the best jobhandling: (RANDOM ORDER)
Foreign policy
Feb. 10-15 Oct. 3-102016 2015
Clinton 68% 51%
Sanders 28% 13%Biden NA 21%
O'Malley NA 2%Chafee NA 1%
Webb NA 1%Lessig NA *
Someone else (vol.) 2% 1% None/No one (vol.) * 2%
No opinion 2% 7%
Immigration
Feb. 10-15
2016
Clinton 56%Sanders 37%
Someone else (vol.) 2% None/No one (vol.) 1%
No opinion 4%
8/20/2019 Cnn Orc Nevada Poll 2-17-16
http://slidepdf.com/reader/full/cnn-orc-nevada-poll-2-17-16 11/45
POLL -11- February 10-15, 20163
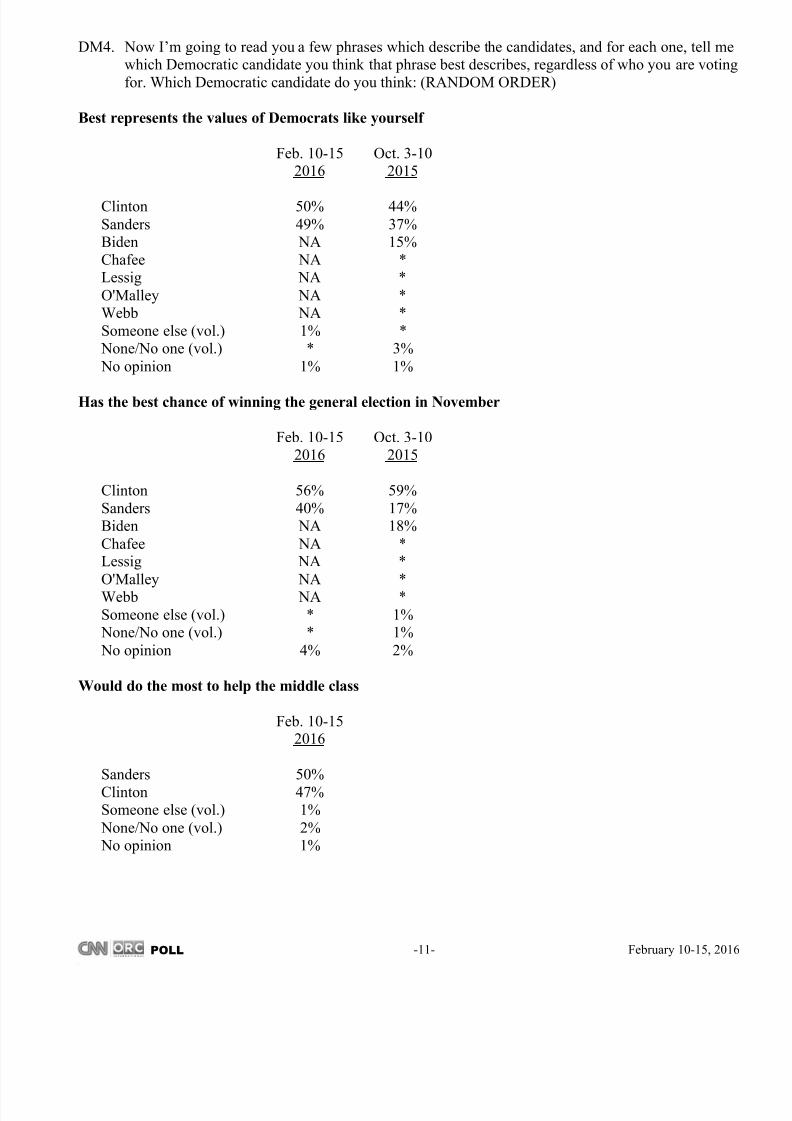
DM4. Now I’m going to read you a few phrases which describe the candidates, and for each one, tell mewhich Democratic candidate you think that phrase best describes, regardless of who you are voting
for. Which Democratic candidate do you think: (RANDOM ORDER)
Best represents the values of Democrats like yourself
Feb. 10-15 Oct. 3-102016 2015
Clinton 50% 44%
Sanders 49% 37%Biden NA 15%
Chafee NA *Lessig NA *
O'Malley NA *Webb NA *
Someone else (vol.) 1% * None/No one (vol.) * 3%
No opinion 1% 1%
Has the best chance of winning the general election in November
Feb. 10-15 Oct. 3-102016 2015
Clinton 56% 59%
Sanders 40% 17%Biden NA 18%
Chafee NA *Lessig NA *
O'Malley NA *Webb NA *
Someone else (vol.) * 1% None/No one (vol.) * 1%
No opinion 4% 2%
Would do the most to help the middle class
Feb. 10-152016
Sanders 50%
Clinton 47%Someone else (vol.) 1%
None/No one (vol.) 2% No opinion 1%

8/20/2019 Cnn Orc Nevada Poll 2-17-16
http://slidepdf.com/reader/full/cnn-orc-nevada-poll-2-17-16 12/45
POLL -12- February 10-15, 20163
5. Which of the following issues will be MOST important to you when you decide how to vote for president? (RANDOM ORDER)
BASED ON INTERVIEWS WITH 1,006 ADULT NEVADANS -- SAMPLING ERROR: +/- 3
PERCENTAGE PTS.
Feb. 10-15 Oct. 3-102016 2015
The economy 38% 39%Health care 15% 13%Terrorism 13% 11%
Illegal immigration 12% 11%Foreign policy 8% 7%
Social issues, such as abortionand same-sex marriage 7% 13%
Other (vol.) 4% 3% No opinion 3% 3%
BASED ON INTERVIEWS WITH 245 REPUBLICAN LIKELY CAUCUS GOERS -- SAMPLING
ERROR: +/- 6.5 PERCENTAGE PTS.
Feb. 10-15 Oct. 3-102016 2015
The economy 39% 39%
Illegal immigration 20% 14%Terrorism 20% 22%
Foreign policy 8% 12%Health care 6% 3%
Social issues, such as abortion
and same-sex marriage 3% 8%Other (vol.) 2% 1% No opinion 1% 1%
BASED ON INTERVIEWS WITH 282 DEMOCRATIC LIKELY CAUCUS GOERS -- SAMPLINGERROR: +/- 6 PERCENTAGE PTS.
Feb. 10-15 Oct. 3-10
2016 2015
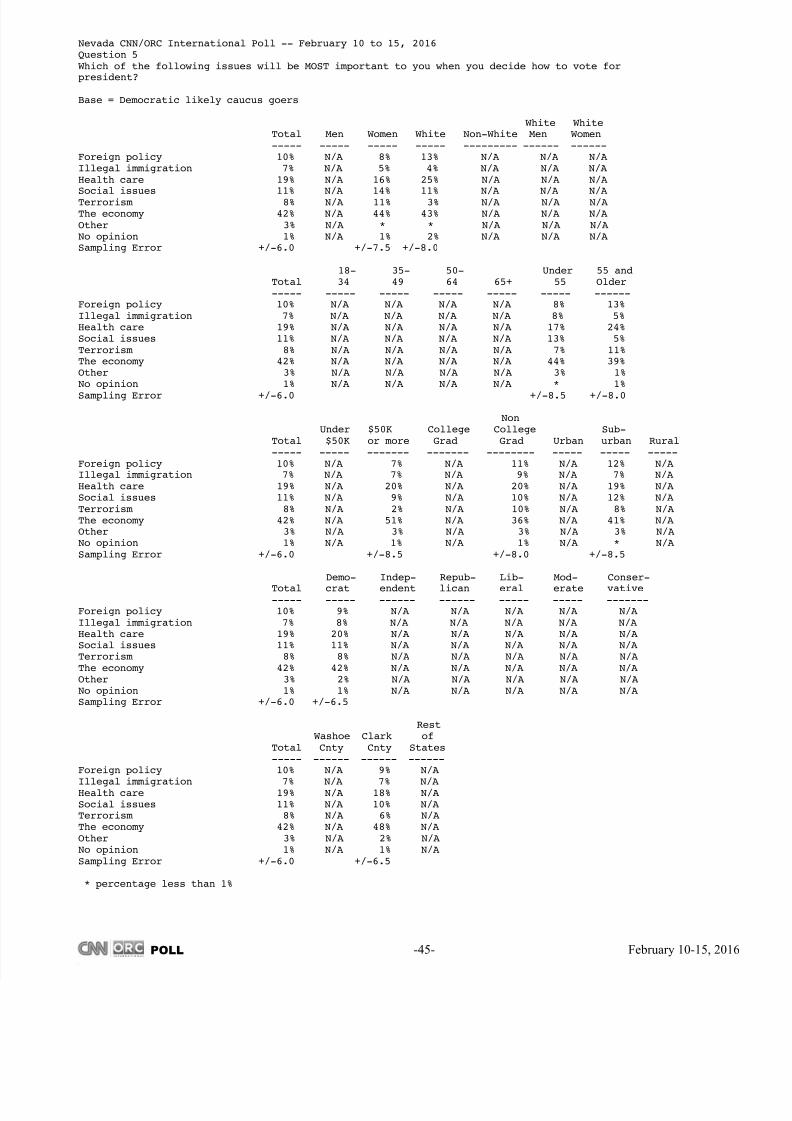
The economy 42% 45%Health care 19% 16%
Social issues, such as abortionand same-sex marriage 11% 16%
Foreign policy 10% 5%Terrorism 8% 5%
Illegal immigration 7% 8%Other (vol.) 3% 2%
No opinion 1% 2%
8/20/2019 Cnn Orc Nevada Poll 2-17-16
http://slidepdf.com/reader/full/cnn-orc-nevada-poll-2-17-16 13/45
POLL -13- February 10-15, 20163
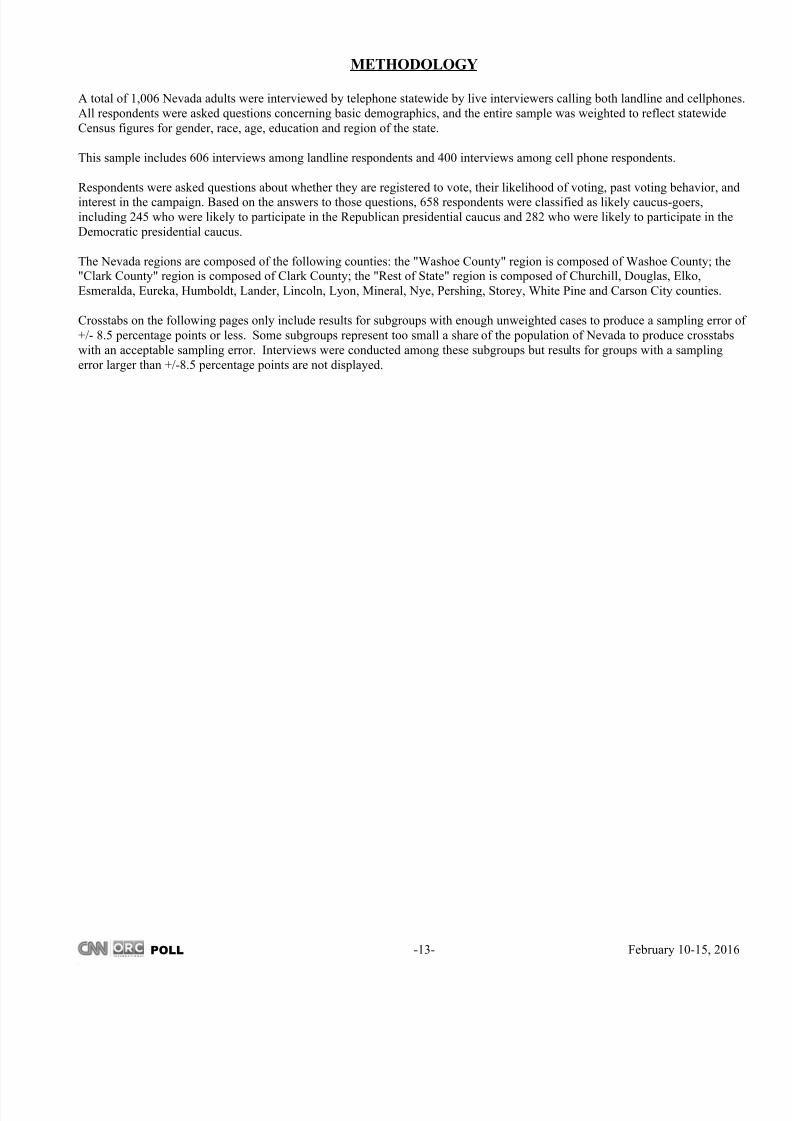
METHODOLOGY
A total of 1,006 Nevada adults were interviewed by telephone statewide by live interviewers calling both landline and cellphones
All respondents were asked questions concerning basic demographics, and the entire sample was weighted to reflect statewide
Census figures for gender, race, age, education and region of the state.
This sample includes 606 interviews among landline respondents and 400 interviews among cell phone respondents.
Respondents were asked questions about whether they are registered to vote, their likelihood of voting, past voting behavior, and
interest in the campaign. Based on the answers to those questions, 658 respondents were classified as likely caucus-goers,
including 245 who were likely to participate in the Republican presidential caucus and 282 who were likely to participate in the
Democratic presidential caucus.
The Nevada regions are composed of the following counties: the "Washoe County" region is composed of Washoe County; the"Clark County" region is composed of Clark County; the "Rest of State" region is composed of Churchill, Douglas, Elko,
Esmeralda, Eureka, Humboldt, Lander, Lincoln, Lyon, Mineral, Nye, Pershing, Storey, White Pine and Carson City counties.
Crosstabs on the following pages only include results for subgroups with enough unweighted cases to produce a sampling error o
+/- 8.5 percentage points or less. Some subgroups represent too small a share of the population of Nevada to produce crosstabs
with an acceptable sampling error. Interviews were conducted among these subgroups but results for groups with a sampling
error larger than +/-8.5 percentage points are not displayed.

8/20/2019 Cnn Orc Nevada Poll 2-17-16
http://slidepdf.com/reader/full/cnn-orc-nevada-poll-2-17-16 14/45
POLL -14- February 10-15, 20163
Nevada CNN/ORC International Poll -- February 10 to 15, 2016Question RP1If the Republican presidential caucus in Nevada were held today,please tell me which of the following people you would be most likely to support.
Base = Republican likely caucus goers
White WhiteTotal Men Women White Non-White Men Women----- ----- ----- ----- --------- ------ ------
Jeb Bush 1% 2% N/A 1% N/A N/A N/ABen Carson 7% 6% N/A 7% N/A N/A N/ATed Cruz 17% 20% N/A 15% N/A N/A N/AJim Gilmore * * N/A * N/A N/A N/AJohn Kasich 5% 5% N/A 3% N/A N/A N/AMarco Rubio 19% 17% N/A 23% N/A N/A N/ADonald Trump 45% 47% N/A 47% N/A N/A N/ASomeone else 2% * N/A 1% N/A N/A N/ANone/No one * * N/A * N/A N/A N/ANo opinion 4% 3% N/A 4% N/A N/A N/ASampling Error +/-6.5 +/-8.5 +/-7.0
18- 35- 50- Under 55 andTotal 34 49 64 65+ 55 Older----- ----- ----- ----- ----- ----- ------
Jeb Bush 1% N/A N/A N/A N/A N/A 1%Ben Carson 7% N/A N/A N/A N/A N/A 8%Ted Cruz 17% N/A N/A N/A N/A N/A 16%Jim Gilmore * N/A N/A N/A N/A N/A *John Kasich 5% N/A N/A N/A N/A N/A 4%Marco Rubio 19% N/A N/A N/A N/A N/A 19%
Donald Trump 45% N/A N/A N/A N/A N/A 46%Someone else 2% N/A N/A N/A N/A N/A *None/No one * N/A N/A N/A N/A N/A *No opinion 4% N/A N/A N/A N/A N/A 6%Sampling Error +/-6.5 +/-7.5
NonUnder $50K College College Sub-
Total $50K or more Grad Grad Urban urban Rural----- ----- ------- ------- -------- ----- ----- -----
Jeb Bush 1% N/A 1% N/A 1% N/A N/A N/ABen Carson 7% N/A 9% N/A 7% N/A N/A N/ATed Cruz 17% N/A 19% N/A 22% N/A N/A N/AJim Gilmore * N/A * N/A * N/A N/A N/AJohn Kasich 5% N/A 3% N/A 4% N/A N/A N/AMarco Rubio 19% N/A 21% N/A 15% N/A N/A N/ADonald Trump 45% N/A 42% N/A 45% N/A N/A N/A
Someone else 2% N/A 1% N/A 1% N/A N/A N/ANone/No one * N/A * N/A * N/A N/A N/ANo opinion 4% N/A 3% N/A 5% N/A N/A N/ASampling Error +/-6.5 +/-8.0 +/-8.5
* percentage less than 1%

8/20/2019 Cnn Orc Nevada Poll 2-17-16
http://slidepdf.com/reader/full/cnn-orc-nevada-poll-2-17-16 15/45
POLL -15- February 10-15, 20163
Nevada CNN/ORC International Poll -- February 10 to 15, 2016Question RP1If the Republican presidential caucus in Nevada were held today,please tell me which of the following people you would be most likely to support.
Base = Republican likely caucus goers
Demo- Indep- Repub- Lib- Mod- Conser-Total crat endent lican eral erate vative----- ----- ------ ------ ----- ----- -------
Jeb Bush 1% N/A N/A 1% N/A N/A *Ben Carson 7% N/A N/A 9% N/A N/A 9%Ted Cruz 17% N/A N/A 15% N/A N/A 26%Jim Gilmore * N/A N/A * N/A N/A *John Kasich 5% N/A N/A 3% N/A N/A 5%Marco Rubio 19% N/A N/A 21% N/A N/A 18%Donald Trump 45% N/A N/A 47% N/A N/A 39%Someone else 2% N/A N/A * N/A N/A *None/No one * N/A N/A * N/A N/A *No opinion 4% N/A N/A 4% N/A N/A 3%Sampling Error +/-6.5 +/-7.0 +/-8.0
RestWashoe Clark of
Total Cnty Cnty States----- ------ ------ ------
Jeb Bush 1% N/A 1% N/ABen Carson 7% N/A 8% N/ATed Cruz 17% N/A 17% N/AJim Gilmore * N/A * N/AJohn Kasich 5% N/A 8% N/A
Marco Rubio 19% N/A 18% N/ADonald Trump 45% N/A 43% N/ASomeone else 2% N/A 2% N/ANone/No one * N/A * N/ANo opinion 4% N/A 3% N/ASampling Error +/-6.5 +/-8.0
* percentage less than 1%

8/20/2019 Cnn Orc Nevada Poll 2-17-16
http://slidepdf.com/reader/full/cnn-orc-nevada-poll-2-17-16 16/45
POLL -16- February 10-15, 20163
Nevada CNN/ORC International Poll -- February 10 to 15, 2016Question RP2Have you definitely decided who you will support in the Nevada Republican caucus,are you leaning toward someone, or have you considered some candidates but arestill trying to decide?
Base = Republican likely caucus goers
White WhiteTotal Men Women White Non-White Men Women----- ----- ----- ----- --------- ------ ------
Definitely decided 59% 61% N/A 57% N/A N/A N/ALeaning toward someone 15% 20% N/A 17% N/A N/A N/AStill trying to decide 26% 19% N/A 26% N/A N/A N/ANo opinion * * N/A * N/A N/A N/ASampling Error +/-6.5 +/-8.5 +/-7.0
18- 35- 50- Under 55 andTotal 34 49 64 65+ 55 Older----- ----- ----- ----- ----- ----- ------
Definitely decided 59% N/A N/A N/A N/A N/A 63%Leaning toward someone 15% N/A N/A N/A N/A N/A 14%Still trying to decide 26% N/A N/A N/A N/A N/A 24%No opinion * N/A N/A N/A N/A N/A *Sampling Error +/-6.5 +/-7.5
NonUnder $50K College College Sub-
Total $50K or more Grad Grad Urban urban Rural----- ----- ------- ------- -------- ----- ----- -----
Definitely decided 59% N/A 57% N/A 60% N/A N/A N/A
Leaning toward someone 15% N/A 18% N/A 16% N/A N/A N/AStill trying to decide 26% N/A 26% N/A 24% N/A N/A N/ANo opinion * N/A * N/A * N/A N/A N/ASampling Error +/-6.5 +/-8.0 +/-8.5
Demo- Indep- Repub- Lib- Mod- Conser-Total crat endent lican eral erate vative----- ----- ------ ------ ----- ----- -------
Definitely decided 59% N/A N/A 59% N/A N/A 64%Leaning toward someone 15% N/A N/A 16% N/A N/A 15%Still trying to decide 26% N/A N/A 25% N/A N/A 21%No opinion * N/A N/A * N/A N/A *Sampling Error +/-6.5 +/-7.0 +/-8.0
RestWashoe Clark of
Total Cnty Cnty States
----- ------ ------ ------Definitely decided 59% N/A 58% N/ALeaning toward someone 15% N/A 15% N/AStill trying to decide 26% N/A 26% N/ANo opinion * N/A * N/ASampling Error +/-6.5 +/-8.0
* percentage less than 1%

8/20/2019 Cnn Orc Nevada Poll 2-17-16
http://slidepdf.com/reader/full/cnn-orc-nevada-poll-2-17-16 17/45
POLL -17- February 10-15, 20163
Nevada CNN/ORC International Poll -- February 10 to 15, 2016Question RP3ANow I'm going to mention a few issues and for each one, please tell me which Republican candidateyou think would best handle that issue if he or she were elected President. Please feel free toname a candidate even if you may not be voting for that person. Which Republican candidate do youthink would do the best job handling:
A. The economy
Base = Republican likely caucus goers
White WhiteTotal Men Women White Non-White Men Women----- ----- ----- ----- --------- ------ ------
Jeb Bush 3% 2% N/A 3% N/A N/A N/ABen Carson 4% 4% N/A 4% N/A N/A N/ATed Cruz 14% 14% N/A 11% N/A N/A N/AJim Gilmore * * N/A * N/A N/A N/AJohn Kasich 5% 7% N/A 5% N/A N/A N/AMarco Rubio 11% 11% N/A 12% N/A N/A N/ADonald Trump 61% 59% N/A 63% N/A N/A N/ASomeone else 1% * N/A * N/A N/A N/ANone/No one * * N/A * N/A N/A N/ANo opinion 1% 2% N/A 2% N/A N/A N/ASampling Error +/-6.5 +/-8.5 +/-7.0
18- 35- 50- Under 55 andTotal 34 49 64 65+ 55 Older----- ----- ----- ----- ----- ----- ------
Jeb Bush 3% N/A N/A N/A N/A N/A 4%Ben Carson 4% N/A N/A N/A N/A N/A 4%
Ted Cruz 14% N/A N/A N/A N/A N/A 14%Jim Gilmore * N/A N/A N/A N/A N/A *John Kasich 5% N/A N/A N/A N/A N/A 7%Marco Rubio 11% N/A N/A N/A N/A N/A 7%Donald Trump 61% N/A N/A N/A N/A N/A 62%Someone else 1% N/A N/A N/A N/A N/A *None/No one * N/A N/A N/A N/A N/A 1%No opinion 1% N/A N/A N/A N/A N/A *Sampling Error +/-6.5 +/-7.5
NonUnder $50K College College Sub-
Total $50K or more Grad Grad Urban urban Rural----- ----- ------- ------- -------- ----- ----- -----
Jeb Bush 3% N/A 3% N/A 2% N/A N/A N/ABen Carson 4% N/A 4% N/A 4% N/A N/A N/ATed Cruz 14% N/A 15% N/A 18% N/A N/A N/A
Jim Gilmore * N/A * N/A * N/A N/A N/AJohn Kasich 5% N/A 6% N/A 5% N/A N/A N/AMarco Rubio 11% N/A 12% N/A 9% N/A N/A N/ADonald Trump 61% N/A 58% N/A 60% N/A N/A N/ASomeone else 1% N/A 2% N/A * N/A N/A N/ANone/No one * N/A * N/A * N/A N/A N/ANo opinion 1% N/A * N/A 2% N/A N/A N/ASampling Error +/-6.5 +/-8.0 +/-8.5
Demo- Indep- Repub- Lib- Mod- Conser-Total crat endent lican eral erate vative----- ----- ------ ------ ----- ----- -------
Jeb Bush 3% N/A N/A 3% N/A N/A 2%Ben Carson 4% N/A N/A 4% N/A N/A 4%Ted Cruz 14% N/A N/A 13% N/A N/A 20%Jim Gilmore * N/A N/A * N/A N/A *John Kasich 5% N/A N/A 4% N/A N/A 4%
Marco Rubio 11% N/A N/A 13% N/A N/A 12%Donald Trump 61% N/A N/A 62% N/A N/A 57%Someone else 1% N/A N/A * N/A N/A *None/No one * N/A N/A * N/A N/A *No opinion 1% N/A N/A 1% N/A N/A *Sampling Error +/-6.5 +/-7.0 +/-8.0
* percentage less than 1%

8/20/2019 Cnn Orc Nevada Poll 2-17-16
http://slidepdf.com/reader/full/cnn-orc-nevada-poll-2-17-16 18/45
POLL -18- February 10-15, 20163
Nevada CNN/ORC International Poll -- February 10 to 15, 2016Question RP3ANow I'm going to mention a few issues and for each one, please tell me which Republican candidateyou think would best handle that issue if he or she were elected President. Please feel free toname a candidate even if you may not be voting for that person. Which Republican candidate do youthink would do the best job handling:
A. The economy
Base = Republican likely caucus goers
RestWashoe Clark of
Total Cnty Cnty States----- ------ ------ ------
Jeb Bush 3% N/A 3% N/ABen Carson 4% N/A 4% N/ATed Cruz 14% N/A 14% N/AJim Gilmore * N/A * N/AJohn Kasich 5% N/A 4% N/AMarco Rubio 11% N/A 11% N/ADonald Trump 61% N/A 62% N/ASomeone else 1% N/A 2% N/ANone/No one * N/A * N/ANo opinion 1% N/A * N/ASampling Error +/-6.5 +/-8.0
* percentage less than 1%
8/20/2019 Cnn Orc Nevada Poll 2-17-16
http://slidepdf.com/reader/full/cnn-orc-nevada-poll-2-17-16 19/45
POLL -19- February 10-15, 20163
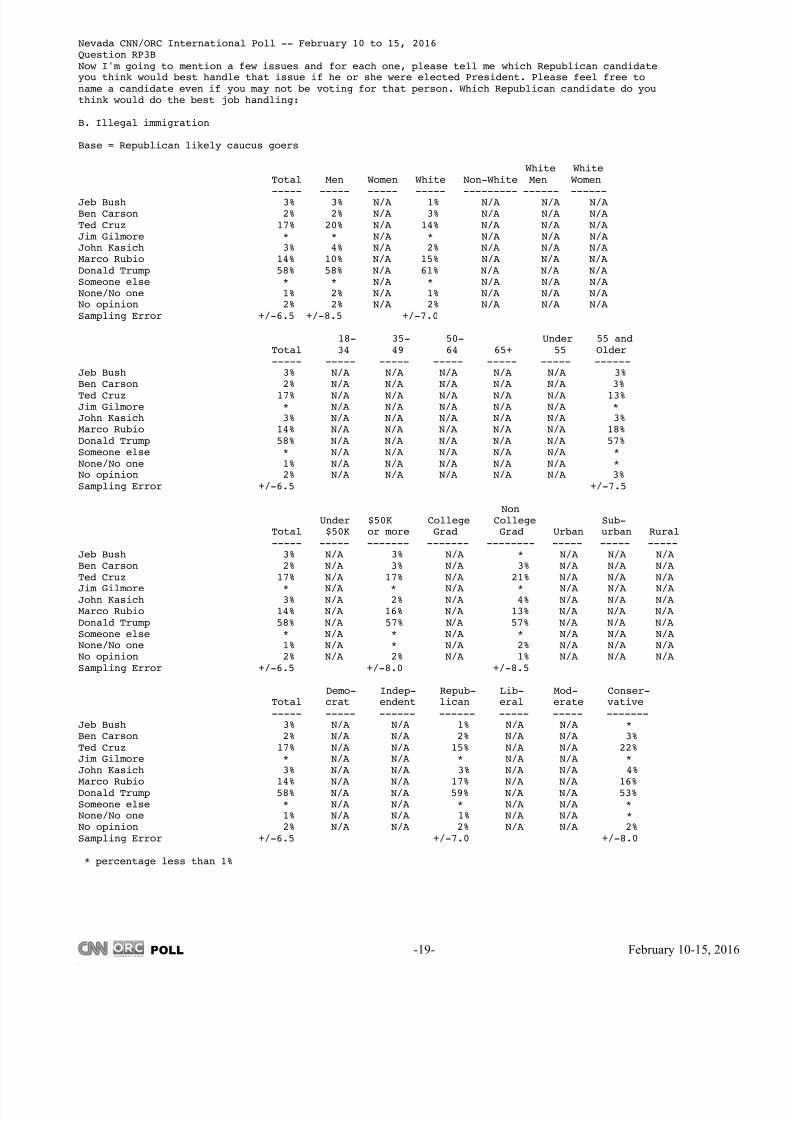
Nevada CNN/ORC International Poll -- February 10 to 15, 2016Question RP3BNow I'm going to mention a few issues and for each one, please tell me which Republican candidateyou think would best handle that issue if he or she were elected President. Please feel free toname a candidate even if you may not be voting for that person. Which Republican candidate do youthink would do the best job handling:
B. Illegal immigration
Base = Republican likely caucus goers
White WhiteTotal Men Women White Non-White Men Women----- ----- ----- ----- --------- ------ ------
Jeb Bush 3% 3% N/A 1% N/A N/A N/ABen Carson 2% 2% N/A 3% N/A N/A N/ATed Cruz 17% 20% N/A 14% N/A N/A N/AJim Gilmore * * N/A * N/A N/A N/AJohn Kasich 3% 4% N/A 2% N/A N/A N/AMarco Rubio 14% 10% N/A 15% N/A N/A N/ADonald Trump 58% 58% N/A 61% N/A N/A N/ASomeone else * * N/A * N/A N/A N/ANone/No one 1% 2% N/A 1% N/A N/A N/ANo opinion 2% 2% N/A 2% N/A N/A N/ASampling Error +/-6.5 +/-8.5 +/-7.0
18- 35- 50- Under 55 andTotal 34 49 64 65+ 55 Older----- ----- ----- ----- ----- ----- ------
Jeb Bush 3% N/A N/A N/A N/A N/A 3%Ben Carson 2% N/A N/A N/A N/A N/A 3%
Ted Cruz 17% N/A N/A N/A N/A N/A 13%Jim Gilmore * N/A N/A N/A N/A N/A *John Kasich 3% N/A N/A N/A N/A N/A 3%Marco Rubio 14% N/A N/A N/A N/A N/A 18%Donald Trump 58% N/A N/A N/A N/A N/A 57%Someone else * N/A N/A N/A N/A N/A *None/No one 1% N/A N/A N/A N/A N/A *No opinion 2% N/A N/A N/A N/A N/A 3%Sampling Error +/-6.5 +/-7.5
NonUnder $50K College College Sub-
Total $50K or more Grad Grad Urban urban Rural----- ----- ------- ------- -------- ----- ----- -----
Jeb Bush 3% N/A 3% N/A * N/A N/A N/ABen Carson 2% N/A 3% N/A 3% N/A N/A N/ATed Cruz 17% N/A 17% N/A 21% N/A N/A N/A
Jim Gilmore * N/A * N/A * N/A N/A N/AJohn Kasich 3% N/A 2% N/A 4% N/A N/A N/AMarco Rubio 14% N/A 16% N/A 13% N/A N/A N/ADonald Trump 58% N/A 57% N/A 57% N/A N/A N/ASomeone else * N/A * N/A * N/A N/A N/ANone/No one 1% N/A * N/A 2% N/A N/A N/ANo opinion 2% N/A 2% N/A 1% N/A N/A N/ASampling Error +/-6.5 +/-8.0 +/-8.5
Demo- Indep- Repub- Lib- Mod- Conser-Total crat endent lican eral erate vative----- ----- ------ ------ ----- ----- -------
Jeb Bush 3% N/A N/A 1% N/A N/A *Ben Carson 2% N/A N/A 2% N/A N/A 3%Ted Cruz 17% N/A N/A 15% N/A N/A 22%Jim Gilmore * N/A N/A * N/A N/A *John Kasich 3% N/A N/A 3% N/A N/A 4%
Marco Rubio 14% N/A N/A 17% N/A N/A 16%Donald Trump 58% N/A N/A 59% N/A N/A 53%Someone else * N/A N/A * N/A N/A *None/No one 1% N/A N/A 1% N/A N/A *No opinion 2% N/A N/A 2% N/A N/A 2%Sampling Error +/-6.5 +/-7.0 +/-8.0
* percentage less than 1%

8/20/2019 Cnn Orc Nevada Poll 2-17-16
http://slidepdf.com/reader/full/cnn-orc-nevada-poll-2-17-16 20/45
POLL -20- February 10-15, 20163
Nevada CNN/ORC International Poll -- February 10 to 15, 2016Question RP3BNow I'm going to mention a few issues and for each one, please tell me which Republican candidateyou think would best handle that issue if he or she were elected President. Please feel free toname a candidate even if you may not be voting for that person. Which Republican candidate do youthink would do the best job handling:
B. Illegal immigration
Base = Republican likely caucus goers
RestWashoe Clark of
Total Cnty Cnty States----- ------ ------ ------
Jeb Bush 3% N/A 5% N/ABen Carson 2% N/A 2% N/ATed Cruz 17% N/A 17% N/AJim Gilmore * N/A * N/AJohn Kasich 3% N/A 5% N/AMarco Rubio 14% N/A 13% N/ADonald Trump 58% N/A 57% N/ASomeone else * N/A * N/ANone/No one 1% N/A * N/ANo opinion 2% N/A 2% N/ASampling Error +/-6.5 +/-8.0
* percentage less than 1%
8/20/2019 Cnn Orc Nevada Poll 2-17-16
http://slidepdf.com/reader/full/cnn-orc-nevada-poll-2-17-16 21/45
POLL -21- February 10-15, 20163
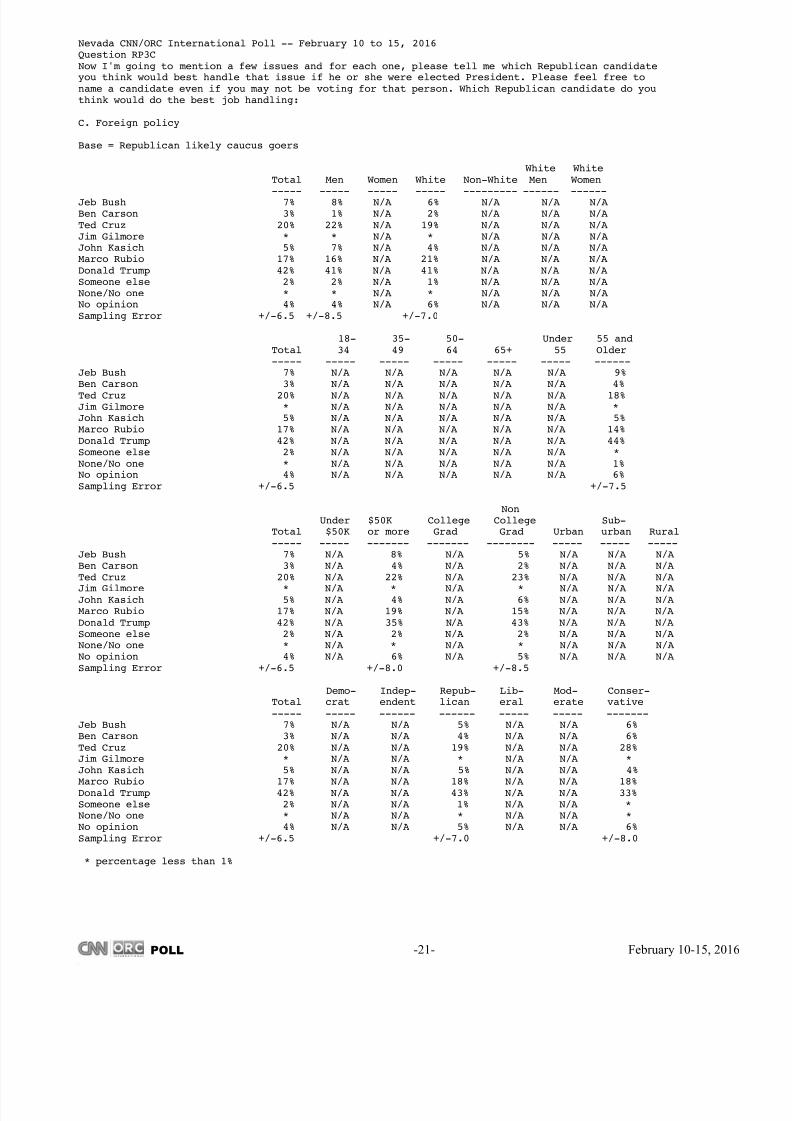
Nevada CNN/ORC International Poll -- February 10 to 15, 2016Question RP3CNow I'm going to mention a few issues and for each one, please tell me which Republican candidateyou think would best handle that issue if he or she were elected President. Please feel free toname a candidate even if you may not be voting for that person. Which Republican candidate do youthink would do the best job handling:
C. Foreign policy
Base = Republican likely caucus goers
White WhiteTotal Men Women White Non-White Men Women----- ----- ----- ----- --------- ------ ------
Jeb Bush 7% 8% N/A 6% N/A N/A N/ABen Carson 3% 1% N/A 2% N/A N/A N/ATed Cruz 20% 22% N/A 19% N/A N/A N/AJim Gilmore * * N/A * N/A N/A N/AJohn Kasich 5% 7% N/A 4% N/A N/A N/AMarco Rubio 17% 16% N/A 21% N/A N/A N/ADonald Trump 42% 41% N/A 41% N/A N/A N/ASomeone else 2% 2% N/A 1% N/A N/A N/ANone/No one * * N/A * N/A N/A N/ANo opinion 4% 4% N/A 6% N/A N/A N/ASampling Error +/-6.5 +/-8.5 +/-7.0
18- 35- 50- Under 55 andTotal 34 49 64 65+ 55 Older----- ----- ----- ----- ----- ----- ------
Jeb Bush 7% N/A N/A N/A N/A N/A 9%Ben Carson 3% N/A N/A N/A N/A N/A 4%
Ted Cruz 20% N/A N/A N/A N/A N/A 18%Jim Gilmore * N/A N/A N/A N/A N/A *John Kasich 5% N/A N/A N/A N/A N/A 5%Marco Rubio 17% N/A N/A N/A N/A N/A 14%Donald Trump 42% N/A N/A N/A N/A N/A 44%Someone else 2% N/A N/A N/A N/A N/A *None/No one * N/A N/A N/A N/A N/A 1%No opinion 4% N/A N/A N/A N/A N/A 6%Sampling Error +/-6.5 +/-7.5
NonUnder $50K College College Sub-
Total $50K or more Grad Grad Urban urban Rural----- ----- ------- ------- -------- ----- ----- -----
Jeb Bush 7% N/A 8% N/A 5% N/A N/A N/ABen Carson 3% N/A 4% N/A 2% N/A N/A N/ATed Cruz 20% N/A 22% N/A 23% N/A N/A N/A
Jim Gilmore * N/A * N/A * N/A N/A N/AJohn Kasich 5% N/A 4% N/A 6% N/A N/A N/AMarco Rubio 17% N/A 19% N/A 15% N/A N/A N/ADonald Trump 42% N/A 35% N/A 43% N/A N/A N/ASomeone else 2% N/A 2% N/A 2% N/A N/A N/ANone/No one * N/A * N/A * N/A N/A N/ANo opinion 4% N/A 6% N/A 5% N/A N/A N/ASampling Error +/-6.5 +/-8.0 +/-8.5
Demo- Indep- Repub- Lib- Mod- Conser-Total crat endent lican eral erate vative----- ----- ------ ------ ----- ----- -------
Jeb Bush 7% N/A N/A 5% N/A N/A 6%Ben Carson 3% N/A N/A 4% N/A N/A 6%Ted Cruz 20% N/A N/A 19% N/A N/A 28%Jim Gilmore * N/A N/A * N/A N/A *John Kasich 5% N/A N/A 5% N/A N/A 4%
Marco Rubio 17% N/A N/A 18% N/A N/A 18%Donald Trump 42% N/A N/A 43% N/A N/A 33%Someone else 2% N/A N/A 1% N/A N/A *None/No one * N/A N/A * N/A N/A *No opinion 4% N/A N/A 5% N/A N/A 6%Sampling Error +/-6.5 +/-7.0 +/-8.0
* percentage less than 1%

8/20/2019 Cnn Orc Nevada Poll 2-17-16
http://slidepdf.com/reader/full/cnn-orc-nevada-poll-2-17-16 22/45
POLL -22- February 10-15, 20163
Nevada CNN/ORC International Poll -- February 10 to 15, 2016Question RP3CNow I'm going to mention a few issues and for each one, please tell me which Republican candidateyou think would best handle that issue if he or she were elected President. Please feel free toname a candidate even if you may not be voting for that person. Which Republican candidate do youthink would do the best job handling:
C. Foreign policy
Base = Republican likely caucus goers
RestWashoe Clark of
Total Cnty Cnty States----- ------ ------ ------
Jeb Bush 7% N/A 8% N/ABen Carson 3% N/A 5% N/ATed Cruz 20% N/A 18% N/AJim Gilmore * N/A * N/AJohn Kasich 5% N/A 7% N/AMarco Rubio 17% N/A 19% N/ADonald Trump 42% N/A 38% N/ASomeone else 2% N/A 2% N/ANone/No one * N/A 1% N/ANo opinion 4% N/A 3% N/ASampling Error +/-6.5 +/-8.0
* percentage less than 1%
8/20/2019 Cnn Orc Nevada Poll 2-17-16
http://slidepdf.com/reader/full/cnn-orc-nevada-poll-2-17-16 23/45
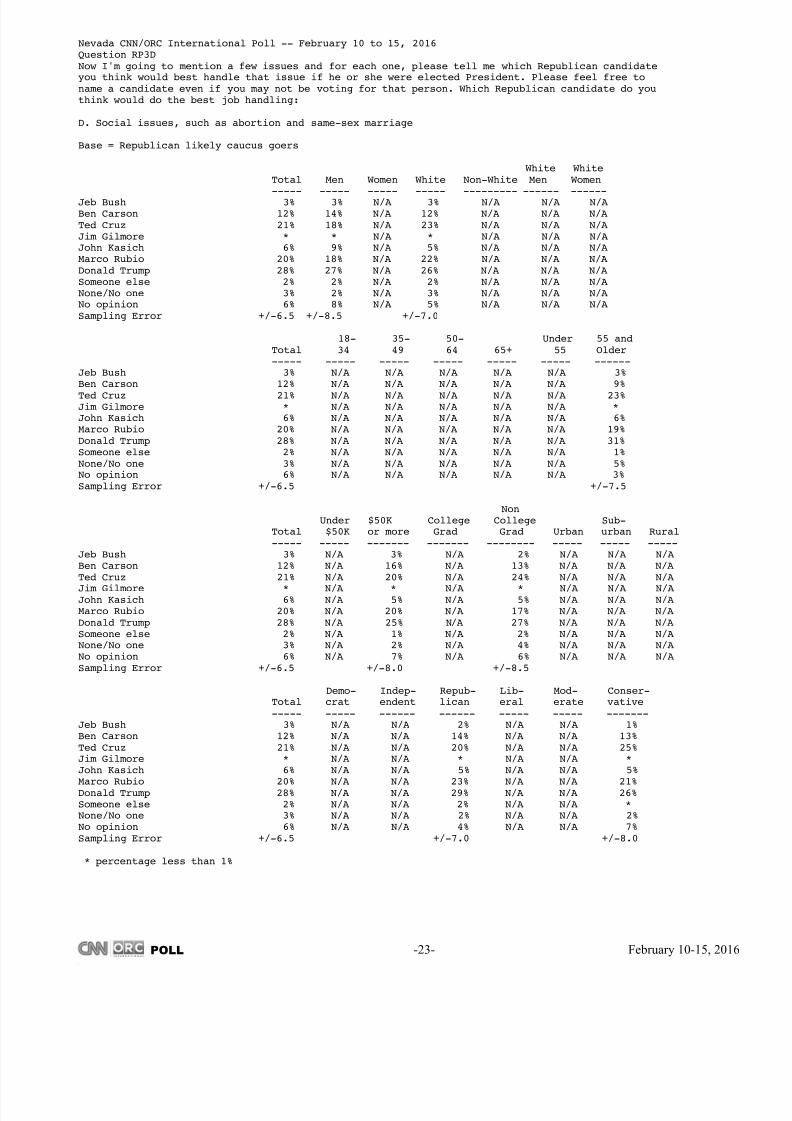
POLL -23- February 10-15, 20163
Nevada CNN/ORC International Poll -- February 10 to 15, 2016Question RP3DNow I'm going to mention a few issues and for each one, please tell me which Republican candidateyou think would best handle that issue if he or she were elected President. Please feel free toname a candidate even if you may not be voting for that person. Which Republican candidate do youthink would do the best job handling:
D. Social issues, such as abortion and same-sex marriage
Base = Republican likely caucus goers
White WhiteTotal Men Women White Non-White Men Women----- ----- ----- ----- --------- ------ ------
Jeb Bush 3% 3% N/A 3% N/A N/A N/ABen Carson 12% 14% N/A 12% N/A N/A N/ATed Cruz 21% 18% N/A 23% N/A N/A N/AJim Gilmore * * N/A * N/A N/A N/AJohn Kasich 6% 9% N/A 5% N/A N/A N/AMarco Rubio 20% 18% N/A 22% N/A N/A N/ADonald Trump 28% 27% N/A 26% N/A N/A N/ASomeone else 2% 2% N/A 2% N/A N/A N/ANone/No one 3% 2% N/A 3% N/A N/A N/ANo opinion 6% 8% N/A 5% N/A N/A N/ASampling Error +/-6.5 +/-8.5 +/-7.0
18- 35- 50- Under 55 andTotal 34 49 64 65+ 55 Older----- ----- ----- ----- ----- ----- ------
Jeb Bush 3% N/A N/A N/A N/A N/A 3%Ben Carson 12% N/A N/A N/A N/A N/A 9%
Ted Cruz 21% N/A N/A N/A N/A N/A 23%Jim Gilmore * N/A N/A N/A N/A N/A *John Kasich 6% N/A N/A N/A N/A N/A 6%Marco Rubio 20% N/A N/A N/A N/A N/A 19%Donald Trump 28% N/A N/A N/A N/A N/A 31%Someone else 2% N/A N/A N/A N/A N/A 1%None/No one 3% N/A N/A N/A N/A N/A 5%No opinion 6% N/A N/A N/A N/A N/A 3%Sampling Error +/-6.5 +/-7.5
NonUnder $50K College College Sub-
Total $50K or more Grad Grad Urban urban Rural----- ----- ------- ------- -------- ----- ----- -----
Jeb Bush 3% N/A 3% N/A 2% N/A N/A N/ABen Carson 12% N/A 16% N/A 13% N/A N/A N/ATed Cruz 21% N/A 20% N/A 24% N/A N/A N/A
Jim Gilmore * N/A * N/A * N/A N/A N/AJohn Kasich 6% N/A 5% N/A 5% N/A N/A N/AMarco Rubio 20% N/A 20% N/A 17% N/A N/A N/ADonald Trump 28% N/A 25% N/A 27% N/A N/A N/ASomeone else 2% N/A 1% N/A 2% N/A N/A N/ANone/No one 3% N/A 2% N/A 4% N/A N/A N/ANo opinion 6% N/A 7% N/A 6% N/A N/A N/ASampling Error +/-6.5 +/-8.0 +/-8.5
Demo- Indep- Repub- Lib- Mod- Conser-Total crat endent lican eral erate vative----- ----- ------ ------ ----- ----- -------
Jeb Bush 3% N/A N/A 2% N/A N/A 1%Ben Carson 12% N/A N/A 14% N/A N/A 13%Ted Cruz 21% N/A N/A 20% N/A N/A 25%Jim Gilmore * N/A N/A * N/A N/A *John Kasich 6% N/A N/A 5% N/A N/A 5%
Marco Rubio 20% N/A N/A 23% N/A N/A 21%Donald Trump 28% N/A N/A 29% N/A N/A 26%Someone else 2% N/A N/A 2% N/A N/A *None/No one 3% N/A N/A 2% N/A N/A 2%No opinion 6% N/A N/A 4% N/A N/A 7%Sampling Error +/-6.5 +/-7.0 +/-8.0
* percentage less than 1%

8/20/2019 Cnn Orc Nevada Poll 2-17-16
http://slidepdf.com/reader/full/cnn-orc-nevada-poll-2-17-16 24/45
POLL -24- February 10-15, 20163
Nevada CNN/ORC International Poll -- February 10 to 15, 2016Question RP3DNow I'm going to mention a few issues and for each one, please tell me which Republican candidateyou think would best handle that issue if he or she were elected President. Please feel free toname a candidate even if you may not be voting for that person. Which Republican candidate do youthink would do the best job handling:
D. Social issues, such as abortion and same-sex marriage
Base = Republican likely caucus goers
RestWashoe Clark of
Total Cnty Cnty States----- ------ ------ ------
Jeb Bush 3% N/A 3% N/ABen Carson 12% N/A 13% N/ATed Cruz 21% N/A 19% N/AJim Gilmore * N/A * N/AJohn Kasich 6% N/A 6% N/AMarco Rubio 20% N/A 21% N/ADonald Trump 28% N/A 28% N/ASomeone else 2% N/A 2% N/ANone/No one 3% N/A 1% N/ANo opinion 6% N/A 7% N/ASampling Error +/-6.5 +/-8.0
* percentage less than 1%

8/20/2019 Cnn Orc Nevada Poll 2-17-16
http://slidepdf.com/reader/full/cnn-orc-nevada-poll-2-17-16 25/45
POLL -25- February 10-15, 20163
Nevada CNN/ORC International Poll -- February 10 to 15, 2016Question RP3ENow I'm going to mention a few issues and for each one, please tell me which Republican candidateyou think would best handle that issue if he or she were elected President. Please feel free toname a candidate even if you may not be voting for that person. Which Republican candidate do youthink would do the best job handling:
E. ISIS
Base = Republican likely caucus goers
White WhiteTotal Men Women White Non-White Men Women----- ----- ----- ----- --------- ------ ------
Jeb Bush 6% 6% N/A 6% N/A N/A N/ABen Carson 2% 1% N/A 2% N/A N/A N/ATed Cruz 16% 18% N/A 14% N/A N/A N/AJim Gilmore * * N/A * N/A N/A N/AJohn Kasich 5% 7% N/A 5% N/A N/A N/AMarco Rubio 13% 11% N/A 13% N/A N/A N/ADonald Trump 55% 51% N/A 55% N/A N/A N/ASomeone else * 1% N/A * N/A N/A N/ANone/No one * * N/A * N/A N/A N/ANo opinion 3% 4% N/A 4% N/A N/A N/ASampling Error +/-6.5 +/-8.5 +/-7.0
18- 35- 50- Under 55 andTotal 34 49 64 65+ 55 Older----- ----- ----- ----- ----- ----- ------
Jeb Bush 6% N/A N/A N/A N/A N/A 6%Ben Carson 2% N/A N/A N/A N/A N/A 3%
Ted Cruz 16% N/A N/A N/A N/A N/A 17%Jim Gilmore * N/A N/A N/A N/A N/A *John Kasich 5% N/A N/A N/A N/A N/A 3%Marco Rubio 13% N/A N/A N/A N/A N/A 13%Donald Trump 55% N/A N/A N/A N/A N/A 55%Someone else * N/A N/A N/A N/A N/A *None/No one * N/A N/A N/A N/A N/A 1%No opinion 3% N/A N/A N/A N/A N/A 3%Sampling Error +/-6.5 +/-7.5
NonUnder $50K College College Sub-
Total $50K or more Grad Grad Urban urban Rural----- ----- ------- ------- -------- ----- ----- -----
Jeb Bush 6% N/A 7% N/A 5% N/A N/A N/ABen Carson 2% N/A 2% N/A 2% N/A N/A N/ATed Cruz 16% N/A 17% N/A 18% N/A N/A N/A
Jim Gilmore * N/A * N/A * N/A N/A N/AJohn Kasich 5% N/A 5% N/A 6% N/A N/A N/AMarco Rubio 13% N/A 15% N/A 11% N/A N/A N/ADonald Trump 55% N/A 51% N/A 54% N/A N/A N/ASomeone else * N/A 1% N/A * N/A N/A N/ANone/No one * N/A * N/A * N/A N/A N/ANo opinion 3% N/A 1% N/A 3% N/A N/A N/ASampling Error +/-6.5 +/-8.0 +/-8.5
Demo- Indep- Repub- Lib- Mod- Conser-Total crat endent lican eral erate vative----- ----- ------ ------ ----- ----- -------
Jeb Bush 6% N/A N/A 6% N/A N/A 5%Ben Carson 2% N/A N/A 2% N/A N/A 3%Ted Cruz 16% N/A N/A 14% N/A N/A 22%Jim Gilmore * N/A N/A * N/A N/A *John Kasich 5% N/A N/A 6% N/A N/A 5%
Marco Rubio 13% N/A N/A 14% N/A N/A 13%Donald Trump 55% N/A N/A 54% N/A N/A 49%Someone else * N/A N/A * N/A N/A *None/No one * N/A N/A * N/A N/A 1%No opinion 3% N/A N/A 4% N/A N/A 3%Sampling Error +/-6.5 +/-7.0 +/-8.0
* percentage less than 1%

8/20/2019 Cnn Orc Nevada Poll 2-17-16
http://slidepdf.com/reader/full/cnn-orc-nevada-poll-2-17-16 26/45
POLL -26- February 10-15, 20163
Nevada CNN/ORC International Poll -- February 10 to 15, 2016Question RP3ENow I'm going to mention a few issues and for each one, please tell me which Republican candidateyou think would best handle that issue if he or she were elected President. Please feel free toname a candidate even if you may not be voting for that person. Which Republican candidate do youthink would do the best job handling:
E. ISIS
Base = Republican likely caucus goers
RestWashoe Clark of
Total Cnty Cnty States----- ------ ------ ------
Jeb Bush 6% N/A 7% N/ABen Carson 2% N/A 2% N/ATed Cruz 16% N/A 17% N/AJim Gilmore * N/A * N/AJohn Kasich 5% N/A 5% N/AMarco Rubio 13% N/A 14% N/ADonald Trump 55% N/A 52% N/ASomeone else * N/A 1% N/ANone/No one * N/A 1% N/ANo opinion 3% N/A 1% N/ASampling Error +/-6.5 +/-8.0
* percentage less than 1%

8/20/2019 Cnn Orc Nevada Poll 2-17-16
http://slidepdf.com/reader/full/cnn-orc-nevada-poll-2-17-16 27/45
POLL -27- February 10-15, 20163
Nevada CNN/ORC International Poll -- February 10 to 15, 2016Question RP4ANow I'm going to read you a few phrases which describe the candidates, and for each one, tell me
which Republican candidate you think that phrase best describes, regardless of who you are votingfor. Which Republican candidate do you think:
A. Best represents the values of Republicans like yourself
Base = Republican likely caucus goers
White WhiteTotal Men Women White Non-White Men Women----- ----- ----- ----- --------- ------ ------
Jeb Bush 4% 3% N/A 2% N/A N/A N/ABen Carson 9% 7% N/A 7% N/A N/A N/ATed Cruz 22% 23% N/A 21% N/A N/A N/AJim Gilmore * * N/A * N/A N/A N/AJohn Kasich 6% 8% N/A 6% N/A N/A N/AMarco Rubio 20% 17% N/A 23% N/A N/A N/ADonald Trump 35% 38% N/A 37% N/A N/A N/ASomeone else 2% 1% N/A 1% N/A N/A N/ANone/No one 1% 1% N/A 1% N/A N/A N/ANo opinion 2% 2% N/A 3% N/A N/A N/ASampling Error +/-6.5 +/-8.5 +/-7.0
18- 35- 50- Under 55 andTotal 34 49 64 65+ 55 Older----- ----- ----- ----- ----- ----- ------
Jeb Bush 4% N/A N/A N/A N/A N/A 3%Ben Carson 9% N/A N/A N/A N/A N/A 8%Ted Cruz 22% N/A N/A N/A N/A N/A 20%
Jim Gilmore * N/A N/A N/A N/A N/A *John Kasich 6% N/A N/A N/A N/A N/A 9%Marco Rubio 20% N/A N/A N/A N/A N/A 20%Donald Trump 35% N/A N/A N/A N/A N/A 33%Someone else 2% N/A N/A N/A N/A N/A 1%None/No one 1% N/A N/A N/A N/A N/A 2%No opinion 2% N/A N/A N/A N/A N/A 3%Sampling Error +/-6.5 +/-7.5
NonUnder $50K College College Sub-
Total $50K or more Grad Grad Urban urban Rural----- ----- ------- ------- -------- ----- ----- -----
Jeb Bush 4% N/A 3% N/A 1% N/A N/A N/ABen Carson 9% N/A 11% N/A 8% N/A N/A N/ATed Cruz 22% N/A 23% N/A 27% N/A N/A N/AJim Gilmore * N/A * N/A * N/A N/A N/A
John Kasich 6% N/A 6% N/A 7% N/A N/A N/AMarco Rubio 20% N/A 20% N/A 18% N/A N/A N/ADonald Trump 35% N/A 33% N/A 35% N/A N/A N/ASomeone else 2% N/A 2% N/A * N/A N/A N/ANone/No one 1% N/A * N/A 1% N/A N/A N/ANo opinion 2% N/A 2% N/A 3% N/A N/A N/ASampling Error +/-6.5 +/-8.0 +/-8.5
Demo- Indep- Repub- Lib- Mod- Conser-Total crat endent lican eral erate vative----- ----- ------ ------ ----- ----- -------
Jeb Bush 4% N/A N/A 3% N/A N/A 3%Ben Carson 9% N/A N/A 9% N/A N/A 11%Ted Cruz 22% N/A N/A 20% N/A N/A 30%Jim Gilmore * N/A N/A * N/A N/A *John Kasich 6% N/A N/A 6% N/A N/A 7%Marco Rubio 20% N/A N/A 21% N/A N/A 19%
Donald Trump 35% N/A N/A 36% N/A N/A 28%Someone else 2% N/A N/A 1% N/A N/A *None/No one 1% N/A N/A 1% N/A N/A 2%No opinion 2% N/A N/A 2% N/A N/A 1%Sampling Error +/-6.5 +/-7.0 +/-8.0
* percentage less than 1%

8/20/2019 Cnn Orc Nevada Poll 2-17-16
http://slidepdf.com/reader/full/cnn-orc-nevada-poll-2-17-16 28/45
POLL -28- February 10-15, 20163
Nevada CNN/ORC International Poll -- February 10 to 15, 2016Question RP4ANow I'm going to read you a few phrases which describe the candidates, and for each one, tell me
which Republican candidate you think that phrase best describes, regardless of who you are votingfor. Which Republican candidate do you think:
A. Best represents the values of Republicans like yourself
Base = Republican likely caucus goers
RestWashoe Clark of
Total Cnty Cnty States----- ------ ------ ------
Jeb Bush 4% N/A 5% N/ABen Carson 9% N/A 10% N/ATed Cruz 22% N/A 20% N/AJim Gilmore * N/A * N/AJohn Kasich 6% N/A 7% N/AMarco Rubio 20% N/A 20% N/ADonald Trump 35% N/A 34% N/ASomeone else 2% N/A 2% N/ANone/No one 1% N/A * N/ANo opinion 2% N/A 3% N/ASampling Error +/-6.5 +/-8.0
* percentage less than 1%

8/20/2019 Cnn Orc Nevada Poll 2-17-16
http://slidepdf.com/reader/full/cnn-orc-nevada-poll-2-17-16 29/45
POLL -29- February 10-15, 20163
Nevada CNN/ORC International Poll -- February 10 to 15, 2016Question RP4BNow I'm going to read you a few phrases which describe the candidates, and for each one, tell me
which Republican candidate you think that phrase best describes, regardless of who you are votingfor. Which Republican candidate do you think:
B. Has the best chance of winning the general election in November
Base = Republican likely caucus goers
White WhiteTotal Men Women White Non-White Men Women----- ----- ----- ----- --------- ------ ------
Jeb Bush * * N/A * N/A N/A N/ABen Carson 1% * N/A 1% N/A N/A N/ATed Cruz 16% 15% N/A 16% N/A N/A N/AJim Gilmore * * N/A * N/A N/A N/AJohn Kasich 4% 4% N/A 3% N/A N/A N/AMarco Rubio 18% 19% N/A 21% N/A N/A N/ADonald Trump 56% 56% N/A 56% N/A N/A N/ASomeone else * * N/A * N/A N/A N/ANone/No one * * N/A * N/A N/A N/ANo opinion 5% 6% N/A 4% N/A N/A N/ASampling Error +/-6.5 +/-8.5 +/-7.0
18- 35- 50- Under 55 andTotal 34 49 64 65+ 55 Older----- ----- ----- ----- ----- ----- ------
Jeb Bush * N/A N/A N/A N/A N/A *Ben Carson 1% N/A N/A N/A N/A N/A 2%Ted Cruz 16% N/A N/A N/A N/A N/A 15%
Jim Gilmore * N/A N/A N/A N/A N/A *John Kasich 4% N/A N/A N/A N/A N/A 4%Marco Rubio 18% N/A N/A N/A N/A N/A 18%Donald Trump 56% N/A N/A N/A N/A N/A 58%Someone else * N/A N/A N/A N/A N/A *None/No one * N/A N/A N/A N/A N/A *No opinion 5% N/A N/A N/A N/A N/A 2%Sampling Error +/-6.5 +/-7.5
NonUnder $50K College College Sub-
Total $50K or more Grad Grad Urban urban Rural----- ----- ------- ------- -------- ----- ----- -----
Jeb Bush * N/A * N/A * N/A N/A N/ABen Carson 1% N/A 1% N/A 1% N/A N/A N/ATed Cruz 16% N/A 15% N/A 18% N/A N/A N/AJim Gilmore * N/A * N/A * N/A N/A N/A
John Kasich 4% N/A 3% N/A 4% N/A N/A N/AMarco Rubio 18% N/A 22% N/A 18% N/A N/A N/ADonald Trump 56% N/A 55% N/A 51% N/A N/A N/ASomeone else * N/A * N/A * N/A N/A N/ANone/No one * N/A * N/A * N/A N/A N/ANo opinion 5% N/A 5% N/A 7% N/A N/A N/ASampling Error +/-6.5 +/-8.0 +/-8.5
Demo- Indep- Repub- Lib- Mod- Conser-Total crat endent lican eral erate vative----- ----- ------ ------ ----- ----- -------
Jeb Bush * N/A N/A * N/A N/A *Ben Carson 1% N/A N/A 1% N/A N/A 1%Ted Cruz 16% N/A N/A 16% N/A N/A 20%Jim Gilmore * N/A N/A * N/A N/A *John Kasich 4% N/A N/A 3% N/A N/A 3%Marco Rubio 18% N/A N/A 22% N/A N/A 21%
Donald Trump 56% N/A N/A 57% N/A N/A 47%Someone else * N/A N/A * N/A N/A *None/No one * N/A N/A * N/A N/A *No opinion 5% N/A N/A 2% N/A N/A 7%Sampling Error +/-6.5 +/-7.0 +/-8.0
* percentage less than 1%

8/20/2019 Cnn Orc Nevada Poll 2-17-16
http://slidepdf.com/reader/full/cnn-orc-nevada-poll-2-17-16 30/45
POLL -30- February 10-15, 20163
Nevada CNN/ORC International Poll -- February 10 to 15, 2016Question RP4BNow I'm going to read you a few phrases which describe the candidates, and for each one, tell me
which Republican candidate you think that phrase best describes, regardless of who you are votingfor. Which Republican candidate do you think:
B. Has the best chance of winning the general election in November
Base = Republican likely caucus goers
RestWashoe Clark of
Total Cnty Cnty States----- ------ ------ ------
Jeb Bush * N/A * N/ABen Carson 1% N/A 1% N/ATed Cruz 16% N/A 13% N/AJim Gilmore * N/A * N/AJohn Kasich 4% N/A 5% N/AMarco Rubio 18% N/A 19% N/ADonald Trump 56% N/A 54% N/ASomeone else * N/A * N/ANone/No one * N/A * N/ANo opinion 5% N/A 6% N/ASampling Error +/-6.5 +/-8.0
* percentage less than 1%

8/20/2019 Cnn Orc Nevada Poll 2-17-16
http://slidepdf.com/reader/full/cnn-orc-nevada-poll-2-17-16 31/45
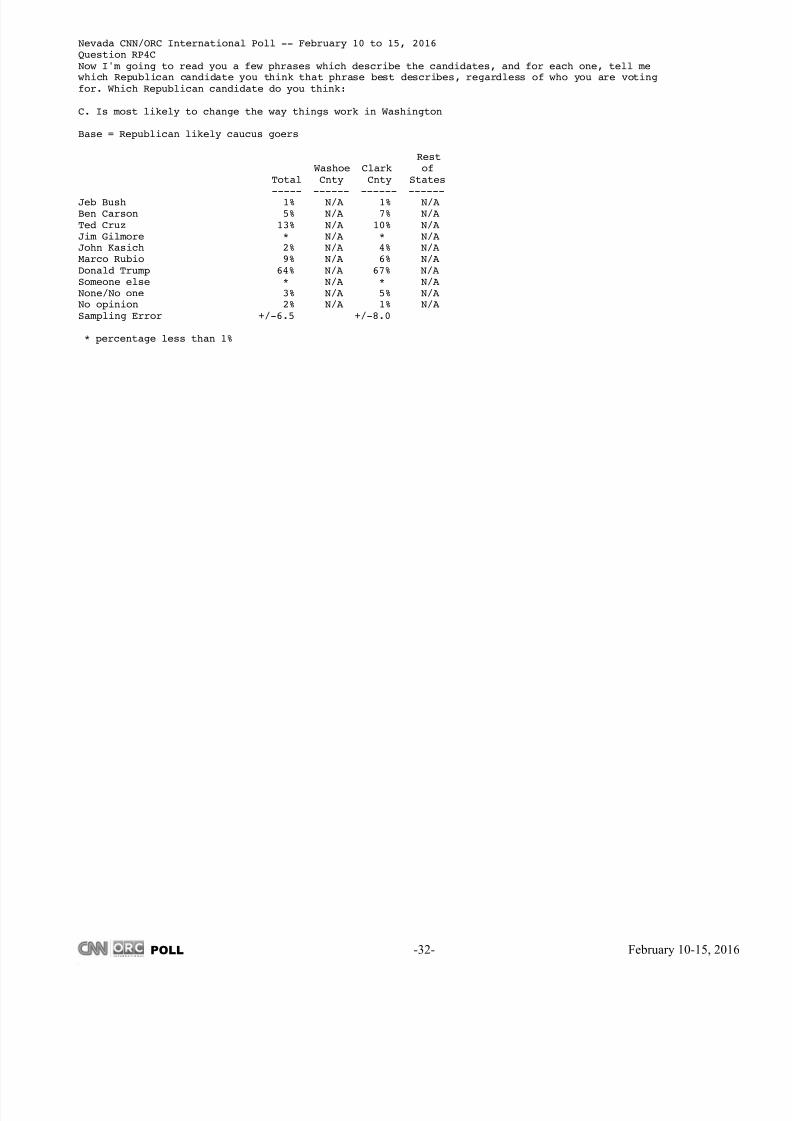
POLL -31- February 10-15, 20163
Nevada CNN/ORC International Poll -- February 10 to 15, 2016Question RP4CNow I'm going to read you a few phrases which describe the candidates, and for each one, tell me
which Republican candidate you think that phrase best describes, regardless of who you are votingfor. Which Republican candidate do you think:
C. Is most likely to change the way things work in Washington
Base = Republican likely caucus goers
White WhiteTotal Men Women White Non-White Men Women----- ----- ----- ----- --------- ------ ------
Jeb Bush 1% 2% N/A 1% N/A N/A N/ABen Carson 5% 6% N/A 6% N/A N/A N/ATed Cruz 13% 15% N/A 12% N/A N/A N/AJim Gilmore * * N/A * N/A N/A N/AJohn Kasich 2% 3% N/A 1% N/A N/A N/AMarco Rubio 9% 8% N/A 9% N/A N/A N/ADonald Trump 64% 59% N/A 66% N/A N/A N/ASomeone else * * N/A * N/A N/A N/ANone/No one 3% 5% N/A 1% N/A N/A N/ANo opinion 2% 2% N/A 2% N/A N/A N/ASampling Error +/-6.5 +/-8.5 +/-7.0
18- 35- 50- Under 55 andTotal 34 49 64 65+ 55 Older----- ----- ----- ----- ----- ----- ------
Jeb Bush 1% N/A N/A N/A N/A N/A *Ben Carson 5% N/A N/A N/A N/A N/A 6%Ted Cruz 13% N/A N/A N/A N/A N/A 16%
Jim Gilmore * N/A N/A N/A N/A N/A *John Kasich 2% N/A N/A N/A N/A N/A 3%Marco Rubio 9% N/A N/A N/A N/A N/A 9%Donald Trump 64% N/A N/A N/A N/A N/A 62%Someone else * N/A N/A N/A N/A N/A *None/No one 3% N/A N/A N/A N/A N/A 2%No opinion 2% N/A N/A N/A N/A N/A 2%Sampling Error +/-6.5 +/-7.5
NonUnder $50K College College Sub-
Total $50K or more Grad Grad Urban urban Rural----- ----- ------- ------- -------- ----- ----- -----
Jeb Bush 1% N/A 1% N/A 1% N/A N/A N/ABen Carson 5% N/A 6% N/A 4% N/A N/A N/ATed Cruz 13% N/A 15% N/A 16% N/A N/A N/AJim Gilmore * N/A * N/A * N/A N/A N/A
John Kasich 2% N/A 1% N/A 4% N/A N/A N/AMarco Rubio 9% N/A 9% N/A 9% N/A N/A N/ADonald Trump 64% N/A 63% N/A 62% N/A N/A N/ASomeone else * N/A * N/A * N/A N/A N/ANone/No one 3% N/A 4% N/A 4% N/A N/A N/ANo opinion 2% N/A 1% N/A 1% N/A N/A N/ASampling Error +/-6.5 +/-8.0 +/-8.5
Demo- Indep- Repub- Lib- Mod- Conser-Total crat endent lican eral erate vative----- ----- ------ ------ ----- ----- -------
Jeb Bush 1% N/A N/A 1% N/A N/A *Ben Carson 5% N/A N/A 5% N/A N/A 5%Ted Cruz 13% N/A N/A 14% N/A N/A 21%Jim Gilmore * N/A N/A * N/A N/A *John Kasich 2% N/A N/A 2% N/A N/A 3%Marco Rubio 9% N/A N/A 11% N/A N/A 8%
Donald Trump 64% N/A N/A 63% N/A N/A 57%Someone else * N/A N/A * N/A N/A *None/No one 3% N/A N/A 2% N/A N/A 4%No opinion 2% N/A N/A 1% N/A N/A 2%Sampling Error +/-6.5 +/-7.0 +/-8.0
* percentage less than 1%
8/20/2019 Cnn Orc Nevada Poll 2-17-16
http://slidepdf.com/reader/full/cnn-orc-nevada-poll-2-17-16 32/45
POLL -32- February 10-15, 20163
Nevada CNN/ORC International Poll -- February 10 to 15, 2016Question RP4CNow I'm going to read you a few phrases which describe the candidates, and for each one, tell me
which Republican candidate you think that phrase best describes, regardless of who you are votingfor. Which Republican candidate do you think:
C. Is most likely to change the way things work in Washington
Base = Republican likely caucus goers
RestWashoe Clark of
Total Cnty Cnty States----- ------ ------ ------
Jeb Bush 1% N/A 1% N/ABen Carson 5% N/A 7% N/ATed Cruz 13% N/A 10% N/AJim Gilmore * N/A * N/AJohn Kasich 2% N/A 4% N/AMarco Rubio 9% N/A 6% N/ADonald Trump 64% N/A 67% N/ASomeone else * N/A * N/ANone/No one 3% N/A 5% N/ANo opinion 2% N/A 1% N/ASampling Error +/-6.5 +/-8.0
* percentage less than 1%

8/20/2019 Cnn Orc Nevada Poll 2-17-16
http://slidepdf.com/reader/full/cnn-orc-nevada-poll-2-17-16 33/45
POLL -33- February 10-15, 20163
Nevada CNN/ORC International Poll -- February 10 to 15, 2016Question DM1If the Democratic presidential caucus in Nevada were held today,please tell me which of the following people you would be most likely to support.
Base = Democratic likely caucus goers
White WhiteTotal Men Women White Non-White Men Women----- ----- ----- ----- --------- ------ ------
Hillary Clinton 48% N/A 54% 46% N/A N/A N/ABernie Sanders 47% N/A 38% 44% N/A N/A N/ASomeone else 1% N/A 1% * N/A N/A N/ANone/No one * N/A * * N/A N/A N/ANo opinion 5% N/A 7% 9% N/A N/A N/ASampling Error +/-6.0 +/-7.5 +/-8.0
18- 35- 50- Under 55 andTotal 34 49 64 65+ 55 Older----- ----- ----- ----- ----- ----- ------
Hillary Clinton 48% N/A N/A N/A N/A 38% 69%Bernie Sanders 47% N/A N/A N/A N/A 56% 26%Someone else 1% N/A N/A N/A N/A * 1%None/No one * N/A N/A N/A N/A * *No opinion 5% N/A N/A N/A N/A 6% 3%Sampling Error +/-6.0 +/-8.5 +/-8.0
NonUnder $50K College College Sub-
Total $50K or more Grad Grad Urban urban Rural----- ----- ------- ------- -------- ----- ----- -----
Hillary Clinton 48% N/A 48% N/A 45% N/A 52% N/ABernie Sanders 47% N/A 49% N/A 49% N/A 42% N/ASomeone else 1% N/A 1% N/A 1% N/A 1% N/ANone/No one * N/A * N/A * N/A * N/ANo opinion 5% N/A 3% N/A 5% N/A 5% N/ASampling Error +/-6.0 +/-8.5 +/-8.0 +/-8.5
Demo- Indep- Repub- Lib- Mod- Conser-Total crat endent lican eral erate vative----- ----- ------ ------ ----- ----- -------
Hillary Clinton 48% 53% N/A N/A N/A N/A N/ABernie Sanders 47% 41% N/A N/A N/A N/A N/ASomeone else 1% 1% N/A N/A N/A N/A N/ANone/No one * * N/A N/A N/A N/A N/ANo opinion 5% 5% N/A N/A N/A N/A N/ASampling Error +/-6.0 +/-6.5
RestWashoe Clark of
Total Cnty Cnty States----- ------ ------ ------
Hillary Clinton 48% N/A 48% N/ABernie Sanders 47% N/A 47% N/ASomeone else 1% N/A 1% N/ANone/No one * N/A * N/ANo opinion 5% N/A 4% N/ASampling Error +/-6.0 +/-6.5
* percentage less than 1%

8/20/2019 Cnn Orc Nevada Poll 2-17-16
http://slidepdf.com/reader/full/cnn-orc-nevada-poll-2-17-16 34/45
POLL -34- February 10-15, 20163
Nevada CNN/ORC International Poll -- February 10 to 15, 2016Question DM2Have you definitely decided who you will support in the Nevada Democratic caucus,are you leaning toward someone, or have you considered some candidates but arestill trying to decide?
Base = Democratic likely caucus goers
White WhiteTotal Men Women White Non-White Men Women----- ----- ----- ----- --------- ------ ------
Definitely decided 62% N/A 60% 67% N/A N/A N/ALeaning toward someone 13% N/A 11% 15% N/A N/A N/AStill trying to decide 25% N/A 29% 17% N/A N/A N/ANo opinion * N/A * 1% N/A N/A N/ASampling Error +/-6.0 +/-7.5 +/-8.0
18- 35- 50- Under 55 andTotal 34 49 64 65+ 55 Older----- ----- ----- ----- ----- ----- ------
Definitely decided 62% N/A N/A N/A N/A 58% 71%Leaning toward someone 13% N/A N/A N/A N/A 14% 11%Still trying to decide 25% N/A N/A N/A N/A 28% 17%No opinion * N/A N/A N/A N/A * 2%Sampling Error +/-6.0 +/-8.5 +/-8.0
NonUnder $50K College College Sub-
Total $50K or more Grad Grad Urban urban Rural----- ----- ------- ------- -------- ----- ----- -----
Definitely decided 62% N/A 60% N/A 62% N/A 57% N/A
Leaning toward someone 13% N/A 16% N/A 12% N/A 17% N/AStill trying to decide 25% N/A 24% N/A 26% N/A 25% N/ANo opinion * N/A * N/A * N/A 1% N/ASampling Error +/-6.0 +/-8.5 +/-8.0 +/-8.5
Demo- Indep- Repub- Lib- Mod- Conser-Total crat endent lican eral erate vative----- ----- ------ ------ ----- ----- -------
Definitely decided 62% 63% N/A N/A N/A N/A N/ALeaning toward someone 13% 12% N/A N/A N/A N/A N/AStill trying to decide 25% 26% N/A N/A N/A N/A N/ANo opinion * * N/A N/A N/A N/A N/ASampling Error +/-6.0 +/-6.5
RestWashoe Clark of
Total Cnty Cnty States
----- ------ ------ ------Definitely decided 62% N/A 62% N/ALeaning toward someone 13% N/A 11% N/AStill trying to decide 25% N/A 26% N/ANo opinion * N/A * N/ASampling Error +/-6.0 +/-6.5
* percentage less than 1%

8/20/2019 Cnn Orc Nevada Poll 2-17-16
http://slidepdf.com/reader/full/cnn-orc-nevada-poll-2-17-16 35/45
POLL -35- February 10-15, 20163
Nevada CNN/ORC International Poll -- February 10 to 15, 2016Question DM3ANow I'm going to mention a few issues and for each one, please tell me who you think would besthandle that issue if he or she were elected President. Please feel free to name a candidate evenif you may not be voting for that person. Which Democratic candidate do you think would do thebest job handling:
A. The economy
Base = Democratic likely caucus goers
White WhiteTotal Men Women White Non-White Men Women----- ----- ----- ----- --------- ------ ------
Hillary Clinton 48% N/A 53% 40% N/A N/A N/ABernie Sanders 47% N/A 42% 55% N/A N/A N/ASomeone else 2% N/A 1% * N/A N/A N/ANone/No one 1% N/A 1% * N/A N/A N/ANo opinion 2% N/A 3% 6% N/A N/A N/ASampling Error +/-6.0 +/-7.5 +/-8.0
18- 35- 50- Under 55 andTotal 34 49 64 65+ 55 Older----- ----- ----- ----- ----- ----- ------
Hillary Clinton 48% N/A N/A N/A N/A 42% 60%Bernie Sanders 47% N/A N/A N/A N/A 53% 35%Someone else 2% N/A N/A N/A N/A 2% *None/No one 1% N/A N/A N/A N/A 1% 2%No opinion 2% N/A N/A N/A N/A 2% 3%Sampling Error +/-6.0 +/-8.5 +/-8.0
NonUnder $50K College College Sub-
Total $50K or more Grad Grad Urban urban Rural----- ----- ------- ------- -------- ----- ----- -----
Hillary Clinton 48% N/A 48% N/A 46% N/A 57% N/ABernie Sanders 47% N/A 44% N/A 50% N/A 40% N/ASomeone else 2% N/A 4% N/A * N/A 1% N/ANone/No one 1% N/A 1% N/A 2% N/A 1% N/ANo opinion 2% N/A 2% N/A 2% N/A 1% N/ASampling Error +/-6.0 +/-8.5 +/-8.0 +/-8.5
Demo- Indep- Repub- Lib- Mod- Conser-Total crat endent lican eral erate vative----- ----- ------ ------ ----- ----- -------
Hillary Clinton 48% 53% N/A N/A N/A N/A N/ABernie Sanders 47% 43% N/A N/A N/A N/A N/ASomeone else 2% * N/A N/A N/A N/A N/A
None/No one 1% 2% N/A N/A N/A N/A N/ANo opinion 2% 2% N/A N/A N/A N/A N/ASampling Error +/-6.0 +/-6.5
RestWashoe Clark of
Total Cnty Cnty States----- ------ ------ ------
Hillary Clinton 48% N/A 49% N/ABernie Sanders 47% N/A 46% N/ASomeone else 2% N/A 2% N/ANone/No one 1% N/A 2% N/ANo opinion 2% N/A 2% N/ASampling Error +/-6.0 +/-6.5
* percentage less than 1%

8/20/2019 Cnn Orc Nevada Poll 2-17-16
http://slidepdf.com/reader/full/cnn-orc-nevada-poll-2-17-16 36/45
POLL -36- February 10-15, 20163
Nevada CNN/ORC International Poll -- February 10 to 15, 2016Question DM3BNow I'm going to mention a few issues and for each one, please tell me who you think would besthandle that issue if he or she were elected President. Please feel free to name a candidate evenif you may not be voting for that person. Which Democratic candidate do you think would do thebest job handling:
B. Health care
Base = Democratic likely caucus goers
White WhiteTotal Men Women White Non-White Men Women----- ----- ----- ----- --------- ------ ------
Hillary Clinton 55% N/A 65% 50% N/A N/A N/ABernie Sanders 39% N/A 31% 48% N/A N/A N/ASomeone else 1% N/A 1% * N/A N/A N/ANone/No one 2% N/A * 1% N/A N/A N/ANo opinion 3% N/A 3% 1% N/A N/A N/ASampling Error +/-6.0 +/-7.5 +/-8.0
18- 35- 50- Under 55 andTotal 34 49 64 65+ 55 Older----- ----- ----- ----- ----- ----- ------
Hillary Clinton 55% N/A N/A N/A N/A 46% 72%Bernie Sanders 39% N/A N/A N/A N/A 46% 26%Someone else 1% N/A N/A N/A N/A 2% *None/No one 2% N/A N/A N/A N/A 2% 1%No opinion 3% N/A N/A N/A N/A 4% *Sampling Error +/-6.0 +/-8.5 +/-8.0
NonUnder $50K College College Sub-
Total $50K or more Grad Grad Urban urban Rural----- ----- ------- ------- -------- ----- ----- -----
Hillary Clinton 55% N/A 56% N/A 53% N/A 54% N/ABernie Sanders 39% N/A 39% N/A 41% N/A 39% N/ASomeone else 1% N/A 3% N/A * N/A * N/ANone/No one 2% N/A 2% N/A 2% N/A * N/ANo opinion 3% N/A * N/A 4% N/A 7% N/ASampling Error +/-6.0 +/-8.5 +/-8.0 +/-8.5
Demo- Indep- Repub- Lib- Mod- Conser-Total crat endent lican eral erate vative----- ----- ------ ------ ----- ----- -------
Hillary Clinton 55% 61% N/A N/A N/A N/A N/ABernie Sanders 39% 36% N/A N/A N/A N/A N/ASomeone else 1% * N/A N/A N/A N/A N/A
None/No one 2% 1% N/A N/A N/A N/A N/ANo opinion 3% 2% N/A N/A N/A N/A N/ASampling Error +/-6.0 +/-6.5
RestWashoe Clark of
Total Cnty Cnty States----- ------ ------ ------
Hillary Clinton 55% N/A 55% N/ABernie Sanders 39% N/A 37% N/ASomeone else 1% N/A 2% N/ANone/No one 2% N/A 2% N/ANo opinion 3% N/A 4% N/ASampling Error +/-6.0 +/-6.5
* percentage less than 1%

8/20/2019 Cnn Orc Nevada Poll 2-17-16
http://slidepdf.com/reader/full/cnn-orc-nevada-poll-2-17-16 37/45
POLL -37- February 10-15, 20163
Nevada CNN/ORC International Poll -- February 10 to 15, 2016Question DM3CNow I'm going to mention a few issues and for each one, please tell me who you think would besthandle that issue if he or she were elected President. Please feel free to name a candidate evenif you may not be voting for that person. Which Democratic candidate do you think would do thebest job handling:
C. Race relations
Base = Democratic likely caucus goers
White WhiteTotal Men Women White Non-White Men Women----- ----- ----- ----- --------- ------ ------
Hillary Clinton 58% N/A 62% 54% N/A N/A N/ABernie Sanders 38% N/A 32% 40% N/A N/A N/ASomeone else 1% N/A 2% 1% N/A N/A N/ANone/No one * N/A * * N/A N/A N/ANo opinion 3% N/A 4% 6% N/A N/A N/ASampling Error +/-6.0 +/-7.5 +/-8.0
18- 35- 50- Under 55 andTotal 34 49 64 65+ 55 Older----- ----- ----- ----- ----- ----- ------
Hillary Clinton 58% N/A N/A N/A N/A 50% 74%Bernie Sanders 38% N/A N/A N/A N/A 46% 22%Someone else 1% N/A N/A N/A N/A 2% 1%None/No one * N/A N/A N/A N/A * *No opinion 3% N/A N/A N/A N/A 3% 3%Sampling Error +/-6.0 +/-8.5 +/-8.0
NonUnder $50K College College Sub-
Total $50K or more Grad Grad Urban urban Rural----- ----- ------- ------- -------- ----- ----- -----
Hillary Clinton 58% N/A 57% N/A 56% N/A 66% N/ABernie Sanders 38% N/A 36% N/A 40% N/A 30% N/ASomeone else 1% N/A 3% N/A * N/A 1% N/ANone/No one * N/A * N/A * N/A * N/ANo opinion 3% N/A 4% N/A 3% N/A 2% N/ASampling Error +/-6.0 +/-8.5 +/-8.0 +/-8.5
Demo- Indep- Repub- Lib- Mod- Conser-Total crat endent lican eral erate vative----- ----- ------ ------ ----- ----- -------
Hillary Clinton 58% 62% N/A N/A N/A N/A N/ABernie Sanders 38% 34% N/A N/A N/A N/A N/ASomeone else 1% 1% N/A N/A N/A N/A N/A
None/No one * * N/A N/A N/A N/A N/ANo opinion 3% 3% N/A N/A N/A N/A N/ASampling Error +/-6.0 +/-6.5
RestWashoe Clark of
Total Cnty Cnty States----- ------ ------ ------
Hillary Clinton 58% N/A 56% N/ABernie Sanders 38% N/A 39% N/ASomeone else 1% N/A 2% N/ANone/No one * N/A * N/ANo opinion 3% N/A 3% N/ASampling Error +/-6.0 +/-6.5
* percentage less than 1%

8/20/2019 Cnn Orc Nevada Poll 2-17-16
http://slidepdf.com/reader/full/cnn-orc-nevada-poll-2-17-16 38/45
POLL -38- February 10-15, 20163
Nevada CNN/ORC International Poll -- February 10 to 15, 2016Question DM3DNow I'm going to mention a few issues and for each one, please tell me who you think would besthandle that issue if he or she were elected President. Please feel free to name a candidate evenif you may not be voting for that person. Which Democratic candidate do you think would do thebest job handling:
D. Foreign policy
Base = Democratic likely caucus goers
White WhiteTotal Men Women White Non-White Men Women----- ----- ----- ----- --------- ------ ------
Hillary Clinton 68% N/A 75% 73% N/A N/A N/ABernie Sanders 28% N/A 19% 21% N/A N/A N/ASomeone else 2% N/A 2% 3% N/A N/A N/ANone/No one * N/A * 1% N/A N/A N/ANo opinion 2% N/A 3% 2% N/A N/A N/ASampling Error +/-6.0 +/-7.5 +/-8.0
18- 35- 50- Under 55 andTotal 34 49 64 65+ 55 Older----- ----- ----- ----- ----- ----- ------
Hillary Clinton 68% N/A N/A N/A N/A 63% 82%Bernie Sanders 28% N/A N/A N/A N/A 33% 17%Someone else 2% N/A N/A N/A N/A 2% *None/No one * N/A N/A N/A N/A * *No opinion 2% N/A N/A N/A N/A 3% 1%Sampling Error +/-6.0 +/-8.5 +/-8.0
NonUnder $50K College College Sub-
Total $50K or more Grad Grad Urban urban Rural----- ----- ------- ------- -------- ----- ----- -----
Hillary Clinton 68% N/A 71% N/A 64% N/A 71% N/ABernie Sanders 28% N/A 26% N/A 32% N/A 21% N/ASomeone else 2% N/A 1% N/A 1% N/A 3% N/ANone/No one * N/A * N/A * N/A * N/ANo opinion 2% N/A 2% N/A 2% N/A 5% N/ASampling Error +/-6.0 +/-8.5 +/-8.0 +/-8.5
Demo- Indep- Repub- Lib- Mod- Conser-Total crat endent lican eral erate vative----- ----- ------ ------ ----- ----- -------
Hillary Clinton 68% 73% N/A N/A N/A N/A N/ABernie Sanders 28% 24% N/A N/A N/A N/A N/ASomeone else 2% 1% N/A N/A N/A N/A N/A
None/No one * * N/A N/A N/A N/A N/ANo opinion 2% 1% N/A N/A N/A N/A N/ASampling Error +/-6.0 +/-6.5
RestWashoe Clark of
Total Cnty Cnty States----- ------ ------ ------
Hillary Clinton 68% N/A 67% N/ABernie Sanders 28% N/A 29% N/ASomeone else 2% N/A 1% N/ANone/No one * N/A * N/ANo opinion 2% N/A 3% N/ASampling Error +/-6.0 +/-6.5
* percentage less than 1%

8/20/2019 Cnn Orc Nevada Poll 2-17-16
http://slidepdf.com/reader/full/cnn-orc-nevada-poll-2-17-16 39/45
POLL -39- February 10-15, 20163
Nevada CNN/ORC International Poll -- February 10 to 15, 2016Question DM3ENow I'm going to mention a few issues and for each one, please tell me who you think would besthandle that issue if he or she were elected President. Please feel free to name a candidate evenif you may not be voting for that person. Which Democratic candidate do you think would do thebest job handling:
E. Immigration
Base = Democratic likely caucus goers
White WhiteTotal Men Women White Non-White Men Women----- ----- ----- ----- --------- ------ ------
Hillary Clinton 56% N/A 66% 49% N/A N/A N/ABernie Sanders 37% N/A 28% 39% N/A N/A N/ASomeone else 2% N/A 3% 4% N/A N/A N/ANone/No one 1% N/A 1% 2% N/A N/A N/ANo opinion 4% N/A 2% 6% N/A N/A N/ASampling Error +/-6.0 +/-7.5 +/-8.0
18- 35- 50- Under 55 andTotal 34 49 64 65+ 55 Older----- ----- ----- ----- ----- ----- ------
Hillary Clinton 56% N/A N/A N/A N/A 51% 65%Bernie Sanders 37% N/A N/A N/A N/A 42% 29%Someone else 2% N/A N/A N/A N/A 3% 1%None/No one 1% N/A N/A N/A N/A * 4%No opinion 4% N/A N/A N/A N/A 5% 1%Sampling Error +/-6.0 +/-8.5 +/-8.0
NonUnder $50K College College Sub-
Total $50K or more Grad Grad Urban urban Rural----- ----- ------- ------- -------- ----- ----- -----
Hillary Clinton 56% N/A 52% N/A 53% N/A 55% N/ABernie Sanders 37% N/A 40% N/A 40% N/A 33% N/ASomeone else 2% N/A 2% N/A 2% N/A 4% N/ANone/No one 1% N/A 3% N/A 1% N/A 2% N/ANo opinion 4% N/A 3% N/A 4% N/A 6% N/ASampling Error +/-6.0 +/-8.5 +/-8.0 +/-8.5
Demo- Indep- Repub- Lib- Mod- Conser-Total crat endent lican eral erate vative----- ----- ------ ------ ----- ----- -------
Hillary Clinton 56% 59% N/A N/A N/A N/A N/ABernie Sanders 37% 34% N/A N/A N/A N/A N/ASomeone else 2% 2% N/A N/A N/A N/A N/A
None/No one 1% 2% N/A N/A N/A N/A N/ANo opinion 4% 3% N/A N/A N/A N/A N/ASampling Error +/-6.0 +/-6.5
RestWashoe Clark of
Total Cnty Cnty States----- ------ ------ ------
Hillary Clinton 56% N/A 53% N/ABernie Sanders 37% N/A 39% N/ASomeone else 2% N/A 2% N/ANone/No one 1% N/A 2% N/ANo opinion 4% N/A 5% N/ASampling Error +/-6.0 +/-6.5
* percentage less than 1%

8/20/2019 Cnn Orc Nevada Poll 2-17-16
http://slidepdf.com/reader/full/cnn-orc-nevada-poll-2-17-16 40/45
POLL -40- February 10-15, 20163
Nevada CNN/ORC International Poll -- February 10 to 15, 2016Question DM4ANow I'm going to read you a few phrases which describe the candidates, and for each one, tell me
which Democratic candidate you think that phrase best describes, regardless of who you are votingfor. Which Democratic candidate do you think:
A. Best represents the values of Democrats like yourself
Base = Democratic likely caucus goers
White WhiteTotal Men Women White Non-White Men Women----- ----- ----- ----- --------- ------ ------
Hillary Clinton 50% N/A 59% 38% N/A N/A N/ABernie Sanders 49% N/A 40% 60% N/A N/A N/ASomeone else 1% N/A * * N/A N/A N/ANone/No one * N/A * * N/A N/A N/ANo opinion 1% N/A 1% 2% N/A N/A N/ASampling Error +/-6.0 +/-7.5 +/-8.0
18- 35- 50- Under 55 andTotal 34 49 64 65+ 55 Older----- ----- ----- ----- ----- ----- ------
Hillary Clinton 50% N/A N/A N/A N/A 42% 65%Bernie Sanders 49% N/A N/A N/A N/A 57% 32%Someone else 1% N/A N/A N/A N/A 1% *None/No one * N/A N/A N/A N/A * 1%No opinion 1% N/A N/A N/A N/A * 2%Sampling Error +/-6.0 +/-8.5 +/-8.0
Non
Under $50K College College Sub-Total $50K or more Grad Grad Urban urban Rural----- ----- ------- ------- -------- ----- ----- -----
Hillary Clinton 50% N/A 46% N/A 49% N/A 57% N/ABernie Sanders 49% N/A 51% N/A 51% N/A 43% N/ASomeone else 1% N/A 2% N/A * N/A 1% N/ANone/No one * N/A * N/A * N/A * N/ANo opinion 1% N/A * N/A 1% N/A * N/ASampling Error +/-6.0 +/-8.5 +/-8.0 +/-8.5
Demo- Indep- Repub- Lib- Mod- Conser-Total crat endent lican eral erate vative----- ----- ------ ------ ----- ----- -------
Hillary Clinton 50% 56% N/A N/A N/A N/A N/ABernie Sanders 49% 44% N/A N/A N/A N/A N/ASomeone else 1% * N/A N/A N/A N/A N/ANone/No one * * N/A N/A N/A N/A N/A
No opinion 1% 1% N/A N/A N/A N/A N/ASampling Error +/-6.0 +/-6.5
RestWashoe Clark of
Total Cnty Cnty States----- ------ ------ ------
Hillary Clinton 50% N/A 52% N/ABernie Sanders 49% N/A 46% N/ASomeone else 1% N/A 1% N/ANone/No one * N/A * N/ANo opinion 1% N/A * N/ASampling Error +/-6.0 +/-6.5
* percentage less than 1%
8/20/2019 Cnn Orc Nevada Poll 2-17-16
http://slidepdf.com/reader/full/cnn-orc-nevada-poll-2-17-16 41/45
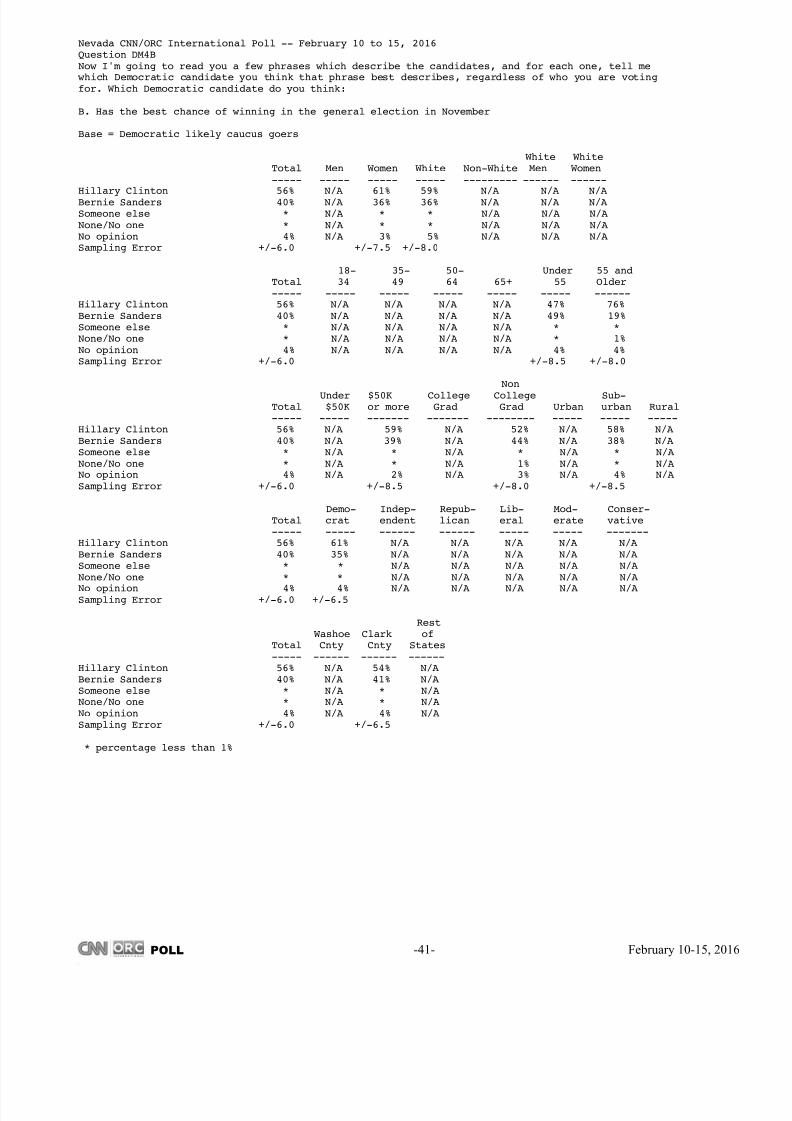
POLL -41- February 10-15, 20163
Nevada CNN/ORC International Poll -- February 10 to 15, 2016Question DM4BNow I'm going to read you a few phrases which describe the candidates, and for each one, tell me
which Democratic candidate you think that phrase best describes, regardless of who you are votingfor. Which Democratic candidate do you think:
B. Has the best chance of winning in the general election in November
Base = Democratic likely caucus goers
White WhiteTotal Men Women White Non-White Men Women----- ----- ----- ----- --------- ------ ------
Hillary Clinton 56% N/A 61% 59% N/A N/A N/ABernie Sanders 40% N/A 36% 36% N/A N/A N/ASomeone else * N/A * * N/A N/A N/ANone/No one * N/A * * N/A N/A N/ANo opinion 4% N/A 3% 5% N/A N/A N/ASampling Error +/-6.0 +/-7.5 +/-8.0
18- 35- 50- Under 55 andTotal 34 49 64 65+ 55 Older----- ----- ----- ----- ----- ----- ------
Hillary Clinton 56% N/A N/A N/A N/A 47% 76%Bernie Sanders 40% N/A N/A N/A N/A 49% 19%Someone else * N/A N/A N/A N/A * *None/No one * N/A N/A N/A N/A * 1%No opinion 4% N/A N/A N/A N/A 4% 4%Sampling Error +/-6.0 +/-8.5 +/-8.0
Non
Under $50K College College Sub-Total $50K or more Grad Grad Urban urban Rural----- ----- ------- ------- -------- ----- ----- -----
Hillary Clinton 56% N/A 59% N/A 52% N/A 58% N/ABernie Sanders 40% N/A 39% N/A 44% N/A 38% N/ASomeone else * N/A * N/A * N/A * N/ANone/No one * N/A * N/A 1% N/A * N/ANo opinion 4% N/A 2% N/A 3% N/A 4% N/ASampling Error +/-6.0 +/-8.5 +/-8.0 +/-8.5
Demo- Indep- Repub- Lib- Mod- Conser-Total crat endent lican eral erate vative----- ----- ------ ------ ----- ----- -------
Hillary Clinton 56% 61% N/A N/A N/A N/A N/ABernie Sanders 40% 35% N/A N/A N/A N/A N/ASomeone else * * N/A N/A N/A N/A N/ANone/No one * * N/A N/A N/A N/A N/A
No opinion 4% 4% N/A N/A N/A N/A N/ASampling Error +/-6.0 +/-6.5
RestWashoe Clark of
Total Cnty Cnty States----- ------ ------ ------
Hillary Clinton 56% N/A 54% N/ABernie Sanders 40% N/A 41% N/ASomeone else * N/A * N/ANone/No one * N/A * N/ANo opinion 4% N/A 4% N/ASampling Error +/-6.0 +/-6.5
* percentage less than 1%

8/20/2019 Cnn Orc Nevada Poll 2-17-16
http://slidepdf.com/reader/full/cnn-orc-nevada-poll-2-17-16 42/45
POLL -42- February 10-15, 20163
Nevada CNN/ORC International Poll -- February 10 to 15, 2016Question DM4CNow I'm going to read you a few phrases which describe the candidates, and for each one, tell me
which Democratic candidate you think that phrase best describes, regardless of who you are votingfor. Which Democratic candidate do you think:
C. Would do the most to help the middle class
Base = Democratic likely caucus goers
White WhiteTotal Men Women White Non-White Men Women----- ----- ----- ----- --------- ------ ------
Hillary Clinton 47% N/A 54% 38% N/A N/A N/ABernie Sanders 50% N/A 42% 59% N/A N/A N/ASomeone else 1% N/A * * N/A N/A N/ANone/No one 2% N/A 3% 1% N/A N/A N/ANo opinion 1% N/A 1% 1% N/A N/A N/ASampling Error +/-6.0 +/-7.5 +/-8.0
18- 35- 50- Under 55 andTotal 34 49 64 65+ 55 Older----- ----- ----- ----- ----- ----- ------
Hillary Clinton 47% N/A N/A N/A N/A 40% 60%Bernie Sanders 50% N/A N/A N/A N/A 56% 36%Someone else 1% N/A N/A N/A N/A 1% *None/No one 2% N/A N/A N/A N/A 2% 2%No opinion 1% N/A N/A N/A N/A 1% 2%Sampling Error +/-6.0 +/-8.5 +/-8.0
Non
Under $50K College College Sub-Total $50K or more Grad Grad Urban urban Rural----- ----- ------- ------- -------- ----- ----- -----
Hillary Clinton 47% N/A 44% N/A 46% N/A 53% N/ABernie Sanders 50% N/A 52% N/A 51% N/A 43% N/ASomeone else 1% N/A 1% N/A * N/A * N/ANone/No one 2% N/A 2% N/A 2% N/A 4% N/ANo opinion 1% N/A 1% N/A 1% N/A * N/ASampling Error +/-6.0 +/-8.5 +/-8.0 +/-8.5
Demo- Indep- Repub- Lib- Mod- Conser-Total crat endent lican eral erate vative----- ----- ------ ------ ----- ----- -------
Hillary Clinton 47% 52% N/A N/A N/A N/A N/ABernie Sanders 50% 47% N/A N/A N/A N/A N/ASomeone else 1% * N/A N/A N/A N/A N/ANone/No one 2% 1% N/A N/A N/A N/A N/A
No opinion 1% 1% N/A N/A N/A N/A N/ASampling Error +/-6.0 +/-6.5
RestWashoe Clark of
Total Cnty Cnty States----- ------ ------ ------
Hillary Clinton 47% N/A 47% N/ABernie Sanders 50% N/A 49% N/ASomeone else 1% N/A 1% N/ANone/No one 2% N/A 3% N/ANo opinion 1% N/A 1% N/ASampling Error +/-6.0 +/-6.5
* percentage less than 1%

8/20/2019 Cnn Orc Nevada Poll 2-17-16
http://slidepdf.com/reader/full/cnn-orc-nevada-poll-2-17-16 43/45
POLL -43- February 10-15, 20163
Nevada CNN/ORC International Poll -- February 10 to 15, 2016Question 5Which of the following issues will be MOST important to you when you decide how to vote forpresident?
Base = Total Sample
White WhiteTotal Men Women White Non-White Men Women----- ----- ----- ----- --------- ------ ------
Foreign policy 8% 10% 6% 8% 7% 9% 8%Illegal immigration 12% 13% 11% 13% 10% 17% 8%Health care 15% 12% 18% 16% 15% 14% 18%Social issues 7% 5% 9% 6% 9% 5% 9%Terrorism 13% 14% 13% 15% 13% 14% 15%The economy 38% 39% 37% 36% 40% 37% 36%Other 4% 4% 4% 3% 5% 2% 4%No opinion 3% 3% 3% 3% 3% 3% 2%Sampling Error +/-3.0 +/-4.5 +/-4.5 +/-3.5 +/-6.0 +/-5.0 +/-5.0
18- 35- 50- Under 55 andTotal 34 49 64 65+ 55 Older----- ----- ----- ----- ----- ----- ------
Foreign policy 8% 6% 8% 7% 11% 6% 10%Illegal immigration 12% 12% 9% 12% 14% 11% 13%Health care 15% 14% 18% 14% 14% 15% 15%Social issues 7% 12% 6% 5% 6% 8% 5%Terrorism 13% 12% 11% 14% 19% 12% 17%The economy 38% 38% 39% 43% 29% 40% 34%Other 4% 5% 4% 2% 3% 4% 3%No opinion 3% 1% 5% 2% 4% 3% 3%
Sampling Error +/-3.0 +/-8.0 +/-8.0 +/-5.5 +/-5.0 +/-5.0 +/-4.0
NonUnder $50K College College Sub-
Total $50K or more Grad Grad Urban urban Rural----- ----- ------- ------- -------- ----- ----- -----
Foreign policy 8% 8% 8% 11% 7% 6% 9% N/AIllegal immigration 12% 12% 12% 8% 13% 13% 11% N/AHealth care 15% 19% 11% 10% 16% 14% 15% N/ASocial issues 7% 11% 5% 9% 7% 7% 8% N/ATerrorism 13% 11% 11% 9% 15% 14% 13% N/AThe economy 38% 35% 48% 45% 37% 38% 38% N/AOther 4% 3% 3% 5% 3% 5% 3% N/ANo opinion 3% 1% 1% 3% 2% 3% 2% N/ASampling Error +/-3.0 +/-7.0 +/-5.5 +/-5.5 +/-4.0 +/-4.5 +/-5.0
Demo- Indep- Repub- Lib- Mod- Conser-
Total crat endent lican eral erate vative----- ----- ------ ------ ----- ----- -------
Foreign policy 8% 8% 7% 9% 10% 9% 6%Illegal immigration 12% 9% 11% 16% 7% 10% 17%Health care 15% 21% 14% 10% 17% 14% 11%Social issues 7% 11% 6% 5% 17% 6% 4%Terrorism 13% 8% 14% 19% 5% 15% 17%The economy 38% 39% 38% 36% 37% 41% 43%Other 4% 2% 6% 2% 5% 5% *No opinion 3% 1% 5% 2% 1% 1% 1%Sampling Error +/-3.0 +/-5.5 +/-5.0 +/-5.5 +/-8.0 +/-6.5 +/-6.5
RestWashoe Clark of
Total Cnty Cnty States----- ------ ------ ------
Foreign policy 8% 6% 8% 9%
Illegal immigration 12% 15% 12% 8%Health care 15% 17% 15% 12%Social issues 7% 9% 7% 4%Terrorism 13% 12% 13% 17%The economy 38% 34% 38% 43%Other 4% 6% 3% 2%No opinion 3% 2% 3% 3%Sampling Error +/-3.0 +/-7.0 +/-4.0 +/-8.5
* percentage less than 1%

8/20/2019 Cnn Orc Nevada Poll 2-17-16
http://slidepdf.com/reader/full/cnn-orc-nevada-poll-2-17-16 44/45
POLL -44- February 10-15, 20163
Nevada CNN/ORC International Poll -- February 10 to 15, 2016Question 5Which of the following issues will be MOST important to you when you decide how to vote forpresident?
Base = Republican likely caucus goers
White WhiteTotal Men Women White Non-White Men Women----- ----- ----- ----- --------- ------ ------
Foreign policy 8% 11% N/A 9% N/A N/A N/AIllegal immigration 20% 19% N/A 22% N/A N/A N/AHealth care 6% 5% N/A 5% N/A N/A N/ASocial issues 3% 2% N/A 3% N/A N/A N/ATerrorism 20% 18% N/A 23% N/A N/A N/AThe economy 39% 41% N/A 36% N/A N/A N/AOther 2% 3% N/A * N/A N/A N/ANo opinion 1% 1% N/A 2% N/A N/A N/ASampling Error +/-6.5 +/-8.5 +/-7.0
18- 35- 50- Under 55 andTotal 34 49 64 65+ 55 Older----- ----- ----- ----- ----- ----- ------
Foreign policy 8% N/A N/A N/A N/A N/A 6%Illegal immigration 20% N/A N/A N/A N/A N/A 22%Health care 6% N/A N/A N/A N/A N/A 7%Social issues 3% N/A N/A N/A N/A N/A 5%Terrorism 20% N/A N/A N/A N/A N/A 23%The economy 39% N/A N/A N/A N/A N/A 34%Other 2% N/A N/A N/A N/A N/A 1%No opinion 1% N/A N/A N/A N/A N/A 2%
Sampling Error +/-6.5 +/-7.5
NonUnder $50K College College Sub-
Total $50K or more Grad Grad Urban urban Rural----- ----- ------- ------- -------- ----- ----- -----
Foreign policy 8% N/A 11% N/A 4% N/A N/A N/AIllegal immigration 20% N/A 18% N/A 21% N/A N/A N/AHealth care 6% N/A 6% N/A 7% N/A N/A N/ASocial issues 3% N/A 2% N/A 5% N/A N/A N/ATerrorism 20% N/A 17% N/A 23% N/A N/A N/AThe economy 39% N/A 43% N/A 39% N/A N/A N/AOther 2% N/A 2% N/A * N/A N/A N/ANo opinion 1% N/A 1% N/A 1% N/A N/A N/ASampling Error +/-6.5 +/-8.0 +/-8.5
Demo- Indep- Repub- Lib- Mod- Conser-
Total crat endent lican eral erate vative----- ----- ------ ------ ----- ----- -------
Foreign policy 8% N/A N/A 9% N/A N/A 8%Illegal immigration 20% N/A N/A 22% N/A N/A 21%Health care 6% N/A N/A 5% N/A N/A 4%Social issues 3% N/A N/A 4% N/A N/A 3%Terrorism 20% N/A N/A 21% N/A N/A 21%The economy 39% N/A N/A 37% N/A N/A 40%Other 2% N/A N/A 1% N/A N/A 1%No opinion 1% N/A N/A 1% N/A N/A 1%Sampling Error +/-6.5 +/-7.0 +/-8.0
RestWashoe Clark of
Total Cnty Cnty States----- ------ ------ ------
Foreign policy 8% N/A 7% N/A
Illegal immigration 20% N/A 25% N/AHealth care 6% N/A 8% N/ASocial issues 3% N/A 2% N/ATerrorism 20% N/A 16% N/AThe economy 39% N/A 38% N/AOther 2% N/A 2% N/ANo opinion 1% N/A 1% N/ASampling Error +/-6.5 +/-8.0
* percentage less than 1%
8/20/2019 Cnn Orc Nevada Poll 2-17-16
http://slidepdf.com/reader/full/cnn-orc-nevada-poll-2-17-16 45/45
Nevada CNN/ORC International Poll -- February 10 to 15, 2016Question 5Which of the following issues will be MOST important to you when you decide how to vote forpresident?
Base = Democratic likely caucus goers
White WhiteTotal Men Women White Non-White Men Women----- ----- ----- ----- --------- ------ ------
Foreign policy 10% N/A 8% 13% N/A N/A N/AIllegal immigration 7% N/A 5% 4% N/A N/A N/AHealth care 19% N/A 16% 25% N/A N/A N/ASocial issues 11% N/A 14% 11% N/A N/A N/ATerrorism 8% N/A 11% 3% N/A N/A N/AThe economy 42% N/A 44% 43% N/A N/A N/AOther 3% N/A * * N/A N/A N/ANo opinion 1% N/A 1% 2% N/A N/A N/ASampling Error +/-6.0 +/-7.5 +/-8.0
18- 35- 50- Under 55 andTotal 34 49 64 65+ 55 Older----- ----- ----- ----- ----- ----- ------
Foreign policy 10% N/A N/A N/A N/A 8% 13%Illegal immigration 7% N/A N/A N/A N/A 8% 5%Health care 19% N/A N/A N/A N/A 17% 24%Social issues 11% N/A N/A N/A N/A 13% 5%Terrorism 8% N/A N/A N/A N/A 7% 11%The economy 42% N/A N/A N/A N/A 44% 39%Other 3% N/A N/A N/A N/A 3% 1%No opinion 1% N/A N/A N/A N/A * 1%
Sampling Error +/-6.0 +/-8.5 +/-8.0
NonUnder $50K College College Sub-
Total $50K or more Grad Grad Urban urban Rural----- ----- ------- ------- -------- ----- ----- -----
Foreign policy 10% N/A 7% N/A 11% N/A 12% N/AIllegal immigration 7% N/A 7% N/A 9% N/A 7% N/AHealth care 19% N/A 20% N/A 20% N/A 19% N/ASocial issues 11% N/A 9% N/A 10% N/A 12% N/ATerrorism 8% N/A 2% N/A 10% N/A 8% N/AThe economy 42% N/A 51% N/A 36% N/A 41% N/AOther 3% N/A 3% N/A 3% N/A 3% N/ANo opinion 1% N/A 1% N/A 1% N/A * N/ASampling Error +/-6.0 +/-8.5 +/-8.0 +/-8.5
Demo- Indep- Repub- Lib- Mod- Conser-
Total crat endent lican eral erate vative----- ----- ------ ------ ----- ----- -------
Foreign policy 10% 9% N/A N/A N/A N/A N/AIllegal immigration 7% 8% N/A N/A N/A N/A N/AHealth care 19% 20% N/A N/A N/A N/A N/ASocial issues 11% 11% N/A N/A N/A N/A N/ATerrorism 8% 8% N/A N/A N/A N/A N/AThe economy 42% 42% N/A N/A N/A N/A N/AOther 3% 2% N/A N/A N/A N/A N/ANo opinion 1% 1% N/A N/A N/A N/A N/ASampling Error +/-6.0 +/-6.5
RestWashoe Clark of
Total Cnty Cnty States----- ------ ------ ------
Foreign policy 10% N/A 9% N/A
Illegal immigration 7% N/A 7% N/AHealth care 19% N/A 18% N/ASocial issues 11% N/A 10% N/ATerrorism 8% N/A 6% N/AThe economy 42% N/A 48% N/AOther 3% N/A 2% N/ANo opinion 1% N/A 1% N/ASampling Error +/-6.0 +/-6.5