cnn all screen review
TRANSCRIPT

CNN All Screen Review Presentation to CIMM 3rd Annual Cross-Platform Media Measurement Summit
Howard Shimmel- Turner Pete Doe- Nielsen

CNN All Screen:
Integrating Multiple Data Sources to Measure Cross-Platform Viewing
• Background
• Methodology
• Data Insights
• What’s Next

Turner Perspective:
What Do We Need in a Cross-Platform Solution?
• Link to currencies used to transact individual media
• Include all platforms
• Needs to provide a platform view, a program/content view, and a selling inventory view
• Should include both consumption and advertising for display, video, gaming
• Data needs to exist in systems that are used to analyze audience dynamics and develop integrated packages for our advertisers
• Planning data needs to be predictive of data used in post-analysis

CNN All Screen:
Background
Solution: Partnership with Nielsen to create best-in-class cross-platform measurement solution.

3 Media, 7 Data Sources, 3 Methods
Duplication
estimates
TV
in Home estimate
Mobile estimate
Online estimate
TV out of Home
estimate
①Nielsen
National
People Meter
Panel
②Nielsen
Audio Portable
People Meter
Panel
③Nielsen
Online Panel +
④Omniture
Server Data
⑤Nielsen
Mobile Panel +
⑥Bango
Server Data
⑦Online Survey of persons accessing CNN
via TV, Online or Mobile 18+

# Data Source Measures Sample size Demo details?
① Nielsen TV National People Meter Panel At home TV 54k Yes
② Nielsen Audio Portable People Meter panel Out of home TV 50k Yes
③ Nielsen Online RDD/Online Panel Online CNN Digital Brand 200k Yes
④ Nielsen Online Mobile EMM Panel Mobile CNN Digital Brand 6k Yes
⑤ Omniture online server data Online CNN.com census No
⑥ Bango mobile server data Mobile CNN.com + CNN app census No
⑦ Nielsen Custom All Media custom survey Cross-media duplication 1k Yes
Data Sources Summary:
7 data sources from 3 companies

Arbitron NPM fusion =
in + out of home TV viewing
PPM sample fused to NPM using Nielsen’s industry-accepted
Respondent-level data fusion methodology
NPM
with Fused Out of Home TV viewing (54k)
Fused Database
single respondent level database
with in home and out of home TV
viewing
Respondent-Level Matching
match on: demos, household characteristics, in home TV viewing
NPM Panel 54k Respondents
PPM Panel 50k Respondents
Inputs
Data source ①
Data source ②

Digital Estimates: Online example 2-step process
Step 1
0
10
20
30
40
50
Nielsen Online Panel monthly unique audience
Adjusted Nielsen monthly unique audience
Pe
rso
ns
2+
(mill
ion
s)
Feb ‘12 CNN Digital Brand Reach Estimates
CNN Digital Brand Nielsen Netview estimate (data source ③) scaled by adjustment factor from step 1
Step 2
0
5
10
15
20
25
30
Omniture: average daily uniques
Nielsen Online Panel monthly unique audience
NBD modeled monthly unique audience
Pe
rso
ns
2+
(mill
ion
s)
Feb ‘12 CNN.com Reach Estimates
• Estimate CNN.com monthly reach: model daily server data (data source ④) for using Negative Binomial Distribution (NBD)
• Compute adjustment factor: modeled server estimate ÷ Nielsen Online CNN.com estimate (data source ③)
Mobile methodology is the same using data sources ⑤ (mobile panel) and ⑥ (mobile server data)
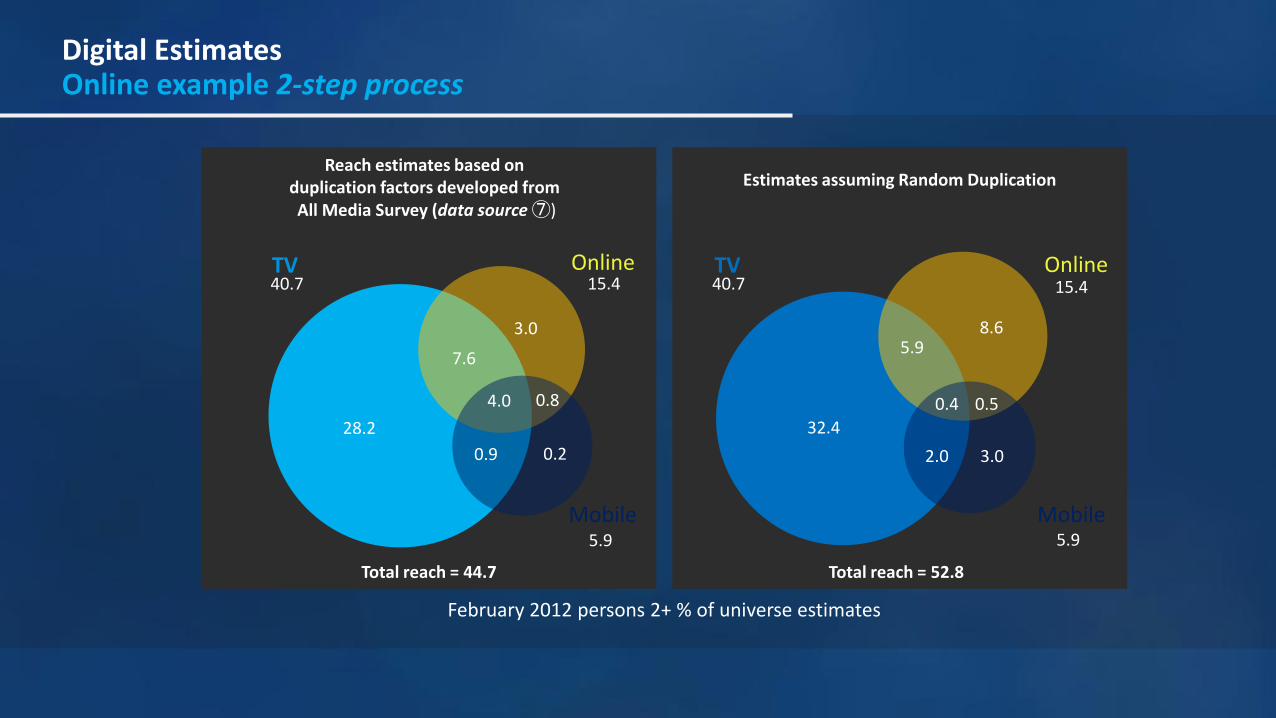
Estimates assuming Random Duplication
32.4
8.6
Online TV
Mobile
5.9
0.5
2.0
0.4
5.9
40.7 15.4
3.0
Total reach = 52.8
February 2012 persons 2+ % of universe estimates
Digital Estimates Online example 2-step process
Reach estimates based on duplication factors developed from All Media Survey (data source ⑦)
28.2
3.0
7.6
0.8
0.9
4.0
5.9
Online TV 15.4
0.2
40.7
Total reach = 44.7
Mobile
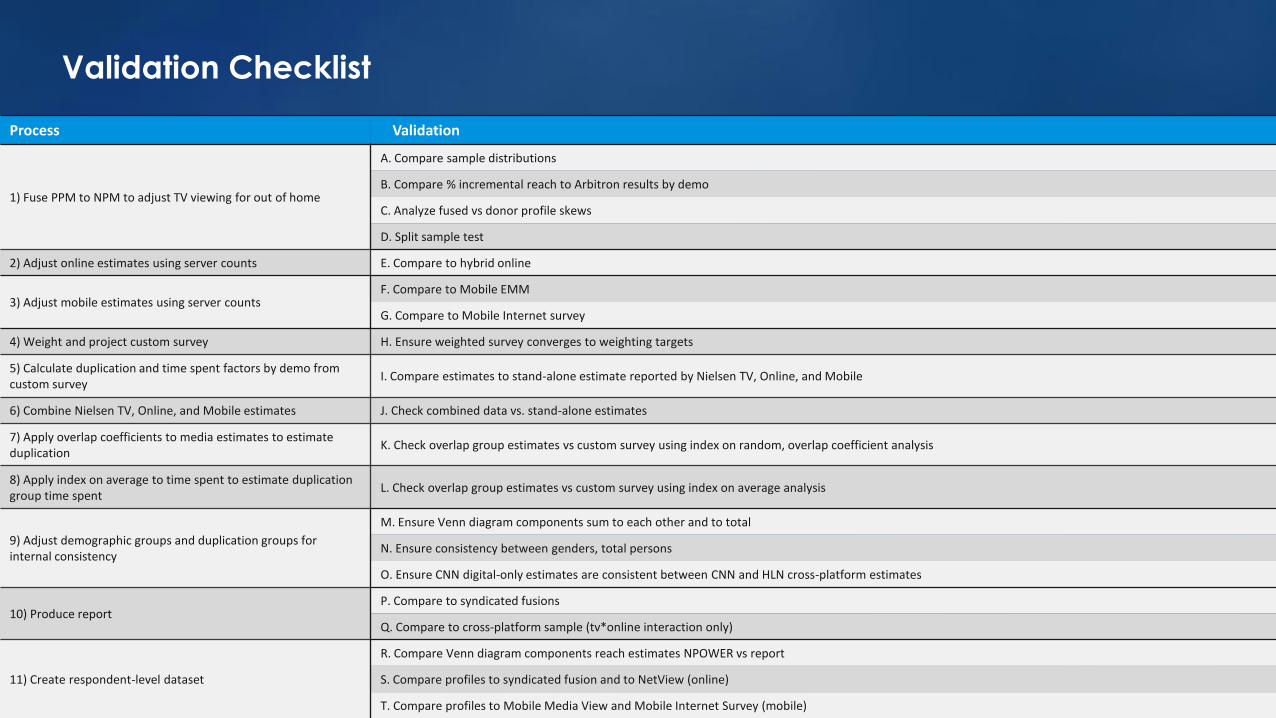
Validation Checklist
Process Validation
1) Fuse PPM to NPM to adjust TV viewing for out of home
A. Compare sample distributions
B. Compare % incremental reach to Arbitron results by demo
C. Analyze fused vs donor profile skews
D. Split sample test
2) Adjust online estimates using server counts E. Compare to hybrid online
3) Adjust mobile estimates using server counts F. Compare to Mobile EMM
G. Compare to Mobile Internet survey
4) Weight and project custom survey H. Ensure weighted survey converges to weighting targets
5) Calculate duplication and time spent factors by demo from custom survey
I. Compare estimates to stand-alone estimate reported by Nielsen TV, Online, and Mobile
6) Combine Nielsen TV, Online, and Mobile estimates J. Check combined data vs. stand-alone estimates
7) Apply overlap coefficients to media estimates to estimate duplication
K. Check overlap group estimates vs custom survey using index on random, overlap coefficient analysis
8) Apply index on average to time spent to estimate duplication group time spent
L. Check overlap group estimates vs custom survey using index on average analysis
9) Adjust demographic groups and duplication groups for internal consistency
M. Ensure Venn diagram components sum to each other and to total
N. Ensure consistency between genders, total persons
O. Ensure CNN digital-only estimates are consistent between CNN and HLN cross-platform estimates
10) Produce report P. Compare to syndicated fusions
Q. Compare to cross-platform sample (tv*online interaction only)
11) Create respondent-level dataset
R. Compare Venn diagram components reach estimates NPOWER vs report
S. Compare profiles to syndicated fusion and to NetView (online)
T. Compare profiles to Mobile Media View and Mobile Internet Survey (mobile)

CNN All Screen:
Data Insights — Monthly Measurement
OOH and Digital/Mobile Significantly Extends TV In-Home Reach for CNN
CNN Monthly A25-54 Reach (Mill)
TV In-Home TV In-Home and OOH TV In-Home, OOH, Digital, Mobile
Source: Nielsen Media Research, CNN All Screen Custom Reporting Period: December 2013
33
50
62
+52% +88%

CNN All Screen:
Data Insights — Monthly Measurement
OOH and Digital/Mobile Significantly Extends TV In-Home Reach for CNN
DEMO TV OOH LIFT % TV OOH / Digital / Mobile Lift %
P18-34 58% 101%
P25-54/ $100k+ 44% 69%
Source: Nielsen Media Research, CNN All Screen Custom Reporting Period: December 2013

CNN All Screen: Data Insights — Financial Services Campaign
OOH Extends Brand A’s In-Home TV Reach on CNN by Up to 43% % Lift: Addition to TV IN-HOME (Currency)
“Brand A” Campaign-Level Data: Reach (000s)
Source: Nielsen Media Research, CNN All Screen, Custom Campaign R&F
Campaign Dates: (8/10/12-9/9/12).
11
15
18
A25-54
In-Home TV Total TV (In-Home + OOH) CNN All Screen
+43% +70%

2013 NCAA Tournament Total Cross-Platform Audience:
Total = 187,894,000
Source: 2013 NCAA Cross-Platform Report provided by Nielsen. 3/19/13-4/8/13. Data sources: Nielsen, Arbitron, Omniture, Conviva, Bango, and Arbitron Out-of-Home data.
154,418
1,715 5,218
17,039 5,341
521
3,642
33.5 Million Digital Users

CNN All Screen: Current Status
• Incorporated CNN All Screen in CNN’s linear TV business • Added estimates of CNN OOH delivery to CNN sales plans
• Added actual CNN OOH delivery to MSA post buys
• In conversations with MRC about review of All Screen process • Due to XCR, less interest in marketplace in post-campaign reporting

CNN All Screen: Future Developments
• Improve alignment of Digital/Mobile reach with currency measurements
• Enhance Sales Planning capability
• Move from survey to other methodology to incorporate digital and mobile w/TV

Thank You!