cms.grcc.edu · web viewallow mobile phase to flush through the column for 15 minutes to ensure...
TRANSCRIPT

The Quick-Start Guide to theChemical Analysis
Instruments atGrand Rapids Community
College2nd Edition
By
0

Jennifer BattenTom Neils
Bernard Liburdand Bill Faber
1

Table of ContentsNuclear Magnetic Resonance (NMR) Page
Anasazi NMR…………………………..…………………………………………………….. 2
Infrared (IR) Spectroscopy
Jasco IR…………………………………………………………………………………….…… 4
Gas Chromatography (GC)
Agilent GC………………..…………………………………………………..………………. 5
Gas Chromatography/ Mass Spectrometry (GC-MS)
Agilent GC/MS………………………………………………………………………….…… 7
High-Performance Liquid Chromatography (HPLC)
Buck HPLC……………………………………………………………………………………. 10
Hitachi GPC………………………………………………………………………..……….. 12
Hitachi HPLC………………………………………………………………………………… 14
UV-vis Spectroscopy
Lambda 20 UV-vis…………………………………………………………………….…. 16
Ocean Optics UV-vis…………………………………………………………..……….. 17
Spec 20……………………………………………………………………………………….. 19
Karl Fisher Titrators
Model 701…………………………………………………………………………………… 20
Model 758…………………………………………………………………………………... 21
Differential Scanning Calorimetry
Mettler Toledo DSC 821e…………………………………………………………..… 23
Graphite Furnace and Atomic Absorption Spectroscopy (AAS)
Varian AAS…………………………………………………………………………………………... 25
Aurora Instruments………………………………………………………………….…….……. 27
The instruments included in this manual have far more capabilities than described in this guide, which is intended to get you started on sample and data analysis. Please enjoy your chemical
analysis and have fun learning and seeing what these instruments can do!
2

Nuclear Magnetic Resonance (NMR)
Anasazi NMR
Set- up
1. The password for this instrument is Anasazi.
2. Turn on pump that supplies air to the NMR by turning on the surge protector that it is on the floor next to the magnet. Turn on the computer monitor and restart the computer if it is not already on. Prepare a 1 mL sample that is about 5% ethylbenzene, 1 % TMS and the remainder chloroform-D (this sample is usually prepared and is the one with the blue NMR tube cap). Add this sample to an NMR tube and wipe the tube clean with a Kim-wipe. Put the NMR tube into the spinner. Remember that the wider end of the spinner goes up. Use the guide to correctly position the spinner on the NMR tube. To put the sample with the spinner into the NMR, flip the black lever on the NMR up to turn off the air. Drop the NMR tube with spinner into the instrument. Turn the air back on by putting the black lever back down. Use the flashlight to look inside the NMR to make sure the sample is spinning. If it is not, remove the sample by putting your hand over the sample hole to catch the sample as it exits and pushing the black button next to the black lever to eject the sample. Repeat the steps to put the sample in the instrument.
3. On the computer, click on the aii tab and then type shim. The computer will ask for a relaxation delay, type 5. Wait until the instrument is done shimming (about 5 minutes). Then set the TMS peak to zero by first typing ZG and press the Enter key twice. Wait until the data is collected as evident by a yellow (or red-sample to concentrated) line on the monitor screen. Click on NMR and hold down the a
3

key and then type 2. Use the mouse to drag the vertical line to the TMS peak (the one most to the right) and note the position of the peak in units of ppm (lower right corner). Click on aii and type fo. The computer will ask for the current position of the TMS peak, carefully enter the correct value including a – (negative) if necessary and hit the Enter key. When the computer asks for the desired position, type 0 (zero) and Enter. Remove the ethylbenzene sample from the NMR as described in the first step.
Data Collection
1. Wipe the NMR tube with a Kim-wipe. Put the NMR in the spinner as shown by your instructor. Remember that the wider end of the spinner goes up. Use the guide to correctly position the spinner on the NMR tube.
2. Flip the black lever on the NMR up to turn off the air. Drop the NMR tube with spinner into the instrument. Turn the air back on by putting the black lever back down. Use the flashlight to look inside the NMR to make sure the sample is spinning. If it is not, remove the sample by putting your hand over the sample hole to catch the sample as it exits and pushing the black button next to the black lever to eject the sample. Repeat the steps to put the sample in the instrument.
3. Once the sample is spinning, go to the computer. If the screen is not on the blue aii screen, click the tab that says aii at the bottom of the screen. Type zg and hit the Enter key twice. Your spectrum is now being collected. When a yellow (or red) line appears, your data collection is complete your sample can be removed so that the next person can put their sample into the NMR (step 2).
4. To work up your data, click on the NMR tab at the bottom of the screen. Hold down Ctrl and press F2. Click on open then OK. Type fb. Make sure the baseline (no peaks) is covered with red lines. The red lines can be turned on or off by clicking on them with the mouse. Then type L (lower case) and hit the Enter key. You can use the side bar on the right side of the screen to increase or decrease the size of your peaks. Type id to display the integrals. You may make the integrals larger or smaller by moving the side bar on the left side of the screen. Go to File and then Print.
5. If you have not already done so, remove you sample as described in step 2.
6. Pour your sample into the halogenated waste bottle. Rinse the NMR tube with acetone and put it on the instructor’s desk.
Shut Down
When the sample analysis is complete, turn off the air pump and the computer monitor. Please leave the computer on.
4
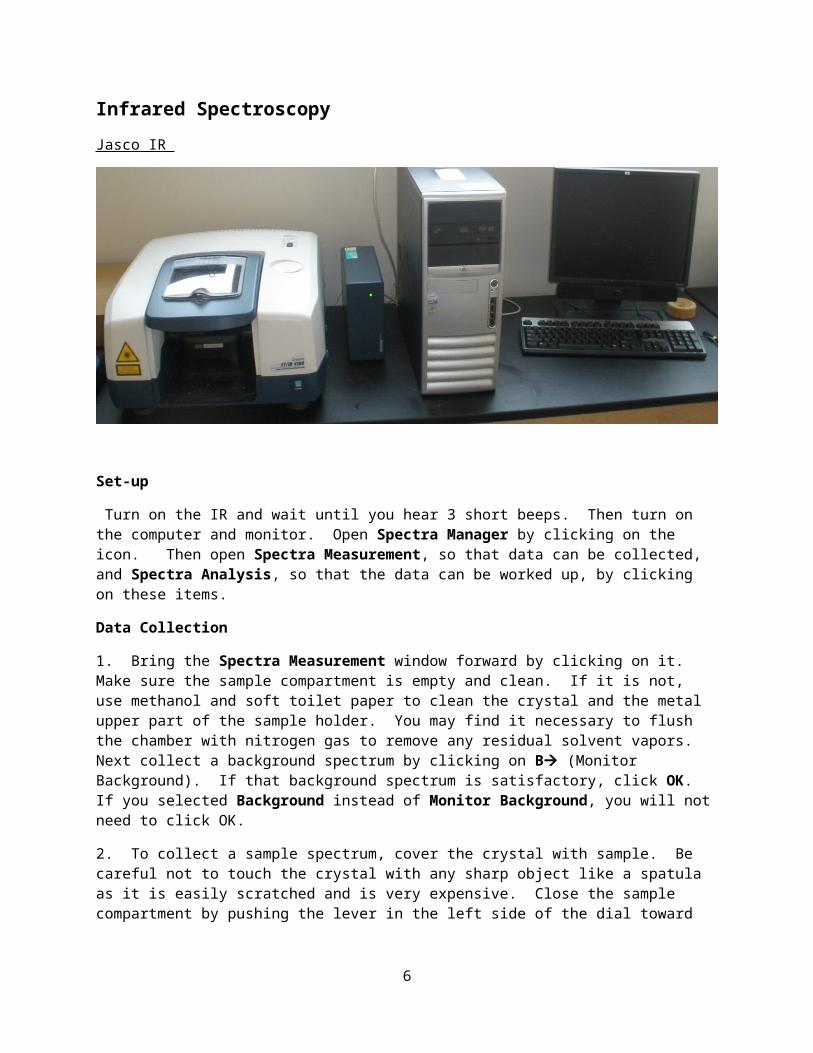
Infrared Spectroscopy
Jasco IR
Set-up
Turn on the IR and wait until you hear 3 short beeps. Then turn on the computer and monitor. Open Spectra Manager by clicking on the icon. Then open Spectra Measurement, so that data can be collected, and Spectra Analysis, so that the data can be worked up, by clicking on these items.
Data Collection
1. Bring the Spectra Measurement window forward by clicking on it. Make sure the sample compartment is empty and clean. If it is not, use methanol and soft toilet paper to clean the crystal and the metal upper part of the sample holder. You may find it necessary to flush the chamber with nitrogen gas to remove any residual solvent vapors. Next collect a background spectrum by clicking on B (Monitor Background). If that background spectrum is satisfactory, click OK. If you selected Background instead of Monitor Background, you will not need to click OK.
2. To collect a sample spectrum, cover the crystal with sample. Be careful not to touch the crystal with any sharp object like a spatula as it is easily scratched and is very expensive. Close the sample compartment by pushing the lever in the left side of the dial toward the dial and then move the dial forward. Rotate the dial clockwise until it comes to a natural stopping point (do not force).
3. After the sample has been added, click on S (Monitor Sample or Sample Measurement). If the spectrum is not what you expected, it is most likely that the sample compartment was not clean when the background was collected. If the spectrum is acceptable (or not) click OK. Go to File and select Analysis Send. Wait until the spectrum appears in the Spectra Measurement window.
4. Bring the Spectra Analysis window forward by clicking on the screen. To remove the CO2 peak, click on the No CO2 tab. In the range box area select the 2200-2400 cm-1 region and then OK. To number the peaks, click on the Peak Find icon (it looks like two black peaks with yellow tops). If not on already, check the upper and lower limit boxes. Two lines should spear on the spectrum. The lower limit line
5
may be at the very bottom of the screen. Move the lines up or down by clicking and dragging them. Any peak that is between these lines will be labeled. When the numbering is satisfactory, click Apply and then OK. To print the spectrum, go to File and then Print.
5. Clean the sample compartment by first unscrewing the dial in a counter clockwise direction and then pressing the lever toward the dial and pushing it backwards. Then clean the crystal with methanol and soft toilet paper.
Shut DownPlease turn off the IR and shutdown the computer when data collection is finished. Make sure the sample compartment is clean.
Gas Chromatography (GC)
Agilent GC
Set-up
1. Do not adjust the pressure control valves on the gas tanks connected to the GCs. Open the valves on top of the cylinders for the gasses (helium, air and hydrogen) that are connected to the gas chromatograph (GC). If you plan to use the 6890, open the second set of valves that are inline to this instrument. If you do not plan on using the 6890, please close these valves to save gas. Turn on the GC and then the computer. There is no password, so click Enter when this screen opens. Open the GC software by either clicking on the Instrument 1 online icon or by going to Start, then Programs, Chemstations, and Instrument 1 Online.
6

2. Once the software has opened, parameters can be set by going to the Instrument drop down menu and then selecting Quick Setup on the 6850 or Edit Parameters on the 6890. The parameters you may want to change are outline below:
Inlet- The split ratio is the amount of injected material that enters the column versus what portion is sent to the split vent. For example a 1:100 split ratio means that 1 part injected material enters the column while 99 parts is sent to waste. If your column appears overloaded, as evident by broad peaks, a higher split ratio may fix this problem. Another important parameter is the injection port temperature. The instrument is usually set to 300°C. The higher temperature means that more of the material immediately enters the vapor phase when injected, which leads to narrow peaks. If this temperature is set too high for an application, the analytes can decompose in the injection port.
Column- In this section the length, diameters and type of column in entered. This information should not need to be changed unless a new column is installed.
Oven-Under Oven, temperature of the oven and any ramp times are set. A good rule when setting the first set of conditions for a separation is to set the oven 10°C less than the boiling point of the lowest boiling point compound. The higher the oven temperature, the faster the analytes will elute from the column and the narrower the peaks will be, but the resolution of the peaks will be lost if the oven is too hot. Excessive heat can damage a column; each column has a maximum temperature (usually 250-300°C) that should never be exceeded. If your temperature does not change during a separation, be sure set a run time.
Detector-Under detector, the temperature of the FID detector can be set. The default is 250°C, which is fine for most applications. Excessive heat will reduce the lifespan of the detector.
If you change any parameter, you may click on the Apply tab. When, you are finished making changes, click on OK.
Making an Injection and Data Collection
1. Wait until the Green Ready signal appears in the upper left corner of the screen.
2. To prepare the sample for injection, first rinse the syringe with three small portions of your sample. Then load 0.5 – 1 micro liters of sample into the syringe. Then pull the syringe plunger back to add a 1 micro liter plug of air.
If you will use the data to find the percent of 2 or more components in a mixture or to simply determine sample purity, exact injection volumes or small air bubbles will not be an issue. However, if you plan to use the data to determine the concentration of an analyte in a mixture, it is highly recommended that you use the internal standard method for calibration as small injection errors can greatly influence results.
3. Guide the fragile syringe into the (hot) injection port. The syringe needle should be at least 2/3 down into the injection port. If there are two injection ports, use the back injection port for most applications. Gently but firmly, tap the plunger and then press the Start button on the GC. This action will begin data collection. Remove the syringe from the GC.
7

4. The run time can be viewed on the computer. Data collection can be stopped at any time by either clicking on the Stop tab or by going to the Run Control drop down menu and selecting Stop Run. When data collection is complete, either through a manual stop run or when the preset run time is complete, a report will be generated. Inspect the report and if it is satisfactory, click on the Print tab on the report.
The most common problem with GC data is split peaks; this problem is due to hesitation while making an injection. To fix this problem, the sample analysis must be repeated with better injection technique.
5. The next injection can be made when the Ready is again green.
Shutdown
When GC analysis is complete, to prevent column damage the oven must be cooled before the carrier gas is turned off. Go to the Instrument dropdown menu to Quick setup and under Oven, change the temperature to 40°C and click on Apply. When the oven has cooled, the software can be closed. It is not necessary to save your methods. The Cag bootp may need to be shut down as well (see bottom bar for tab on the 6850) before shutting down the computer and then the instrument. Remember to turn off the gases by closing all of the valves. Clean the syringes with acetone or an alcohol.
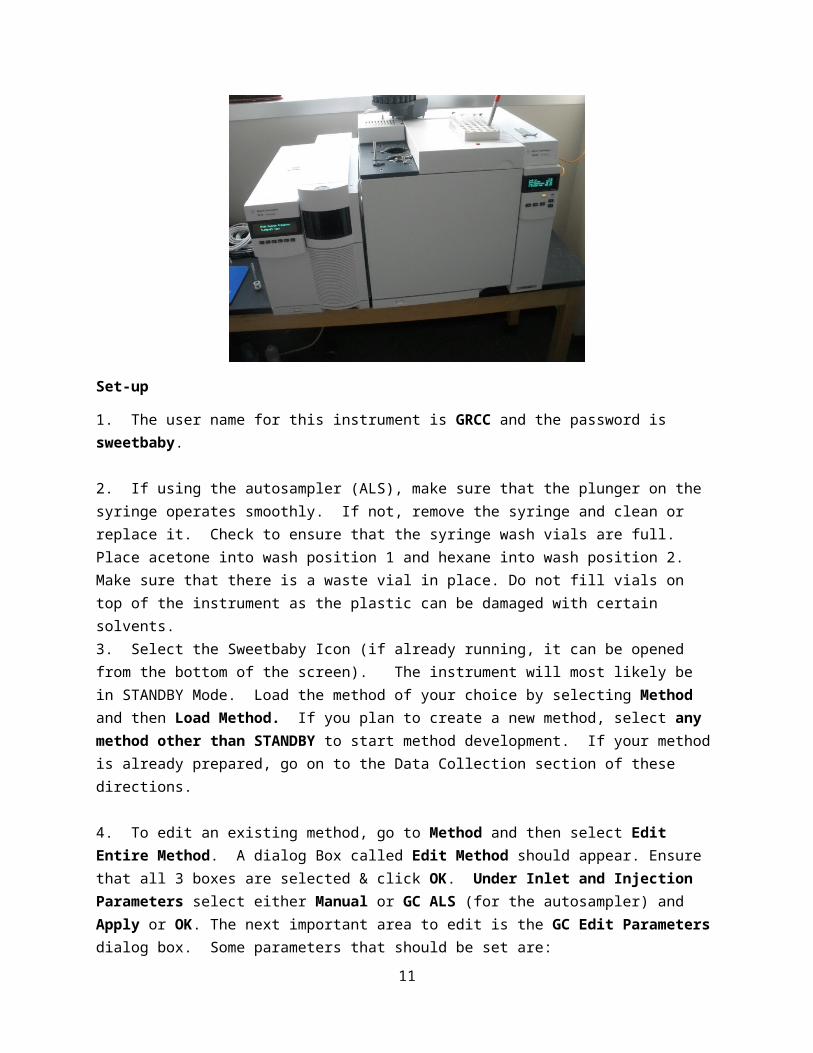
Gas Chromatography-Mass Spectrometry
Agilent GC-MS
Set-up
1. The user name for this instrument is GRCC and the password is sweetbaby.
2. If using the autosampler (ALS), make sure that the plunger on the syringe operates smoothly. If not, remove the syringe and clean or replace it. Check to ensure that the syringe wash vials are full. Place acetone into wash position 1 and hexane into wash position 2. Make sure that there is a waste vial in place. Do not fill vials on top of the instrument as the plastic can be damaged with certain solvents.
8

3. Select the Sweetbaby Icon (if already running, it can be opened from the bottom of the screen). The instrument will most likely be in STANDBY Mode. Load the method of your choice by selecting Method and then Load Method. If you plan to create a new method, select any method other than STANDBY to start method development. If your method is already prepared, go on to the Data Collection section of these directions.
4. To edit an existing method, go to Method and then select Edit Entire Method. A dialog Box called Edit Method should appear. Ensure that all 3 boxes are selected & click OK. Under Inlet and Injection Parameters select either Manual or GC ALS (for the autosampler) and Apply or OK. The next important area to edit is the GC Edit Parameters dialog box. Some parameters that should be set are:
1. ALS: Set the syringe cleaning and sampling technique in this dialog box. Two washes with each solvent before and after analysis should be sufficient. Wash the syringe with sample at least 2 times.
2. Ovens: Set your GC Parameters based on your sample mixture. Make sure that the oven box is checked so that the oven is turned on. Check your run time to make sure that it is appropriate for your sample.
3. Inlets: Set the split ratios. A 1:400 ratio means less compound enters the column than a 1:10 ratio.
4. Select OK when finished
5. On the next 2 dialog boxes, click “OK.”6. In the dialog box “MS SIM/Scan Parameters” set the following:
Solvent delay: Set the time here so that the MS part of instrument turns on after the solvent has passed through. This time is usually 1-2 minutes. Scan Parameters: Set the following Mass Spectrometer parameters
1. Starting Mass: 35.00amu (This avoids detection of water, N2 and O2.)2. End Mass: Select a mass to cover the range of the compounds to be analyzed.3. Click Close and click OK.
7. Under Dialog box Select Reports1. ensure that NO boxes are selected as much paper will be wasted,2. then, click OK.
8. Save Method as Yourmethod name.m then click “OK.”
Auto-Tune
It is good practice to auto-tune the mass spectrometer before use. This action is carried out by clicking on the “tuning fork” on the Sweetbaby screen. An auto-tune takes about 10 minutes.
9

Using the Autosampler
Place your vial into a slot (slots are numbered on the right of the slot, remember your slot number) and if there is no other sample currently running, the top right hand corner icon should be green and read Idle. If this is the case, you can run your sample. Click the green arrow to proceed. Change “Data File Name” to yoursamplename#.d. The “.d” tells the program what type of file this is being saved as. Change Vial Number to the vial chamber number in which you placed it. Click OK & Run Method to begin your run. Dialog box titled “Acquisition” will pop up. Do not close it.
Manual Injection
1. If there is no other sample currently running, the top right hand corner icon should be green & read Idle. If this is the case, you can run your sample. Click the green arrow to proceed. Change Data File Name to yoursamplename#.d. The “.d” tells the program what type of file this is being saved as. Click OK & Run Method to begin your run. Wait until the dialog box appears that says the GC-MS is ready.
2. To prepare the sample for injection, first rinse the syringe with three small portions of your sample. Then, load 0.5 – 1 micro liters of sample into the syringe. Pull the syringe plunger back to add a 1 micro liter plug of air.
If you will use the data to find the percent of 2 or more components in a mixture or to simply determine sample purity, exact injection volumes or small air bubbles will not be an issue. However, if you plan to use the data to determine the concentration of an analyte in a mixture, it is highly recommended that you use the internal standard method for calibration as small injection errors can greatly influence results.
3. Guide the fragile syringe into the (hot) injection port. The syringe needle should be at least 2/3 down into the injection port. Gently but firmly, tap the plunger and then press the Start button on the GC. This action will begin data collection. Remove the syringe from the GC.
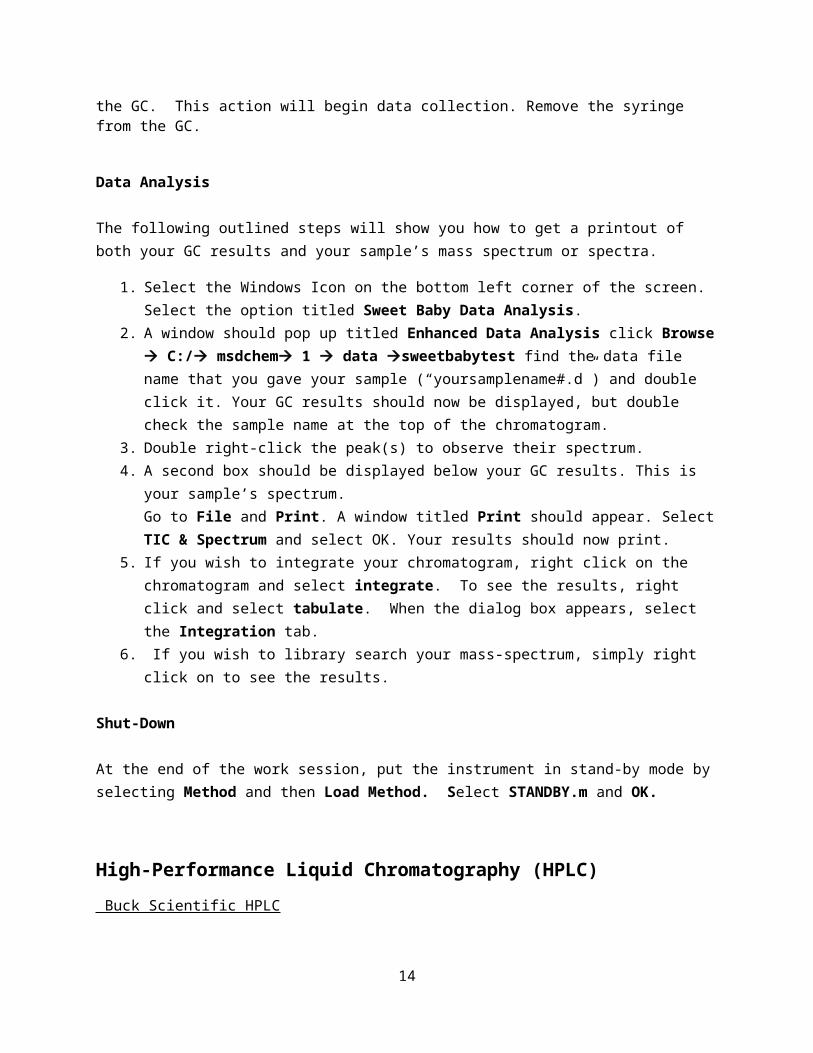
Data Analysis
The following outlined steps will show you how to get a printout of both your GC results and your sample’s mass spectrum or spectra.
1. Select the Windows Icon on the bottom left corner of the screen. Select the option titled Sweet Baby Data Analysis.
2. A window should pop up titled Enhanced Data Analysis click Browse C:/ msdchem 1 data sweetbabytest find the data file name that you gave your sample (“yoursamplename#.d”) and double click it. Your GC results should now be displayed, but double check the sample name at the top of the chromatogram.
3. Double right-click the peak(s) to observe their spectrum.4. A second box should be displayed below your GC results. This is your sample’s spectrum.
10
Go to File and Print. A window titled Print should appear. Select TIC & Spectrum and select OK. Your results should now print.
5. If you wish to integrate your chromatogram, right click on the chromatogram and select integrate. To see the results, right click and select tabulate. When the dialog box appears, select the Integration tab.
6. If you wish to library search your mass-spectrum, simply right click on to see the results.
Shut-Down
At the end of the work session, put the instrument in stand-by mode by selecting Method and then Load Method. Select STANDBY.m and OK.
High-Performance Liquid Chromatography (HPLC)
Buck Scientific HPLC
Set-up
1. Turn on the instrument (both the communicator and the HPLC) and then the computer. There is no password, so just click on OK. Open the Peak Simple software by double clicking on the icon.
2. Prepare mobile phase and place it in the ultrasonic bath for 10 minutes.
3. Place the line (with frit) for the mobile phase into the mobile phase. Attach a large syringe to the Prime/Purge Valve and open the valve by turning it counterclockwise. Press the prime button and draw mobile phase into the syringe. When there is no air apparent in the mobile phase line, push the prime button again to turn it off. Close the valve by turning it clockwise and remove the syringe. The fluid in the syringe should be added to the waste bottle. If column installation is necessary make sure that there is flow to the column inlet before installation.
11

4. Start the pump by pushing the Run/Start button. Adjust the parameters (flow rate, wavelength, and attenuation) to the desired values. Make sure the line exiting the UV-vis detector is in the waste bottle.
Injection and Data Analysis
1. Turn the Injection Valve below the white Sample Injection Port to Load. The sample loop is 20 microliters; you should inject 200 microliters of sample into the Sample Injection Port. This action will overload the loop and the excess will exit to the waste bottle. Do not inject air into the sample loop as this may damage the column.
2. Make sure that the baseline is stable by watching for large changes in the absorbance value and press the Auto zero button. If the instrument is sufficiently warmed up (30 min.), the baseline is usually stable.
3. Turn the dial to the Inject position. This action will inject the sample and begin data collection by the computer. When the sample has eluted from the column as evident by the detection of peaks. Use the mouse to open Acquisition and then click on Stop.
4. Mark the peaks that you wish to have recognized by the software by placing the mouse on top of that peak, right clicking, and drop down to Add component. Repeat as needed. You may remove any excess peaks by right clicking on the blue line, drop down to Delete component.
5. Print the chromatogram and data by clicking on File, Print and Print (not ok) again. Check your data to make sure that the desired data is in the report.
Shutdown
Allow mobile phase to flush through the column for 15 minutes to ensure that all components have eluted from the column. When you are finished, turn off the convertor box, the HPLC unit and the computer. Flush the syringe with clean solvent. If this instrument is not to be used in the near future remove and cap the column and dispose of the mobile phase and waste.
12
Hitachi Gel-Permeation Chromatograph (GPC)
Set-up
1. Turn on the integrator on the Hitachi GPC, and then turn on the autosampler, column oven, detector, and pump (by pressing the power buttons). The instrument needs to warm up for 60 minutes before it can be used.
2. Check the level of chloroform in solvent reservoir A and the syringe wash reservoir. Add more solvent if needed (make sure it is HPLC grade).
3. Check the auto sampler syringe to make sure that there is mobile phase flowing to it by removing the cover on the right side of the autos ampler and while you are watching the syringe, press the Wash button on the auto sampler. Make sure that there is solvent flow to the syringe and that there are no air bubbles in the lines. The wash procedure maybe repeated. If the syringe is dry, unscrew the tubing from the left side of the syringe and use a large screw on syringe to pull mobile phase to the syringe. Reattach the tubing. Gloves and goggles should be worn during this procedure.
4. Make sure that the solvent selection on the pump is 100% solvent A and the flow rate is 1 mL/min. If necessary, change the solvent or flow rate by pressing Manual Set on the pump. Set solvent B, C, and D to zero and the flow rate to 1 then, press enter until you are back at the original screen.
13
5. To purge the system open the white valve in the pump module by turning it to the right. Turn the pump on by pressing the Pump On/Off button (not the power button) and purge the system for a few minutes by pressing Purge. As the system purges, check the solvent lines to make sure there are no air bubbles. When there is no air in the lines, stop purging by pressing purge again and after the flow is stable, turn the white valve switch back to the left. The pump should now have a flow rate of 1 mL/ min.
6. If the column is not in-line, it is now time to install it. Make sure that there is mobile phase flow up to the column inlet, turn off the pump and attach the column using the finger or wrench tightened fittings. Turn the pump back on.
7. Set the column oven to 26°C by pressing set/monit. If it doesn’t read 26 then press the up or down buttons until it does.
8. Set the UV-vis detector to 254 nm (for most applications). While waiting for the oven and UV lamp to heat up you should prepare your samples for analysis.
Sample Preparation and Standard Preparation
1. The following mixed polystyrene standards are available for analysis:
Standard Label
Molecular Weights(g/mol)
A 300,00030,000104 (styrene that has not been polymerized)
B 200,00017,5002,500
C 100,0009,000
D 50,0005,000
2. Dissolve about 5 mg of your sample or mixed standard into about 5 mL of HPLC grade chloroform. GPC columns can be easily clogged so it is very important to remove any particulate or dust from the sample. To do this, you must draw the solution into a syringe and then put a syringe filter on the syringe. Obtain an autosampler vial and fill the vial by injecting the solution from the syringe, through the filter into the vial. Put a seal on the cap (white side up) and close the vial.
Auto-sampler and Integrator Setup and Sample Analysis
1. Put the vials in the autosampler rack starting in spot number 1 (top left) and continue adding to the right. Press Set-up on the autosampler and then press Enter. Make sure the screen says under Vials 1-X, where X is the number of vials you have placed in the autosampler. If it doesn’t, press Enter once and then press X. Press enter until it asks if this is the last step. Press one (which means yes) and press Enter. You should be back to a home screen.
2. Now press REPORT PLOT on the integrator. Arrow over to Chromato on the first screen and press Enter. Set chart speed to 5. Press Enter until the screen Peak Label appears, and arrow over to TIME and press enter. When Time Scale Plot appears, arrow to yes and press Enter. Press enter until you
14

return back to the home screen then go back to REPORT PLOT and arrow over until Chromato & Data are highlighted. Press enter and then Escape. You should be back at the home screen.
3. Press STOP TIME and 15 and Enter. Press Plot Attn (attenuation) 5 and Enter (larger attenuation=small peaks). You may also need to set the offset to 20 or higher by pressing Offset and the desired number and then Enter.
4. Make sure the detector is reading an absorbance of 0.0000. If not, press the AUTO ZERO on the detector and wait a few minutes. The detector should not drift (slowly change absorbance) when pure mobile phase is passing through it and if the instrument is sufficiently warmed up.
5. When you are ready to collect data, press Start on the autosampler. This step will begin the data collection and should produce print outs of the chromatograms that you can use for data analysis.
Shut down
Allow mobile phase to flush through the column for 15 minutes to ensure that all analytes have eluted from the column. When you are finished, turn off the integrator, each module and the degasser. If the instrument is not to be used for some time, remove the column and cap it and dispose of the mobile phase and waste. (Chloroform waste is collected and reused.)
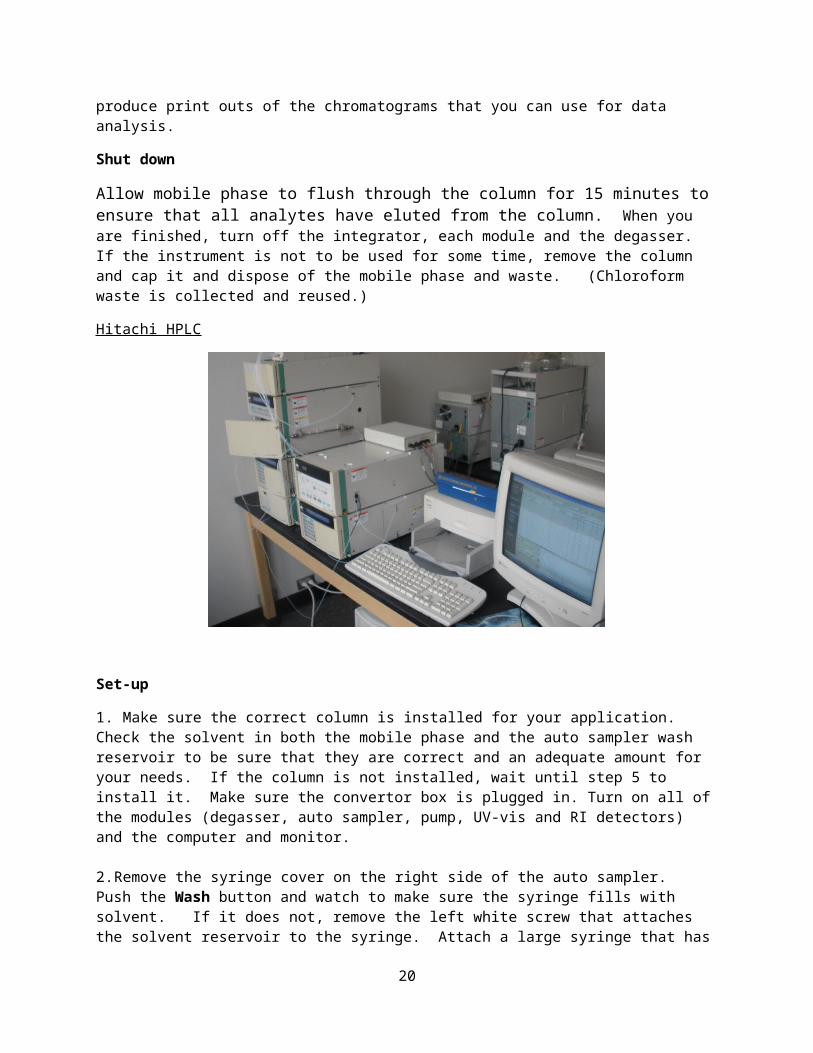
Hitachi HPLC
Set-up
1. Make sure the correct column is installed for your application. Check the solvent in both the mobile phase and the auto sampler wash reservoir to be sure that they are correct and an adequate amount for your needs. If the column is not installed, wait until step 5 to install it. Make sure the convertor box is plugged in. Turn on all of the modules (degasser, auto sampler, pump, UV-vis and RI detectors) and the computer and monitor.
15

2. Remove the syringe cover on the right side of the auto sampler. Push the Wash button and watch to make sure the syringe fills with solvent. If it does not, remove the left white screw that attaches the solvent reservoir to the syringe. Attach a large syringe that has a screw adaptor to the line and draw back on the syringe until the solvent flows. Reattach the screw to the syringe.
3. To set up the mobile phase flow, push the Set Program button on the pump and then push Enter until the Time %B %C %D screen appears. Set the percent of solvent B and C that you require (the percent of A will be the remainder of 100%) and the flow rate. Press enter when done. A new screen will appear, if you wish to carry out a gradient elution (not recommended) add the second solvent mixture ratios, otherwise press Escape.
4. To prime the pump, open the white valve on the pump by turning it to the right. Turn the pump on by pressing the Pump on/off button, then press the Purge button. When air is no longer apparent in the line, turn the purge off by again pressing the Purge button. When the flow rate is stable, turn the purge valve to the left to close it.
5. If the column is not in-line, it is now time to install it. Make sure that there is mobile phase flow up to the column inlet, turn off the pump and attach the column using the finger or wrench tightened fittings. Turn the pump back on.
6. Turn the on the purge on the RI detector (this allows flow to the reference cell) by pressing the purge button. Check to make sure that the desired wavelength is set on the UV-vis detector. Both the RI and UV-vis detector should be allowed to warm up for 20 minutes.
7. On the computer, open the Empower Login Icon. The login is system and the password is manager. Drop down the Advanced menu and select Quick Start. Then click on OK. When the method screen opens, click OK and do not change the defaults. Close the Empower Help Screen by clicking on X.
Note: Sometimes the autos ampler will beep. If it does, push the escape button.
Sample Injection
1. Click on the Run Sample tab on the left side of the screen. To prepare for injection, click on the inject icon or go to the drop down Inject menu and click on Make Injection. Enter the name of the sample and the run time and click Inject. The computer will now ready itself to collect data.
2. Make sure there is a sample in the auto sampler slot 1. Press the Escape button on the auto sampler. Turn off the purge on the RI detector and make sure the optical balance is green. If the optical balance is not green, press the auto zero button. If the absorbance reading on the UV-vis detector is not 0.00, press the auto zero button. Make sure the pump is on and that there is flow to the waste bottle. You are now ready to inject.
3. Press the Start button on the pump. This action will start the auto sampler and begin data collection. Data can be monitored by watching the computer screen. Satin 1 is the RI detector and Satin 2 is the UV-vis detector. The data collection will stop when the run time that you selected ends. You may end data collection earlier using the Inject drop down menu and selecting Abort.
16

Data Analysis
1. Click on the Browse Project tab on the left side of the screen and then click Update. Double click on the data you would like to view. You will now be under the View Data part of the software.
2. To select peaks for integration, add a baseline to them by using the mouse to click at the beginning of the base of the peak and sweeping to the end of the base of the peak and then releasing the mouse button. Repeat for each peak that you would like to integrate.
3. To print your data and/or chromatogram right click on the data table/chromatogram and select Print.
Shut Down
Allow mobile phase to flush through the column for 15 minutes to ensure that all analytes have eluted from the column. When you have completed your analysis, turn off all modules and the degasser and shut down the computer. If the instrument will not be used in the near future, unplug the convertor box and remove and cap the column. Discard the mobile phase and waste in the appropriate waste container.
UV-vis Spectroscopy
Lambda 20 UV-vis
Set-up
1. Turn on the instrument and then the computer. Open the Lambda 20 software by clicking on the icon.
17

2. Select a method (which may be modified) by clicking on it. Click on the following tabs to set the desired parameters.
Scan: Select the start and end wavelengths as well as the absorbance or %T minimum or maximum (under ordinate max/min).Instrument: Set the Scan Speed and the Ordinate Mode (usually Absorbance).Sample: Set the number of samples to be run in between each background scan. Sample names can also be designated.
3. If the method has changed and you would like to save it, go to File, Save, rename the method and click OK.
Data Collection
1. Click the Start tab. The instrument will prompt you to place solvent into two matched cuvettes and put them in the reference (back) and sample (front) compartments of the instrument. Then, click OK. When the scan is complete, the instrument software will prompt you to replace the contents of the front cuvet with the sample to be analyzed. After you have done this, click OK. When this scan is complete the instrument will prompt you to add the next sample. If you are finished collecting data, click Cancel and then OK.
2. To print selected data, drop down the View menu to Remove all curves. The drop down the View menu again to Add spectrum. Select the spectra that you wish to print by double clicking on it. To add the lambda max value to your curve, click on the third icon from the right near the top of the screen, add your desired parameters and click on OK. Drop down the View menu again and select Copy to Report Builder. This action will copy your spectra to a new report screen. To print, drop down the File menu on the Report Builder Screen and select Print. Close the Report Builder Screen by clicking on X. To run the next sample, click on Start and repeat step 1.
Shut Down
When you are finished, close the software under File and Exit, click Exit again if you do not wish to save any data, shut down the computer and turn off the spectrometer. Rinse the cuvettes with an appropriate solvent (never clean plastic cuvettes with acetone) and return them to their storage box.
Ocean Optics Spectrometer
Set-up and Data Collection
1. Turn on the computer. Double click on the OOIBase V 1.5 icon.
2. Maximize both of the boxes that appear on the screen by clicking on the icon in the upper right corner. You should now have a picture that looks like this:
18

3. Turn on the Xenon lamp; you will hear some clicking and then see this:
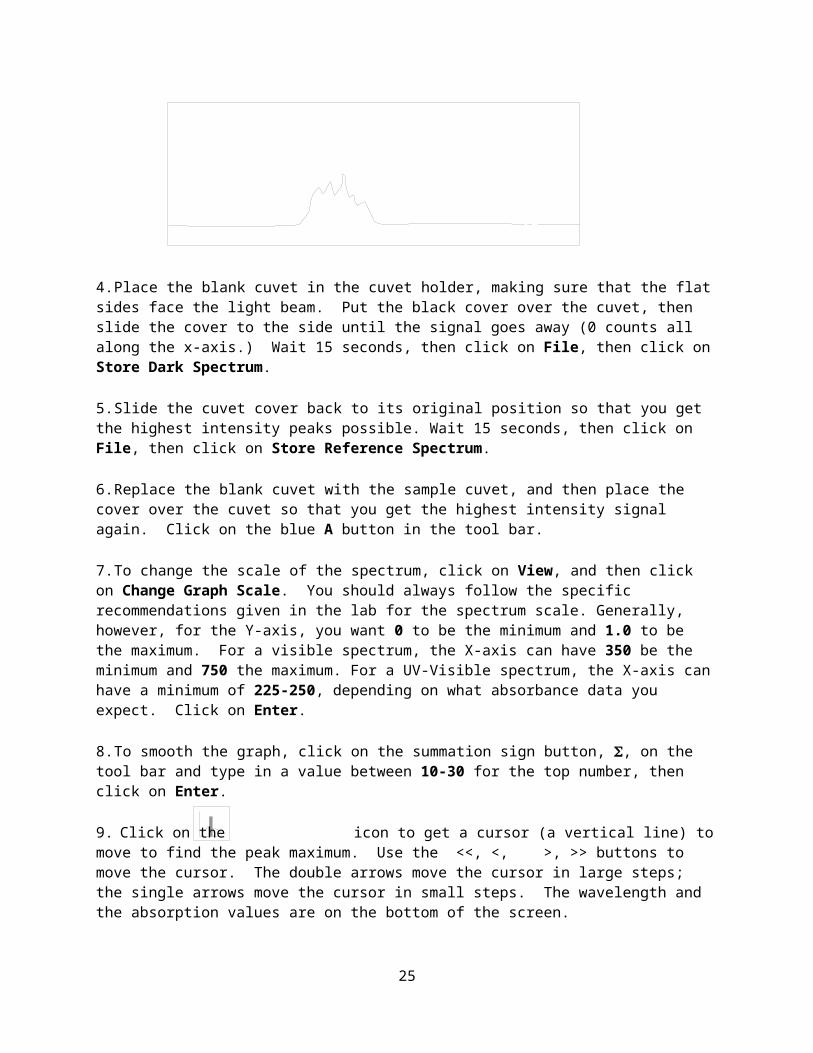
4. Place the blank cuvet in the cuvet holder, making sure that the flat sides face the light beam. Put the black cover over the cuvet, then slide the cover to the side until the signal goes away (0 counts all along the x-axis.) Wait 15 seconds, then click on File, then click on Store Dark Spectrum.
5. Slide the cuvet cover back to its original position so that you get the highest intensity peaks possible. Wait 15 seconds, then click on File, then click on Store Reference Spectrum.
6. Replace the blank cuvet with the sample cuvet, and then place the cover over the cuvet so that you get the highest intensity signal again. Click on the blue A button in the tool bar.
7. To change the scale of the spectrum, click on View, and then click on Change Graph Scale. You should always follow the specific recommendations given in the lab for the spectrum scale. Generally, however, for the Y-axis, you want 0 to be the minimum and 1.0 to be the maximum. For a visible spectrum, the X-axis can have 350 be the minimum and 750 the maximum. For a UV-Visible spectrum, the X-axis can have a minimum of 225-250, depending on what absorbance data you expect. Click on Enter.
8. To smooth the graph, click on the summation sign button, , on the tool bar and type in a value between 10-30 for the top number, then click on Enter.
9. Click on the icon to get a cursor (a vertical line) to move to find the peak maximum. Use the <<, <, >, >> buttons to move the cursor. The double arrows move the cursor in large steps; the single arrows move the cursor in small steps. The wavelength and the absorption values are on the bottom of the screen.
10. When you are finished with your experiment, turn off the Xenon lamp, exit the Ocean Optics program and turn off the computer. Rinse out all of the cuvettes with distilled water and set out to dry. Never rinse the plastic cuvettes with acetone.
19
TRANSMITTANCEABSORBANCECONCENTRATIONFACTOR
Digital Display
Sample Holder
Power Switch/Zero Knob
100% T Knob
Wavelength Control Knob
Mode ButtonSpec-20
1. Turn on the instrument with the power switch/zero knob, which is located on the left side of the front face of the instrument.
2. Set the wavelength on the spectrometer with the wavelength control knob, which is located on the right hand side of the top of the instrument. (Some models have a filter switch at the lower left side of the front face. This switch can be set to “340-599” or “600-950”. Make sure that the switch is pushed to the side that includes the wavelength at which you are operating.)
3. Push the square, white "MODE" button until the red light next to "TRANSMITTANCE" lights up on the digital display.
4. Open the sample holder and make sure it is empty. Close the lid of the holder and then calibrate the spectrometer to 0% Transmittance by adjusting the power switch/zero knob until the digital display reads 0.000.
5. Fill a cuvet about 3/4 full of the blank, or reference solution (often, but not always, water.) Any moisture and fingerprints on the cuvet should be wiped off with a tissue. Handle only the lip of the cuvet when placing the cuvet into the spectrometer. Place the cuvet into the sample holder, making sure the vertical marking on the cuvet faces you. Close the lid of the sample holder.
6. Set the Transmittance reading to 100 by adjusting the 100%T knob, which is located on the right side of the front face of the instrument.
7. Remove the cuvet containing the blank solution and set it aside.
8. Push the square, white "MODE" button until the red light next to "ABSORBANCE" lights up on the digital display.
9. Fill a cuvet about 3/4 full of the solution that you are studying and place this cuvet into the sample holder and close the lid. When the reading stabilizes, record this Absorbance reading.
20

10. Repeat step 9 as many times as necessary to measure the absorbance of all of your samples.
11. When you are finished, rinse out and dry all cuvettes. Also turn off the spectrometer using the power switch/zero knob.
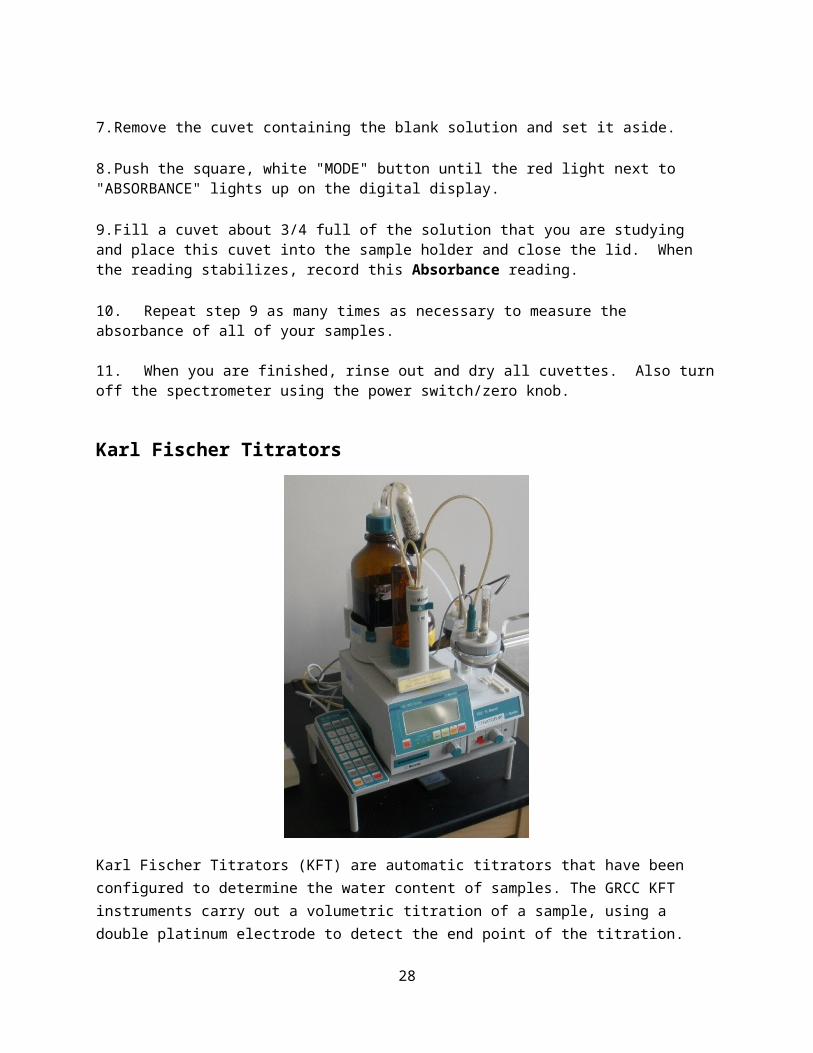
Karl Fischer Titrators
Karl Fischer Titrators (KFT) are automatic titrators that have been configured to determine the water content of samples. The GRCC KFT instruments carry out a volumetric titration of a sample, using a double platinum electrode to detect the end point of the titration. The instruments that you will use both have canned titration packages in their controlling computer, but the packages are slightly different.
Model 701
Titer determination
1. Press the <mode> button repeatedly until the display shows “TITER with H2O or std.” Press <enter> to enter this mode. The display will show “TITER *************”
2. Because the reaction vessel already contains the proper amount of solvent, you do not need to add any or remove any. Thus, you can push <START> (either one of them!) The cell will be dried (conditioned) while you wait. The green “cond.” light will flash until the cell is dry, and the display will show “TITER wait”. When dry, the green “cond.” light will remain lit and the display will show “TITER conditioning.”
21

3. You are now ready to obtain the titer of the KF reagent. Draw up about 20 µL of water into a 100 µL syringe and then record the mass of the syringe and water. Press <START> and the display should show “sampl size 1.0 g”. Add the water into the reaction vessel through the septum port and then reweigh the syringe and record its new mass. The difference in masses is the amount of water you added to the reaction vessel. Enter this number into the instrument with the numbers on the keypad, then press <enter>. The titration will now run. The display will show “KFR volume ↑ X.XXX mL” which shows you the volume that has been added and the progress of the reaction – as the bar gets shorter, the reaction is almost complete.
4. When the reaction is finished, the display will show “KFR volume X.XXX mL” and “titer X.XXX mg/ml”. A report will also print on the printer.
5. Perform two more titrations, using the procedure in step 4. After each titration, the printer will give you a readout with the individual trial data and also an average of the data from the trials you have done.
6. You are now ready to analyze an unknown sample. Press the <mode> button repeatedly until the display shows “KFT.” Press <enter> to enter this mode. The display will show “KFT conditioning”
7. Just to be safe, press <calc data>, then choose calculation, then press <enter> three times. This should give the display: “titer X.XXX” – the number should be the one just calculated. Press <quit> twice to go back to the main menu.
8. You are now ready to obtain the water content of the unknown. Draw up about 100 µL of the unknown into a 100 µL syringe and then record the mass of the syringe and liquid. Press <START> and the display should show “sampl size 1.0 g”. Add the unknown into the reaction vessel through the septum port and then reweigh the syringe and record its new mass. The difference in masses is the amount of unknown you added to the reaction vessel. Enter this number into the instrument with the numbers on the keypad, then press <enter>. The titration will now run. The display will show “KFR volume ↑ X.XXX mL” which shows you the volume that has been added and the progress of the reaction – as the bar gets shorter, the reaction is almost complete.
9. When the reaction is finished, the result will show up on the screen and a report will be printed for you.
10. Repeat step 8 as many times as necessary to get results with the precision and accuracy you desire.
11. When finished, rinse out the syringe with acetone and then distilled water and set it by the balance.
Model 758
1. Press the <mode> button repeatedly until the display shows “mode: KFT” and “measured quantity: Ipol”. Press <quit>.
2. Press <user meth> and then choose “recall method” using the ↓ arrow. Press <enter>. Under “method name” use the → arrow to get to “H2O Titer.” Press <enter> to enter this mode.
22

3. You are now ready to obtain the titer of the KF reagent. Draw up about 20 µL of water into a 100 µL syringe and then record the mass of the syringe and liquid. Press <START> once and wait for the display to show “drift OK” and for the green “cond” light to remain lit. Press <START> again and the display should show “sampl size 1.0 g”. Add the unknown into the reaction vessel through the septum port and then reweigh the syringe and record its new mass. The difference in masses is the amount of unknown you added to the reaction vessel. Enter this number into the instrument with the numbers on the keypad, then press <enter>.The titration will now run. The display will show a graph of the titration - giving the volume that has been added and the progress of the reaction.
4. When the reaction is completed, you will see the results on the display and a report will be printed for you.
5. Perform two more titrations, using the procedure in step 3. After each titration, the printer will give you a readout with the individual trial data and also an average of the data from the trials you have done.
6. You are now ready to obtain the water content of the unknown. Press <STOP>. Then press <user meth> and then choose “recall method” using the ↓ arrow. Press <enter>. Under “method name” use the → arrow to get to “KFLiquid.” Press <enter> to enter this mode.
7. Draw up about 100 µL of the unknown into a 100 µL syringe and then record the mass of the syringe and liquid. Press <START> once and wait for the display to show “drift OK” and for the green “cond” light to remain lit. Press <START> again and the display should show “sampl size 1.0g”. Add the unknown into the reaction vessel through the septum port and then reweigh the syringe and record its new mass. The difference in masses is the amount of unknown you added to the reaction vessel. Enter this number into the instrument with the numbers on the keypad, then press <enter>.The titration will now run.
8. When the reaction is finished, the result will show up on the screen and a report will be printed for you.
9. Repeat step 7 as many times as necessary to get results with the precision and accuracy you desire.
10. When finished, rinse out the syringe with acetone and then distilled water and set it by the balance.
23

Differential Scanning Calorimetry
Mettler Toledo DSC 821e
Set-up
1. Turn on the DSC. Then turn on the computer and monitor. Turn on the nitrogen gas and make sure the pressures are set to the correct pressure. Turn the knobs on the regulator to adjust accordingly (50 – left; 0 – middle; 200 – right).
2. Turn on the chiller using the switch on the front. The chiller is located underneath the DSC.
3. Press Alt+Ctrl+Delete to login. The username is stare. The password is weiqing1 (all lowercase).
Calibration
1. Double click on the STARe Software icon on the desktop, and then wait until you hear the DSC arm move. NOTE: Often times the instrument has an error at this point, turn off the instrument and close the software program (Click on the Database 1 window and select ‘system – exit’ to close the program). Then turn the instrument back on and open the software again.
2. Click on the DSC test280 intracooler window on the bottom of the screen. You are now ready to calibrate the instrument.
a. Prepare a DSC pan containing a piece of standard In (Indium)metal. Record the exact weight in mg.b. Pierce the pan lid and crimp the In in the pan.c. Place the crimped pan on the DSC auto-sampler carrousel in position 1 (which the software recognizes as '101').d. On the DSCtest280 intracooler window, click on the word SELECT next to the word METHOD and choose Calibrate DSC Temp Single... In. e. Click OK and give the sample a name and enter the mass in mg. Enter the position 101 even if it is already entered in the box.f. Click Send Experiment.
3. Once the instrument is calibrated, you may now create your own method and run any sample you desire.
24
4. Create a method by clicking next to METHOD and select NEW.
5. For a typical dynamic test, click ADD Dyn and enter your starting and ending temperature. They should be roughly 30-40⁰C above and below the known melting point of the sample.
6. Choose a heating rate of 10⁰C/min.
7. Save your method by any name desired.
8. Create your sample pan using the same method you used to create your standard In sample pan. Piece and crimp the lid and place in the carrousel. Make sure you know the mass in mg and the position number.
9. Go to METHOD and click on SELECT, then find the method you just created. Fill in the name, mass, position number and click send experiment.
Data Analysis
1. You can retrieve your data by clicking on Database 1 window and selecting function - evaluate. Once the evaluate window has appeared, select file – open curve and select your data.
2. You can find the onset value by selecting TA - onset, and moving the cursers to the desired positions to find your onset value.
3. You can find the area under the curve by selecting TA - Integration, and moving the cursers to the two ends of the curve.
4. Click on View and select Y-axis relative to get a graduated Y-axis on the curve.
5. Print your data by selecting file – Plot.
Shut Down Procedure
Turn off instrument, computer, chiller and gas when finished. Clean up the sample preparation area and return the standards and sample pans to their storage location.
25

Atomic Absorption
Aurora Instruments Graphite Furnace AAS
Set -up
Turn on both switches on the face of the ASS. Turn on computer and monitor. Turn on argon gas and adjust to 200 kPa in the cabinet. Check the water level in the cooling bath, and then turn it on. Make sure the water level is above the intake nozzle by unscrewing the top – add DI water if low.
Operation
1. Click on Aurora software icon on the desktop (Ai1100).
2. In the methods window, click on the box under the GF box and select the element you desire to analyze using graphite furnace, then click on a method.
3. The Method Development window should be on the left side of the screen, click on the Set Inst button on the top of this window to open the Spectrometer Setup window.
4. Click on the Transfer from method button and wait for the instrument to setup.
26

5. Check the HCL intensity in the upper right corner of the screen, if it is not around 50%, click on the Lamp Alignment button in the Spectrometer Setup window.
6. Click on the Auto Gain tab – this should raise or lower the HCL intensity to around 50%. If this doesn’t work, contact your instructor.NOTE: To change the wavelength of analysis complete the following:
a. In the Spectrometer Setup window click on Scan Wavelength.b. Enter the element symbol and wavelengths (roughly 10 nm above and below desired
wavelength).c. Once the scan is complete, use the cursor to find the peak absorbance value for the desired
wavelength. The bottom right hand corner of the screen will display this value.d. Record the wavelength and close the spectra window. e. Enter the wavelength recorded in the Spectrometer Setup box next to the word calibrate
and then click on calibrate.
7. Click on the Transfer to method tab and close the Spectrometer Setup window.
8. Start the gas flowing through the instrument by clicking on the OFF button next to the words Idle Gas: on the Method Development window.
9. Inject 10-50 μL of sample, using a micropipet, onto the furnace floor and click the single spectra icon at the top of the screen. This icon looks like a single absorption spectra.
10. Stand back from the instrument and don’t look directly at the furnace; make sure the path is not blocked by the pipet and then click OK to start data collection.
11. Read the height to get your maximum absorbance of the spectrum created. This value is found in the upper left hand corner of the window.
12. Let the instrument run through a cooling cycle and complete another sample run by returning to step 9.
Shut Down
Stop the gas flow by clicking on the ON button next to Idle Gas: on the Method Development window. Shut off cooling bath and turn off the gas in the cabinet, turn off instrument and computer.
27
Varian AAS
Set-up
1. Turn on the Varian Spectrometer using the toggle switch on the face of the instrument (push towards I; 0 is off). Then turn on the acetylene. First, twist the secondary valve counterclockwise to ensure no gas will go through the line when you turn on the main valve. Turn on the main valve - 3 turns. Turn the secondary valve until the acetylene pressure is between 10 and 14 psi.
2. Turn on the air valve on the back wall. Adjust the pressure between 35-55 psi.
3. Select cookbook using the up and down arrows on the keypad and then press enter. Choose the metal you desire to analyze and press enter. Make sure that the installed lamp is appropriate for the metal to be analyzed. Modify Instrument Parameters as needed – set the current to 12 mA.
4. Press Options and select measurement mode - adjust parameters as needed (Selecting Integrate allows you to take multiple runs per sample). Press Measurement Parameters on the key pad and select Integration, then set the instrument to Read Time = 3 seconds and Replicates = 3.
5. Press Optimize on the keypad, wait and then select HC Lamp. Adjust the lamp to optimize the signal (This should be fine unless the lamp was recently replaced). Align the beam using a business card to ensure the beam travels along the burner path.
6. Fill the water trap under the burner with purified RO water and make sure the tube runs to the waste container underneath the instrument. Next, press the ‘red’ button on the top left and then hold down the ‘black’ button to light the flame (No sample aspiration is necessary to start the flame).
7. Select Signal under Optimize and aspirate a blank sample. Press alt - read to zero the instrument.
28

Data Collection
1. Aspirate the standards. The appropriate way to measure standards is to measure from the least to the most concentrated standard, since this minimizes error due to incomplete flushing of the previous standard from the system. Read and record the absorbance value for each standard solution. When you switch from one sample to the next, wipe off the aspiration tube with a Kim wipe. Wipe downward on the tube to avoid getting particles in the tube.
2. Aspirate the sample that you would like to analyze and read the absorbance. Record the absorbance values for each solution. After completing your experiments, aspirate water for 30 seconds, then air for 30 seconds, then press the red button on the front left of the instrument to shut off the flame.
3. This process should be repeated, starting at step 3, for each metal that is to be analyzed.
Shut Down
When the analysis is complete, turn off gases at the valves (air and acetylene) and the instrument.
29