cme on final report - march 17on.cme-mec.ca/download.php?file=gc95me9a.pdf · management in ontario...
TRANSCRIPT

ODYNA
Canadian Manufacturers and Exporters 6725 Airport Road; Suite 200 Mississauga ON L4V 1V2; CanadaK2P 2G3 Tel: +1 (905) 672‐3466 Fax: +1 (905) 672‐1764 www.cme‐mec.ca
Advancing Opportunities in Energy Management in Ontario Industrial and Manufacturing Sector Final Report Submitted by: Canadian Manufacturers & Exporters In Association with: Stantec Consulting, Marbek, and ODYNA March 17, 2010 Revision 1

Advancing Opportunities in Energy Management in Ontario Industrial and Management Sector March 17, 2010
CME / Stantec / Marbek / ODYNA i
Acknowledgement Canadian Manufacturers and Exporters, together with the study team, acknowledge the significant contribution to the study by:
Natural Resources Canada Ontario Power Authority Ontario Ministry of Energy and Infrastructure Ontario Ministry of Environment Ontario Ministry of Economic Development and Trade Union Gas Enbridge Gas Distribution Hydro One

Advancing Opportunities in Energy Management in Ontario Industrial and Management Sector March 17, 2010
CME / Stantec / Marbek / ODYNA i
Executive Summary Background Energy management (EM) is increasingly being recognized as an important core strategy to help sustain the productive sectors of our economy and reduce industry’s negative impact on climate change. Canadian Manufacturers & Exporters (CME) is a long time and strong proponent of EM and retained Stantec Consulting and Marbek to conduct a study:
Advancing Opportunities in Energy Management in Ontario Industrial and Manufacturing Sector
The outcomes from this study fill critical knowledge gaps pertaining to EM potential in Ontario industry and provide the basis for public policy and program initiatives targeted to help Ontario industry increase its competitiveness and reduce greenhouse gas (GHG) and criteria air contaminant (CAC) emissions associated with energy use. The primary objectives of the study are to: determine the current energy management performance of the industrial sector; estimate the economic potential for energy management, together with the associated greenhouse gas (GHG) and criteria air contaminants (CACs) emission reduction; benchmark the GHG and CAC emissions associated with energy use in Ontario’s industrial sector; and develop a framework to accelerate the implementation of best practices and increase industry’s EM performance. This study focuses on the Ontario industrial and manufacturing sector and defines the sector by eleven sub‐sectors. The comprehensive methodology employed in this study is unique in that it integrates two critical areas of EM analysis, which are more commonly addressed separately: i) Energy management performance benchmarking; and ii) Energy management potentials analysis. EM performance benchmarking seeks to understand the relationship between the EM practices and the implementation of technical best practices. The EM potential scenario estimates the reduced amount of energy use compared to a Reference Case projection of energy use in Ontario industry from 2007 to 2030. A total of 148 plants participated in the energy performance benchmarking portion of the study and data was obtained through remote surveys, on‐site assessments and telephone interviews. In terms of participation, six sub‐sectors are very well represented, while three sub‐sectors have moderate representation and two sub‐sectors have limited or no representation. To ensure representative data was used in the EM potential analysis, data from secondary sources were used to supplement sub‐sectors with low or no representation.

Advancing Opportunities in Energy Management in Ontario Industrial and Management Sector March 17, 2010
CME / Stantec / Marbek / ODYNA ii
Energy Use Profile In 2007 Ontario’s industrial sector used an estimated total 732 PJ1 of energy; 640 PJ if biomass is excluded. Natural gas and electricity accounted for 38 percent and 22 percent of total energy use, respectively, while biomass accounted for an estimated 13 percent of total energy use. The ten largest sub‐sectors, by total energy use, accounted for close to 85 percent of Ontario industrial energy use. Close to 65 percent of the energy was used by industry for process heating, while motive power and air compressors accounted for close to 15 percent. The Reference Case total energy use is estimated to increase by about 16 percent from 2007 to 2030. In absolute terms the increase is close to 104 PJ. The largest increases in energy use are associated with four of the five largest sub‐sectors, by energy use: Primary Metal; Chemical; Non‐metallic Mineral Products; and Petroleum and Coal Products manufacturing. The Other Industry manufacturing sub‐sector shows the largest decrease in energy use. Implementation of Best Practices The energy performance benchmarking results illustrate a relatively low implementation of technical best practices (TBPs) in the Ontario industrial sector. The 75th percentile of TBP implementation by sub‐sector ranges from 31 to 42 percent. This means most of the plants have implemented less than 42 percent of applicable TBPs, and the opportunity exists for most companies to implement more than 58 percent of the TBPs. The end uses with the lowest levels of implemented TBPs are motive power, lighting, and cooling and refrigeration. Compressed air systems have the highest implementation of TBPs. The implementation of TBP by plant size indicates large plants have implemented, on average, close to 10 percent more TBPs than small and medium sized enterprises (SME). The most significant differences in TBP implementation were observed for lighting, process specific, and indirect process heating (e.g. boilers and steam system) end uses. Overall, 75 percent of plants have implemented less than 48 percent of the energy management best practices (MBPs). Among the sub‐sectors, relatively low implementation of MBPs was observed in: Primary Metal manufacturing; Other manufacturing; and Fabricated Metal manufacturing. Higher implementation rates of MBPs were observed in: Chemical manufacturing; Non‐metallic Mineral manufacturing; Transportation and Machinery manufacturing; and Food and Beverage manufacturing. These results indicate that, in general, plants manage and finance energy projects on an ad‐hoc basis, while best practices associated with continuous improvement are not widely implemented. This is reflected by the categories with lowest implementation of MBPs: Policy and Planning; Organization and Accountability; Monitoring, Reporting and Communication; and Training and Capacity building. The implementation of MBPs by plant size indicates that large plants have implemented, on average, close to 30 percent more MBPs than SMEs. The most significant differences in MBP implementation are observed in the Financing, Policy and Planning, and Monitoring categories. The energy performance benchmarking results indicate that plants that have implemented more than 75 percent of the MBPs, on average have implemented 42 percent of the applicable
1 1 Peta‐Joule (PJ) = 2.8 x 10⁵ MWh

Advancing Opportunities in Energy Management in Ontario Industrial and Management Sector March 17, 2010
CME / Stantec / Marbek / ODYNA iii
TBPs. Only five percent of all the plants fall into this top MBP quartile category. On the other hand, plants that have implemented less than 25 percent of the MBPs, on average, have implemented 25 percent of the applicable TBPs. Almost 50 percent of all the plants fall into this bottom quartile of the MBP category. These results illustrate the relationship of the degree of MBP implementation to that of TBP implementation, indicating that the implementation of the former encourages the implementation of the later, thus providing opportunities for energy savings. Energy Management Potential and Associated Emission Reduction Potential If all the remaining economically feasible best practices were implemented, total Ontario industrial energy use would be estimated to decrease from 2007 levels by 110 PJ in 2030. These savings would represent a 29 percent reduction in yearly energy use in 2030, as compared to the Reference Case energy use, which is the projected energy use without any new EM market interventions after 2007. The absolute energy savings would be larger for sub‐sectors that account for the largest share of energy use, such as Primary Metal manufacturing and Chemical manufacturing, while lower absolute energy savings would be associated with sub‐sectors that account for a smaller share of the total energy use, such as Fabricated Metal Products manufacturing and Plastics manufacturing. Natural gas use is estimated to decrease by 106 PJ, over the Reference Case scenario natural gas use, in 2030. This is 50 percent of the total 2030 industry savings. The significant savings potential estimated for the direct (which includes ovens, dryers, kilns and furnaces) and indirect (which includes boilers and steam systems) process heating end uses are the main reason for the large natural gas savings potential. The system end use, which includes TBPs that apply to the total plant, is estimated to contribute over 35 percent of all the Economic Potential savings by 2030. The 2007 Base Year greenhouse gas (GHG) emissions associated with energy use are 39.5 million tonnes CO2eq and the associated criteria air contaminants (CAC) emissions are 92.9 tonnes. Due to the projected increase in energy use in the Reference Case it is estimated that the GHG emissions will increase by 16 percent and CAC emissions by 17 percent by 2030. If all the economically feasible energy efficiency best practices are implemented, as per the Economic Potential scenario, the reduction in GHG emissions is estimated to be 12.6 million tonnes CO2eq (or 27 percent) less compared to the Reference Case in 2030. The Economic Potential scenario CAC emission reduction is estimated to be 27.5 tonnes (or 25 percent) compared to the Reference Case in 2030.

Advancing Opportunities in Energy Management in Ontario Industrial and Management Sector March 17, 2010
CME / Stantec / Marbek / ODYNA iv
Challenges and Potential Solutions The development of programs and policies to increase implementation of best practices in industry and increase the share of EM potential realized, is dependent on an understanding of the challenges industry is facing to implement the best practices. Programs and policies can be designed to address these challenges. The top five challenges identified by industry, in descending order of importance, are:
Category Description of Challenge/Barrier
Financing of EE Projects Difficult to obtain company financing to implement EE projects.
Financing of EE Projects Payback period for EE projects are too high, or ROI is too low.
Transaction Costs Too much effort to access assistance, funding and incentives from programs.
Commitment to EM The company has a lack of human resources to focus on EM.
Commitment to EM Production is the dominant focus, and EM is not seen as a production element.
Taken as a whole, this set of top 15 challenges means that investments by industry in EM continue to be sub‐optimal. Two aspects of project financing are rated the most important challenges, which is perhaps not surprising given the prevalence of SME company participants in this study. It is clear that the key challenges cut across all of the elements of the continuous improvement continuum with a block of issues falling into the key category of knowledge (an issue of capacity building). The top five potential solutions identified by industry, in descending order of importance, are:
Category Potential Solution
Transaction Costs One stop centre/platform for accessing programs.
Commitment to EM Embedded energy manager (includes: energy specialist dedicated to a group of SME).
Knowledge of EE Opportunities Centralized source of information for EE opportunities.
Financing of EE Projects Incentive to develop business case (incl. detailed feasibility assessment).
Product and Service Availability Energy courses and plant assessment track for universities/colleges. An assessment of the top 15 potential solutions identified by industry suggests that industry: Is seeking an integrated, streamlined means of accessing and using programs aimed at
improving productivity. Needs human resource (HR) capacity to manage and advance the EM file. Needs financial support to make the business case for EM measures and to implement
those measures (in effect, needing help to de‐risk EM). Is seeking capacity building help and assistance for the adoption of innovative EM and clean
technology solutions.

Advancing Opportunities in Energy Management in Ontario Industrial and Management Sector March 17, 2010
CME / Stantec / Marbek / ODYNA v
Strategic Framework to Advance Energy Management These opportunities, challenges and solutions, or program concepts, provide the necessary input for a framework to advance EM in Ontario industry. The framework is presented in this report as an Action Plan. The Action Plan elaborates a vision and a public policy mandate that responds to the results and insights generated from this study in the context of the significant changes and uncertainties faced by industry and manufacturing in Ontario, including the global recession and carbon management. To achieve the vision a paradigm shift is required from the current paradigm of a “silo” approach to deployment of program support, versus a more integrated seamless, low transaction cost access to financial, capacity building and technology solutions. The results from this study suggest that Ontario industry may not be ready yet for a full scale paradigm shift of corporate practices and that at least, in the short‐term, there are critical, strategic areas of support needed to help companies generate and show results in the short term. However, there is a cost to deferring action towards a paradigm shift that should not be underestimated. With this in mind, a policy/program “results chain” strategy is recommended as part of a linkage between the deployment of policy/program solutions and the desired intermediate and longer‐term results. For industry, the enabling market conditions and supporting policy instruments need to reflect and respond to the barriers and solutions profile as elaborated earlier in this section. The table below shows the proposed policy responses to the desired industry market conditions. Market conditions desired by Industry
Sub‐conditions Policy response
Energy supply Clarity on long‐term supply security
Address transmission & distribution bottlenecks
Clarity and support role of LDCs in EM deployment
Regulatory certainty and clarity‐Energy
Risk management in transition to SMART GRID
Energy pricing Clarity on price impact of cap and trade
Reporting Clarity on reporting requirements
Tools etc to minimize transaction costs
Response Credit for early action
Clarity on thresholds
Regulatory certainty and clarity‐Carbon Economic incentives
Tools etc to minimize transaction costs
Create new valuation methods
Economic incentives
Linkage to new business & economic strategies
Create one‐stop platform for access & implementation
Expand focus on EM more broadly/elevate EM as a strategic business solution
Training/capacity building to accommodate an integrated solutions approach

Advancing Opportunities in Energy Management in Ontario Industrial and Management Sector March 17, 2010
CME / Stantec / Marbek / ODYNA vi
The following table presents a menu of program solutions fully aligned to the priority list of solutions identified by industry.
Category Priority Solutions Identified by Industry
Program solutions: Examples
Transaction Costs Create special executing agency
One stop centre/platform for programs. Modify existing agency
Cost share special purpose FTE‐ energy managers for company or plant deployment Cost share roving roster of energy managers
Commitment to EM
Embedded energy manager (includes: energy specialist dedicated to a group of SME)
Design curricula & Train energy managers Knowledge of EE Opportunities
Centralized source of information for EE opportunities.
Develop a 1 source portal
Financing of EE Projects
Incentive to develop business case (incl. detailed feasibility assessment).
Provide grants on cost‐share basis
Develop provincial strategy and curricula Product and Service Availability
Energy courses and plant assessment track for universities/colleges.
RFP for delivery
Financing of EE Projects
Incentive based on amount of energy saved.
Performance based incentives
Fixed cost incentive for prescribed equipment.
Rebate and ACCA incentives
Better coordination among existing agencies Product and Service Availability
Funding and centres for innovation and commercialization of EE technology
Create enhanced productivity audits that identify innovation deployment solutions for EM and Clean technologies
Product and Service Availability
Certification of service providers. Create certification program
Create special executing agency
Better coordination among existing agencies
Knowledge of EE Opportunities
Promotion and marketing of knowledge centres.
Develop a 1 source portal
While many of these program types and program delivery vehicles are already being offered to Ontario industry, the issue in the short‐term is how to enhance their effectiveness given the findings of the study and the barriers identified by industry. One of the key program solutions in this menu is training and capacity building. The technical and management best practices analysis reveals substantial room for improvement, which can be addressed, in part, by various executive and plant level training and capacity building initiatives.

Advancing Opportunities in Energy Management in Ontario Industrial and Management Sector March 17, 2010
CME / Stantec / Marbek / ODYNA i
Table of Contents
1 Introduction ..................................................................................................................... 1 1.1 Background and Objectives .......................................................................................... 1 1.2 Study Scope................................................................................................................... 1 1.3 Report Presentation...................................................................................................... 2
2 Methodology.................................................................................................................... 3 2.1 Energy Management Performance Benchmarking ...................................................... 3 2.2 Energy Management Potential Analysis ....................................................................... 4 2.3 Integrating Energy Management Performance Benchmarking and Energy
Management Potential Analysis ................................................................................... 5 2.4 Project Implementation................................................................................................ 6
3 Definitions........................................................................................................................ 9 3.1 Energy Management..................................................................................................... 9 3.2 Milestone Years ............................................................................................................ 9 3.3 Coverage of Energy Supply ........................................................................................... 9 3.4 GHG and CAC Emission Factors .................................................................................. 10 3.5 End uses ...................................................................................................................... 10
4 Survey Sample................................................................................................................ 12 4.1 Introduction ................................................................................................................ 12 4.2 Sub‐sector Representation ......................................................................................... 12 4.3 Size Representation .................................................................................................... 13
5 2007 Base Year Energy Use Profile.................................................................................. 14 5.1 Methodology............................................................................................................... 14 5.2 2007 Base Year Energy Use by Sub‐sector.................................................................. 15 5.3 Energy Use by End Use ............................................................................................... 17
6 Reference Case ............................................................................................................... 19 6.1 Methodology............................................................................................................... 19 6.2 Energy Use Growth Rates ........................................................................................... 20 6.3 Reference Case Energy Use ........................................................................................ 20
7 Energy Efficiency and Conservation Best Practices.......................................................... 22 7.1 Methodology............................................................................................................... 22 7.2 Technical Best Practices.............................................................................................. 23 7.3 Management Best Practices ....................................................................................... 26
8 Base Year Implementation of Best Practices................................................................... 27 8.1 Methodology............................................................................................................... 27 8.2 Surveyed Implementation of Technical Best Practices .............................................. 28 8.3 Surveyed Implementation of Management Best Practices........................................ 31 8.4 Relationship Between TBP and MBP Implementation ............................................... 34 8.5 Overall Implementation of TBP and MBP by Large and SME Plants .......................... 34 8.6 Base Year Market Penetration of Technical Best Practices........................................ 35

Advancing Opportunities in Energy Management in Ontario Industrial and Management Sector March 17, 2010
CME / Stantec / Marbek / ODYNA ii
9 Economic Potential Scenario .......................................................................................... 36 9.1 Methodology............................................................................................................... 36 9.2 Economic Potential Scenario Energy Use ................................................................... 39 9.3 Sensitivity Analysis ...................................................................................................... 41
10 Best Practices Implementation: Challenges and Barriers, and Program Concepts ........... 43 10.1 Methodology............................................................................................................... 43 10.2 Challenges and Solutions to Implement Best Practices.............................................. 45
11 Potential Reduction in GHG and CAC Emissions.............................................................. 47 11.1 Methodology............................................................................................................... 47 11.2 Base Year, Reference Case and Economic Potential Scenario Emissions................... 47
12 Strategic Framework to Advance Energy Management .................................................. 50 12.1 Recap of Opportunities............................................................................................... 50 12.2 Recap of Challenges and Solutions ............................................................................. 51 12.3 Action Plan Vision Statement ..................................................................................... 51 12.4 Policy Framework........................................................................................................ 57 12.5 Program Solutions....................................................................................................... 58
13 References...................................................................................................................... 59 13.1 References Used in Developing Sub‐Sector Profiles................................................... 59
14 Glossary.......................................................................................................................... 60 15 Abbreviations ................................................................................................................. 62
B.1 Energy Content Conversion Factors ............................................................................. 2 B.2 GHG and CAC Emission Factors .................................................................................... 2 System .................................................................................................................................... 6 Boiler, Hot Water, and Steam Systems .................................................................................. 6 Process Direct Heat (Furnaces / Kilns / Ovens / Dryers) ...................................................... 11 Refrigeration and Cooling System........................................................................................ 17 Pumps, Fans, and Other Motors........................................................................................... 18 Air Compressor System ........................................................................................................ 19 Process Specific .................................................................................................................... 20 Heating/ Ventilation/ Air Conditioning (HVAC).................................................................... 20 Lighting ................................................................................................................................. 22

Advancing Opportunities in Energy Management in Ontario Industrial and Management Sector March 17, 2010
CME / Stantec / Marbek / ODYNA iii
List of Exhibits Exhibit 1: Industrial Sub‐sectors and Associated NAICS Codes and Descriptions .......................... 2 Exhibit 2: Generic Concept of Energy Potential Analysis................................................................ 5 Exhibit 3: Integrated Energy Management Performance Benchmarking and Energy Management Potential Analysis............................................................................................................................ 5 Exhibit 4: Recruitment Initiatives.................................................................................................... 7 Exhibit 5: Elements Informed by Secondary Sources ..................................................................... 8 Exhibit 6: End Uses........................................................................................................................ 10 Exhibit 7: Number of plants by sub‐sector ................................................................................... 12 Exhibit 8: Criteria for size classification based on annual electricity or natural gas use.............. 13 Exhibit 9: Number of plants by size .............................................................................................. 13 Exhibit 10: Approach to develop sub‐sector energy use profiles................................................. 14 Exhibit 11: Example templates illustrating development of sub‐sector energy use profile ........ 15 Exhibit 12: 2007 Base Year energy use by fuel type (PJ) .............................................................. 16 Exhibit 13: 2007 Base Year energy use by sub‐sector (excluding biomass) ................................. 16 Exhibit 14: 2007 Base Year total industry energy use by end use (PJ) ......................................... 17 Exhibit 15: 2007 Base Year energy use by end use and sub‐sector (GJ) ...................................... 18 Exhibit 16: Weighted average growth rate by energy source ...................................................... 20 Exhibit 17: Reference Case energy use by milestone year ........................................................... 21 Exhibit 18: Reference Case energy use by energy source (PJ)...................................................... 21 Exhibit 19: Reference Case energy use by sub‐sector (PJ) ........................................................... 21 Exhibit 20: Technical best practices.............................................................................................. 23 Exhibit 21: Implementation of TBP by sub‐sector ........................................................................ 28 Exhibit 22: Implementation of TBP by end use............................................................................. 29 Exhibit 23: Implementation of TBP by large plants ...................................................................... 30 Exhibit 24: Implementation of TBP by SME .................................................................................. 30 Exhibit 25: Implementation of MBP by sub‐sector....................................................................... 31 Exhibit 26: Implementation of MBP by category.......................................................................... 32 Exhibit 27: Implementation of MBP by large plants..................................................................... 33 Exhibit 28: Implementation of MBP by SME................................................................................. 33 Exhibit 29: Relationship Between TBP and MBP implementation ............................................... 34 Exhibit 30: Overall implementation of TBP and MBP by large and SME plants ........................... 35 Exhibit 31: TRC of best practices (example using Chemical sub‐sector) ...................................... 36 Exhibit 32: Reference Case and Economic Potential Scenario energy use for all industry .......... 39 Exhibit 33: Reference Case and Economic Potential Scenario energy use by sub‐sector (PJ) ..... 40 Exhibit 34: Reference Case and Economic Potential Scenario energy use by energy source (PJ) 40 Exhibit 35: 2030 Economic Potential Scenario energy savings by end use (PJ) ........................... 41 Exhibit 36: Economic Potential Sensitivity Analysis Energy Savings in 2030 (PJ) ......................... 42 Exhibit 37: Challenges and Solutions Categories. ......................................................................... 44 Exhibit 38: Summary Results of Challenges.................................................................................. 45 Exhibit 39: Summary Results of Solutions. ................................................................................... 46 Exhibit 40: 2030 Reference Case and Economic Potential Scenario GHG savings by industry .... 48 Exhibit 41: 2030 Reference Case and Economic Potential Scenario GHG emission savings by sub‐sector (1 million tonne CO2eq) ..................................................................................................... 48 Exhibit 42: 2030 Reference Case and Economic Potential Scenario CAC emission savings by sub‐sector (1,000 kg) ........................................................................................................................... 49 Exhibit 43: Recap of EM Potential................................................................................................. 50 Exhibit 44: Benefits of Energy Management ................................................................................ 53 Exhibit 45: Results Chain............................................................................................................... 55 Exhibit 46: One‐Stop Platform Concept........................................................................................ 56

Advancing Opportunities in Energy Management in Ontario Industrial and Management Sector March 17, 2010
CME / Stantec / Marbek / ODYNA iv
Exhibit 47: Proposed Policy Responses......................................................................................... 57 Exhibit 48: Proposed Program Solutions. ..................................................................................... 58

Advancing Opportunities in Energy Management in Ontario Industrial and Management Sector March 17, 2010
CME / Stantec / Marbek / ODYNA 1
1 Introduction 1.1 Background and Objectives Energy management (EM) is increasingly being recognized as an important core strategy to help sustain the productive sectors of our economy and reduce industry’s negative impact on climate change through the following benefits: Reduced operating costs, Increased productivity, Retention of manufacturing jobs and value added, Reduced air emissions, and Deferred or avoided new energy infrastructure. Canadian Manufacturers & Exporters (CME) is a long time and strong proponent of EM and retained Stantec Consulting and Marbek to conduct a study:
Advancing Opportunities in Energy Management in Ontario Industrial and Manufacturing Sector
The outcomes of this study fill critical knowledge gaps pertaining to EM potential in Ontario industry and provide the basis for public policy and program initiatives targeted to help Ontario industry increase its competitiveness and reduce greenhouse gas (GHG) and criteria air contaminant (CAC) emissions associated with energy use. The primary objectives of the study are to: Determine the current EM performance of the industrial sector as represented by the
benchmarks of MBP and TBP implementation. Estimate the economic potential for EM, together with the associated greenhouse gas
(GHG) and criteria air contaminants (CACs) emission reduction in the industrial sector. Benchmark the GHG and CAC emissions associated with energy use in Ontario’s industrial
sector. Develop a framework to accelerate the implementation of best practices and increase
industry’s EM performance. 1.2 Study Scope This study focuses on the Ontario industrial and manufacturing sectors defined as follows: Industrial and Manufacturing Sector: Relates to all Industrial and Manufacturing
operations, as defined at the 2 digit North America Industry Classification System (NAICS) code level and included under:
NAICS 21: Mining and Quarrying (excluding Oil and Gas Extraction) NAICS 31 – 33: Manufacturing
Sub‐Sector: Relate to activities at the 3 digit NAICS Code level. The sub‐sectors are defined
in Exhibit 1.

Advancing Opportunities in Energy Management in Ontario Industrial and Management Sector March 17, 2010
CME / Stantec / Marbek / ODYNA 2
Exhibit 1: Industrial Sub‐sectors and Associated NAICS Codes and Descriptions
NAICS Sub‐sectors 331 Primary Metal Manufacturing 325 Chemical Manufacturing 322 Paper Manufacturing 327 Non‐Metallic Mineral Product Manufacturing 3241 Petroleum and Coal Products Manufacturing 336, 333 Transportation Equipment and Machinery Manufacturing 311, 312 Food, Beverage, and Tobacco Product Manufacturing 212 Mining (Excl. Oil & Gas) 332 Fabricated Metal Product Manufacturing 326 Plastics and Rubber Products Manufacturing Other Manufacturing
As further elaborated, the study was executed at the industry sub‐sector level to ensure a defensible, robust analysis. However, to maintain confidentiality requirements for the study’s participating companies, the results are presented at an aggregate industry‐wide level with further elaboration according to key energy end‐uses. 1.3 Report Presentation The remainder of the report is structured to present: The methodology, definitions and survey sample in Sections 2, 3, and 4. The 2007 Base Year and Reference Case energy use profiles in Sections 5 and 6.
The energy efficiency and conservation best practices, and the Base Year implementation of
the best practices in Sections 7 and 8. The Economic Potential scenario in Section 9. The challenges, barriers and program concepts to increase the implementation of best
practices, in Section 10. The GHG and CAC emissions associated with the energy use and energy savings potential in
section 11. An Action Plan to advance energy efficiency in Ontario industry in Section 12.

Advancing Opportunities in Energy Management in Ontario Industrial and Management Sector March 17, 2010
CME / Stantec / Marbek / ODYNA 3
2 Methodology The comprehensive methodology employed in this study is unique in that it integrates two critical areas of EM analysis which, in the past, have been more commonly applied as distinct analysis tools: EM performance benchmarking; and EM potentials analysis. The CME team employs the principle of continuous improvement and has drawn upon extensive experience to bring to the Ontario study the state‐of‐the‐art in both areas of analysis. Specifically: The CME team has been at the forefront of EM benchmarking for industry in Canada and
has applied the unique three‐pronged approach elaborated in the next section to similar industry studies conducted in New Brunswick, Nova Scotia, Alberta (in progress) and several industry sectors (including cement and oil and gas).
CME team member, Marbek, has been at the forefront of EM potentials analyses conducted in most jurisdictions in Canada and, over the course of many years, has advanced its tools and analytical techniques.
To summarize, the main benefits of this integrated methodology are: Industry participants gain valuable insights on the management and technical factors
affecting their energy use performance, as well as the opportunities to improve performance (through the confidential benchmark reports and the market assessment level benchmark and EM potentials results).
Policy and program decision‐makers gain access to a robust, defensible analysis platform as well as the insights and recommendations of industry participants (through the market assessment level benchmark and EM potentials results).
Each of these analysis streams is discussed in this section, with additional supporting documentation found in the appendices. The method used to integrate the two streams of analysis as well as details on the overall execution of the study are also described. 2.1 Energy Management Performance Benchmarking EM performance benchmarking seeks to understand the relationship between indicators of energy use performance and the technical and management practices that influence performance. An EM performance benchmarking analysis generates three important perspectives: It provides an overview of how well a particular industry sector or sub‐sector is managing
energy. It enables company participants in the benchmarking exercise to compare the performance
of their own plant(s) with the overall industry performance indicators. It provides insight into the reasons why a plant’s performance is high or low.

Advancing Opportunities in Energy Management in Ontario Industrial and Management Sector March 17, 2010
CME / Stantec / Marbek / ODYNA 4
The results of the benchmarking analysis provide an indication of how many best practices are currently implemented in Ontario industry and how many best practices can still be implemented. These market penetration rates are used to inform the EM potential analysis described in the next sub‐section. EM performance generally considers three performance indicators: Energy intensity, a performance based metric that relates energy use to production output.
The performance metric can be expressed in metrics such as equivalent kilowatt‐hour per tonne (kWh/t) of product produced, or and energy efficiency index.
Technical best practices (TBPs), which refer to production system and efficiency measures
that reduce energy use per unit of production. An example of a TBP is installing a heat recovery system on a process exhaust stream to pre‐heat a feed stream, resulting in reduced process energy use. The TBP performance indicator is the total number of applicable TBPs that are implemented at a plant (taking into account that some practices can be partially implemented).
Energy management best practices (MBPs), which address the people aspect in reducing
energy use; in an industrial organization, management best practice is illustrated by a high level of commitment, awareness, organization and action in support of energy efficiency. An example of an MBP is having a policy and plan to manage energy. The MBP indicator is the total number of applicable MBPs that are implemented at a plant.
In this study, best practices included in both TBP and MBP will be referred to as Energy Efficiency and Energy Conservation Best Practices. Due to confidentiality and data restrictions, the aggregated industry EM performance benchmarking analysis in this study includes technical and management best practices only. The main reasons to exclude energy intensity from the aggregated industry analysis are: Some plants consider production data as confidential and did not report the data. For these
plants energy intensity performance indicators cannot be calculated.
The need to maintain participant confidentiality. The energy intensity performance benchmark was only developed for individual plants and presented in the individual confidential plant report cards.
2.2 Energy Management Potential Analysis The EM potential analysis for Ontario industry is estimated under the following scenario: When all economically feasible best practices are implemented. This scenario is referred to
as the Economic Potential Scenario, and is defined in Section 2.3.
The EM potential under this scenario is estimated as the reduced amount of energy use compared to a Reference Case projection of energy use in Ontario industry over a defined study period. Exhibit 2 illustrates the generic concepts that define the EM potential analysis: Base Year Reference Case Economic Potential Scenario These concepts are defined in Section 2.3.

Advancing Opportunities in Energy Management in Ontario Industrial and Management Sector March 17, 2010
CME / Stantec / Marbek / ODYNA 5
Exhibit 2: Generic Concept of Energy Potential Analysis
Years
Energy Use
Reference Case
EconomicPotentialScenario
Base Year
0
2.3 Integrating Energy Management Performance Benchmarking
and Energy Management Potential Analysis Integrating EM performance benchmarking and EM potential analysis is accomplished with nine steps, as illustrated in Exhibit 3 and described below. The report chapters from Section 5 to 12 follow the same logic flow as outlined in Exhibit 3.
Exhibit 3: Integrated Energy Management Performance Benchmarking and Energy Management Potential Analysis
Base Year Energy Use
Reference Case
Economic Screening of Best
PracticesEnergy Efficiency and Conservation Best Practices Base Year
Implementation of Best Practices
Economic PotentialScenario
IncreasingImplementation of Best Practices: Challenges and
Program Concepts
Strategic Framework to Advance EM
Potential Reduction in GHG and CAC Emissions
8
21
3
5
4
6
7
9
Step 1 ‐ Base Year Energy Use: The base year is the starting point for the analysis and
provides a detailed description of “where” and “how” energy is currently used in the Industrial sector. In this study the Base Year is 2007.

Advancing Opportunities in Energy Management in Ontario Industrial and Management Sector March 17, 2010
CME / Stantec / Marbek / ODYNA 6
Step 2 ‐ Reference Case: This is a projection of energy use to 2030, in the absence of any
new EM market interventions after 2007 (i.e., incremental to what utilities and government have already planned for this period). The reference case is the baseline against which the scenarios of energy savings are calculated.
Step 3 – Energy Efficiency and Energy Conservation Best Practices: The best practices that
result in energy reduction in the industrial sector are defined. These best practices include TBPs and MBPs.
Step 4 – Base Year Implementation of Best Practices: The market penetration rates of the
best practices in the Base Year were determined through an energy benchmarking analysis. This analysis included a survey of industrial facilities to determine level implementation of best practices in the Base Year.
Step 5 – Economic Screening of Best Practices: The TBPs are screened with an economic
cost benefit test to determine which practices are economically feasible from a societal point of view. The economic cost benefit test used in this study is the Total Resource Cost (TRC) test. The TRC test is defined in section 9.1 and further elaborated on in Appendix A .
Step 6 – Economic Potential Scenario: The economic potential scenario estimates the level
of savings that would occur if all the TBPs that passed the economic benefit cost tests in Step 5, in this case the TRC test is applied to the industry sectors.
Step 7 – Increasing Implementation of Best Practices: The challenges and barriers facing
industry to implement MBP and economically feasible TBP are determined and prioritized, based on industry workshop consultations. In turn, prioritized policy and program solutions are advanced to be responsive, in part, to address the barriers, and assist industry to increase the implementation of best practices.
Step 8 – Potential Reduction in GHG and CAC Emissions: The energy savings estimated in
the Economic Potential scenario are associated with a reduction in GHG and CAC emissions. Emission factors are used to estimate the potential reduction in GHG and CAC emissions due to reduced energy use in this scenario.
Step 9 – Action Plan to Advance Energy Management: Using the potential analysis results
from Step 6 and the prioritized program and policy concepts defined in Step 7, an action plan is advanced that clearly defines the process and direction to overcome the barriers and challenges identified in Step 7.
2.4 Project Implementation
Both the EM performance benchmarking and the EM potential analysis are informed by the acquisition of primary data, and supplemented by secondary data to fill gaps. As such, the data collection and data analysis stages are key elements in the successful implementation of the study. The data collection and analysis comprised the following main areas: Industry recruitment Plant survey and on‐site assessments Data collection from secondary sources Input from stakeholders and industry
These areas are discussed in the following sections.

Advancing Opportunities in Energy Management in Ontario Industrial and Management Sector March 17, 2010
CME / Stantec / Marbek / ODYNA 7
2.4.1 Industry Recruitment There were two goals to the industry recruitment process: To ensure a representative sample of each sub‐sector in terms of its energy end use profile
and implementation of best practices.
To ensure a representative sample in terms of small, medium and large industry, where the size is defined by energy use.
Recruitment was accomplished through targeted marketing campaigns and networking. Exhibit 4 summarizes the main recruitment initiatives. During the recruitment stage the uptake in the study, and representation of sub‐sectors and size distribution were continuously assessed to guide the recruitment effort. A total of 148 facilities participated in the study and an analysis of this sample is provided in Section 4.
Exhibit 4: Recruitment Initiatives
Item Number Comment Companies contacted 1,650 All companies that were contacted by e‐mail and telephone
calls. Recruitment conducted by Stantec, Marbek, CME and Union Gas.
Mass market e‐mails 1,200 Mass marketing e‐mails from: CME to CME members, SMART program participants and other targeted companies. Hydro One to its customers.
Attendees at CME SMART events
500‐550 Number of industrial representatives that attended CME outreach events as part of its SMART program.
Associations contacted 150 Includes CIPEC task forces and other Ontario associations with industrial members.
2.4.2 Plant Surveys and On‐Site Assessments The necessary primary data was obtained from participants through a combination of remote surveys and on‐site plant assessments. All 148 participants completed remote surveys and 56 of these participants also participated in on‐site assessments. The main objective of the on‐site assessments was to assess the accuracy of the remote surveys and identify factors to consider when interpreting remote survey data. The survey protocols used for the remote survey and the on‐site assessment consisted of the following two survey instruments: Energy Use and Technical Best Practice Survey: The survey includes questions pertaining to
energy use and equipment, and the implementation of TBPs. Management Best Practice Survey: The survey includes questions pertaining to the
implementation of MBPs. The survey instruments are provided as a separate document to this report. The surveys were developed from extensive literature research, the project team’s experience with similar projects, and were pilot tested before being used in this study. The literature references and the best practices are discussed in Section 7, while the energy use profiles are discussed in Section 5.

Advancing Opportunities in Energy Management in Ontario Industrial and Management Sector March 17, 2010
CME / Stantec / Marbek / ODYNA 8
2.4.3 Data Collection from Secondary Sources Besides the primary data and the resources to develop the best practices profiles, the study also required secondary data and input from external sources. The elements that required information from secondary sources are summarized in Exhibit 5.
Exhibit 5: Elements Informed by Secondary Sources
Element Source Applicable Section with Detailed References
Base Year 2007: Total energy use by sub‐sector and supplementary data for energy end use profiles.
Canadian Industrial Energy End‐Use Analysis Centre (CIEEDAC)
Enbridge Gas Distribution Ontario Power Authority Statistics Canada Union Gas US Department of Energy – Energy
Efficiency and Renewable Energy
Section 5
Reference Case: Projected energy use by sub‐sectors from 2010 to 2030.
Enbridge Gas Distribution National Energy Board Natural Resources Canada Ontario Power Authority (OPA) Union Gas
Section 6
Energy conversion factors Enbridge Gas Distribution National Energy Board Statistics Canada Union Gas
Section 5 Appendix B
GHG and CAC emission factors Environment Canada Natural Resources Canada
Section 11 Appendix B
2.4.4 Input from Stakeholders and Industry Stakeholders representing the federal and provincial government, the electricity and natural gas utilities and industry, participated in the study through an advisory committee. The committee was informed and discussed on a regular basis the study’s methodology, implementation, progress, results, and deliverables. The committee reviewed and commented on the key deliverables. To obtain input from industry as to the challenges and opportunities to advance EM in Ontario’s industry, two workshops and one webinar were facilitated. Forty nine (49) representatives participated in the workshops and webinar. The methodology and outcome of the consultation are discussed in Section 10.

Advancing Opportunities in Energy Management in Ontario Industrial and Management Sector March 17, 2010
CME / Stantec / Marbek / ODYNA 9
3 Definitions This section defines key concepts and elements that are essential to the study, in addition to the concepts and elements defined in the previous sections. 3.1 Energy Management The focus of the EM potential analysis is to quantify the potential reduction in energy consumption due to EM actions. In this context, EM addresses energy consumption and not energy demand, and includes the following elements: Energy Efficiency (EE) includes technical and management best practices to reduce energy
use, and incorporates efficiency and conservation practices In order to quantify associated GHG and CAC emission reduction, the savings are applied to
on‐site energy use for fuels and equivalent emissions for electricity generation. 3.2 Milestone Years The EM potential analysis is conducted for the following milestone years: The base year is 2007. Projected savings are assessed from 2007 to 2030 and results are provided at interim
milestone years: 2010, 2015, 2020 and 2025
These milestone years align with various energy and Greenhouse Gas (GHG) emission reduction initiatives, such as the OPA’s electricity peak reduction targets for 2010 and 20252, and the Canadian government’s GHG emission reduction targets for 20203. 3.3 Coverage of Energy Supply The EM potential analysis addresses all forms of energy used by industry in Ontario according to the following energy supply categories: Electricity Natural gas Refined petroleum products (RPP) Other, which includes: coal, coke, petroleum coke, coke oven gas, still gas, imported steam
and biomass. The energy content conversion factors used are summarized in Appendix B.
2 Ontario Power Authority (2009). 2008 Annual Report – On the Path to a Sustainable Electricity Future. 3 Ministry of Environment (2007). Regulatory Framework for Air Emissions.

Advancing Opportunities in Energy Management in Ontario Industrial and Management Sector March 17, 2010
CME / Stantec / Marbek / ODYNA 10
3.4 GHG and CAC Emission Factors The EM potential analysis includes an estimation of the potential greenhouse gas (GHG) and criteria air contaminants (CACs) emissions reduction. The GHG amounts are expressed in CO2 equivalent tonnes (CO2e). The CACs included are: CO, NOx, SOx, and particulate matter (PM). The GHG and CAC emission factors used in the study are summarized in Appendix B. 3.5 End uses The EM potential analysis assesses energy use at the energy end use level, which are profiled in Exhibit 6 and described in more detail below.
Exhibit 6: End Uses
End Use Level 1 End Use Level 2 End Use Level 3
Steam boilers and steam systems Hot water heaters and boilers
Indirect heat (Boilers/ Water Heaters)
Steam system (imported steam) Process Heating
Direct Heat (Ovens/ Dryers/ Furnace/ Kilns)
Process Cooling Compressed Air Systems Pumps Fans/Blowers
Motive Power
Other Motors Electrochemical Process Specific Heating, ventilation and air conditioning (HVAC)
Lighting Other
Process Heating: This end use includes all process heating systems and differentiates
between indirect and direct heating end uses. Indirect heating refers to systems where an intermediate heat transfer medium is used, such as steam or hot water. Direct heating systems do not have an intermediate heat transfer medium and the end use includes ovens, dryers, furnaces and kilns.
Process Cooling: All process cooling and refrigeration systems are included in this end use,
for example: cooling towers, freezers, chillers and associated refrigeration compressors. Motive Power: This end use includes all motive power equipment and is sub‐divided into:
compressed air systems, pumps, fans/blowers, and all other motors. Other motors include, for example, conveyors, non‐pneumatic metal forming machines, saws, and vibrating screens.
Electrochemical: All chemical processes driven by electricity are included in this end use,
such as electro plating, and electrolytic reduction of metals.

Advancing Opportunities in Energy Management in Ontario Industrial and Management Sector March 17, 2010
CME / Stantec / Marbek / ODYNA 11
Process Specific: All process that use energy and are not included in the process heating, process cooling, motor driven, electrochemical and ventilation end uses, are included in the process specific end use. Examples include equipment that generates steam, such as paper drying machines.
Heating, Ventilation and Air Conditioning: Comfort heating and cooling systems are
included in this end use, together with all ventilation systems. Ventilation systems that are included can be associated with a process, such as ventilation of paint booths, and/or comfort, for example ventilation of air in production area to maintain adequate air quality levels.
Lighting: All indoor and outdoor lighting systems are included in this end use. Other: This end use includes all energy uses not included in any of the other end use
categories listed above. Examples include: propane or natural gas forklifts, battery chargers, and automated doors.

Advancing Opportunities in Energy Management in Ontario Industrial and Management Sector March 17, 2010
CME / Stantec / Marbek / ODYNA 12
4 Survey Sample 4.1 Introduction As discussed in the study scope (Section 1.2), the industrial sector was segmented into eleven sub‐sectors using the North American Industry Classification System (NAICS). The NAICS is the accepted, standard methodology of classification in Canada and allows for consistency and accuracy in terms of references and use of secondary data, and groups together facilities with similar energy end use profiles. The sample of plants included in the study is profiled in this section according to its representation of the sub‐sectors and the size distribution. 4.2 Sub‐sector Representation A total of 148 plants participated in study and the number of plants per sub‐sector is illustrated in Exhibit 7.
Exhibit 7: Number of plants by sub‐sector
8 86
16
0
26
15
2
26
18
23
Prim
ary Metal
Chem
ical
Pape
r
Non
‐Metallic
Mineral
Petroleu
m and
Coal
Transportation
Equipm
ent &
Machine
ry
Food
& Beverage
Mining
Fabricated
Metal
Plastics
Other M
fg.
Six of the sub‐sectors have very good representation, while the following three sub‐sectors have moderate representation: Primary Metal Manufacturing Chemical Manufacturing Paper Manufacturing

Advancing Opportunities in Energy Management in Ontario Industrial and Management Sector March 17, 2010
CME / Stantec / Marbek / ODYNA 13
There is limited to no representation in two sub‐sectors: Petroleum and Coal Products Manufacturing Mining (Excluding Oil and Gas) To ensure the potential energy reduction opportunity is accurately quantified with a representative model, the primary data for the sub‐sectors with moderate to no representation were supplemented by secondary data. The references to the secondary sources are provided in the subsequent sections where applicable.
4.3 Size Representation The facilities were classified according to size based on its energy use. The criteria to determine the size of a facility was based on either the annual electricity or natural gas use, as is summarized in Exhibit 8. As illustrated in Exhibit 9, the 148 plants have a very good representation of large, medium and small plants. In this report small and medium enterprises (SME) refer to all plants that are categorized as small and medium as per Exhibit 8.
Exhibit 8: Criteria for size classification based on annual electricity or natural gas use
Size Electricity Natural Gas Small < 2,000 MWh < 50,000 m3
Medium > 2,000 MWh; < 20,000 MWh
>50,000 m3; < 500,000 m3
Large > 20,000 MWh > 500,000 m3
Exhibit 9: Number of plants by size
Small Plants(35)24%
Medium Plants(53)36%
Large Plants(60)40%

Advancing Opportunities in Energy Management in Ontario Industrial and Management Sector March 17, 2010
CME / Stantec / Marbek / ODYNA 14
5 2007 Base Year Energy Use Profile
Base Year Energy Use
Economic Screening of Best
PracticesEnergy Efficiency and Conservation Best Practices Base Year
Implementation of Best Practices
Economic PotentialScenario
IncreasingImplementation of Best Practices: Challenges and
Program Concepts
Strategic Framework to Advance EM
Potential Reduction in GHG and CAC Emissions
8Reference Case
21
3
5
4
6
7
9
This section presents a description of the 2007 Base Year energy use in Ontario’s Industrial sector, and it is the first step in the EM potential analysis. The Base Year energy use profile provides an estimate of how the Ontario industrial energy consumption is currently distributed by fuel type, sub‐sector, and end use. The relevant assumptions and information applied to develop the Base Year energy use profile, and a summary of the results are presented in the following sub‐sections: Methodology Base Year energy use by sub‐sector Base Year energy use by end use 5.1 Methodology The 2007 Base Year energy use profile by sub‐sector is developed with a top‐down approach where the total sub‐sector energy use is proportionally allocated to the end uses in each sub‐sector. The total energy use by sub‐sector is based on data from Ontario Power Authority4, Union Gas5, Enbridge Gas Distribution6, and Statistics Canada7.
Exhibit 10: Approach to develop sub‐sector energy use profiles
As illustrated in Exhibit 10, the proportional allocation of the total energy use is based on a generic plant end use profile, which is sub‐sector specific. Exhibit 11 illustrates how a Base Year
4 Ontario Power Authority (2009). MIF Industrial Forecast by Sub‐sector for CME. 5 Marbek (2009) Natural Gas Energy Efficiency Potential Analysis – Industrial Sector, for Union Gas. 6 Marbek (2009). Natural Gas Energy Efficiency Potential: Update 2008, for Enbridge Gas Distribution. 7 Statistics Canada (2009). Report on Energy Supply and Demand in Canada 2007.
Total Industry Energy Use
(by Sub‐sector and Fuel Type)
Generic Plant End Use Profile
(One Per Sub‐sector)
Sub‐Sector Energy Use Profile
(One Per Sub‐ Sector)

Advancing Opportunities in Energy Management in Ontario Industrial and Management Sector March 17, 2010
CME / Stantec / Marbek / ODYNA 15
sub‐sector energy use profile is developed by disaggregating the total sub‐sector energy use, using a generic end use profile. Generic plant profiles and energy end use profiles of all eleven sub‐sectors are presented in Appendix C.
Exhibit 11: Example templates illustrating development of sub‐sector energy use profile Total Primary Metal Manufacturing Energy
Use for 2007 (PJ)
Generic Plant End‐Use
Profile (%)
Sub‐sector Energy Use
Profile (GJ)
Elec NG RPP Other End Use Elec NG RPP Other End Use Elec NG RPP Other22 37 9.3 84 Process Heat 36% 84% 85% 95% Process Heat 8.1 31 7.9 79
Cooling & Refrigeration 2% 0% 0% 0%
Cooling & Refrigeration 0.4 ‐ ‐ ‐
Machine Drives 40% 0% 0% 0% Machine Drives 9.0 ‐ ‐ ‐
Electrochemical 3% 0% 0% 0% Electrochemical 0.7 ‐ ‐ ‐
Process Specific 6% 11% 0% 5% Process Specific 1.3 4.1 ‐ 4.2
HVAC 8% 4% 0% 0% HVAC 1.8 1.5 ‐ ‐
Lighting 4% 0% 0% 0% Lighting 1.0 ‐ ‐ ‐
Other 1% 1% 15% 0% Other 0.2 0.4 1.4 ‐
The Ontario sub‐sector specific generic plant profiles were developed using the following steps: A draft profile was constructed using weighted averages of the energy balances developed
for each of the 148 participating plants. For the two sub‐sectors with limited to no participation (i.e. the Petroleum and Coal Product manufacturing, and Mining sub‐sectors) the draft profiles were developed from secondary data sources, which are listed in the Reference Section 13.1.
The profiles were reviewed by Ontario industrial technical experts, compared with the
project team’s primary data from other studies, and information from secondary data sources. These references are listed in the Reference Section 13.1.
Based on the review of the draft profiles, minor adjustments were made to the profiles ensuring the generic plant profiles are representative of the Ontario sub‐sectors.
5.2 2007 Base Year Energy Use by Sub‐sector In 2007 Ontario’s industrial sector used an estimated total 732 PJ of energy. As illustrated in Exhibit 12, natural gas and electricity respectively accounted for 38 percent and 22 percent of the total energy use. Biomass is estimated to account for 13 percent of the total energy use and is only reported to be used in the Paper Manufacturing and Other Manufacturing sub‐sectors. The focus of the study is to advance opportunities in EM and reduce GHG and CAC emissions. Within this context and due to the limited applicability of biomass, biomass is excluded from the energy efficiency potential analysis. The total annual industrial energy use, excluding biomass, is 640 PJ. The energy use by sub‐sector is illustrated in Exhibit 13 and the detailed values are summarized in Appendix D. The Other fuel category includes imported steam, coal, coke and petroleum coke, and accounts for 19 percent of total energy use.

Advancing Opportunities in Energy Management in Ontario Industrial and Management Sector March 17, 2010
CME / Stantec / Marbek / ODYNA 16
Exhibit 12: 2007 Base Year energy use by fuel type (PJ)
Exhibit 13: 2007 Base Year energy use by sub‐sector (excluding biomass)
20,000,000
40,000,000
60,000,000
80,000,000
100,000,000
120,000,000
140,000,000
160,000,000
Prim
ary Metal
Chem
ical
Pape
r
Non
‐metallic
Mineral
Petroleu
m
Refin
eries
Transportatio
n Eq
uipm
ent
Food
& Beverage
Mining (Excl. Oil
& Gas)
Fabricated
Metal
Plastic
& Rub
ber
Other Indu
stry
Total Ene
rgy Use (G
J)
Other
RPP
Electricity
Natural Gas
Natural Gas(282) 38%
Electricity(158) 22%
RPP(62) 8%
Biomass(92) 13%
Other(137) 19%
Advancing Opportunities in Energy Management in Ontario Industrial and Management Sector March 17, 2010
CME / Stantec / Marbek / ODYNA 17
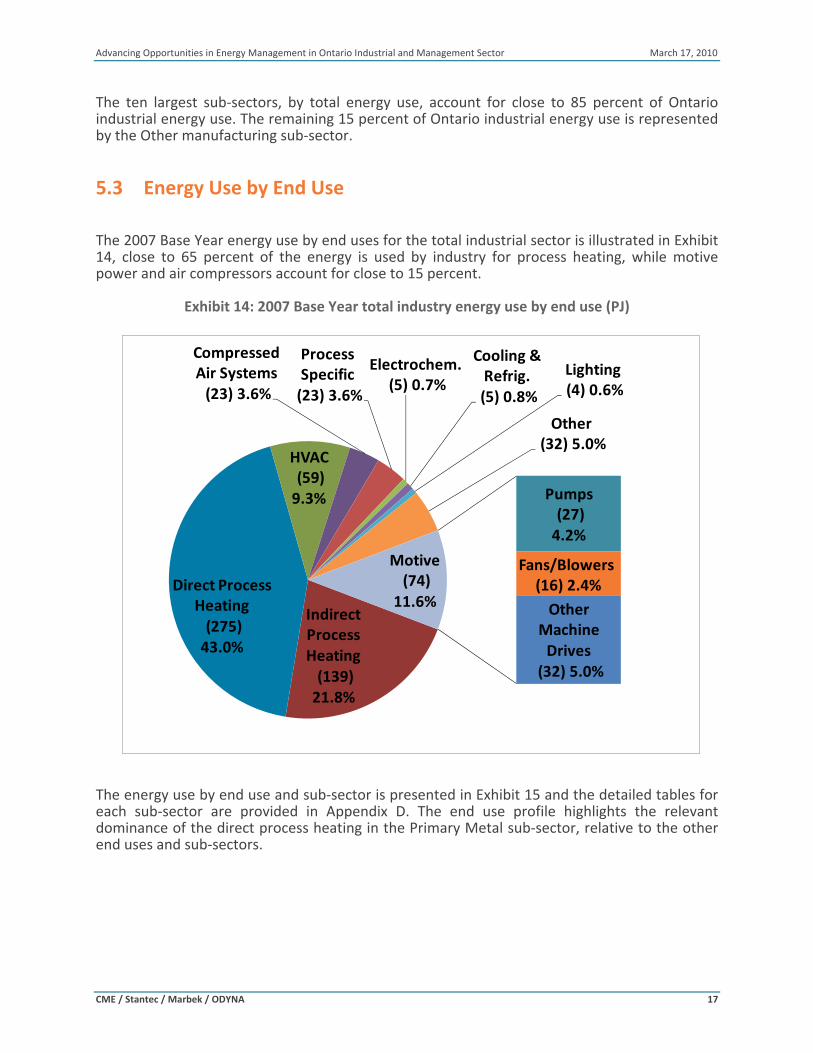
The ten largest sub‐sectors, by total energy use, account for close to 85 percent of Ontario industrial energy use. The remaining 15 percent of Ontario industrial energy use is represented by the Other manufacturing sub‐sector. 5.3 Energy Use by End Use The 2007 Base Year energy use by end uses for the total industrial sector is illustrated in Exhibit 14, close to 65 percent of the energy is used by industry for process heating, while motive power and air compressors account for close to 15 percent.
Exhibit 14: 2007 Base Year total industry energy use by end use (PJ)
The energy use by end use and sub‐sector is presented in Exhibit 15 and the detailed tables for each sub‐sector are provided in Appendix D. The end use profile highlights the relevant dominance of the direct process heating in the Primary Metal sub‐sector, relative to the other end uses and sub‐sectors.
Indirect Process Heating(139) 21.8%
Direct Process Heating(275) 43.0%
HVAC(59) 9.3%
Compressed Air Systems(23) 3.6%
Pumps(27) 4.2%
Fans/Blowers(16) 2.4%
Other Machine Drives
(32) 5.0%
Process Specific(23) 3.6%
Electrochem.(5) 0.7%
Cooling & Refrig.(5) 0.8%
Lighting(4) 0.6%
Other(32) 5.0%
Motive(74)
11.6%

Advancing Opportunities in Energy Management in Ontario Industrial and Management Sector March 17, 2010
CME / Stantec / Marbek / ODYNA 18
Exhibit 15: 2007 Base Year energy use by end use and sub‐sector (GJ)
0
20,000,000
40,000,000
60,000,000
80,000,000
100,000,000
120,000,000
140,000,000
160,000,000
Prim
ary Metal
Chem
ical
Pape
r
Petroleu
m
Refin
eries
Transportatio
n Eq
uipm
ent
Non
‐metallic
Mineral
Food
& Beverage
Mining (Excl. Oil
& Gas)
Fabricated
Metal
Plastic
Other Indu
stry
Total Ene
rgy Use (G
J)
OtherLightingHVACProcess SpecificElectrochemicalCompressed Air SystemsMachine DrivesCooling & RefrigerationDirect Process HeatingIndirect Process Heating

Advancing Opportunities in Energy Management in Ontario Industrial and Management Sector March 17, 2010
CME / Stantec / Marbek / ODYNA 19
6 Reference Case
Base Year Energy Use
Economic Screening of Best
PracticesEnergy Efficiency and Conservation Best Practices Base Year
Implementation of Best Practices
Economic PotentialScenario
IncreasingImplementation of Best Practices: Challenges and
Program Concepts
Strategic Framework to Advance EM
Potential Reduction in GHG and CAC Emissions
8Reference Case
21
3
5
4
6
7
9
This section presents a description of the Reference Case energy use in Ontario’s Industrial sector, and it is the second step in the EM potential analysis. The Reference Case provides a projection of energy use to 2030, in the absence of any new EM market interventions after 2007 (i.e., incremental to what utilities and government have already planned for this period). The reference case is the baseline against which the scenario of energy savings is calculated. The assumptions and information applied to develop the Reference Case energy use profiles, and a summary of the results are presented in the following sub‐sections: Methodology Energy use growth rates Reference Case energy use 6.1 Methodology The study does not include the development of energy use forecasts, and relies on existing forecasts to develop the projected energy use in the Reference Case. Energy use growth rates were determined for each sub‐sector from 2007 to 2010, and in 5‐year increments from 2010 to 2030. The growth rates are presented in Section 6.2. The three sources that were mainly used to develop the Reference Case energy use profiles are: Updated Ontario Power Authority (OPA) electricity use forecast data for the industrial
sector8, which reflects decreasing industrial load over the 2005‐2008 period, with recovery anticipated to begin in 2010. Observed industrial electricity load in 2009 has been significantly lower than that anticipated in the forecast. At this time, the nature and timing of economic recovery is uncertain.
The latest energy use demand and supply forecast from the National Energy Board9 (NEB),
which also reflects the economic downturn. The forecast is only applicable up to 2020. Previous NEB forecast data10 was used to inform the forecast from 2020 to 2030.
8 Ontario Power Authority (2009). MIF Industrial Forecast by Sub‐sector for CME. 9 National Energy Board (2009). 2009 Reference Case Scenario: Canadian Energy Demand and Supply to 2020 – An Energy Market Assessment July 2009.

Advancing Opportunities in Energy Management in Ontario Industrial and Management Sector March 17, 2010
CME / Stantec / Marbek / ODYNA 20
The following additional assumptions and approaches pertain to developing the Reference Case: Unlike the OPA electricity growth rates, the NEB energy use growth rates are not provided
at the sub‐sector level. To develop the growth rates for natural gas, RPP and other fuels, growth rates similar to the electricity growth rates were applied and calibrated to the NEB total Ontario industry growth rates for each fuel.
The OPA and NEB forecasts, and by association the Reference Case scenario, incorporates an estimation of “natural conservation,” namely, changes in end‐use efficiency over the study period that are projected to occur in the absence of new market interventions.
The Base Year end use profiles, in terms of proportional energy use by each end use, are
frozen for the duration of the Reference Case. This means, for example, that the percentage of 2007 natural gas use in the Food and Beverage sub‐sector allocated to boilers remains constant from 2007 to 2030.
6.2 Energy Use Growth Rates The weighted average percentage growth rates for each energy source are summarized in Exhibit 16. The detailed growth rates by sub‐sector for each fuel are presented in Appendix E. The growth rates are dependent on the economic drivers assumed in the NEB and OPA forecasts.
Exhibit 16: Weighted average growth rate by energy source
Percentage Overall Growth Rate in Period
Fuel Type 2007 to 2010 2010 to 2015 2015 to 2020 2020 to 2025 2025 to 2030
Natural Gas ‐14.2% 14.5% ‐1.5% 8.7% 8.7%
Electricity ‐3.8% 5.3% 2.5% 2.6% 3.0%
RPP 0.8% 10.9% 4.1% 13.9% 11.0%
Other ‐2.6% 18.9% ‐10.3% 4.6% 3.9% 6.3 Reference Case Energy Use The Reference Case total energy use is estimated to increase by about 16 percent from 2007 to 2030 as illustrated in Exhibit 17, Exhibit 18, and Exhibit 19. The detailed tables are included in Appendix E. In absolute terms the increase is close to 104 PJ. The largest increases in energy use are associated with four of the five largest sub‐sectors, by energy use: Primary Metal, Chemical, Non‐metallic Mineral Products and Petroleum and Coal Products manufacturing. The Other Industry manufacturing sub‐sector shows the largest decrease in energy use and the remaining sub‐sectors each have less than a 10 percent change in energy use over the 23 year period.
10 National Energy Board (2007). Canada’s Energy Future: Reference Case Scenario to 2030 – An Energy Market Assessment November 2007.

Advancing Opportunities in Energy Management in Ontario Industrial and Management Sector March 17, 2010
CME / Stantec / Marbek / ODYNA 21
Exhibit 17: Reference Case energy use by milestone year
Exhibit 18: Reference Case energy use by energy source (PJ)
Energy Source 2007 2010 2015 2020 2025 2030 Change from 2007 to 2030
Natural Gas 282 242 277 273 297 323 41
Electricity 158 152 161 165 170 176 18
RPP 62 63 70 72 82 91 29
Other 137 134 159 142 148 154 17
Total 640 591 666 653 698 744 104
Exhibit 19: Reference Case energy use by sub‐sector (PJ)
Sub‐sector 2007 2010 2015 2020 2025 2030 Change from 2007 to 2030
Primary Metal Manufacturing 152 148 187 178 189 200 48
Chemical Manufacturing 82 79 91 90 97 104 22
Paper Manufacturing 62 52 56 56 60 64 2
Non‐metallic Mineral Product Mfg. 55 53 61 62 70 79 23
Petroleum and Coal Products Mfg. 54 56 58 60 67 74 20
Transportation Equipment & Machinery Mfg. 45 37 39 38 39 41 ‐4
Food & Beverage Product Mfg. 37 30 32 31 32 33 ‐3
Mining (Excl. Oil & Gas) 33 33 35 33 34 35 2
Fabricated Metal Product Mfg. 17 16 16 15 15 16 ‐1
Plastics Manufacturing 15 15 17 18 19 20 5
Other Industry 87 72 76 73 75 78 ‐10
Total 640 591 666 653 698 744 104
0
100
200
300
400
500
600
700
800
2007 2010 2015 2020 2025 2030
Total Ene
rgy Use (PJ)
Milestone Year

Advancing Opportunities in Energy Management in Ontario Industrial and Management Sector March 17, 2010
CME / Stantec / Marbek / ODYNA 22
7 Energy Efficiency and Conservation Best Practices
Base Year Energy Use
Economic Screening of Best
PracticesEnergy Efficiency and Conservation Best Practices Base Year
Implementation of Best Practices
Economic PotentialScenario
IncreasingImplementation of Best Practices: Challenges and
Program Concepts
Strategic Framework to Advance EM
Potential Reduction in GHG and CAC Emissions
8Reference Case
21
3
5
4
6
7
9
This section describes the energy efficiency and conservation best practices included in the study. The best practices include TBPs and MBPs, which are defined in Sections 7.2 and 7.3. The subsequent sections (Sections 8 and 9) address the implementation of the best practices in Ontario industry and the economic feasibility of the practices. 7.1 Methodology Industrial energy efficiency and conservation best practices were identified using secondary sources, and Marbek and Stantec’s extensive databases, which were developed with input from many industrial experts. The secondary sources include literature, equipment suppliers, and industry EM experts. The following additional approaches pertain to defining the TBPs: Only TBPs that are technically feasible and commercially available are included in the
analysis. TBPs are included at a level of detail that is manageable within the budget and scope of the
study. This necessitates that the TBPs include a degree of bundling. For example, the TBP “economizers” for steam boilers includes standard and condensing economizers.
The list of TBPs was refined and finalized with input from the study’s Advisory Committee. The technology profiles were developed for each TBP to provide required input parameters for the energy efficiency potential analysis modeling. The technology profiles are discussed in Section 7.2. Secondary sources and Marbek’s extensive databases were used to derive the necessary input parameters for the TBPs, which include: The capital, and operating and maintenance costs The life of the best practice, also referred to as the measure life The energy savings of the best practice Marbek has evolved the management best practices model through various similar studies, and improved it further for this study using the experience from previous applications. The EM models that contributed significantly to the definition of the Marbek MBP model are the EM

Advancing Opportunities in Energy Management in Ontario Industrial and Management Sector March 17, 2010
CME / Stantec / Marbek / ODYNA 23
models developed by: Natural Resources Canada – Office of Energy Efficiency, UK Carbon Trust, USA Energy Star, and Australia’s EPA Victoria / Sustainable Energy Authority Victoria. Energy performance at a plant is affected by the MBPs implemented at both the corporate and plant levels. MBPs applicable to the corporate level and the plant level were identified and included in the study. 7.2 Technical Best Practices TBPs are production systems, equipment, methods and employed practices that result in advanced levels of energy user performance. The TBPs included in the study are listed in Exhibit 20, while the technology profiles with descriptions are included in Appendix F.
Exhibit 20: Technical best practices
End Use Measure Name Sub‐Metering Energy Management
System
Integrated Control System Condensing Boiler Instantaneous Steam Generation High Efficiency Burner Economizer Boiler Right Sizing and Load Management Blowdown Heat Recovery Boiler combustion air preheat Process Heat Recovery to Preheat Makeup Water Condensate Return Advanced Boiler Controls Blowdown Control Insulation Boiler Maintenance Boiler Water Treatment Minimize Deaerator Vent Losses
Steam boilers and steam systems
Steam Trap Survey and Repair Direct‐Contact Hot Water Heaters High Efficiency Burner Water‐heater Right Sizing and Load Management Blowdown Heat Recovery Boiler combustion air preheat Process Heat Recovery to Preheat Makeup Water Advanced water‐heater controls Blowdown Control Insulation Boiler Water Treatment
Hot water heaters and boilers
Water‐heater Maintenance Insulation Steam systems
(imported steam) Steam Trap Survey and Repair High Efficiency Oven High Efficiency Dryer High‐efficiency Kilns High‐efficiency Furnaces Induction Heating High efficiency burner
Furnaces/ kilns/ ovens/ dryers
Exhaust Gas Heat Recovery

Advancing Opportunities in Energy Management in Ontario Industrial and Management Sector March 17, 2010
CME / Stantec / Marbek / ODYNA 24
End Use Measure Name Process heat recovery to preheat product High efficiency burner controls Advanced heating and Process Control Insulation
Air Curtains High efficiency multiplex compressors High Efficiency Chiller Optimized Distribution System Free‐cooling Floating head pressure controls Premium efficiency refrigeration control system Smart Defrost Controls Doors, Covers and Curtains
Cooling & Refrigeration
Improve insulation of refrigeration system Premium efficiency pump Impeller Trimming Optimization of pumping system
Pumps
Premium Efficiency Control with ASDs Premium efficiency fans and blowers Impeller Trimming Optimized duct design to improve efficiency Premium efficiency control, with ASD Synchronous Belts
Fans/Blowers
Minimize damper losses on fans Premium Efficiency Motors Correctly sized motors Optimized motor control
Other Motors
Synchronous Belts Premium Efficiency ASD Compressor Replace pneumatic motors with mechanical Low pressure blower to replace compressed air Optimized sizing and pressure of compressor system Optimized distribution system (incl. pressure) Optimized sizes of air receiver tanks Use cooler air from outside for make up air Adjustable Speed/Variable frequency drive Sequencing Control
Compressed air Systems
Air leak survey and repair Improved energy efficient design Improved energy efficient electrode material
Electrochemical
Automated and continuous operation Improved equipment efficiency Process Specific Optimized process controls High‐efficiency packaged HVAC Solar Walls Radiant Heaters Ground Source Heat Pump Ventilation Optimization Ventilation Heat Recovery Air Compressor Heat Recovery Automated Temperature Control Reduced Temperature Settings Destratification Fans Warehouse Loading Dock Seals
HVAC
Air Curtains

Advancing Opportunities in Energy Management in Ontario Industrial and Management Sector March 17, 2010
CME / Stantec / Marbek / ODYNA 25
End Use Measure Name High Efficiency Lights and Ballasts High‐Efficiency Lighting Design
Lighting
Automated Lighting Controls

Advancing Opportunities in Energy Management in Ontario Industrial and Management Sector March 17, 2010
CME / Stantec / Marbek / ODYNA 26
7.3 Management Best Practices Management best practices refer to the management practices that improve energy use performance. The MBPs are included in Appendix F and are categorized as follows: Policy and Planning. Effective management starts with the publication and distribution of a
policy statement that commits the organization to EM as an integral part of its way of doing business. Effective planning for energy action is characterized by strong links to the energy policy, and the treatment of energy as a strategic issue rather than an operational one. Appropriate EM plans are in place that link responsibilities, tasks, performance indicators and results.
Organization and Accountability. The competencies and organizational structure required
for efficient operation, maintenance, promotion and management of energy systems, action plans and equipment. Organization refers to the organization of people, the allocations of EM responsibilities, and integration with other management and functions.
Financing. Ensuring financing is available to identify, develop, and implement EM is a key
element in EM. Financing includes developing the business case for EM projects and financial planning that integrates EM.
Project Management. Identifying, developing and implementing energy efficiency
opportunities ensure EM produce results. Project development and project management require knowledge and capacity to identify and assess opportunities, and management skills to implement the projects.
Monitoring. Monitoring deal with the process of gathering, recording, analyzing and
reporting data – putting it to work constructively in areas such as training, monitoring and measuring management and technical energy performance for the purposes of taking action on identified EM priorities.
Reporting and Communication. Reporting and communication addresses the proactive
reporting, communication and promotion, both internally and externally, to build and sustain awareness of EM and its impacts, to receive input from employees on savings opportunities, to provide feedback on needs and achievements, and to establish corporate responsibility.
Training and Capacity Building. Developing capacity enables the implementation and
continuous improvement of EM. Ensuring personnel have adequate knowledge relies on identifying necessary knowledge gaps and implementing a training and capacity building plan.

Advancing Opportunities in Energy Management in Ontario Industrial and Management Sector March 17, 2010
CME / Stantec / Marbek / ODYNA 27
8 Base Year Implementation of Best Practices
Base Year Energy Use
Economic Screening of Best
PracticesEnergy Efficiency and Conservation Best Practices Base Year
Implementation of Best Practices
Economic PotentialScenario
IncreasingImplementation of Best Practices: Challenges and
Program Concepts
Strategic Framework to Advance EM
Potential Reduction in GHG and CAC Emissions
8Reference Case
21
3
5
4
6
7
9
This section presents the implementation of best practices in the 2007 Base Year. The extent to which best practices are implemented in the Base Year reveals the opportunity that exists to increase the implementation of best practices. It defines the gap between the amount of best practices industry has implemented and the maximum amount of best practices that can be implemented. This section includes all the best practices described in Section 7, while the economic feasibility of the practices is discussed in the Section 9. 8.1 Methodology The extent to which best practices are currently implemented in industry (also referred to as the ‘market penetration rate’) was determined through an energy performance benchmarking approach. For each best practice the results from the benchmarking assessment provide information to define the Base Year market penetration rate and the opportunity that still remains for increased implementation. A scoring system was used to convert the information submitted by the plants on the TBP and MBP surveys into implementation rates. For example, the response to each TBP/MBP was given a score, using the following system when the best practice is either present or not: Applicable technical best practice implemented in facility (yes): score = 1 Applicable technical best practice not employed (no): score = 0 In case where the best practices can be partially implemented a 3‐level scoring system was used. A total score was calculated and each practices received an equal weight. For the TBPs, the scores are determined for each end‐use of energy at the facility level as described in the previous section and the scores are further aggregated for the entire sub‐sector. The MBPs scores are similarly determined at the category level and at the sub‐sector level. A total of 148 plants participated in the energy performance benchmarking through surveys, with 56 of those surveys including on‐site assessments. The recruitment, surveying, and on‐site assessment methodologies are discussed in section 2.4, while an analysis of the survey sample is presented in Section 4.

Advancing Opportunities in Energy Management in Ontario Industrial and Management Sector March 17, 2010
CME / Stantec / Marbek / ODYNA 28
The market penetration rates used in the potential analysis were developed using the following methodology: A draft set of market penetration rates was constructed using the benchmarking results of
the 148 participating plants. For the two sub‐sectors with limited to no participation (i.e. the Petroleum and Coal Product manufacturing, and Mining sub‐sectors) the penetration rates were developed from the project team’s databases and secondary data sources, which are listed in the Reference Section.
The draft market penetration rates were reviewed by Ontario industrial technical experts,
compared with the project team’s data from other studies, and information from secondary data sources. These references are listed in the Reference Section.
Based on the review of the market penetration rates, minor adjustments were made to
ensure the penetration rates are representative of the Ontario sub‐sectors. 8.2 Surveyed Implementation of Technical Best Practices 8.2.1 Surveyed Implementation of Technical Best Practices ‐ All Participants The implementation of TBPs in Ontario Industry by sub‐sector is presented in Exhibit 21 and by end use in Exhibit 22. For the two sub‐sectors with limited to no participation (i.e. the Petroleum and Coal Product manufacturing, and Mining sub‐sectors), no benchmarking results are included. The detailed results are provided in Appendix G. The results include the median, and the 25th and 75th percentile values. Median values are the point where 50 percent of the plants have values lower than the specified value. The 75th percentile is generally selected as the benchmark energy performance value for plants to strive towards. This means that 75 percent of the plants have values below the benchmark, and the top quartile is selected as the target for companies to achieve.
Exhibit 21: Implementation of TBP by sub‐sector
36% 34% 31%
41% 42%33%
39% 42%
33%39%
0%
10%
20%
30%
40%
50%
60%
70%
80%
90%
100%
Prim
ary Metal
Chem
ical
Pape
r
Tran
sport &
Machine
ry
Food
& Beverage
Non
‐Metallic Mineral
Fabricated
Metal
Plastic & Rub
ber
Other M
fg.
All sectors
TBP Im
plem
entation
Sector
75th Percentile
Median
25th Percentile

Advancing Opportunities in Energy Management in Ontario Industrial and Management Sector March 17, 2010
CME / Stantec / Marbek / ODYNA 29
Exhibit 22: Implementation of TBP by end use
The results illustrate a relatively low implementation of TBPs in the Ontario industrial sector. The 75th percentile of TBP implementation by sub‐sector range is between 31 percent and 42 percent. This means most of the plants have implemented less than 42 percent of applicable TBPs, and the opportunity exists for most companies to implement more than 58 percent of the TBPs. Exhibit 22 illustrates that the largest potential to increase implementation of TBPs exists for all end uses, and especially for the electric end uses: motive power, and cooling and refrigeration. Compressed air systems have the highest implementation of TBPs. 8.2.2 Surveyed Implementation of TBPs – Large versus SME The implementation of TBPs in Ontario Industry by end use for all the large plants is illustrated in Exhibit 23, while the implementation of TBP by SME is illustrated in Exhibit 24. For a definition of large and SME please see Section 4.3. The implementation of TBP by plant size indicates large plants have implemented on average close to 10 percent more TBPs compared to SME. The most significant differences in TBP implementation are observed in the following end uses: Lighting – About 50 percent of large plants have implemented more than 33 percent of the
best practices, compared to the median value for SME of 3 percent.
Process specific – About 50 percent of large plants have implemented more than 43 percent of the best practices, compared to the median value for SME of 14 percent.
42% 46%
26%
66%
43% 43% 42%47%
41%
0%10%20%30%40%50%60%70%80%90%100%
Indirect process heating
Direct‐fired
Process heating
Motive Po
wer
Compressed Air Systems
Cooling / Re
frigeration
Process Specific
HVA
C
Lighting
Other
TBP Im
plem
entation
End Uses
75th Percentile
Median
25th Percentile

Advancing Opportunities in Energy Management in Ontario Industrial and Management Sector March 17, 2010
CME / Stantec / Marbek / ODYNA 30
Indirect process heating (e.g. boilers and steam systems) – About 50 percent of large plants have implemented more than 37 percent of the best practices, compared to the median value for SME is 21 percent.
Exhibit 23: Implementation of TBP by large plants
Exhibit 24: Implementation of TBP by SME
45%53%
33%
67%
50%56%
46%51%
42%
0%
10%
20%
30%
40%
50%
60%
70%
80%
90%
100%
Indirect process
heating
Dire
ct‐fire
d Process
heating
Motive Po
wer
Compressed Air
System
s
Cooling /
Refrigeration
Process Spe
cific
HVA
C
Lightin
g
Overall TB
P Score
TBP Im
plem
entatio
n
End Uses
75th percentile
Median
25th percentile
36%40%
20%
60%
38%
29%
42%33% 33%
0%
10%
20%
30%
40%
50%
60%
70%
80%
90%
100%
Indirect process
heating
Dire
ct‐fire
d Process
heating
Motive Po
wer
Compressed Air
System
s
Cooling /
Refrigeration
Process Spe
cific
HVA
C
Lightin
g
Overall TB
P Score
TBP Im
plem
entatio
n
End Uses
75th percentile
Median
25th percentile

Advancing Opportunities in Energy Management in Ontario Industrial and Management Sector March 17, 2010
CME / Stantec / Marbek / ODYNA 31
8.3 Surveyed Implementation of Management Best Practices 8.3.1 Surveyed Implementation of Management Best Practices ‐ All Participants
The implementation of management best practices (TBP) in Ontario Industry by sub‐sector is presented in Exhibit 25 and by end use in Exhibit 26. For the two sub‐sectors with limited to no participation (i.e. the Petroleum and Coal Product manufacturing, and Mining sub‐sectors), no benchmarking results are included. The detailed results are provided in Appendix G.
Exhibit 25: Implementation of MBP by sub‐sector
Among the sub‐sectors, the benchmarking results indicate a relatively large difference in the extent to which MBPs are implemented. Relatively low implementation of MBPs is observed in: Primary Metal manufacturing Other manufacturing Fabricated Metal manufacturing Higher implementation rates of MBPs are observed in: Chemical manufacturing Non‐metallic Mineral manufacturing Transportation and Machinery manufacturing Food and Beverage manufacturing Overall, 75 percent of plants have implemented less than 48 percent of the MBPs and the potential exists to implement the remaining 52 percent MBPs.
32%
58%
34%
54%
67%61%
36%
59%
28%
48%
0%
10%
20%
30%
40%
50%
60%
70%
80%
90%
100%
Prim
ary Metal
Chem
ical
Pape
r
Transportatio
n and Machine
ry
Food
and
Be
verage
Non
‐Metallic
Mineral
Fabricated
Metal
Plastic
and
Ru
bber
Other M
fg.
All Sectors
MBP
Implem
entatio
n
Sector
75th Percentile
Median
25th Percentile

Advancing Opportunities in Energy Management in Ontario Industrial and Management Sector March 17, 2010
CME / Stantec / Marbek / ODYNA 32
Exhibit 26: Implementation of MBP by category
In Exhibit 26, the MBP categories are listed in the sequence in which a company would likely follow the implementation of best practices according to a management plan or management standard. One can observe from the results that in general, plants manage and finance energy projects on an ad‐hoc basis, while best practices associated with continuous improvement are not widely implemented, which are reflected by the categories with lowest implementation of MBPs: Policy and planning Organization and accountability Monitoring Reporting and communication Training and capacity building 8.3.2 Surveyed Implementation of Management Best Practices – Large versus SME The implementation of MBP in Ontario Industry by category for all the large plants is illustrated in Exhibit 27, while the implementation of MBP by SME is illustrated in Exhibit 28. For a definition of large and SME please see Section 4.3. The implementation of MBP by plant size indicates that large plants have implemented on average close to 30 percent more MBPs compared to SME. The most significant differences in MBP implementation are observed in the following categories: Financing – 50 percent of large plants have implemented more than 70 percent of the best
practices, compared to the median value for SME is 20 percent.
Policy and Planning – 50 percent of large plants have implemented more than 42 percent of the best practices, compared to the median value for SME is 7 percent.
45%39%
80%
61%
47% 45%41%
48%
0%
10%
20%
30%
40%
50%
60%
70%
80%
90%
100%
Policy &
Planning
Organization &
Accoun
tability
Financing
Project
Managem
ent
Mon
itorin
g
Repo
rting &
Commun
ication
Training
&
Capacity
building
MBP
Overall
Score
MBP
Implem
entatio
n
MBP Category
75th Percentile
Median
25th Percentile

Advancing Opportunities in Energy Management in Ontario Industrial and Management Sector March 17, 2010
CME / Stantec / Marbek / ODYNA 33
Monitoring – 50 percent of large plants have implemented more than 46 percent of the
best practices, compared to the median value for SME is 12 percent. Exhibit 27: Implementation of MBP by large plants
Exhibit 28: Implementation of MBP by SME
64% 67%
90%
69% 66% 65%
56%63%
0%
10%
20%
30%
40%
50%
60%
70%
80%
90%
100%
Policy &
Planning
Organization &
Accoun
tability
Financing
Project
Managem
ent
Mon
itorin
g
Repo
rting &
Commun
ication
Training
&
Capacity
building
MBP
Overall
Score
MBP
Implem
entatio
n
MBP Category
75th percentile
Median
25th percentile
25%22%
50%46%
31%25% 22%
31%
0%
10%
20%
30%
40%
50%
60%
70%
80%
90%
100%
Policy &
Planning
Organization &
Accoun
tability
Financing
Project
Managem
ent
Mon
itorin
g
Repo
rting &
Commun
ication
Training
&
Capacity
building
MBP
Overall
Score
MBP
Implem
entatio
n
MBP Category
75th percentile
Median
25th percentile

Advancing Opportunities in Energy Management in Ontario Industrial and Management Sector March 17, 2010
CME / Stantec / Marbek / ODYNA 34
8.4 Relationship Between TBP and MBP Implementation
As illustrated in Exhibit 29, there is a correlation between implementation of TBPs and MBPs; the higher the degree of MBP implementation, the higher the degree of TBP implementation. In the exhibit, plants are grouped into four quartiles based on the number of MBP implemented. For example, a plant that has implemented more than 75 percent of the MBPs is in the top quartile (75 to 100 percent). The average TBP scores for all the plants in each MBP quartile were determined and are presented in the exhibit. The result indicates that plants that have implemented more than 75 percent of the MBP have, on average, implemented 42 percent of the applicable TBPs. Only 5 percent of all the plants fall into this top MBP quartile category. On the other hand, plants that have implemented less than 25 percent of the MBPs, have, on average, implemented 25 percent of the applicable TBPs. Almost 50 percent of all the plants fall into this bottom MBP quartile category.
Exhibit 29: Relationship Between TBP and MBP implementation
8.5 Overall Implementation of TBP and MBP by Large and SME Plants
The overall implementation of TBP and MBP by large and SME plants are compared in Exhibit 30. The results indicate that 22 percent of the plants have implemented more than 40 percent of the TBP, and the majority (63 percent) of these plants is large plants. SME plants account for two‐thirds of the plants that have implemented less than 40 percent of the TBP. A large potential exist for SME to increase the implementation of TBPs.

Advancing Opportunities in Energy Management in Ontario Industrial and Management Sector March 17, 2010
CME / Stantec / Marbek / ODYNA 35
Three‐quarters of the plants that have implemented more than 50 percent of the MBP are large plants, and only 24 percent of all the plants have implemented more than 50 percent of the MBP. SME plants account for 70 percent of the plants that have implemented less than 50 percent of the MBP. This indicates a significant potential for SME to increase the implementation of management best practices. Exhibit 30: Overall implementation of TBP and MBP by large and SME plants
8.6 Base Year Market Penetration of Technical Best Practices The results from the energy performance benchmarking were used to develop the 2007 Base Year market penetration rates, as described in the methodology above (Section 8.1). The Base Year market penetration rates are provided in Appendix G.
18%
6%
23%
53%
14%
8%
26%
52%
Large Plants
SME Plants
Technical Best
Practices
MangementBest
Practices
TBP > 40%
TBP < 40%
MBP > 50%
MBP < 50%

Advancing Opportunities in Energy Management in Ontario Industrial and Management Sector March 17, 2010
CME / Stantec / Marbek / ODYNA 36
9 Economic Potential Scenario
Base Year Energy Use
Economic Screening of Best
PracticesEnergy Efficiency and Conservation Best Practices Base Year
Implementation of Best Practices
Economic Potential Scenario
IncreasingImplementation of Best Practices: Challenges and
Program Concepts
Strategic Framework to Advance EM
Potential Reduction in GHG and CAC Emissions
8Reference Case
21
3
5
4
6
7
9
This section presents the Economic Potential scenario. The methodology used to calculate the economic potential scenario is discussed, followed by the results of the analysis. 9.1 Methodology The TRC test is used to determine the economic feasibility of the TBPs. The TRC test is a measure of the change in the total resource costs to society, excluding externalities, due to the implementation of an energy management measure(s).11 The TRC test generates a net present value (NPV) that sums the streams of benefits and costs over the lifetime of the equipment/technology and uses a discount rate to express these streams as a single “current year” value. If the NPV is positive, indicating that benefits exceed costs, the EM measure is considered cost effective from a societal perspective. Further details on the TRC formula and input parameters are presented in Appendix A. An example of the TRC results from the Chemical sub‐sector is provided in Exhibit 31. The measures excluded vary by sub‐sector. This is mainly due to the differences in hours of operation for each sub‐sector, which influences the amount of annual energy use.
Exhibit 31: TRC of best practices (example using Chemical sub‐sector)
End Use Measure Name TRC ($)
TRC (Pass/Fail)
Simple Payback Period (Yrs)
Sub‐Metering $455,471 Pass 11 Energy Management $86,373 Pass 6.0
System
Integrated Control System $850,801 Pass 3.5 Condensing Boiler $626,572 Pass 1.0 Instantaneous Steam Generation $830,235 Pass 0.9 High Efficiency Burner $249,531 Pass 5.6 Economizer $210,807 Pass 4.2 Boiler Right Sizing and Load Management $758,153 Pass Not applicable Blowdown Heat Recovery $75,994 Pass 7.7 Boiler combustion air preheat $92,227 Pass 9.3
Steam boilers and steam systems
Process Heat Recovery to Preheat Makeup Water $256,765 Pass 6.8
11 Adapted from the Ontario Energy Board Total Resource Cost Test manual, 2005

Advancing Opportunities in Energy Management in Ontario Industrial and Management Sector March 17, 2010
CME / Stantec / Marbek / ODYNA 37
End Use Measure Name TRC ($)
TRC (Pass/Fail)
Simple Payback Period (Yrs)
Condensate Return $33,031 Pass 13.4 Advanced boiler controls $21,268 Pass 5.1 Blowdown Control $19,838 Pass 11.5 Insulation $249,665 Pass 2.2 Boiler Maintenance $47,260 Pass 1.1 Boiler Water Treatment $14,658 Pass 6.8 Minimize Deaerator Vent Losses $74,994 Pass 7.8
Steam Trap Survey and Repair $26,705 Pass 2.5 Direct‐Contact Hot Water Heaters $753,153 Pass Not applicable High Efficiency Burner $249,531 Pass 5.8 Water‐heater right sizing and load management $880,858 Pass Not applicable
Blowdown Heat Recovery $75,994 Pass 7.9 Boiler combustion air preheat $92,227 Pass 9.6 Process Heat Recovery to Preheat Makeup Water $330,388 Pass 6.7
Advanced water‐heater controls $154,633 Pass 5.0 Blowdown Control $19,838 Pass 11.9 Insulation $303,029 Pass 2.1 Boiler Water Treatment $14,658 Pass 7.0
Hot water heaters and boilers
Water‐heater Maintenance ‐$127,885 Fail 3.8 Insulation $43,080 Pass 4.0 Steam
systems Steam Trap Survey and Repair $4,691 Pass 2.8
High Efficiency Oven $3,992,665 Pass 24 High Efficiency Dryer $3,992,665 Pass 24 High‐efficiency Kilns $7,149,039 Pass 19 High‐efficiency Furnaces $7,149,039 Pass 19 Induction Heating ‐$10,762,466 Fail 56 High efficiency burner $3,453,130 Pass 0.9 Exhaust Gas Heat Recovery $8,951,205 Pass 0.7 Process heat recovery to preheat product $9,563,471 Pass 0.7 High efficiency burner controls $1,608,276 Pass 0.5 Advanced heating and Process Control $6,345,421 Pass 0.8 Insulation $3,196,490 Pass 0.6
Furnaces/ kilns/ ovens/ dryers
Air Curtains $11,248,295 Pass 0.4 High efficiency multiplex compressors $22,600 Pass 1.8 High Efficiency Chiller $12,573 Pass 3.2 Optimized Distribution System $270 Pass 10 Free‐cooling $42,832 Pass 2.0 Floating head pressure controls $11,542 Pass 2.1 Premium efficiency refrigeration control system $7,545 Pass 6.0
Smart Defrost Controls $13,294 Pass 0.4 Doors, Covers and Curtains ‐$5,223 Fail 10
Cooling & Refrigeration
Improve insulation of refrigeration system ‐$2,058 Fail 11 Premium efficiency pump $18,870 Pass 0.2 Impeller Trimming $121,205 Pass 0.1 Optimization of pumping system $6,977 Pass 7.8
Pumps
Premium Efficiency Control with ASDs $38,384 Pass 0.9 Premium efficiency fans and blowers $1,590 Pass 7.8 Impeller Trimming $13,675 Pass 0.8 Optimized duct design to improve efficiency ‐$6,885 Fail 18
Fans/Blowers
Premium efficiency control, with ASD $5,115 Pass 2.6

Advancing Opportunities in Energy Management in Ontario Industrial and Management Sector March 17, 2010
CME / Stantec / Marbek / ODYNA 38
End Use Measure Name TRC ($)
TRC (Pass/Fail)
Simple Payback Period (Yrs)
Synchronous Belts $1,544 Pass 3.3 Minimize damper losses on fans ‐$70 Fail 4.6 Premium Efficiency Motors $5,816 Pass 4.3 Correctly sized motors $33,349 Pass Not applicable Optimized motor control $35,984 Pass 1.5
Other Motors
Synchronous Belts $15,513 Pass 0.5 Premium Efficiency ASD Compressor $19,006 Pass 3.9 Replace pneumatic motors with mechanical $39,442 Pass 4.2
Low pressure blower to replace compressed air ‐$48 Fail 7.8
Optimized sizing and pressure of compressor system $11,121 Pass 7.0
Optimized distribution system $12,905 Pass 4.7 Optimized sizes of air receiver tanks $38,348 Pass 5.1 Use cooler air from outside for makeup air $11,177 Pass 6.1 Adjustable Speed/Variable frequency drive $35,984 Pass 1.5 Sequencing Control $3,343 Pass 7.2
Compressed air Systems
Air leak survey and repair $1,836 Pass 2.2 Improved energy efficient design $4,141,355 Pass 0.4 Improved energy efficient electrode material $5,372,032 Pass 1.3
Electrochemical
Automated and continuous operation $3,874,086 Pass 0.1 Improved equipment efficiency $30,352,475 Pass 4.1 Process
Specific Optimized process controls $21,534,891 Pass 2.3 High‐efficiency packaged HVAC $635,821 Pass 2.4 Solar Walls $63,354 Pass 10 Radiant Heaters $330,772 Pass 2.6 Ground Source Heat Pump $787,700 Pass 2.4 Ventilation Optimization $307,475 Pass 1.5 Ventilation Heat Recovery $235,183 Pass 2.0 Air Compressor Heat Recovery $194,036 Pass 2.6 Automated Temperature Control $146,416 Pass 3.0 Reduced Temperature Settings $79,038 Pass 0.1 Destratification Fans $208,365 Pass 2.3 Warehouse Loading Dock Seals $74,074 Pass 3.3
HVAC
Air Curtains $106,291 Pass 2.7 High efficiency lights and ballasts $0.25 Pass 4.7 High‐efficiency lighting design $0.28 Pass 2.5
Lighting
Automated lighting controls $0.23 Pass 1.3 The steps involved in modelling the TBPs that passed the TRC test were as follows: There are two groups of TBPs; those that are implemented at the end of the equipment
useful life (replacement TBPs) and those that can be added to equipment or to the plant process at any time (retrofit TBPs). These two groups of TBPs were modelled as follows:
natural stock turnover rates, for replacement technologies the first study milestone year, for immediate application of retrofit technologies
(note that these TBPs were assessed on the basis of the full cost of implementation). Energy use within each of the sub sectors was modelled with the same energy models used
to generate the Reference Case.

Advancing Opportunities in Energy Management in Ontario Industrial and Management Sector March 17, 2010
CME / Stantec / Marbek / ODYNA 39
The MBPs are applied as one bundle, referred to as ‘Energy Management’, to the system end use, which is the total plant energy use.
Individual TBP savings are cascaded, with each TBP saving a percentage of the remaining
energy in an end use. The absolute energy savings are calculated as the difference between the Reference case
energy consumption and the Economic potential scenario energy consumption. 9.2 Economic Potential Scenario Energy Use If all the economically feasible best practices are implemented, total Ontario industrial energy use is estimated to decrease by 110 PJ from 2007 to 2030. The estimated energy use in 2030 is 29 percent less than the energy use in the Reference Case, which is the projected energy use without any new EM market interventions after 2007, as discussed above in Section 6. The estimated energy use and savings by industry are illustrated in Exhibit 32, and summarized by sub‐sector, fuel type and end use in Exhibit 33, Exhibit 34 and Exhibit 35. The detailed results are included in Appendix H.
Exhibit 32: Reference Case and Economic Potential Scenario energy use for all industry
The economic potential energy savings per sub‐sector in 2030 range between 25 percent and 36 percent, compared to Reference Case energy use. The Fabricated Metal Products manufacturing shows the largest percentage Economic Potential savings at 36 percent compared to its own Reference Case energy use in 2030. The Chemical manufacturing sub‐sector has the lowest percentage Economic Potential energy savings, at 25 percent. The Primary Metal manufacturing sub‐sector has the second lowest percentage energy savings, at 27 percent, but accounts for the largest absolute amount energy savings at 53 PJ compared to its own Reference Case energy use in 2030. The absolute energy savings is larger for sub‐sectors
0
100
200
300
400
500
600
700
800
2007 2010 2015 2020 2025 2030
Total Ene
rgy Use (P
J)
Milestone Year
Economic Potential Scenario
Reference Case
29%

Advancing Opportunities in Energy Management in Ontario Industrial and Management Sector March 17, 2010
CME / Stantec / Marbek / ODYNA 40
that account for the largest share of energy use, while lower absolute energy savings are associated with sub‐sectors that account for a smaller share of the total energy use. Exhibit 33: Reference Case and Economic Potential Scenario energy use by sub‐sector (PJ)
Base Year Reference
Case Economic Potential
2030 Economic Potential Savings
Sub‐sector 2007 2030 2030 PJ % Primary Metal Manufacturing 152 200 147 53 27% Chemical Manufacturing 82 104 78 26 25% Paper Manufacturing 62 64 45 19 30% Non‐metallic Mineral Product Mfg. 55 79 54 24 31% Petroleum Refineries 54 74 52 23 30% Transportation Equipment & Machinery Mfg. 45 41 28 13 32% Food & Beverage Product Mfg. 37 33 23 10 31% Mining (Excl. Oil & Gas) 33 35 26 10 27% Fabricated Metal Product Mfg. 17 16 10 5.8 36% Plastics Manufacturing 15 20 14 6.0 30% Other Industry 87 78 53 24 31% Total 640 744 530 214 29% As discussed in Section 6, natural gas accounts for 43 percent of the total projected energy use in 2030, and contributes the largest amount of energy savings in the Economic Potential scenario at 2030. Natural gas is estimated to save 106 PJ in 2030 compared to the Reference Case scenario, which is 50 percent of the total 2030 industry savings. The significant savings potential estimated for the direct and indirect process heating end uses are the main reasons for the large natural gas savings potential. The system end use, which includes measures that apply to the total plant, is estimated to contribute over 35 percent of all the Economic Potential savings by 2030. Exhibit 34: Reference Case and Economic Potential Scenario energy use by energy source (PJ)
Base Year Reference
Case Economic Potential
2030 Economic Potential Savings
Energy Source 2007 2030 2030 PJ %
Natural Gas 282 323 216 106 33%
Electricity 158 176 124 52.4 30%
RPP 62.5 91.4 68.7 22.7 25%
Other 137 154 121 32.7 21%
Totals 640 744 530 214 29%
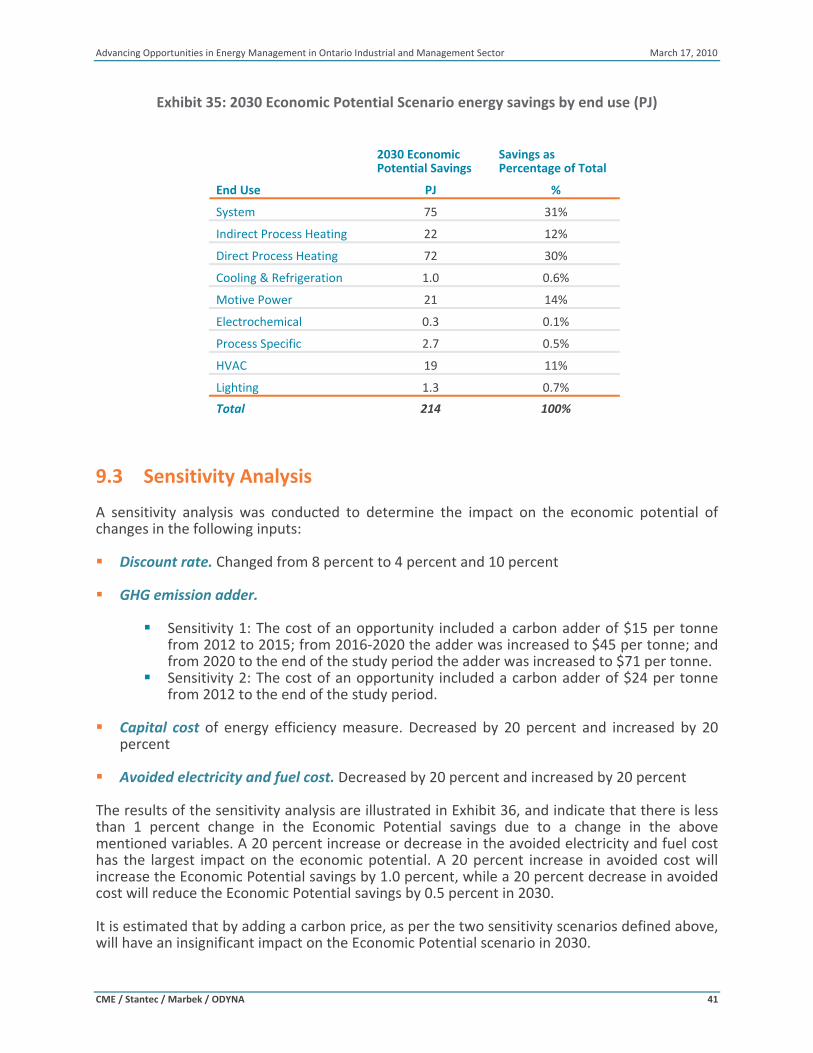
Advancing Opportunities in Energy Management in Ontario Industrial and Management Sector March 17, 2010
CME / Stantec / Marbek / ODYNA 41
Exhibit 35: 2030 Economic Potential Scenario energy savings by end use (PJ)
2030 Economic Potential Savings
Savings as Percentage of Total
End Use PJ %
System 75 31%
Indirect Process Heating 22 12%
Direct Process Heating 72 30%
Cooling & Refrigeration 1.0 0.6%
Motive Power 21 14%
Electrochemical 0.3 0.1%
Process Specific 2.7 0.5%
HVAC 19 11%
Lighting 1.3 0.7%
Total 214 100% 9.3 Sensitivity Analysis A sensitivity analysis was conducted to determine the impact on the economic potential of changes in the following inputs: Discount rate. Changed from 8 percent to 4 percent and 10 percent GHG emission adder.
Sensitivity 1: The cost of an opportunity included a carbon adder of $15 per tonne from 2012 to 2015; from 2016‐2020 the adder was increased to $45 per tonne; and from 2020 to the end of the study period the adder was increased to $71 per tonne.
Sensitivity 2: The cost of an opportunity included a carbon adder of $24 per tonne from 2012 to the end of the study period.
Capital cost of energy efficiency measure. Decreased by 20 percent and increased by 20
percent
Avoided electricity and fuel cost. Decreased by 20 percent and increased by 20 percent The results of the sensitivity analysis are illustrated in Exhibit 36, and indicate that there is less than 1 percent change in the Economic Potential savings due to a change in the above mentioned variables. A 20 percent increase or decrease in the avoided electricity and fuel cost has the largest impact on the economic potential. A 20 percent increase in avoided cost will increase the Economic Potential savings by 1.0 percent, while a 20 percent decrease in avoided cost will reduce the Economic Potential savings by 0.5 percent in 2030. It is estimated that by adding a carbon price, as per the two sensitivity scenarios defined above, will have an insignificant impact on the Economic Potential scenario in 2030.

Advancing Opportunities in Energy Management in Ontario Industrial and Management Sector March 17, 2010
CME / Stantec / Marbek / ODYNA 42
Exhibit 36: Economic Potential Sensitivity Analysis Energy Savings in 2030 (PJ)
214.2
216.4
213.6
214.2 214.2
216.3
213.2 213.1
216.4
211
212
213
214
215
216
217
Econ
omic Poten
tial
4% Discoun
t Rate
10% Discoun
t Rate
GHG emission
add
er ‐
Sensitivity 1
GHG emission
add
er ‐
Sensitivity 2
Capital Cost o
f Measures ‐20%
Capital Cost o
f Measures +20%
Avoide
d En
ergy Cost ‐
20%
Avoide
d En
ergy Cost
+20%
Total Scena
rio En
ergy Savings in
2030 (PJ)
Scenario

Advancing Opportunities in Energy Management in Ontario Industrial and Management Sector March 17, 2010
CME / Stantec / Marbek / ODYNA 43
10 Best Practices Implementation: Challenges and Barriers, and Program Concepts
Base Year Energy Use
Economic Screening of Best
PracticesEnergy Efficiency and Conservation Best Practices Base Year
Implementation of Best Practices
Economic Potential Scenario
Increasing Implementation of Best Practices: Challenges and
Program Concepts
Strategic Framework to Advance EM
Potential Reduction in GHG and CAC Emissions
8Reference Case
21
3
5
4
6
7
9
The development of programs and policies to increase implementation of best practices in industry is dependent on an understanding of the challenges industry is facing to implement the best practices. Programs and policies can be designed to address these challenges. The previous sections identified and quantified the energy savings opportunities, and this section identifies the challenges and potential program concepts, or solutions, to address the challenges. The challenges and solutions provide the necessary information to develop an action plan for industry to advance energy management, which is discussed in Section 12. 10.1 Methodology Facilitated workshops were conducted to obtain input from industry and stakeholders regarding the challenges facing industry to implement best practices, and the potential program concepts to address these challenges. Two face‐to‐face workshops and one webinar were arranged and a total of 49 representatives participated. Industry representatives accounted for close to 90 percent of the 49 representatives, while the remaining 10 percent included representatives from utilities, government and energy service providers. The questions posed to workshop participants were organized so that both barriers and solutions, or program concepts, were discussed and rated according to five strategic categories. These are essential elements in what can be referred to as a “continuum of continuous improvement” required to generate and sustain energy use performance and associated GHG emissions reductions in industry. This continuum is depicted below with the ultimate outcome being sustained results at the market, corporate and facility levels to affect a positive market transformation: Corporate practices Opportunity Assessment Taking Action Results & market transformation
The facilitation was guided by a list of 37 typical challenges and 26 program concepts. The challenges and program concepts can be classified according to seven categories. Exhibit 37 explains the relevance of the of these challenges and solutions categories.

Advancing Opportunities in Energy Management in Ontario Industrial and Management Sector March 17, 2010
CME / Stantec / Marbek / ODYNA 44
Exhibit 37: Challenges and Solutions Categories.
Challenges and Solutions Category Relevance to Continuum of Continuous Improvement Commitment to Energy Management
This is perhaps the most critical corporate practice required for successful and sustained energy use performance improvements. Workshop participants were asked to comment on aspects of senior commitment, organizational structure and accountabilities in support of EM.
Knowledge of EE Opportunities This refers to the different aspects of knowledge and capacity that needed to develop a defensible EM opportunity assessment. There are both O&M and capital expenditure business case opportunities to be generated and sustained. Workshop participants were asked to comment on knowledge pertaining to the identification of EE opportunities, understanding benefits (cost and co‐benefits) resulting from EE opportunities and understanding how to assess technical and economic feasibility of EE opportunities.
Transaction Costs This refers to the “hassle” factor and pertains to issues of time and effort to become informed about EM opportunities and programs to support implementation. The way in which companies deal with transaction costs affects the successful undertaking of opportunity assessments and taking action to implement the EM measures. Workshop participants were asked to comment on different aspects of the “hassle” factor associated with developing EM projects such as too much effort to become informed about EE opportunities and products and too much effort to become informed about funding and incentives.
Financing of EE Projects This refers to the various aspects of securing internal or external financing in support of developing the EM business case (e.g., paying for feasibility studies) and implementing the business case EM measures. The way in which companies deal with EM financing also affects the successful undertaking of opportunity assessments and taking action to implement the EM measures. Workshop participants were asked to comment on issues regarding making the business case for EE projects, accessing business case and project funding internally or externally and issues of meeting company hurdle rates.
Product and Service Availability EM product and service availability, choice and quality are essential elements that affect the ease and success of taking action and fostering desired results and market transformation. Workshop participants were asked to comment on issues of product and service availability and issues pertaining to the availability and quality of EM service providers.
Representatives were requested to identify any additional challenges and program concepts not on the list. No new challenges or solutions were added to the list and representatives viewed the list as comprehensive. Through facilitation and group discussions the representatives submitted individual scores for the challenges and program concepts. The scores from all representatives were added to determine an overall percentage score and prioritized ranking of the challenges and program concepts.

Advancing Opportunities in Energy Management in Ontario Industrial and Management Sector March 17, 2010
CME / Stantec / Marbek / ODYNA 45
10.2 Challenges and Solutions to Implement Best Practices 10.2.1 Challenge Results The top 15 challenges, in descending order of importance, are listed in Exhibit 38. Taken as a whole, this set of challenges means that investments by industry in EM continue to be sub‐optimal. As shown, two aspects of project financing are rated the most important challenges, which is perhaps not surprising given the prevalence of SME company participants in this study. It is clear that the key challenge shown here cut across all of the elements of the continuous improvement continuum with a block of issues falling into the key category of knowledge (an issue of capacity building).
Exhibit 38: Summary Results of Challenges.
Category Description of Challenge/Barrier
Financing of EE Projects Difficult to obtain company financing to implement EE projects.
Financing of EE Projects Payback period for EE projects are too high, or ROI is too low.
Transaction Costs Too much effort to access assistance, funding and incentives from programs.
Commitment to Energy Management
The company has a lack of human resources to focus on energy management.
Commitment to Energy Management
Production is the dominant focus, and EM is not seen as a production element.
Product and Service Availability Do not know where to find reputable energy service providers.
Knowledge of EE Opportunities Do not know how to assess technical and economic feasibility of EE opportunities.
Knowledge of EE Opportunities Do not know how to identify EE opportunities.
Knowledge of EE Opportunities Have limited knowledge of what EE opportunities/products exist.
Knowledge of EE Opportunities Do not have knowledge of benefits (cost and co‐benefits) resulting from EE opportunities.
Transaction Costs Too much effort to become informed about funding and incentives available from programs.
Financing of EE Projects Do not know where to find sources of funding and incentives.
Product and Service Availability Advanced EE products are not easily available.
Transaction Costs Too much effort to become informed about EE opportunities and products in the market.
Knowledge of EE Opportunities Do not know where to find information about EE opportunities and products.
10.2.2 Solutions Results Workshop participants were asked to rate the importance of potential solutions relating to each challenge within the five categories used to probe for key strategic challenges. The top 15 solutions, in descending order of importance, are listed in Exhibit 39.

Advancing Opportunities in Energy Management in Ontario Industrial and Management Sector March 17, 2010
CME / Stantec / Marbek / ODYNA 46
The results suggest that industry: Is seeking an integrated, streamlined means of accessing and using programs aimed at
improving productivity. There is inertia due, in part, to the real and perceived transaction costs of using support programs effectively.
Needs human resource (HR) capacity to manage and advance the EM file. Needs financial support to make the business case for EM measures and to implement
those measures (in effect, needing help to de‐risk EM). Is seeking capacity building help and assistance for the adoption of innovative EM and clean
technology solutions.
Exhibit 39: Summary Results of Solutions.
Category Potential Solution
Transaction Costs One stop centre/platform for accessing programs.
Commitment to Energy Management
Embedded energy manager (includes: energy specialist dedicated to a group of SME).
Knowledge of EE Opportunities Centralized source of information for EE opportunities.
Financing of EE Projects Incentive to develop business case (incl. detailed feasibility assessment).
Product and Service Availability Energy courses and plant assessment track for universities/colleges.
Financing of EE Projects Incentive based on amount of energy saved.
Financing of EE Projects Fixed cost incentive for prescribed equipment.
Product and Service Availability Funding and centres for innovation and commercialization of EE technology
Product and Service Availability Certification of service providers.
Knowledge of EE Opportunities Promotion and marketing of knowledge centres.
Financing of EE Projects Centre facilitating access to financing (e.g. performance contracts, third party financing).
Knowledge of EE Opportunities Third party EE opportunity identification/assessments.
Knowledge of EE Opportunities Capacity building and training workshops (technical and management).
Commitment to Energy Management
Assistance to implement ISO standard for energy management
Commitment to Energy Management
EM capacity building workshops.

Advancing Opportunities in Energy Management in Ontario Industrial and Management Sector March 17, 2010
CME / Stantec / Marbek / ODYNA 47
11 Potential Reduction in GHG and CAC Emissions
Base Year Energy Use
Economic Screening of Best
PracticesEnergy Efficiency and Conservation Best Practices Base Year
Implementation of Best Practices
Economic Potential Scenario
Increasing Implementation of Best Practices: Challenges and
Program Concepts
Strategic Framework to Advance EM
Potential Reduction in GHG and CAC Emissions
8Reference Case
21
3
5
4
6
7
9
The greenhouse gas (GHG) and criteria air contaminants (CAC) emissions associated with the energy savings potential are discussed in this section. The energy use and potential energy savings due to the implementation of best practices are analyzed in the previous sections. 11.1 Methodology The Base Year and Reference Case energy use described in Sections 5 and 6 were converted to the equivalent GHG and CAC emissions using the emission factors summarized in Appendix B. The energy savings determined for the Economic Potential scenario, in Sections 9, were also converted to the associated GHG and CAC emissions using the emission factors in Appendix B. For GHG emissions it is important to understand the impact electricity use has on a plant’s carbon footprint. Electricity use is therefore included in the GHG emission calculations, while it is excluded from the CAC emission calculations. 11.2 Base Year, Reference Case and Economic Potential Scenario
Emissions The 2007 Base Year GHG emissions associated with energy use are 39.5 million tonnes CO2eq and the associated CAC emissions are 92,900 kg. Due to the projected increase in energy use in the Reference Case it is estimated that the GHG emissions will increase by 16 percent and CAC emissions by 17 percent. The results are presented in Exhibit 40, Exhibit 41 and Exhibit 42. If all the economically feasible energy efficiency best practices are implemented, as per the Economic Potential scenario described in Section 9, the reduction in GHG emissions is estimated to be 12.6 million tonnes CO2eq (or 27 percent) less compared to the Reference Case in 2030. The Economic Potential scenario CAC emission reduction is estimated to be 27,500 kg (or 25 percent) compared to the Reference Case in 2030.

Advancing Opportunities in Energy Management in Ontario Industrial and Management Sector March 17, 2010
CME / Stantec / Marbek / ODYNA 48
Exhibit 40: 2030 Reference Case and Economic Potential Scenario GHG savings by industry
0
20
40
60
80
100
120
0
5
10
15
20
25
30
35
40
45
50
2007 2010 2015 2020 2025 2030
CAC Em
ission
s (1,000
kg)
GHG Emission
s (1 million tonn
e CO
2eq)
Milestone Year
Reference Case GHG emissions
Economic Potential GHG emissions
Reference Case CAC emissions
Economic Potential CAC emissions
Exhibit 41: 2030 Reference Case and Economic Potential Scenario GHG emission savings by
sub‐sector (1 million tonne CO2eq)
Base Year Reference
Case Economic Potential
2030 Economic Potential Savings
Sub‐sector 2007 2030 2030 1 mil. tonne
CO2eq %
Primary Metal 11.9 15.0 11.3 3.8 15%
Chemical 4.9 6.1 4.6 1.5 23%
Paper 3.3 3.4 2.4 1.0 24%
Non‐Metallic Mineral 4.0 5.5 3.9 1.6 20%
Petroleum and Coal 2.9 4.0 2.8 1.2 21%
Transportation Equipment and Machinery 2.3 2.1 1.4 0.6 28%
Food, Beverage and Tobacco 1.9 1.7 1.2 0.5 28%
Mining 1.9 2.0 1.5 0.5 22%
Fabricated Metal 0.8 0.8 0.5 0.3 31%
Plastics and Rubber 0.8 1.0 0.7 0.3 26%
Other 4.8 4.2 2.9 1.3 27%
Totals 39.5 45.8 33.2 12.6 27%

Advancing Opportunities in Energy Management in Ontario Industrial and Management Sector March 17, 2010
CME / Stantec / Marbek / ODYNA 49
The largest absolute Economic Potential reduction in GHG emissions are observed in the Primary Metal, Chemical and Non‐metallic Mineral products manufacturing sub‐sectors. The largest percentage decrease in GHG emissions within a sub‐sector is observed in the Fabricated Metal manufacturing, which shows a decrease of 31 percent compared to the Reference Case in 2030. These observations are very similar to the CAC emission results where the largest Economic Potential reduction, in absolute terms, is in the Primary Metal, Chemical and Non‐metallic Mineral products manufacturing sub‐sectors. Exhibit 42: 2030 Reference Case and Economic Potential Scenario CAC emission savings by
sub‐sector (1,000 kg)
Base Year Reference
Case Economic Potential
2030 Economic Potential Savings
Sub‐sector 2007 2030 2030 1,000 kg %
Primary Metal 38.5 47.0 36.0 11.0 23%
Chemical 11.8 14.0 10.9 3.1 22%
Paper 5.1 5.1 3.8 1.3 26%
Non‐Metallic Mineral 12.2 16.1 11.7 4.4 27%
Petroleum and Coal 6.4 9.2 6.4 2.8 30%
Transportation Equipment and Machinery 2.5 2.4 1.6 0.7 31%
Food, Beverage and Tobacco 3.0 2.8 1.9 0.9 31%
Mining 3.5 3.5 2.8 0.7 20%
Fabricated Metal 0.8 0.8 0.4 0.3 42%
Plastics and Rubber 0.7 1.0 0.7 0.3 27%
Other 8.3 7.0 5.0 2.0 29%
Totals 92.9 108.8 81.3 27.5 25%

Advancing Opportunities in Energy Management in Ontario Industrial and Management Sector March 17, 2010
CME / Stantec / Marbek / ODYNA 50
12 Strategic Framework to Advance Energy Management
Base Year Energy Use
Economic Screening of Best
PracticesEnergy Efficiency and Conservation Best Practices Base Year
Implementation of Best Practices
Economic Potential Scenario
Increasing Implementation of Best Practices: Challenges and
Program Concepts
Strategic Framework to Advance EM
Potential Reduction in GHG and CAC Emissions
8Reference Case
21
3
5
4
6
7
9
The best practices implementation benchmarking and EM potential analysis highlighted the energy savings opportunities in industry. The challenges facing industry to increase the implementation of best practices were identified in Section 10, together with the potential program concepts to address the challenges. These opportunities, challenges and solutions, or program concepts, provide the necessary input for a framework to advance EM in Ontario industry. The framework is presented in this report as an Action Plan. This section presents an executive level Action Plan aimed at accelerating and expanding the Ontario industry/manufacturing take‐up of EM opportunities. The Action Plan is organized according to the following elements: Recap of the Opportunity Recap of Challenges and Solutions Action Plan‐Vision Action Plan Policy Framework Action Plan Program Solutions. 12.1 Recap of Opportunities Taking from the results presented in the previous sections, the EM and GHG reduction opportunity in Ontario industry can be summarized as presented in Exhibit 43.
Exhibit 43: Recap of EM Potential
Opportunity Areas Key Performance Indicators Results Total Savings 214 PJ, or 29 percent of the 2030 Reference Case
energy consumption Total savings‐Electricity portion 52.4 PJ, or 24 percent of the total savings in 2030 Total savings‐Gas portion 106 PJ, or 50 percent of the total savings in 2030 Sector opportunity 7 sectors represent 80 percent of the total savings
Energy management potential‐ savings opportunity
End‐use opportunity Direct and Indirect Process Heating represent 44 percent of the total savings in 2030.
Total GHG 12.6 million tonne CO2eq in 2030 GHG and CAC reduction opportunity ‐ absolute potential
Total CAC 27.5 million kg in 2030

Advancing Opportunities in Energy Management in Ontario Industrial and Management Sector March 17, 2010
CME / Stantec / Marbek / ODYNA 51
12.2 Recap of Challenges and Solutions As discussed in Section 10, the challenges identified by industry that, together, act to impede the take‐up of cost‐effective EM, mean that investments by industry in EM continue to be sub‐optimal. Two aspects of project financing were rated among the most important challenges, which is perhaps not surprising given the prevalence of SME company participants in this study. The key challenge identified by industry cut across all of the elements of the continuous improvement continuum with a block of issues falling into the key category of knowledge (an issue of capacity building). The identified priority solutions suggest that industry: Is seeking an integrated, streamlined means of accessing and using programs aimed at
improving productivity. Needs human resource (HR) capacity to manage and advance the EM file. Needs financial support to make the business case for EM measures and to implement
those measures (in effect, needing help to de‐risk EM). Is seeking capacity building help and assistance for the adoption of innovative EM and clean
technology solutions.
12.3 Action Plan Vision Statement 12.3.1 Context This sub‐section elaborates a vision and a public policy mandate that responds to the results and insights generated from this study in the context of the significant changes and uncertainties faced by industry and manufacturing in the province. Global Recession In 2008, Ontario industry generated $93.3 billion in gross domestic product (GDP), amounting to nearly 20 percent of the province’s total GDP.12 Yet, at the same time, the global recession has taken an enormous toll on Canadian industry; a recent Globe and Mail article states that 230 thousand manufacturing jobs were lost nationally in the past year accounting for 60 percent of the net employment drop during the recession.13 Ontario has borne the brunt of this loss. Carbon Management The implementation of greenhouse gas (GHG) regulations and the development of a variety of programs and initiatives designed to decrease GHG emissions and combat global warming have been emerging throughout North America in recent years. Mandatory or voluntary GHG emission caps or targets for GHG emitting entities have already been instigated in a number of
12 http://www.investinontario.com/siteselector/bcei_205.asp 13 Konrad Yakabuski, “Make or Break‐Rethinking the Manufacturing Sector”, Globe and Mail Report on Business, September 7, 2009.

Advancing Opportunities in Energy Management in Ontario Industrial and Management Sector March 17, 2010
CME / Stantec / Marbek / ODYNA 52
jurisdictions, along with various carbon management initiatives, such as GHG reporting and emissions trading. If both Ontario and Canada’s proposed GHG regulations were to come into force, the regulations would require reductions in the emissions of GHG gases from the most emission‐intensive industrial emitters in Ontario, particularly the energy and manufacturing sectors. The impact of the carbon market on Ontario industries and some of the consequences of having to comply with these new GHG regulations are summarized below.
Reporting The Ontario government has developed GHG reporting requirements based on a combination of EPA and WCI GHG reporting protocols. The Ministry of the Environment has implemented the GHG Emissions Reporting Regulation (in preparation for a cap and trade program), which includes the following requirements: Industrial facilities in Ontario are required to report direct GHG emissions only under both the Ontario and federal GHG Reporting Programs.14 The reporting of indirect emissions resulting from electricity generation and supply are the responsibility of the generators and suppliers. Reporting for all regulated sources that are emitting 25,000 tonnes of carbon dioxide equivalent (CO2e) or more per year; Smaller emitters (facilities emitting between 10,000 and 25,000 tonnes) are not required to report under the current proposed regulation. The Ministry will develop an outreach program to encourage voluntary reporting for these smaller emitters, so that they are prepared to adapt to emerging North America‐wide requirements with which Ontario will likely align.
Increased Costs to Regulated & Non‐Regulated Companies
The implementation of Ontario’s GHG Reporting Regulation and its proposed Cap & Trade System are likely to have substantial incremental costs for Ontario industry, with these costs broken down as follows.
Reporting: The process of having to understand the reporting guidelines and reporting process, implementing required monitoring measures, data collection, preparation of GHG Reports, and undergoing verification procedures will all be an added cost to industries. Protocols for regulatory reporting may create a need for additional infrastructure (such as specific monitoring devices) in order for companies to comply. Internal re‐structuring may be required as well, as new policies, procedures and appropriate internal controls may be needed to govern management of the newly imposed regulations. Meeting Emissions Cap Requirement: The implementation of a cap and trade system would require action to reduce GHG emissions by the most emission‐intensive industrial emitters. Not only does that result in increased costs due to completing transactions and developing
14 direct emissions are defined as releases from sources that are located at the facility. Note that emissions from mobile combustion (i.e. fleet vehicles) are excluded from Ontario reporting requirements, but are included in the federal reporting requirements.

Advancing Opportunities in Energy Management in Ontario Industrial and Management Sector March 17, 2010
CME / Stantec / Marbek / ODYNA 53
internal management structures, but it results in the potential costs they will face in complying with the regulations, i.e., completing in‐house reductions, trading allowances or purchasing offsets.
Yet, at the same time the benchmarking results show a very low implementation or planned implementation of corporate carbon management plans. In response to these and other circumstances, both industry and public policy leaders are investing considerable effort to advance policy solutions that will help position industry to be competitive over the long‐term. Indeed, there has been an emerging reconsideration among public policy circles of the importance of manufacturing, a fresh perspective that brings to the fore the need to consider how to sustain and grow manufacturing as a vital engine for value added jobs and a market for innovation and applied R&D. Certainly, there is a strategic role for EM, as it represents a business strategy that can cost‐effectively advance industry’s efforts to achieve sustainability, as well as pay off with significant societal benefits illustrated in Exhibit 44.
Exhibit 44: Benefits of Energy Management
Benefits Benefit to Industry Benefit to Society
Reduced operating costs X
Increased productivity X X
Reduced air emissions per unit of output X X
Defer or avoid new power generation infrastructure X
Retention of manufacturing jobs and value added X X The key questions going forward are: What policy strategy, mix of instruments and approach to deployment is needed to sustain
Ontario industry and manufacturing? Is there a need for a paradigm shift regarding the way in which policy and program solutions
are deployed to industry? What are the underlying conditions needed to affect a positive and sustained market
transformation? 12.3.2 Vision Statement The Vision Statement for Ontario industry comprises the following elements: Industry energy productivity will increase (as measured in terms of physical and GDP output
per unit of energy input), Companies will successfully integrate EM with productivity improvement best practices
(e.g., Lean), pollution prevention and innovation. Companies will achieve high rates of adoption of management and technical best
practices,

Advancing Opportunities in Energy Management in Ontario Industrial and Management Sector March 17, 2010
CME / Stantec / Marbek / ODYNA 54
Industry will be more resource efficient and resilient and will be potentially net producers of
low carbon energy and producers and buyers of clean technologies, Companies will be sustainable in every respect: productive sustainability, energy
sustainability, and environmental sustainability, Industrial human resources and the EM supply chain will have the skills, knowledge and
demand to achieve performance targets. 12.3.3 Paradigm Shift to Achieve the Vision There are two high level pathways to achieving the Vision for Ontario industry and they involve a choice between maintaining a current paradigm of a “silo” approach to deployment of program support versus a more integrated seamless, low transaction cost access to financial, capacity building and technology solutions. The results from this study suggest that Ontario industry may not be ready yet for a full scale paradigm shift of corporate practices and that at least, in the short‐term, there are critical, strategic areas of support needed to help companies generate and show results in the short term. Under the old adage of “success breeds success”, a logical and strategic application of priority solutions will hopefully create short‐term project and HR solutions to provide enough evidence to catalyze more ambitious actions among companies. However, there is a cost to deferring action towards a paradigm shift that should not be underestimated. For instance, we know that it can take several years for a company or plant to convert its existing production system to a new Lean oriented approach; this becomes a “lost opportunity” to effectively integrate management and technical best practices for EM, if not addressed as part of the transition. With this in mind, Exhibit 45 presents a policy/program “results chain” elaborating a linkage between the deployment of policy/program solutions and the desired intermediate and longer‐term results.

Advancing Opportunities in Energy Management in Ontario Industrial and Management Sector March 17, 2010
CME / Stantec / Marbek / ODYNA 55
Exhibit 45: Results Chain
Provide Policy/Program Solutions
Ongoing Engagement
Networks Training
Opportunities & Solutions
Opportunity Assessment[energy management, lean,
Solutions Plan
Energy Management Integrated
Implementation and M&V
Activities
Intermediate Results
Long Term Results
Improved Ccmpetitiveness & knowledge
Increased innovation and adoption of clean technologies
Energy management& sustainability projects
Improved energy use performance
Improved productivity & reduced environmental
Financially viable and sustained companies through:‐ improved energy use performance‐ productivity improvement‐ increased integration of energy management and lean

Advancing Opportunities in Energy Management in Ontario Industrial and Management Sector March 17, 2010
CME / Stantec / Marbek / ODYNA 56
The deployment of policy/program solutions falls into two streams: On‐going engagement with industry: This involves two additionally separate but linked
streams, optimized use of networks (e.g., the CIPEC Task Force model, CME Lean Consortia) and training/capacity building (e.g., Dollars to $ense workshops; CME Lean workshops).
Operating and capital expenditures projects: This involves support for a progression from opportunity assessment through to implementation and measurement and verification. As shown, the opportunity assessment could be focused solely on EM or, conversely, could take an integrated, one‐stop solution approach which was the priority solution advanced by workshop participants. Exhibit 46 illustrates how a one‐stop solutions executing agency could conceivably act as a catalyst and nexus for successful deployment of various integrated EM and other solutions. The one‐stop platform is not a program delivery agent, but is a support for industry to help accessing programs and optimizing the benefits of the various programs and solutions. We are starting to see some early evidence of public policy solutions that help to bring convergence to the suite of program solutions for industry. For instance, there are programs that bring together various approaches to Lean (e.g., kaizen events) with the identification of EM opportunities referred to as “Process Reengineering for Increased Manufacturing Efficiency” and “Value and Energy Stream Mapping”.
Exhibit 46: One‐Stop Platform Concept.
One‐Stop Platform
Ontario Manufacturing CouncilOntario Advanced Manufacturing
Investment Strategy
CME‐ONManufacturing 20/20
CME/ON Gov’tLEAN consortium
CMESMART Program
OPA/Union Gas/EnbridgeLocal Distribution Co’s
Ontario BioAuto Council
NRCan Programs
…that has assistance to access programs
on a path…
…to integrated sustainability and
productivity.
Raw Materials Products
Consider Industry …
Reduced Energy
Water consumption
Toxics
Hazardous
Energy
Water
Toxics
Hazardous
OCETA Industrial Sustainability Programs
Raw Materials Products
Reduced Energy
Water
Toxics
Hazardous

Advancing Opportunities in Energy Management in Ontario Industrial and Management Sector March 17, 2010
CME / Stantec / Marbek / ODYNA 57
12.4 Policy Framework There is a broad range of opinion on what constitutes the best package of and approach to taking policy action that will help generate the required enabling conditions. Ontario industry operates in two intersecting “worlds”, one where some of the EM investment decisions are “locked in” through legislated, regulatory measures (e.g., minimum performance standards for various products) and, the other, where there is room for innovative means of generating new, incremental investments to advance energy use performance. In the final analysis, policy instruments are a means to an end, i.e., they are used to help generate certain market conditions that act as enablers for aggressive EM to be attained and sustained. For industry, the enabling market conditions and supporting policy instruments need to reflect and respond to the barriers and solutions profile as elaborated earlier in this section. Exhibit 47 below shows the proposed policy responses to the desired industry market conditions.
Exhibit 47: Proposed Policy Responses.
Market conditions desired by Industry
Sub‐conditions Policy response
Energy supply Clarity on long‐term supply security
Address transmission & distribution bottlenecks
Clarity and support role of LDCs in EM deployment
Regulatory certainty and clarity‐Energy
Risk management in transition to SMART GRID
Energy pricing Clarity on price impact of cap and trade
Reporting Clarity on reporting requirements
Tools etc to minimize transaction costs
Response Credit for early action
Clarity on thresholds
Regulatory certainty and clarity‐Carbon
Economic incentives
Tools etc to minimize transaction costs
Linkage to new business & economic strategies
Create new valuation methods
Economic incentives
Create one‐stop platform for access & implementation
Expand focus on EM more broadly/elevate EM as a strategic business solution
Training/capacity building to accommodate an integrated solutions approach

Advancing Opportunities in Energy Management in Ontario Industrial and Management Sector March 17, 2010
CME / Stantec / Marbek / ODYNA 58
12.5 Program Solutions Exhibit 48 presents a menu of program solutions fully aligned to the priority list of solutions identified by industry. While many of these program types and program delivery vehicles are already being offered to Ontario industry, the issue in the short‐term is how to enhance their effectiveness given the findings of the study and the barriers identified by industry. One of the key program solutions in this menu is training and capacity building. The technical and management best practices analysis reveals substantial room for improvement, which can be addressed, in part, by various executive and plant level training and capacity building initiatives. For instance, the federal Dollars to $ense program suite could be enhanced to develop new modules aimed at fostering these practices and better understanding the value proposition of possible O&M and capital investments.
Exhibit 48: Proposed Program Solutions.
Category Priority Solutions Identified by
Industry Program solutions: Examples
Transaction Costs One stop centre/platform for programs.
Create special executing agency
Modify existing agency
Cost share special purpose FTE‐energy managers for company or plant deployment
Embedded energy manager (includes: energy specialist dedicated to a group of SME). Cost share roving roster of FTE‐energy
managers
Commitment to Energy Management
Design curricula & Train FTE‐energy managers
Knowledge of EE Opportunities
Centralized source of information for EE opportunities.
Develop a 1 source portal
Financing of EE Projects
Incentive to develop business case (incl. detailed feasibility assessment).
Provide grants on cost‐share basis
Develop provincial strategy and curricula Product and Service Availability
Energy courses and plant assessment track for universities/colleges. RFP for delivery
Financing of EE Projects
Incentive based on amount of energy saved.
Performance based incentives
Financing of EE Projects
Fixed cost incentive for prescribed equipment.
Rebate and ACCA incentives
Better coordination among existing agencies Product and Service Availability
Funding and centres for innovation and commercialization of EE technology
Create enhanced productivity audits that identify innovation deployment solutions for EM and Clean technologies
Product and Service Availability
Certification of service providers. Create certification program
Create special executing agency
Better coordination among existing agencies
Knowledge of EE Opportunities
Promotion and marketing of knowledge centres.
Develop a 1 source portal

Advancing Opportunities in Energy Management in Ontario Industrial and Management Sector March 17, 2010
CME / Stantec / Marbek / ODYNA 59
13 References 13.1 References Used in Developing Sub‐Sector Profiles Natural Resources Canada and Canadian Steel Producers Association (2007), Benchmarking
Energy Intensity in the Canadian Steel Industry. Natural Resources Canada and Mining Association of Canada (2003), Benchmarking the Energy
Consumption of Canadian Underground Bulk Mines. Natural Resources Canada and Mining Association of Canada (2003), Benchmarking the Energy
Consumption of Canadian Open‐Pit Mines. Natural Resources Canada and Canadian Foundry Association (2003), Guide to Energy Efficiency
Opportunities in Canadian Foundries. Natural Resources Canada (2002), Energy Consumption Benchmark Guide: Conventional
Petroleum Refining in Canada. Natural Resources Canada and Pulp and Paper Research Institute of Canada (2002), Energy Cost
Reduction in the Pulp and Paper Industry – An Energy Benchmarking Perspective. Natural Resources Canada (2001), Energy Consumption Benchmark Guide: Cement Clinker
Production. Natural Resources Canada and National Dairy Council of Canada (2001), Energy Performance
Indicator Report: Fluid Milk Plants. Natural Resources Canada and Aluminum Association of Canada (1998). Guide to Energy
Efficiency in Smelters. Natural Resources Canada and Rubber Association of Canada, Energy Efficiency Opportunities in
the Canadian Rubber Industry. US Department of Energy – Energy Efficiency and Renewable Energy (2009). Energy Use and
Loss Footprints. Website: http://www1.eere.energy.gov/industry/program_areas/footprints.html

Advancing Opportunities in Energy Management in Ontario Industrial and Management Sector March 17, 2010
CME / Stantec / Marbek / ODYNA 60
14 Glossary Baseline technology The existing equipment, against which upgrade technologies are compared and to which energy efficiency measures are applied. Base Year The Base Year is the year to which all potentials are compared. It provides a detailed description of “where” and “how” energy is currently used in each sector. For this study, it is the calendar year 2007. Criteria air contaminants A group of air pollutants including emissions of carbon monoxide (CO), sulfur oxides (SOx), nitrogen oxides (NOx), and particulate matter (PM), which are often the products of the combustion of fossil fuels or industrial processes. Economic potential The economic potential scenario presents estimates of the level of savings that would occur if all the TBPs that pass the economic benefit cost test, in this case the TRC test, were applied to the industry sectors. Economically feasible An energy efficiency measure is considered economically feasible if it passes the total resource cost test. Energy efficiency and energy conservation best practices The management and operation practices that represent the most advanced practices available to an industry. Energy end use profile The percent breakdown, by fuel type, of energy use for a generic plant in a given sub‐sector. Energy management The focus of the energy management (EM) potential analysis is to quantify the potential reduction in energy consumption due to EM actions. In this context, EM addresses energy consumption and not energy demand. Generic plant A theoretical plant used to model an average plant within a given sub‐sector. Generic plants are composed of an energy use profile and average energy usage. Greenhouse gas emissions The emission, most often through the burning of fossil fuels, of gases that act to trap heat in the atmosphere, contributing to global warming.

Advancing Opportunities in Energy Management in Ontario Industrial and Management Sector March 17, 2010
CME / Stantec / Marbek / ODYNA 61
Industrial and manufacturing sector Relates to all Industrial and Manufacturing operations, as defined at the 2 digit North America Industry Classification System (NAICS) code level and included under: NAICS 21: Mining and Quarrying (excluding Oil and Gas Extraction), and NAICS 31 – 33: Manufacturing. Management best practices Management Best Practices address the people aspect in reducing energy use. In an industrial organization, management best practice is illustrated by a high level of commitment, awareness, organization and action in support of energy efficiency. An example of EM best practices is having a policy and plan to manage energy. Market penetration rate The level at which a given measure is present in the market place. Milestone years Key years over the study period at which estimates of energy consumption and potential reductions are estimated. Natural conservation The future change in energy intensity that is expected to occur in the absence of government, utility or association EM programs. Replacement measure/technology An energy efficiency measure/technology that can be installed to replace a less efficient piece of equipment. Replacement measures are applied on an incremental cost basis, as they are normally implemented once the existing piece of equipment has reached the end of its useful life and would have to be replaced in any case. Reference Case This is a projection of energy use to 2030, in the absence of any new EM market interventions after 2007 (i.e., incremental to what utilities and government have already planned for this period). The reference case is the baseline against which the scenarios of energy savings are calculated. Retrofit measure/technology An energy efficiency measure/technology that can be used to upgrade an existing piece of equipment, as opposed to replacing it. Retrofit measures are applied on a full cost basis and may be implemented immediately. Sub‐Sector A classification of customers within a sector by common features. Industrial sub‐sectors are grouped by product type (pulp and paper, solid wood products, chemicals, etc.). Technical best practices A set of energy efficiency measures that represent the most advanced technology available. Total Resource Cost test An economic test that compares the total costs of energy efficiency investments to the social cost of energy production. Un‐priced environmental and social costs may be accounted for by changing the cost of either the investment under consideration or the total cost of each fuel type in such a way that relative un‐priced impacts are reflected.

Advancing Opportunities in Energy Management in Ontario Industrial and Management Sector March 17, 2010
CME / Stantec / Marbek / ODYNA 62
15 Abbreviations CAC: Criteria air contaminants CME: Canadian Manufacturers and Exporters CO: Carbon monoxide CO2: Carbon dioxide CO2e: CO2 equivalent tonnes EM: Energy management GHG: Greenhouse gas MBP: Management best practices NAICS: North America Industry Classification System NEB: National Energy Board NOx: Nitrogen oxides NPV: Net present value OPA: Ontario Power Authority PM: particulate matter RPP: Refined petroleum products SOx: Sulphur oxides SME: Small and medium enterprises TBP: Technical best practices TRC: Total resource cost

Advancing Opportunities in Energy Management in Ontario Industrial and Management Sector March 17, 2010
CME / Stantec / Marbek / ODYNA A‐1
Appendix A Total Resource Cost Test and Relevant Parameters

Advancing Opportunities in Energy Management in Ontario Industrial and Management Sector March 17, 2010
CME / Stantec / Marbek / ODYNA A‐2
Total Resource Cost Test and Relevant Parameters The economic benefit cost test used in the study is the Total Resource Cost test (TRC), which calculates the net present value (NPV) of the benefit and cost streams associated with EM measure investments according to the following equation15:
TRC = NPV(Annual Avoided Fuel, Electricity and Water Costs) – Capital Costs – NPV(Annual O&M Costs)
If the TRC is positive, then the net benefits of the measure outweigh the costs, and the measure should be implemented. This calculation includes the following inputs: the avoided natural gas, electricity and other fuel costs, the life of the technology, and the selected discount rate. The TRC test benefits cash flow stream is based on a valuation of what are referred to as the “avoided costs”, which is the benefit to society of not having to supply the next, marginal unit of energy supply, such as a kW electricity or m3 of natural gas. For example, electricity supply costs include energy costs and generation, transmission, and distribution capacity. The avoided costs used in the assessment are provided below, in exhibit A‐1. A real discount rate of 8 percent was used in economic calculations. This rate is recommended by the Treasury Board of Canada Secretariat16. A sensitivity analysis was conducted on the following variables: Discount rate: 4 percent and 10 percent GHG emission adder:
Sensitivity 1: The cost of an opportunity included a carbon adder of $15 per tonne from 2012 to 2015; from 2016‐2020 the adder was increased to $45 per tonne; and from 2020 to the end of the study period the adder was increased to $71 per tonne.
Sensitivity 2: The cost of an opportunity included a carbon adder of $24 per tonne from 2012 to the end of the study period.
Capital cost of energy efficiency measure: Decreased by 20 percent and increased by 20
percent
Avoided electricity and fuel cost: Decreased by 20 percent and increased by 20 percent
15 Ontario Energy Board (2008). Guidelines for Electricity Distributor Conservation and Demand Management (Report number: EB-2008-0037) 16 Treasury Board of Canada Secretariat (2007). Canadian Cost-Benefit Analysis Guide – Regulatory Proposals.

Advancing Opportunities in Energy Management in Ontario Industrial and Management Sector March 17, 2010
CME / Stantec / Marbek / ODYNA A‐3
Exhibit A‐1: Avoided Supply Cost
Supply Source of Information and Assumptions Base Year Prices (2007)
Natural Gas
National Energy Board Energy Futures 2009 Report reference case natural gas price $11.66/GJ
Electricity Avoided cost provided by Ontario Power Authority $15.07/GJ
RPP National Energy Board Energy Futures 2009 Report reference case heavy fuel oil price $14.79/GJ
Other Weighted average of natural gas price and National Energy Board Energy Futures 2009 Report price of coal. $ 3.14/GJ
Exhibit A‐2: Net Present Values of Avoided Supply Cost
Year 2007 2008 2009 2010 2011 2012 2013 2014 2015 2016 2017 2018
Electricity $15.07 $13.55 $27.76 $41.11 $52.85 $64.20 $75.09 $84.99 $94.04 $102.28 $109.85 $116.77Natural Gas $11.66 $13.49 $22.35 $31.07 $40.51 $49.26 $57.39 $64.91 $71.85 $78.28 $84.22 $89.71
RPP $14.79 $18.73 $29.44 $41.21 $54.06 $66.20 $77.67 $88.29 $98.12 $107.22 $115.65 $123.44
Other $3.14 $3.81 $7.08 $10.06 $12.95 $15.64 $18.14 $20.45 $22.59 $24.57 $26.40 $28.09
Year 2019 2020 2021 2022 2023 2024 2025 2026 2027 2028 2029 2030
Electricity $123.06 $128.85 $134.59 $139.88 $144.77 $149.28 $153.44 $157.28 $160.83 $164.10 $167.11 $169.90Natural Gas $94.80 $99.51 $104.19 $108.52 $112.53 $116.24 $119.67 $122.86 $125.80 $128.53 $131.06 $133.40
RPP $130.66 $137.36 $144.01 $150.17 $155.88 $161.17 $166.07 $170.61 $174.81 $178.71 $182.32 $185.66
Other $29.67 $31.12 $32.57 $33.91 $35.15 $36.29 $37.36 $38.34 $39.26 $40.10 $40.89 $41.61

Advancing Opportunities in Energy Management in Ontario Industrial and Management Sector March 17, 2010
CME / Stantec / Marbek / ODYNA B‐1
Appendix B Energy Conversion and Emission Factors

Advancing Opportunities in Energy Management in Ontario Industrial and Management Sector March 17, 2010
CME / Stantec / Marbek / ODYNA B‐2
B.1 Energy Content Conversion Factors The energy content conversion factors used in the analysis and associated references are summarized in Exhibit B‐1.
Exhibit B‐1: Energy Content Conversion Factors
Energy Source
Unit Conversion Applies To
Conversion Factor to GJ Units Reference
Electricity kWh 0.0036 GJ/kW National Energy Board (a)
Fuel Oil No. 2 m3 38.51 GJ/m3 National Energy Board (a)
Fuel Oil No. 6 m3 40.90 GJ/m3 National Energy Board (a)
Diesel (transport) m3 38.68 GJ/m3 National Energy Board (a)
Gasoline (transport) m3 34.66 GJ/m3 National Energy Board (a)
Propane m3 25.53 GJ/m3 National Energy Board (a)
Natural gas m3 0.03758 GJ/m3 Average of gas content values provided by Enbridge and Union Gas
Coal t 25.43 GJ/t Statistics Canada (b)
Steam t 2.75 GJ/t Statistics Canada (b)
Biomass – solid wood waste t 18 GJ/t Statistics Canada (b) Biomass – spent pulping liquor t 14 GJ/t Statistics Canada (b)
(a) National Energy Board (Energy Conversion Tables at www.neb‐one.gc.ca) (b) Statistics Canada (Energy Statistics Handbook – Fourth Quarter 2008)
B.2 GHG and CAC Emission Factors GHG amounts are expressed in CO2 equivalent tonnes (CO2e). The emission factors used in the analysis are summarized in Exhibit B‐2. The emission factors were obtained from Environment Canada’s National Inventory Report 1990 – 2006: Greenhouse Gas Sources and Sinks in Canada – Annex 12: Emission Factors (May 2008).
Exhibit B‐2: GHG emission factors
GHG Emission Factor Electricity (kWh)
Natural Gas (m3) RPP (m3)
Other (tonne)
Emissions Coefficient (tonnes CO2e/unit) 0.00018 0.00189 2.70025 2.51136 Emissions Coefficient (tonnes CO2e/GJ fuel) 0.05000 0.00050 0.07071 0.006576
The CAC emission factors used in the study are summarized in Exhibit B‐3.

Advancing Opportunities in Energy Management in Ontario Industrial and Management Sector March 17, 2010
CME / Stantec / Marbek / ODYNA B‐3
Exhibit B‐3: CAC emission factors17
Emission Factor (g/GJ)
End Use CAC Natural Gas RPP Coal Coke
Coke Oven Gas Biomass
CO 35.58 14.37 10.13 7.14 34.58 257.97
NOx 67.03 109.15 173.70 122.43 88.53 94.59
SOx 0.26 19.33 267.54 159.01 4.90 92.78
Process Heating and Process Specific
PM 3.22 36.35 151.25 106.60 3.13 35.17
CO 16.94 15.51
NOx 32.12 45.06
SOx 0.26 13.09
HVAC
PM 3.22 1.24
17 Natural Resources Canada – Office of Energy Efficiency (March 2008). Update of Criteria Air Contaminant Emissions in GHGenius.

Advancing Opportunities in Energy Management in Ontario Industrial and Management Sector March 17, 2010
CME / Stantec / Marbek / ODYNA C‐1
Appendix C Sub‐sector Generic Plant Profiles

Advancing Opportunities in Energy Management in Ontario Industrial and Management Sector March 17, 2010
CME / Stantec / Marbek / ODYNA C‐2
Exhibit C‐1: Base Year Electricity Use Sub‐Sector Profile
Base Year Electricity Use (%)
End use Primary Metal Chemical Paper
Non‐Metallic Mineral
Petroleum and Coal
Transportation Equipment & Machinery
Food, Beverage & Tobacco Mining
Fabricated Metal
Plastics and Rubber Other
Steam boilers and steam systems
‐ ‐ ‐ ‐ ‐ ‐ ‐ ‐ ‐ ‐ ‐
Hot water heaters and boilers
2.0% 3.0% 2.0% 2.0% 2.0% 3.0% 1.0% 1.0% 3.0% 1.0% 3.0%
Steam systems (imported steam)
‐ ‐ ‐ ‐ ‐ ‐ ‐ ‐ ‐ ‐ ‐
Furnaces/ kilns/ ovens/ dryers
34.0% 2.1% 2.2% 28.0% 4.6% 6.3% 2.0% ‐ 18.5% 8.0% 8.0%
Cooling & Refrigeration 1.6% 2.4% 1.2% 1.0% 7.8% 0.8% 28.0% ‐ 2.0% 3.0% 1.0%
Pumps 11.0% 16.0% 31.0% 14.0% 21.3% 15.0% 17.0% 9.4% 14.0% 13.0% 18.0%
Fans/Blowers 7.0% 12.5% 13.0% 11.0% 9.7% 12.0% 7.0% ‐ 10.0% 12.0% 11.0%
Other Motors 12.0% 17.0% 24.0% 7.3% 26.0% 21.0% 18.0% 28.0% 25.0% 21.0% 20.0%
Compressed air Systems 10.0% 15.0% 19.0% 9.0% 22.5% 17.0% 14.0% 2.5% 11.0% 15.0% 18.0%
Electrochemical 3.0% 15.0% 1.0% ‐ ‐ 1.0% ‐ 1.0% 1.0% ‐ 5.0%
Process Specific 6.0% 1.0% 0.1% 26.0% 0.5% 2.5% 0.6% 17.6% 6.6% 13.0% 7.0%
HVAC 8.0% 14.0% 3.0% 0.7% ‐ 18.4% 8.0% 22.0% 5.5% 11.0% 5.0%
Lighting 4.4% 1.0% 1.5% ‐ 4.6% 2.0% 3.1% 2.5% 2.0% 2.0% 3.0%
Other 1.0% 1.0% 2.0% 1.0% 1.0% 1.0% 1.3% 16.0% 1.4% 1.0% 1.0%

Advancing Opportunities in Energy Management in Ontario Industrial and Management Sector March 17, 2010
CME / Stantec / Marbek / ODYNA C‐3
Exhibit C‐2: Base Year Natural Gas Use Sub‐Sector Profile
Base Year Natural Gas Use (%)
End use Primary Metal Chemical Paper
Non‐Metallic Mineral
Petroleum and Coal
Transportation Equipment & Machinery
Food, Beverage & Tobacco Mining
Fabricated Metal
Plastics and Rubber Other
Steam boilers and steam systems
4.0% 51.0% 59.0% 14.0% 39.4% 17.0% 68.0% 1.0% 8.0% 38.0% 33.0%
Hot water heaters and boilers
1.0% 5.0% 6.0% 2.0% 4.0% 3.0% 3.0% 0.0% 1.0% 4.0% 5.0%
Steam systems (imported steam)
‐ ‐ ‐ ‐ ‐ ‐ ‐ ‐ ‐ ‐ ‐
Furnaces/ kilns/ ovens/ dryers
79.0% 26.3% 19.0% 75.0% 54.0% 29.0% 23.0% 22.0% 78.0% 20.0% 40.0%
Cooling & Refrigeration ‐ ‐ ‐ ‐ ‐ ‐ ‐ ‐ ‐ ‐ ‐
Pumps ‐ ‐ ‐ ‐ ‐ ‐ ‐ ‐ ‐ ‐ ‐
Fans/Blowers ‐ ‐ ‐ ‐ ‐ ‐ ‐ ‐ ‐ ‐ ‐
Other Motors ‐ ‐ ‐ ‐ ‐ ‐ ‐ ‐ ‐ ‐ ‐
Compressed air Systems ‐ ‐ ‐ ‐ ‐ ‐ ‐ ‐ ‐ ‐ ‐
Electrochemical ‐ ‐ ‐ ‐ ‐ ‐ ‐ ‐ ‐ ‐ ‐
Process Specific 11.0% ‐ 1.9% 0.0% 0.3% 7.0% 0.0% 0.0% 0.0% 0.0% 0.0%
HVAC 4.0% 16.7% 13.1% 7.0% 1.3% 38.0% 4.0% 65.0% 11.0% 34.0% 21.0%
Lighting ‐ ‐ ‐ ‐ ‐ ‐ ‐ ‐ ‐ ‐ ‐
Other 1.0% 1.0% 1.0% 2.0% 1.0% 6.0% 2.0% 12.0% 2.0% 4.0% 1.0%

Advancing Opportunities in Energy Management in Ontario Industrial and Management Sector March 17, 2010
CME / Stantec / Marbek / ODYNA C‐4
Exhibit C‐3: Base Year RPP Use Sub‐Sector Profile
Base Year RPP Use (%)
End use Primary Metal Chemical Paper
Non‐Metallic Mineral
Petroleum and Coal
Transportation Equipment & Machinery
Food, Beverage & Tobacco Mining
Fabricated Metal
Plastics and Rubber Other
Steam boilers and steam systems
1.0% 60.0% 55.0% 4.0% 16.6% 40.0% 86.0% 0.0% 1.0% 40.0% 60.0%
Hot water heaters and boilers
‐ ‐ ‐ ‐ ‐ ‐ ‐ ‐ ‐ ‐ ‐
Steam systems (imported steam)
‐ ‐ ‐ ‐ ‐ ‐ ‐ ‐ ‐ ‐ ‐
Furnaces/ kilns/ ovens/ dryers
84.0% 20.0% 5.0% 71.0% 71.0% 5.0% 5.0% ‐ 74.0% 5.0% 20.0%
Cooling & Refrigeration ‐ ‐ ‐ ‐ ‐ ‐ ‐ ‐ ‐ ‐ ‐
Pumps ‐ ‐ ‐ ‐ ‐ ‐ ‐ ‐ ‐ ‐ ‐
Fans/Blowers ‐ ‐ ‐ ‐ ‐ ‐ ‐ ‐ ‐ ‐ ‐
Other Motors ‐ ‐ ‐ ‐ ‐ ‐ ‐ ‐ ‐ ‐ ‐
Compressed air Systems ‐ ‐ ‐ ‐ ‐ ‐ ‐ ‐ ‐ ‐ ‐
Electrochemical ‐ ‐ ‐ ‐ ‐ ‐ ‐ ‐ ‐ ‐ ‐
Process Specific ‐ ‐ ‐ ‐ 0.4% ‐ ‐ 46.7% ‐ ‐ ‐
HVAC ‐ ‐ ‐ ‐ ‐ ‐ ‐ ‐ ‐ ‐ ‐
Lighting ‐ ‐ ‐ ‐ ‐ ‐ ‐ ‐ ‐ ‐ ‐
Other 15.0% 20.0% 40.0% 25.0% 12.0% 55.0% 9.0% 53.3% 25.0% 55.0% 20.0%

Advancing Opportunities in Energy Management in Ontario Industrial and Management Sector March 17, 2010
CME / Stantec / Marbek / ODYNA C‐5
Exhibit C‐4: Base Year Other Fuel Use Sub‐Sector Profile
Base Year Other Fuel Use (%)
End use Primary Metal Chemical Paper
Non‐Metallic Mineral
Petroleum and Coal
Transportation Equipment & Machinery
Food, Beverage & Tobacco Mining
Fabricated Metal
Plastics and Rubber Other
Steam boilers and steam systems
5.0% ‐ 3.0% ‐ ‐ ‐ ‐ 1.0% ‐ ‐ 8.0%
Hot water heaters and boilers
‐ ‐ ‐ ‐ ‐ ‐ ‐ ‐ ‐ ‐ ‐
Steam systems (imported steam)
‐ 29.0% 97.0% ‐ ‐ ‐ ‐ ‐ ‐ ‐ ‐
Furnaces/ kilns/ ovens/ dryers
90.0% 66.0% ‐ 100.0% ‐ ‐ ‐ 5.0% ‐ ‐ 40.0%
Cooling & Refrigeration ‐ ‐ ‐ ‐ ‐ ‐ ‐ ‐ ‐ ‐ ‐
Pumps ‐ ‐ ‐ ‐ ‐ ‐ ‐ ‐ ‐ ‐ ‐
Fans/Blowers ‐ ‐ ‐ ‐ ‐ ‐ ‐ ‐ ‐ ‐ ‐
Other Motors ‐ ‐ ‐ ‐ ‐ ‐ ‐ ‐ ‐ ‐ ‐
Compressed air Systems ‐ ‐ ‐ ‐ ‐ ‐ ‐ ‐ ‐ ‐ ‐
Electrochemical ‐ ‐ ‐ ‐ ‐ ‐ ‐ ‐ ‐ ‐ ‐
Process Specific 5.0% 5.0% ‐ ‐ ‐ ‐ ‐ ‐ ‐ ‐ ‐
HVAC ‐ ‐ ‐ ‐ ‐ ‐ ‐ ‐ ‐ ‐ ‐
Lighting ‐ ‐ ‐ ‐ ‐ ‐ ‐ ‐ ‐ ‐ ‐
Other ‐ ‐ ‐ ‐ 100.0% 100.0% 100.0% 94.0% 100.0% 100.0% 52.0%

Advancing Opportunities in Energy Management in Ontario Industrial and Management Sector March 17, 2010
CME / Stantec / Marbek / ODYNA D‐1
Appendix D 2007 Base Year Energy Use Detailed Data

Advancing Opportunities in Energy Management in Ontario Industrial and Management Sector March 17, 2010
CME / Stantec / Marbek / ODYNA D‐2
Exhibit D‐1: Base Year Natural Gas Use by Sub‐Sector and End Use
Exhibit D‐2: Base Year Electricity Use by Sub‐Sector and End Use
Base Year End Use Electricity Use (PJ)
Sub‐sector Process Heat
Cooling & Refrigeration
Machine Drives
Electro‐chemical
Process Specific HVAC Lighting Other
Chemical 0.7 0.3 7.8 1.9 0.1 1.8 0.1 0.1
Paper 1.0 0.3 20.3 0.2 0.0 0.7 0.4 0.5
Non‐Metallic Mineral 1.8 0.1 2.5 ‐ 1.6 0.0 ‐ 0.1
Petroleum and Coal 0.5 0.6 6.3 ‐ 0.0 ‐ 0.4 0.1
Transportation Equipment and Machinery
1.7 0.1 11.9 0.2 0.5 3.4 0.4 0.2
Food, Beverage and Tobacco 0.3 2.8 5.6 ‐ 0.1 0.8 0.3 0.1
Mining 0.1 ‐ 5.0 0.1 2.2 2.7 0.3 2.0
Fabricated Metal 2.0 0.2 5.6 0.1 0.6 0.5 0.2 0.1
Plastics and Rubber 0.9 0.3 5.9 ‐ 1.2 1.1 0.2 0.1
Other 2.9 0.3 17.5 1.3 1.8 1.3 0.8 0.3
Total 19.9 5.3 97.3 4.5 9.5 14.1 4.0 3.7
Base Year End Use Natural Gas Use (PJ) Sub‐sector Process
Heat Cooling &
Refrigeration Machine Drives
Electro‐chemical
Process Specific HVAC Lighting Other
Chemical 37.7 ‐ ‐ ‐ ‐ 7.6 ‐ 0.5
Paper 27.0 ‐ ‐ ‐ 0.6 4.2 ‐ 0.3
Non‐Metallic Mineral 21.0 ‐ ‐ ‐ ‐ 1.6 ‐ 0.5
Petroleum and Coal 24.2 ‐ ‐ ‐ 0.1 0.3 ‐ 0.2
Transportation Equipment and Machinery
11.6 ‐ ‐ ‐ 1.7 9.0 ‐ 1.4
Food, Beverage and Tobacco 22.4 ‐ ‐ ‐ ‐ 1.0 ‐ 0.5
Mining 2.7 ‐ ‐ ‐ ‐ 7.8 ‐ 1.4
Fabricated Metal 6.0 ‐ ‐ ‐ ‐ 0.8 ‐ 0.1
Plastics and Rubber 2.0 ‐ ‐ ‐ ‐ 1.1 ‐ 0.1
Other 38.5 ‐ ‐ ‐ ‐ 10.4 ‐ 0.5
Total 224.2 ‐ ‐ ‐ 6.4 45.2 ‐ 5.9

Advancing Opportunities in Energy Management in Ontario Industrial and Management Sector March 17, 2010
CME / Stantec / Marbek / ODYNA D‐3
Exhibit D‐3: Base Year RPP Use by Sub‐Sector and End Use
Base Year End Use RPP Use (PJ)
Sub‐sector Process Heat
Cooling & Refrigeration
Machine Drives
Electro‐chemical
Process Specific HVAC Lighting Other
Chemical 6.7 ‐ ‐ ‐ ‐ ‐ ‐ 1.7
Paper 2.0 ‐ ‐ ‐ ‐ ‐ ‐ 1.3
Non‐Metallic Mineral 1.8 ‐ ‐ ‐ ‐ ‐ ‐ 0.6
Petroleum and Coal 18.7 ‐ ‐ ‐ 0.1 ‐ ‐ 2.6
Transportation Equipment and Machinery
1.3 ‐ ‐ ‐ ‐ ‐ ‐ 1.6
Food, Beverage and Tobacco 2.6 ‐ ‐ ‐ ‐ ‐ ‐ 0.3
Mining ‐ ‐ ‐ ‐ 2.0 ‐ ‐ 2.3
Fabricated Metal 0.4 ‐ ‐ ‐ ‐ ‐ ‐ 0.1
Plastics and Rubber 1.0 ‐ ‐ ‐ ‐ ‐ ‐ 1.2
Other 3.9 ‐ ‐ ‐ ‐ ‐ ‐ 1.0
Total 46.3 ‐ ‐ ‐ 2.1 ‐ ‐ 14.1
Exhibit D‐2: Base Year Other Fuel Use by Sub‐Sector and End Use
Base Year End Use Other Fuel Use (PJ)
Sub‐sector Process Heat
Cooling & Refrigeration
Machine Drives
Electrochemical
Process Specific HVAC Lighting Other
Primary Metal 79.4 ‐ ‐ ‐ 4.2 ‐ ‐ ‐
Chemical 14.0 ‐ ‐ ‐ 0.7 ‐ ‐ ‐
Paper 3.3 ‐ ‐ ‐ ‐ ‐ ‐ ‐
Non‐Metallic Mineral 23.9 ‐ ‐ ‐ ‐ ‐ ‐ ‐
Petroleum and Coal ‐ ‐ ‐ ‐ ‐ ‐ ‐ ‐
Transportation Equipment and Machinery
‐ ‐ ‐ ‐ ‐ ‐ ‐ ‐
Food, Beverage and Tobacco ‐ ‐ ‐ ‐ ‐ ‐ ‐ ‐
Mining 0.3 ‐ ‐ ‐ ‐ ‐ ‐ 4.4
Fabricated Metal ‐ ‐ ‐ ‐ ‐ ‐ ‐ ‐
Plastics and Rubber ‐ ‐ ‐ ‐ ‐ ‐ ‐ ‐
Other 3.3 ‐ ‐ ‐ ‐ ‐ ‐ 3.6
Total 124.3 ‐ ‐ ‐ 4.9 ‐ ‐ 8.0

Advancing Opportunities in Energy Management in Ontario Industrial and Management Sector March 17, 2010
CME / Stantec / Marbek / ODYNA E‐1
Appendix E Reference Case Energy Use Detailed Data

Advancing Opportunities in Energy Management in Ontario Industrial and Management Sector March 17, 2010
CME / Stantec / Marbek / ODYNA E‐2
Exhibit E‐1: Reference Case Natural Gas Use by Sub‐Sector
Reference Case Natural Gas Use (PJ) Sub‐Sector 2007 2010 2015 2020 2025 2030
Primary Metal 36.9 33.5 44.1 44.2 48.8 53.6
Chemical 45.8 42.1 50.0 49.6 54.2 59.0
Paper 32.1 25.0 28.0 27.8 30.4 33.1
Non‐Metallic Mineral 23.1 21.0 25.0 26.4 30.6 35.3
Petroleum and Coal 24.9 24.4 25.9 25.8 28.7 31.9
Transportation Equipment and Machinery 23.6 18.5 20.0 19.0 20.0 21.1 Food, Beverage and Tobacco 23.9 18.6 20.2 19.2 20.2 21.3
Mining 11.9 10.9 12.1 11.5 12.2 12.8
Fabricated Metal 6.9 6.2 6.3 5.9 6.2 6.5
Plastics and Rubber 3.2 3.0 3.5 3.5 3.8 4.1
Other 49.4 38.6 41.8 39.8 41.8 44.0
Totals 282 242 277 273 297 323
Exhibit E‐2: Reference Case Electricity Use by Sub‐Sector
Reference Case Electricity Use (PJ) Sub‐Sector 2007 2010 2015 2020 2025 2030
Primary Metal 22.4 22.9 28.1 29.6 31.1 32.7
Chemical 12.9 13.3 14.7 15.3 15.9 16.6
Paper 23.3 20.8 21.5 22.4 23.3 24.3
Non‐Metallic Mineral 6.1 6.2 6.9 7.6 8.4 9.4
Petroleum and Coal 8.0 8.7 8.5 8.9 9.4 10.0 Transportation Equipment and Machinery 18.4 16.4 16.4 16.4 16.4 16.5 Food, Beverage and Tobacco 10.0 8.9 8.9 8.9 8.9 9.0
Mining 12.4 12.7 13.0 13.1 13.1 13.2
Fabricated Metal 9.3 9.4 8.8 8.6 8.6 8.6
Plastics and Rubber 9.6 9.9 10.9 11.4 11.8 12.3
Other 26.1 23.3 23.3 23.3 23.3 23.4
Totals 158 152 161 165 170 176

Advancing Opportunities in Energy Management in Ontario Industrial and Management Sector March 17, 2010
CME / Stantec / Marbek / ODYNA E‐3
Exhibit E‐3: Reference Case RPP Use by Sub‐Sector
Reference Case RPP Use (PJ) Sub‐Sector 2007 2010 2015 2020 2025 2030
Primary Metal 9.3 9.4 12.1 12.7 14.6 16.2
Chemical 8.4 8.5 9.9 10.3 11.7 12.9
Paper 3.3 2.9 3.2 3.3 3.8 4.1
Non‐Metallic Mineral 2.4 2.4 2.8 3.2 3.8 4.4
Petroleum and Coal 21.3 23.0 23.8 24.9 28.8 32.4 Transportation Equipment and Machinery 2.9 2.5 2.7 2.7 2.9 3.1 Food, Beverage and Tobacco 2.9 2.5 2.7 2.7 2.9 3.1
Mining 4.3 4.4 4.7 4.8 5.2 5.6
Fabricated Metal 0.6 0.6 0.6 0.6 0.6 0.7
Plastics and Rubber 2.3 2.3 2.7 2.8 3.2 3.5
Other 4.8 4.3 4.5 4.5 4.9 5.3
Totals 62 63 70 72 82 91
Exhibit E‐4: Reference Case Other Fuel Use by Sub‐Sector
Reference Case Other Fuel Use (PJ) Sub‐Sector 2007 2010 2015 2020 2025 2030
Primary Metal 83.6 82.1 102.2 91.0 94.6 97.5
Chemical 14.8 14.7 16.4 14.4 14.8 15.1
Paper 3.3 2.8 2.9 2.6 2.7 2.7
Non‐Metallic Mineral 23.9 23.5 26.4 24.9 27.2 29.6
Petroleum and Coal ‐ ‐ ‐ ‐ ‐ ‐ Transportation Equipment and Machinery ‐ ‐ ‐ ‐ ‐ ‐ Food, Beverage and Tobacco ‐ ‐ ‐ ‐ ‐ ‐
Mining 4.7 4.6 4.8 4.0 4.0 3.9
Fabricated Metal ‐ ‐ ‐ ‐ ‐ ‐
Plastics and Rubber ‐ ‐ ‐ ‐ ‐ ‐
Other 6.9 5.9 6.0 5.0 5.0 4.9
Totals 137 134 159 142 148 154

Advancing Opportunities in Energy Management in Ontario Industrial and Management Sector March 17, 2010
CME / Stantec / Marbek / ODYNA F‐1
Appendix F Best Practices

Advancing Opportunities in Energy Management in Ontario Industrial and Management Sector March 17, 2010
CME / Stantec / Marbek / ODYNA F‐2
Exhibit F‐1: Management Best Practices
The company has a documented corporate energy management policy: Which defines long‐term strategic energy management commitments and goals Which specifies responsibilities and sets targets for controlling energy use and cost?
Corporate Energy Management Policy and Planning The company has a documented energy management planning process which annually:
sets targets for controlling energy use and cost; defines actions to reduce energy costs and achieve the energy performance targets; integrates the energy use and cost reduction targets and actions with annual corporate
production and cost objectives; defines a policy and guidelines on energy performance measurement and verification.
The company treats energy management as a key financial variable of every capital project and its contribution is clearly determined.
The company has formalized procedures which enable capital and operating financial allocations for energy management projects to: have the same level of authority and importance as other corporate capital and
operating financial allocations be assessed using similar methods and processes as other plant capital and operating
financial allocations
The company requires the business case development of all energy management projects to include an assessment of energy cost avoidance, maintenance cost reduction, productivity improvements and reduced environmental compliance costs
Corporate Financing of Energy Management
The company requires energy management investments to be assessed using a life‐cycle cost analysis methodology that converts estimated savings and cost data into a cash‐flow and integrates that cash‐flow with other decision‐making metrics.
The company has assigned accountability to a designated senior manager to implement the corporate energy management policy and meet the energy use performance targets.
The company additionally spreads the accountability to implement the corporate energy management policy and meet the company’s energy use performance targets among several senior managers.
The company regularly conducts corporate and facility energy use benchmarking using key performance indicators.
The company’s energy management policy and/or internal technical standards specify energy management measurement and verification requirements.
Internal auditing is conducted of the corporate energy management policy, planning and activities as a formalized part of existing audit systems and protocols.
Corporate Organization and Accountability
External auditing is deployed to check the company’s energy management system, data base accuracy and to verify measurement system accuracy.
The corporate energy management policy or strategy is communicated externally, for example it is posted on the company web‐site.
The corporate energy management policy or strategy is communicated internally to plants, for example it is posted on communication boards in the plant(s).
Corporate Communications
Energy use key performance indicators are communicated externally, for example it is posted on the company web site.

Advancing Opportunities in Energy Management in Ontario Industrial and Management Sector March 17, 2010
CME / Stantec / Marbek / ODYNA F‐3
Energy use key performance indicators are communicated internally, for example it is posted on communication boards in plant(s).
Energy costs and cost management are communicated in the company’s annual report along with a management discussion of energy impacts on the business.
Energy costs and cost management are communicated to the plant(s) on a quarterly basis (or more frequent).
The facility develops an annual operational business plan which includes energy performance targets, key energy use performance indicators, specification of management and other staff responsibilities/accountabilities and a plan to implement specific projects/actions.
Departments in the facility participate in the planning process and adhere to the plan.
The facility has a formalized production planning process that links annual production and cost objectives to weekly and daily production schedules. This production planning links the energy use performance targets and performance improvement actions to the production planning.
Energy use performance improvements are defined and scheduled as actions in the annual business plan and prioritized in the facility project planning process.
FACILITY LEVEL ENERGY MANAGEMENT ‐ Planning
A full technical energy assessment that includes energy management performance benchmarking is conducted by energy professionals at least every 5 years.
The facility has a formal organizational, reporting and responsibility structure (with an Organizational Chart) identifying energy management accountabilities at all management, supervisory and operator levels.
The facility has a designated senior energy manager assigned responsibility to implement the energy management component of the annual facility business plan.
The designated senior energy manager has energy performance goals defined in their annual Personal Performance Appraisals.
The facility also has a senior facility management team (e.g., senior production process and technical managers) assigned the responsibility and accountability for energy costs and energy use performance metrics.
The senior facility management team has energy performance goals defined in their Personal Performance Appraisals.
The facility has an energy committee led by the senior energy manager and other personnel (e.g., technical & operations personnel).
Facility employees are aware of energy performance targets and commitment to energy use performance improving actions as stated in the facility annual operational business plan.
FACILITY LEVEL ENERGY MANAGEMENT ‐ Organization and Accountability
The facility has systems and resources in place to adequately meet the energy performance reporting requirements in the business plan.

Advancing Opportunities in Energy Management in Ontario Industrial and Management Sector March 17, 2010
CME / Stantec / Marbek / ODYNA F‐4
The facility maintains an active energy procurement plan that reviews energy bills, reviews energy consumption data and assesses tariff structure. The facility operates an Energy Management Information System that comprises: Sensors and instruments to collect energy use data, including energy meters (electricity,
gas, oil, steam) and other utility meters directly associated with energy use (heat flow, cooling flow, compressed air flow), temperature, pressure and flow;
Data acquisition systems (e.g., the energy meters are usually connected to a monitoring and control system such as a Programmable Logic Controller, Supervisory Control and Data Acquisition or Distributed Control System);
An energy use Database in which data collection is usually automated and uses data historian that is designed for time‐series data storage;
Software tools which typically integrate directly with the control/monitoring system and data historian to analyze energy use against key energy use performance indicators.
Energy consumption is measured on a basis that can be: easily related to an operational unit; measured per physical unit of product; identified for each operational area; both real‐time and periodic; can be correlated to production; can be correlated to weather.
The difference between actual and targeted energy consumption is tracked at the facility and production process levels and causes of increased or decreased consumption are assessed.
FACILITY LEVEL ENERGY MANAGEMENT ‐ Monitoring
All energy metrics (e.g., real time energy data, synchronized real time production data and reports) can be accessed from a desk top computer by approved personnel.
The facility uses a consistent communications and reporting protocol to channel key performance indicator results and relevant energy use information to business units and staff.
The facility regularly reports on energy use performance relative to targets and budgets (e.g., annual, quarterly and monthly) to those with accountability at the corporate and facility levels (e.g., operations and technical managers).
Key energy use performance indicator results (e.g., real time energy costs) are communicated to all employees on a regular basis.
The facility uses a variety of tools as part of an ongoing energy awareness campaign to display performance, ideas etc.
Energy saving and other energy management ideas are solicited from employees during safety or general employee meetings.
Energy management project costs and progress are reported to facility technical and operations management.
FACILITY LEVEL ENERGY MANAGEMENT ‐ Reporting and Communication
Energy management project costs and progress are reported to corporate management.

Advancing Opportunities in Energy Management in Ontario Industrial and Management Sector March 17, 2010
CME / Stantec / Marbek / ODYNA F‐5
Identification of Opportunities The plant typically considers the scope of energy management project opportunities to include: Energy efficiency and conservation. Peak load and demand management. Utility bill management. Fuel substitution and/or use of renewable energy sources. On‐site power generation. Improved energy management information systems.
The facility uses the following means to identify energy management project opportunities: A Suggestion Plan administered by the energy manager or other senior staff. Energy audits and studies. Internal & external benchmarking and detailed analysis of production process &
infrastructure consumption patterns. Routine maintenance activities. The facility’s continuous improvement management system. Existing metering, additional sub‐metering if required, and energy management
information system.
Energy management best practices are identified by regularly monitoring trade journals and internal databases and by networking with other facilities. Best practices are shared throughout the facility and developed into projects.
Project Implementation The facility has implemented a procedure to manage the implementation of energy
management projects. The facility has designated a project manager to oversee the implementation of energy
management projects.
FACILITY LEVEL ENERGY MANAGEMENT ‐ Project Management
Project Measurement and Verification Project measurement and verification plans are normally carried out as part of the
project design for all energy performance improvement projects requiring capital allocations.
The costs of conducting a project measurement and verification plan and implementation are normally included in the cost analysis of the project.
The measurement and verification plan requires establishment of energy performance baselines and a formal reporting process of actual vs. baseline performance.
The budget for staff training to support energy management is included in the annual facility budget.
The approved staff training plan for energy management is incorporated into the annual employee training schedule.
The staff training plan for energy management includes both management and technical training competencies.
Energy use and energy management is included in orientation training for new personnel.
Senior facility staff, accountable for energy use and cost performance targets, are trained to: Conduct energy management planning as a key part of the business planning processes. Prepare and submit a financial business case evaluation of energy performance
improvement projects, in terms relevant to the financial criteria of the corporate project approval process.
Scope, budget and manage pre‐feasibility and investment grade studies. Designated facility personnel are trained to oversee and manage the identification and implementation of energy management projects.
FACILITY LEVEL ENERGY MANAGEMENT ‐ Training and Capacity Development
Designated facility personnel are trained to manage energy data and information.

Advancing Opportunities in Energy Management in Ontario Industrial and Management Sector March 17, 2010
CME / Stantec / Marbek / ODYNA F‐6
Exhibit F‐2: Technical Best Practices System Sub‐Metering Sub‐metering systems measure the amount of energy used by a plant and in particular certain portions of the plant where major utility loads are known. The use of sub‐metering can be beneficial as part of a control system or an energy management plan. Well‐placed sub‐meters provide utility usage information for specific processes or plant areas, which can help in the identification of potential areas of improvement within. Data obtained from meters are only beneficial for demand‐side management if it is interpreted and used in a DSM system or energy management framework, including monitoring and targeting strategies. Also, the closer the meter is to the end user, the more likely it is he/she will be held accountable, which can lead to further savings. Energy Management Energy management addresses the people aspect in reducing energy use; it can include both policies and plans to manage energy. Simply applying technical measures is not enough to fully take advantage of energy savings opportunities, an energy management plan helps to structure future activities and set energy targets. Integrated Control System Traditionally, control systems have been implemented as separate entities, each with its own infrastructure, installer and service. This can result in control systems that, as a whole, are not utilized to their maximum potential. Applications of advanced, automated control and energy management systems in varying development stages can be found in all Industrial sectors. However, there is still a large potential to implement control and management systems, as more modern systems enter the market continuously. Process control systems depend on information at many stages of the processes. The information of the sensors is used in control systems to adapt the process conditions, based on mathematical (rule‐based) or neural networks and “fuzzy logic” models of the industrial process. Neural network‐based control systems have successfully been used in the cement (kilns), food (baking), non‐ferrous metals (alumina, zinc), pulp and paper (paper stock, lime kiln), petroleum refineries (process, site) and steel industries (EAFs, rolling mills). New energy management systems that use artificial intelligence, fuzzy logic (neural network), or rule‐based systems mimic the “best” controller, using monitoring data and learning from previous experiences. Boiler, Hot Water, and Steam Systems Condensing Boiler
High‐efficiency condensing boilers feature advanced heat exchanger designs and materials that extract more heat from the flue gases before they are exhausted. The temperature of the flue gases is reduced to the point where the water vapour produced during combustion condenses back into liquid form, releasing the latent heat, which improves energy efficiency.

Advancing Opportunities in Energy Management in Ontario Industrial and Management Sector March 17, 2010
CME / Stantec / Marbek / ODYNA F‐7
Modern condensing boilers have energy efficiencies of 90 percent to 96 percent, compared with new conventional non‐condensing models with energy efficiencies up to 85 percent. Many boilers over 20 years old typically operate at overall water‐to‐steam boiler efficiencies of less than 70 percent, making them good candidates for upgrading or replacement. A number of natural gas‐fired condensing boilers are available, but very few oil‐burning models are on the market. Installing new boilers generally occurs only at the end of the life of existing boilers or when expansion occurs. Instantaneous Steam Generation When a boiler is too big, boiler short‐cycling losses may occur, as an oversized boiler will turn on and off more often than a boiler that has been properly matched to the demand. Every time the boiler turns on, extra energy is required to heat it back up to steady state. Conversely, a boiler left on standby will avoid the extra energy used to heat back up to steady state, but will waste energy while it is in standby. Instantaneous steam generators do not need to be left on standby and do not require a large amount of energy to reach steady state performance. The relatively small water content of a coil‐type steam generator, for example, enables it to go from cold start‐up to full steam output in approximately 5 minutes. Instantaneous steam generation systems can also be beneficial when full modulation, high‐output turndown ratios or rapid start‐ups are required. A large market potential exist for instantaneous steam generators. High‐efficiency Burners Due to differing temperature requirements and wide range of boiler models, a wide variety of burners are available and burner technology is continuously improving. Improvement in boiler burner efficiency is mainly associated with optimum combustion efficiency and improving the heat profile inside the combustion chamber. The efficiency of boiler burners is closely linked with the boiler controls regulating the fuel‐to‐air ratio. For example, inefficient fuel‐to‐air ratio control will reduce the efficiency of the burner. Economizer An economizer is a heat exchanger that is designed to use heat from hot boiler flue gases to preheat water. Economizers are often used on large utility steam boilers to preheat the feedwater using recovered stack heat. The same principle can be applied to smaller heating boilers where there is a nearby demand for hot water. These installations have become more economical as energy prices have risen and smaller, lighter, and more durable economizers have been developed. A condensing economizer improves the effectiveness of reclaiming flue gas heat by cooling the flue gas below the dewpoint. The condensing economizer thus recovers both the sensible heat from the flue gas and the latent heat from the moisture that condenses. The condensate is highly corrosive and requires measures to ensure that it does not enter the boiler. New boilers generally include economizers, while a large percentage of existing boilers has the potential to be retrofitted with an economizer. Boiler Right Sizing and Load Management An oversized boiler will turn on and off more often than a boiler that has been properly matched to the demand, which may result in boiler short‐cycling losses. If the boiler is instead left on standby, short‐cycling losses will be avoided but energy will be wasted in keeping the boiler on standby. Rather than sizing a boiler to meet the highest possible load, fuel savings can be achieved by adding a smaller boiler, sized to meet the plant’s average loads, or by re‐

Advancing Opportunities in Energy Management in Ontario Industrial and Management Sector March 17, 2010
CME / Stantec / Marbek / ODYNA F‐8
engineering the power plant to consist of multiple small boilers. Multiple small boilers offer reliability and flexibility to operators to follow load swings without over‐firing and short cycling. Load management also helps to reduce load variation. As this measure is normally an end‐of‐life option there should be no incremental costs to right size a boiler, but a benefit exists by purchasing a smaller boiler. The market penetration of the measure is relatively small and depends on the replacement rate of existing boilers and installation of new boilers. Blowdown Heat Recovery The boiler blowdown process involves the periodic or continuous removal of water from a boiler to remove accumulated dissolved solids and/or sludge. During the process, water is discharged from the boiler to avoid the negative impacts of dissolved solids or impurities on boiler efficiency and maintenance. However, boiler blowdown wastes energy because the blowndown liquid is at about the same temperature as the steam produced. Much of this heat can be recovered by routing the blowndown liquid through a heat exchanger that preheats the boiler’s make‐up water. The recovered heat can be used to preheat boiler make‐up water before it enters the deaerator, and for low‐pressure steam to heat water inside the deaerator, which reduces the cost to run the deaerator and improves overall boiler efficiency. Blowdown heat recovery is more prevalent in larger boilers in large facilities, but it is believed that the market penetration of the measure is still relatively small, based on consultant experience. Boiler Combustion Air Preheat Combustion air preheaters are similar to economizers in that they transfer energy from the flue gases back into the system. In these devices, however, the energy is transferred to the incoming combustion air. The efficiency benefit is roughly 1 percent for every 40°F increase in the combustion air temperature. Changes in combustion air temperature directly affect the amount of combustion air supplied to the boiler and may increase or decrease the excess air. (See below under the advanced boiler control measure for a discussion on air‐fuel ration control.) Preheating boiler combustion air has a relatively low market penetration rate on existing boilers. Process Heat Recovery to Preheat Makeup Water Recovered process heat can be a good source of energy to preheat boiler make‐up water. Waste heat can be captured from a clean waste stream that normally goes into the atmosphere or down the drain and used to heat the make‐up water before it is sent to the boiler. Implementation of many potential opportunities is restricted due to factors such as the distance between the process and the boiler, the available heat in the in the process stream, the volume of the process stream and the consistency of the heat generation. Implementation of the measure is not widely practiced, especially in small‐ and medium‐sized facilities. Consequently, a significant potential remains. Condensate Return The primary purpose of an effective condensate recovery system is to make the most effective use of all remaining steam and condensate energy after process use. Condensate (water or condensed steam) reduces the quality of the steam but is too high in value to simply discard. Maximizing the amount of condensate that is returned to the boiler can save both energy and water treatment chemicals. The value of the condensate varies with its pressure and temperature, which depends on the operating pressure of the steam system. If boiler feedwater is 60°F, and the condensate is 212ºF, then each pound of condensate contains at

Advancing Opportunities in Energy Management in Ontario Industrial and Management Sector March 17, 2010
CME / Stantec / Marbek / ODYNA F‐9
least 162 BTUs; if the boiler is operating at 80 percent efficiency, then it represents 190 BTUs. Condensate under pressure and above 212ºF can be flashed to steam for additional energy value/recovery. The feasibility of returning condensate to the boiler depends on the distance the condensate needs to be piped to the boiler, and the volume of the condensate. Longer distances and smaller volumes negatively affect the feasibility of returning the condensate. Condensate return has achieved a relatively significant market penetration, but a substantial number of boiler steam systems still do not include condensate return systems. Advanced Boiler Controls An alternative to complex linkage designs, modern burners are increasingly using servomotors with parallel positioning to independently control the quantities of fuel and air delivered to the burner head. Controls without linkages allow for easy tune‐ups and minor adjustments, while eliminating hysteresis, or lack of retraceability, and provide accurate point‐to‐point control. These controls provide consistent performance and repeatability as the burner adjusts to different firing rates. Variable frequency drives (VFDs) can also be used to more accurately control the air supply.
Other technologies included in combustion controls are metered control, cross limited control and oxygen and carbon monoxide trim controls. Advanced boiler controls are generally one of the first energy‐efficiency measures a facility will implement to improve boiler energy efficiency. Although the measure has achieved a substantial market share, a large market still remains. Blowdown Control Boiler water must be blown down periodically to prevent scale from forming on boiler tubes. This process can be wasteful if too much is lost to blowdown. Automatic blowdown controls measure and respond to boiler water conductivity and acidity to ensure that only the right amount of blowdown water is used. Although automatic blowdown control is becoming a standard practice for new boilers, a large percentage of existing boilers do not have automated control. Insulation Insulation increases the amount of energy available for end uses by decreasing the amount of heat lost from the distribution system. Insulation removed during maintenance is often not replaced, and older insulation deteriorates with time. To improve the energy efficiency of the system, regular insulation surveys assist in identifying areas with insufficient insulation. A significant amount of facilities do not have regular insulation surveys. Boiler Maintenance An upgraded boiler maintenance program, including optimizing the air‐to‐fuel ratio, burner maintenance and tube cleaning, can save about 2 percent of a facility’s total energy use with an average simple payback of five months. Periodic measurement of flue gas oxygen, carbon monoxide, opacity and temperature provides the fundamental data required for a boiler tune‐up.

Advancing Opportunities in Energy Management in Ontario Industrial and Management Sector March 17, 2010
CME / Stantec / Marbek / ODYNA F‐10
A typical tune‐up might include a reduction of excess air (and thereby excess oxygen, O2), boiler tube cleaning and recalibration of boiler controls. A comprehensive tune‐up with precision testing equipment to detect and correct excess air losses, smoking, unburned fuel losses, sooting, and high stack temperatures, can result in boiler fuel savings as high as 20 percent, while typical savings are in the order of about 8 percent boiler fuel usage. Boiler maintenance programs are a relatively common practice, especially for large boilers and in large industries. Boiler Water Treatment Properly conditioning boiler water can increase the efficiency of the boiler as well as extend the boiler’s life. Some of the technologies that are employed to remove undesirable impurities from the water supply include reverse osmosis, electrodialysis and electrodialysis with current reversal. These are all known as membrane processes. Reverse osmosis uses semi‐permeable membranes that let water through but block the passage of salts. In electrodialysis, the salts dissolved in the water are forced to move through cat‐ion‐selective and anion‐selective membranes, removing the ion concentration. Proper boiler water treatment is a relatively common practice, especially for larger boilers. Minimize Deaerator Vent Losses A deaerator works to remove dissolved oxygen from boiler feedwater and must vent this oxygen, and any other non‐condensable gases that were removed, into the atmosphere. A very small percentage of steam will also be venting when the gases are vented. The amount of steam vented should be minimized through proper operation and controls. If the deaerator is operated at very high pressures, this may cause excessive venting of steam to the atmosphere. Instead, the deaerator tank should be operated to meet water chemistry requirements for oxygen and carbon dioxide rather than simply using pressure and temperature as a guide. This measure has been implemented on a relatively limited scale. Steam Trap Survey and Repair Steam traps are important to the performance of both end‐use equipment and the distribution system. Traps provide for condensate removal with little or no steam loss. If the traps do not function properly, excess steam will flow through the end‐use device or the condensate will back up into it. Excess steam loss will lead to costly operation while condensate backup will promote poor performance and may lead to water hammer. Traps can also remove non‐condensable gases that reduce heat exchanger effectiveness. Regular steam trap surveys are an important measure to identify faulty steam traps and steam leaks. Repairing the steam leaks and faulty steam traps will minimize steam losses and improve system efficiency. Steam trap surveys and repair is generally one of the first energy‐efficiency measures implemented by plants and the measure is implemented by a large segment of the Industrial sector.

Advancing Opportunities in Energy Management in Ontario Industrial and Management Sector March 17, 2010
CME / Stantec / Marbek / ODYNA F‐11
Direct Contact Hot Water Heaters In direct contact hot water heaters the combustion gas is in direct contact with the water and there is no heat transfer medium between the gas and the water. An example is where incoming water flows downward through a vertical column filled with stainless steel packing rings. As cold water comes into direct contact with rising hot combustion air from a gas burner, a very rapid heat transfer occurs, absorbing the heat energy into the water. Compared to heat exchanger type water heaters, direct contact heaters are more efficient because they eliminate the performance reductions caused by heat losses via the heat transfer medium and by fouling of the heat exchange surfaces and the associated energy losses. However, efficiency can be greatly reduced by high return fluid temperatures.18 Direct contact hot water heaters are most often installed when an existing water heater needs to be replaced due to its age and associated increased maintenance requirements. The market penetration of the technology is relatively small and a significant potential exists to increase the market penetration. Process Direct Heat (Furnaces / Kilns / Ovens / Dryers) High‐efficiency Ovens Infrared (IR) ovens use less energy than convection ovens because they heat the parts directly. Unlike convection ovens, they do not heat the air. IR ovens may also be used as a booster oven where final curing requires convection heating. Production rates may increase significantly when an IR oven replaces a convection oven. IR ovens can either replace existing convection ovens or be an addition to an existing one. Natural gas savings were reported where an IR oven was used as a booster oven. Production speed increases of up to 50 percent were also reported. A simple payback period of 2.5 years is reported for the installation of an IR oven as a booster oven.19 In cases where IR ovens replaced convection ovens, reported simple payback periods ranged between 10 months and 3.5 years.20 Airflow in convection ovens is important to ensure uniform distribution of heated air, which improves product quality and optimizes the volume of heated air required. In medium‐ to low‐temperature applications, some energy‐efficient units incorporate internal recycling of airflow to optimize airflow distribution. Air heat seals at the entrance and exit of units limit heat loss with airflow. Heat recovery from flue gas can be used to preheat oven burners, or heat other media like make‐up air or product. (See also the Flue Gas Heat Recovery measure.)
Specific to: Transportation and Machinery Research relevant to paint ovens includes developing paints or coatings that cure faster, or requires less energy to cure. Powder slurry coats are an example of a newer type of paint that requires less energy. The application of powder slurry coats does not require the base coat to 18 CADDET Energy Efficiency. Ultra‐high Efficiency Direct Contact Water Heater. www.caddet.org. 19 U.S. Department of Energy. Office of Energy Efficiency and Renewable Energy, Industrial Technology Program. Infrared oven saves energy, lifts production at a metal finishing plant. 2004. 20 Ernest, Orlando. Lawrence Berkley National Laboratory. Energy Efficiency Improvement and Cost Saving Opportunities for the Vehicle Assembly Industry. 2003. Report reference number: LBNL 50939.

Advancing Opportunities in Energy Management in Ontario Industrial and Management Sector March 17, 2010
CME / Stantec / Marbek / ODYNA F‐12
be heated to high temperatures, with the result that energy is saved in the drying process. A wet‐on‐wet painting process eliminates the baking process between the two coats of paint; Honda and Toyota have used this process at their facilities since 1998. Specific to: Food and Beverage Sub‐sector A wide range of oven sizes and designs are used in the Food and Beverage sub‐sector. Advances in oven energy efficiency are primarily related to improved control systems, improved combustion efficiency, reduced energy losses and reclaiming heat from exhaust gas. (See also the Exhaust Gas Heat Recovery and High‐efficiency Burners measures.) Actual energy use and efficiencies also vary widely depending on oven type and application.21 Reducing the speed of the recirculation fan and reducing the exhaust rate can minimize the energy loss when the oven is in standby mode, which maintains the temperature of the oven, for example, when the door is open. The reported average payback period for eight heat recovery projects at various international locations is four years.22 The inclusion of improved burners, control systems and insulation would further decrease the payback period. As an end‐of‐life measure, the implementation of high‐efficiency ovens is dependent on the turnover rate of existing ovens and the need for new ovens.
High‐efficiency Dryers
A large variety of dryers, ranging in size and design, are used in the Food, Chemical, Paper and Miscellaneous sectors. Besides the design of dryers, advances in energy efficiency include improving control systems, improving combustion efficiency, reducing energy losses and reclaiming heat from exhaust gas. Advanced drying technology usually aims to improve the heat transfer between the combustion gas and the product, for example the pulsed fluidized bed dryer, helix dryer and the pulse combustion flash dryer. The pulsed fluidized bed dryer uses a periodic hot air supply and has a wide range of applications. The helix dryer is a cylindrical chamber with a centrally located hollow column through which hot gas is supplied to the helical trays. The pulse combustion flash dryer uses intermittent combustion of fuel, which generates intensive pressure, velocity and temperature waves. The helix dryer must still be proven on a commercial scale, while the other two technologies are available for commercial applications. Energy use and efficiencies also vary widely depending on dryer type and application.23 Replacing a steam system with direct‐fired systems can save a significant amount of natural gas. One example is the implementation of a direct‐fired gas system to dry barley in a malting plant; pre‐drying stages or multiple drying stages can increase the production rate and reduce the natural gas consumption per production unit.
21 U.S. Gas Research Institute – Energy Utilization Centre: Research Collaboration Program. Food Processing Technology Project – Phase 1. 2003. 22 Ernest, Orlando. Lawrence Berkley National Laboratory and the American Council for an Energy Efficient Economy (ACEEE). Emerging Energy‐Efficient Industrial Technologies. 2000. Report reference number: LBNL 46990. 23 U.S. Gas Research Institute – Energy Utilization Centre: Research Collaboration Program. Food Processing Technology Project – Phase 1. 2003.

Advancing Opportunities in Energy Management in Ontario Industrial and Management Sector March 17, 2010
CME / Stantec / Marbek / ODYNA F‐13
High‐efficiency Kilns Roller kilns, using rapid firing technology, are more efficient than conventional tunnel kilns in the clay and ceramic industries. In the rapid firing process, the clay is prepared dry and the reduced water content results in reduced heating times. Roller kilns are successfully used in Europe and the U.S. Current kilns may have single or double layer designs and are well suited for ceramic products, but may be less suited for larger capacity brick kilns. Energy performance can be improved by heat recovery from the flue gases and retrofitting or installing improved insulation with low thermal mass materials (LTM). A simple payback period of 3.2 years is reported for the installation of a roller kiln in the place of a tunnel kiln, and relatively high fuel savings are reported when tunnel kilns are replaced with roller kilns and improved LTM insulation.24 Suppliers of roller kilns are developing multi‐layer kilns, which will increase production rates and reduce the rate of energy usage per production unit. Additional fuel savings will be associated with improved heat recovery, burner design and control systems. (See also the Gas Exhaust Heat Recovery, High‐efficiency Burners and Advanced Heating and Process Control measures.) High‐efficiency Furnaces The main advances in furnaces are related to combustion control, waste‐heat recovery and better design. Preheating combustion air using high‐velocity burners, pulse firing, recuperators or regenerative burners can improve the heat transfer of the combustion system. Specific improvements are usually applicable to specific furnaces. (See also the High‐efficiency Burners measure profile.) Advanced furnace design includes highly preheated combustion air system with/without oxygen enrichment.25 Porous wall radiation barrier (PWRB) heating mantles reportedly results in a heat‐transfer rate in the 1,800°F to 2,400°F range that is two to four times greater than conventional gas‐fired mantles.26 Improvement in insulation material will reduce heat losses from the furnace shell. Research to develop new composite materials for insulation is undertaken at the Lawrence Berkley National Laboratory and is expected to contribute to the overall efficiency of furnaces.27
Specific to: Primary Metal and Transportation and Machinery Sectors Recycled aluminum production uses 90 percent less energy than primary aluminum production. Several new technologies have emerged that help to improve the recovery or processing of scrap, or reduce energy use in the preparing and melting of scrap. Examples include a decoating kiln (the IDEXTM), which reported a relatively high reduction in kiln energy use, and a new melt
24 Ernest, Orlando. Lawrence Berkley National Laboratory and the American Council for an Energy Efficient Economy (ACEEE). Emerging Energy‐Efficient Industrial Technologies.2000. Report reference number: LBNL 46990. 25 U.S. Department of Energy. Office of Energy Efficiency and Renewable Energy. Industrial Technologies Program. Development of a highly preheated combustion air system with/without oxygen enrichment. 2004. 26 U.S. Department of Energy. Office of Energy Efficiency and Renewable Energy. Combustion Fact Sheet: Innovative energy‐efficient high‐temperature gas‐fired furnace. 2001. 27 U.S. Department of Energy. Office of Energy Efficiency and Renewable Energy. Industrial Material for the Future Project Fact Sheet: Advanced nanoporous composite materials for industrial heating applications. 2002.

Advancing Opportunities in Energy Management in Ontario Industrial and Management Sector March 17, 2010
CME / Stantec / Marbek / ODYNA F‐14
design that preheats and decoats the scrap in a dry hearth furnace and then melts the scrap in a closed well furnace. Specific to: Non‐Metallic Mineral Sector State‐of‐the‐art furnace technology in glass production uses a higher percentage of recycled glass, also called cullet. Glass manufactured in North America contains on average 20 percent cullet, while European container glass manufacturers sometimes use 80 percent cullet. Increasing cullet use by 10 percent reduces fuel use by approximately 2.5 percent. Increasing the cullet percentage in glass containers requires more effective and efficient waste glass collection. The reported simple payback period for furnaces with 100 percent cullet percentage and cullet preheating is two years. Energy efficiency can be further improved by batch cullet preheating and by recovering the flue gas heat. Cullet preheaters have been under development since 1980 and commercial applications can be found in Europe, while development projects are ongoing in the U.S. Induction Heating This heating technology utilizes an alternating magnetic field to induce electric eddy currents in the material being heated. The eddy currents dissipate energy, which results in the heating of the material. The alternating magnetic field is produced from a coil that surrounds the material and is charged with an AC current. Induction heating competes with other heating technologies such as fossil fuel and resistance heating. High‐efficiency Burner Due to differing temperature requirements and applications, a wide variety of burners are available. Burner technology is also continuously improving. Efficient burner technology generally recovers heat from the flue gas and includes recuperative and regenerative style burners. These burners are more efficient at higher‐temperature applications. Advancements over the past five years include the commercialization of self‐recuperative and self‐regenerative burners that use staged combustion to achieve flameless combustion. This results in more uniform heating, lower peak flame temperatures, improved efficiency and lower NOx emissions. There are numerous other types of high‐temperature burner technologies that improve on previous technologies. Examples include rotary burners, dilute oxygen combustion (DOC) systems, oscillating combustion and low‐NOx burners with a vacuum‐swing‐adsorption (VSA) oxygen system, referred to as air‐oxygen/fuel burner. More specifically: Rotary burners control gas pressure to ensure the desired fuel‐to‐air ratio. Dilute oxygen combustion relies on the rapid and complete mixing of fuel and oxygen jets
with hot furnaces gases containing low levels of oxygen. Oscillating combustion systems use a valve to oscillate the fuel flow rate to the burner.
Oscillation creates successive fuel‐rich and fuel‐lean zones within the flame. Heat transfer to the load is increased due to more luminous fuel rich‐zones and the break up of the thermal boundary layer, which shortens heat‐up times.
Air‐oxygen/fuel burners use an innovative air‐oxy‐natural gas burner that achieves high productivity and energy efficiency with low NOX emissions.

Advancing Opportunities in Energy Management in Ontario Industrial and Management Sector March 17, 2010
CME / Stantec / Marbek / ODYNA F‐15
Modern burners are increasingly using servomotors with parallel positioning to independently control the quantities of fuel and air delivered to the burner head. These controls provide consistent performance and repeatability as the burner adjusts to different firing rates. Alternatives to electronic controls are burners with a single drive or jackshaft.28 Examples of advanced burner technologies include radiation stabilized burners (RSB), forced internal recirculation (FIR) burners and the low‐swirl burners (LSB). More specifically: The RSB is a fully pre‐mixed, semi‐radiant, surface stabilized burner, developed to provide
high thermal efficiency and very low emission of NOx and CO in industrial boilers and process heaters.
The FIR burner aims to reduce emissions while maintaining the boiler efficiency. The FIR burner operates with pre‐mixed sub‐stoichiometric combustion and significant internal recirculation of partial combustion products. Both the RSB and FIR burners are available commercially.
The LSB is being developed to achieve ultra‐low NOx emissions and increase system efficiency. The burner system combines a low‐swirl flame stabilization method with internal flue gas recirculation. It is also being optimized to utilize partially reformed natural gas.
In addition to the high‐efficiency burners discussed above, the use of oxy‐gas is one of the major efficiency improvements applicable to high‐temperature applications, such as furnaces and kilns. Replacing air with oxygen eliminates the need to heat and process large volumes of nitrogen present in air. This reduces energy use and enables a reduction in equipment size. In many industrial activities, air quality regulations drive the demand for high efficiency but low emissions (NOx, CO) in the combustion process. NOx formation is reduced by reducing the amount of nitrogen in contact with oxygen at high flame temperatures. Oxy‐fuel burners are used throughout industry, including the steel and glass sectors. The high velocities of the gases in the burner ensure that the fuel is completely combusted at a lower temperature zone of the flame. An earlier case study in the metal casting industry reviewed the installation of an oxy‐fuel melting furnace in an iron foundry. The furnace achieved a reduction in energy use, an improvement in operational costs and had a lower initial investment cost than a conventional electric furnace.29 The use of oxy‐gas direct flame impingement (DFI) is specifically applicable to stainless steel annealing. DFI is based on a large number of small oxy‐fuel burners that are positioned in rows close to the steel strip in order to realize oxy‐fuel flames that are directly impinging the strips. Production capacity increases after the installation of the DFI oxy‐gas unit and improves the energy efficiency.30 Exhaust Gas Heat Recovery Exhaust gas heat recovery increases efficiency because it extracts energy from the exhaust gases and recycles it back to the process. Significant efficiency improvements can be made on
28 U.S. Department of Energy. Office of Energy Efficiency and Renewable Energy. Industrial Technologies Program. Energy Tips – Steam – Upgrading Boilers to High‐efficiency Burners. 29 Ernest, Orlando. Lawrence Berkley National Laboratory and the American Council for an Energy Efficient Economy (ACEEE). Emerging Energy‐Efficient Industrial Technologies. 2000. Report reference number: LBNL 46990. 30 Gas, L. State‐of‐the‐art Oxyfuel Solutions for Reheating and Annealing Furnaces in Steel Industry. 2007. Presentation retrieved www.linde‐gas.com/rebox.
Advancing Opportunities in Energy Management in Ontario Industrial and Management Sector March 17, 2010
CME / Stantec / Marbek / ODYNA F‐16
furnaces, kilns, dryers and ovens, even if they are already operating with properly tuned ratio and temperature controls. For lower and medium temperature applications, heat recovery from flue gas can be used to preheat oven burners, or heat other media such as make‐up air, feed product or ventilation make‐up air. The energy saved in heat recovered from the flue gas is related to the temperature difference between the flue gas and the heated medium, and the savings depend upon finding applications where heat recovery is economic and improves the process. Heat or enthalpy wheels are used at a number of facilities to recover the heat. The actual energy savings and costs depend on the heat wheel implemented. New heat recovery technologies continue to be developed, such as heat wheels with a desiccant core to recover energy, which can operate with low‐grade heat in more robust environments. Opportunities vary by sub‐sector. For example, in the Food sub‐sector, recovered flue gas can be used to provide heat at the dough‐rising stage, or to provide hot water for other processes. Payback periods for heat recovery systems in medium‐ to low‐ temperature application, such as ovens and dryers, range between 2.5 and four years, and are dependent on the type of technology implemented and the application of the recovered heat.31 For high‐temperature applications there are mainly four widely used methods: direct heat recovery to the product; using a recuperator to transfer heat from the outgoing exhaust gas to the incoming combustion air, while keeping the two streams from mixing; using a regenerator to store thermal energy for future use; and using a waste heat boiler. Process Heat Recovery to Preheat Product Process heat recovery includes the use of waste heat from industrial processes to heat other processes or utility streams. A wide range of heat recovery opportunities exists, including heat transfer between a heat source and a heat sink, where the heat sink and heat source could be either gas, liquid or solid. In this measure, the recovered process heat is used to preheat products to be heated up in an oven or kiln. Advanced Heating and Process Control Advanced heating and process controls refer to opportunities to reduce energy losses by improving control systems that govern aspects such as material handling, heat storage and turndown. These also include process thermal optimization measures. Energy losses that are generally attributable to system operation during periods of low throughput are addressed. Some advanced controls use a programmed heating temperature setting for part load operation; they also monitor and control exhaust gas oxygen as well as unburned hydrocarbon and carbon monoxide emissions. Advanced heating and process controls are often one of the first energy‐efficiency measures a facility will implement to improve energy efficiency. Although the measure has achieved a substantial market penetration, a large market still remains. Insulation Heat loss can cause significant reduction in process heating efficiency. Insulation of equipment and pipes increases the amount of energy available for end uses by decreasing the amount of 31 Ernest, Orlando. Lawrence Berkley National Laboratory. Energy Efficiency Improvement and Cost Saving Opportunities for the Vehicle Assembly Industry. 2003. Report reference number: LBNL 50939.

Advancing Opportunities in Energy Management in Ontario Industrial and Management Sector March 17, 2010
CME / Stantec / Marbek / ODYNA F‐17
heat lost from the system. New refractory fibre material with low thermal conductivity and heat storage can produce significant improvements in efficiency. Typical applications include furnace covers, installing fibre liner between the standard refractory lining and the shell wall or installing ceramic fibre liner over the present refractory liner. Replacing standard refractory linings with vacuum‐formed refractory fibre insulation can also improve efficiency. It is reported that installing a furnace with refractory fibre liners can improve thermal efficiency of the heating process by up to 50 percent.32 Insulation removed during maintenance is often not replaced, and older insulation deteriorates with time. To improve the energy efficiency of the system, regular insulation surveys assist in identifying areas with insufficient insulation. A significant amount of facilities do not have regular insulation surveys.
Air Curtains Air heat seals at continuous oven and dryer entrances and exits limit heat loss with airflow. Air curtains are generally not applicable to batch operations. Air curtains are not usually technically feasible at high‐temperature processes, such as kilns and furnaces, due to the process lay out, the high‐temperature differential and if the processes operate as batch processes. In a typical application, a heat seal draws hot interior air and compresses it in scroll fans. Centrifugal fans are used to create an air curtain at oven and dryer openings. When used on oven/dryer openings, air curtains are normally installed horizontally over the opening and angled slightly inward to contain the hot air. Air heat seals can be installed as a retrofit or a new installation. Refrigeration and Cooling System High Efficiency Multiplex Compressors This measure involves the replacement of standard efficiency stand‐alone refrigeration compressors with several (3 to 5) high efficiency refrigeration compressors of different capacities connected in parallel. Aside from the energy saved due to high efficiency compressors, significant energy savings is also achieved by operating the optimum combination of compressors to maximize the overall part load efficiency. High Efficiency Chiller Centrifugal chillers can offer great savings over absorption and other kinds of chillers, particularly if they are running at full‐load or using ASD controls. Optimized Distribution System An optimized distribution system ensures proper refrigerant feed to evaporators without excessive pressure drop, prevents excessive lubricating oil in any part of the system, ensures the compressor is adequately lubricated, and optimizes refrigerant distribution.
32 U.S. Environmental Protection Agency; Wise Rules for Industrial Efficiency: a Toolkit for Estimating Energy Savings and Greenhouse Gas Emissions, 1998.

Advancing Opportunities in Energy Management in Ontario Industrial and Management Sector March 17, 2010
CME / Stantec / Marbek / ODYNA F‐18
Free‐cooling Free‐cooling involves the use of a cooling tower rather than a chiller in the system when the outdoor temperature is low enough. Free‐cooling also includes the use cool well/ground water to pre‐cool cooling water/product or to improve the refrigeration cycle. Floating head pressure controls With floating head pressure, the system moderates refrigerant flow depending on outside air temperate and pressure, rather than being maintained at a high fixed pressure, which reduces the system's energy requirements. Premium Efficiency Refrigeration Control System A premium efficiency refrigeration control system is a centralized control system, which interfaces with existing controllers to optimally control the operation of each of the compressors, condensers, and evaporators. It can also interface with power metering to achieve demand control. Smart defrost controls Smart defrost controls, in which sensors are used so that defrost is initiated only when necessary and terminated just when the fin block is clear of ice, are more efficient than timed defrosting, as it adjusts to the varying levels of ice build‐up that normally occur Doors, Covers, and Curtains Upgraded covers, curtains and doors can seal the cooled space and reduce the amount of cooling energy that is lost to the outside environment, thereby reducing the cooling load on the refrigeration equipment. Insulation of refrigeration system Insulation on the refrigerant piping and other parts of the system reduces the absorption of heat by the refrigerant from any environment other than the refrigerated area. Pumps, Fans, and Other Motors Optimized duct design to improve efficiency Ducts can be optimized by reducing the number of ninety‐degree angles in the system, as well as by optimizing the cross‐sectional area of the duct and eliminating unnecessary duct systems, thereby reducing the friction and pressure the pumps and fans must overcome. Impeller trimming Impeller trimming offers the opportunity to customize the size of a pump or fan without having to buy expensive new parts.

Advancing Opportunities in Energy Management in Ontario Industrial and Management Sector March 17, 2010
CME / Stantec / Marbek / ODYNA F‐19
Air Compressor System Premium Efficiency ASD Compressor Premium efficiency air compressors have high‐efficiency components and come with built‐in ASD control that allows the compressor output to match the plant air demand. They use a variety of advanced technologies, including frictionless compression, magnetic bearings, and digital controls. The compressor has only one main moving part with two stages of centrifugal compression, with the potential to incorporate an economizer. The result is that these compressors achieve the highest overall efficiencies for compressors, for example, a Turbocor product. Replace pneumatic motors with mechanical Many smaller tools such as grinders use pneumatic motors. These motors can often be changed to either high speed electric motors, stepping motors, or to DC motors with a significant reduction in energy use. Low pressure blower to replace compressed air This option replaces compressed air with low pressure blowers in low pressure applications, providing air using less electrical energy Optimized sizing and pressure of compressor system Typically, compressors are selected that do not exactly meet the design conditions of the process or system. Replacing an oversized compressor with one that more closely matches the system requirements reduces energy consumption. Optimized distribution system Distribution system upgrades involve the optimization of air storage to reduce pressure fluctuations, and air piping redesign to reduce friction losses. The piping redesign can also reduce the system pressure drop and lower the set point at the air compressors. Removing, or capping, unused pipes will assist in operating at a lower pressure and reducing air demand. Optimized sizes of air receiver tanks The optimization of air storage can reduce pressure and compressed air demand fluctuations at the compressor. Use cooler air from outside for make‐up air Outdoor air may be used as make‐up air, as outdoor air is normally cooler than the air in the compressor room or other parts of the facility. Less energy is used to compress cooler air compared to compressing warmer air.

Advancing Opportunities in Energy Management in Ontario Industrial and Management Sector March 17, 2010
CME / Stantec / Marbek / ODYNA F‐20
Adjustable Speed/Variable frequency drive This option is a standard compressor coupled with an electronic adjustable‐speed drive. In order to meet variable compression loads, compressor speed can be adjusted, improving the part‐load efficiency of the compression cycle. Sequencing Control Sequencing control systems can operate the compressors so that the larger compressor is base loaded (always on), the mid‐sized compressors are used as needed to increase supply and an ASD compressor acts as the trim compressor (provides for the variable component of the process air demand). Air leak survey and repair Regular inspection of air leaks and repair can result in high savings by reducing compressed air demand. Air leaks may be eliminated by upgrading air connectors, hoses and other associated parts. Process Specific Optimized process controls Overall process efficiency can be increased by optimizing improving control systems that govern aspects such as material handling, heat storage and turndown, and thermal optimization measures. Heating/ Ventilation/ Air Conditioning (HVAC) Solar Walls Solar walls use solar energy to preheat outside air before it is introduced into a plant. The warmed air can be distributed as is, further heated in a building’s primary heating system or used as combustion air for industrial furnaces. Because the air going into the system is already warm, less energy is needed to heat it further. Solar walls are typically made of dark metal cladding, usually unglazed corrugated aluminum, which is mounted over a south‐facing wall. Sunlight hitting the cladding warms the air near its surface, which is then drawn through thousands of small perforations in the cladding into a narrow space between the wall and the building. The heated air rises to an overhanging canopy plenum where it is drawn into the facility by fans and dampers. A solar wall is virtually maintenance free, with no liquids or moving parts other than the ventilation system fans. Radiant Heaters Radiant heating equipment is designed to provide comfort heating through the application of radiant heat transfer. Radiant heaters work by emitting heated infrared rays, which are absorbed by objects, such as floors, equipment or people. Infrared heat rays do not warm the

Advancing Opportunities in Energy Management in Ontario Industrial and Management Sector March 17, 2010
CME / Stantec / Marbek / ODYNA F‐21
air, although the air immediately surrounding the “heated” objects is warmed by the increase in temperature of those objects. These systems are very efficient compared to convection type heaters and can use significantly less natural gas than a natural gas‐fired convection heating system. Radiant heating technology is mature and data indicated that close to one‐third of the potential market is already captured. Ground Source Heat Pump Ground source heat pumps provide more efficient heating and cooling than standard or high‐efficiency air source heat pumps by using a heat source/sink. These systems can either be closed loop or open looped. An open loop pump uses an available water supply as the heat source/sink. These systems can only be used where water sources are easily available and allowed to be used for this purpose. Closed loop systems use the thermal storage capacity of the ground for space heating and cooling. Closed loop systems employ horizontal or vertical piping networks placed below the ground as heat exchangers (heat source/sink). Water is pumped through the network and exchanges heat with the heat pump’s refrigerant. Ventilation Optimization Ventilation optimization includes optimizing the volume of air brought in to a facility, as well as matching the load required at different times. It is also possible to use interlocking ventilation air supply and exhaust with the operation of the process, in cases where ventilation air is required to ensure air quality requirements are met while the process is in operation. Ventilation Heat Recovery In a ventilation heat recovery system, a heat exchanger or enthalpy wheel is used to recover heat from ventilation air to be exhausted. The recovered heat is used to preheat fresh make‐up air that is brought in to replace the exhausted air, thus reducing the amount of energy used to heat the air to the required temperature. Air Compressor Heat Recovery Typically, the warm exhaust gas produced by plant air compressors is discharged outside the building. Using this exhaust during winter to replace outside make‐up air can significantly reduce the cold make‐up air supply. Installing a duct that joins the compressor gas exhaust to the existing plant air distribution system ensures that the warm air is distributed evenly through the plant. During summer months the exhaust gas from the compressors will still need to be vented outside the building. Automated Temperature Control Automatic temperature controls allow the temperature in different areas to be varied according to a schedule, in order to save energy during times when a space need not be heated or cooled as much. These controls may also prevent individuals from manually changing the temperature settings.

Advancing Opportunities in Energy Management in Ontario Industrial and Management Sector March 17, 2010
CME / Stantec / Marbek / ODYNA F‐22
Destratification Fans The air temperature in large, high ceiling storage rooms can become stratified (i.e., air is layered at different temperatures at different levels). Destratification fans are high‐volume, low‐speed fans that mix the air and eliminate stratified layers of temperature in large spaces. These types of fans use a comparable amount of energy as conventional, small ceiling fans, but since fewer fans are required, the total energy required is reduced. High‐volume, low‐speed destratification fans have been on the market for a number of years and are at the early stages of market penetration. Warehouse Loading Dock Seals Warehouse loading dock seals provide a barrier between the back of a docked truck and the edges of the loading dock opening. An improper seal may result in drafts and a loss of heat from the warehouse. Air Curtains Open loading dock doors may lose a large amount of heat between the time they are opened and when a truck is docked. An air curtain at the loading dock door acts as a thermal barrier, lowering the amount of energy lost through the opening. Air curtains work by generating a jet of high‐velocity air that separates the two sides of the jet, forming a screen or curtain. The air curtain should be activated as soon as the loading dock door is opened and then stopped once it is closed in order to conserve energy. Air curtains can either be heated or unheated, depending on the application requirement. Lighting High Efficiency Lights and Ballasts As lighting technology continues to improve, the efficiency levels of both lights and ballasts continues to improve as well. Maximum increases in efficiency are attained by replacing both the bulb and the ballast. High Efficiency Lighting Design In an efficient lighting design, areas are only lit according to the occupancy requirements and overly‐lit areas are reduced. For example, task lighting may be used in place of higher intensity ambient lighting. Automated Lighting Controls Automated lighting controls are used to reduce the amount of time a space is illuminated while it is vacant. Controls can include occupancy sensors, photocells, and timers.

Advancing Opportunities in Energy Management in Ontario Industrial and Management Sector March 17, 2010
CME / Stantec / Marbek / ODYNA G‐1
Appendix G Benchmarking Results and Base Year Market Penetration Rates

Advancing Opportunities in Energy Management in Ontario Industrial and Management Sector March 17, 2010
CME / Stantec / Marbek / ODYNA G‐2
Exhibit G‐1: Technical Best Practices in the Primary Metal Sub‐sector
Exhibit G‐2: Technical Best Practices in the Chemical Sub‐sector

Advancing Opportunities in Energy Management in Ontario Industrial and Management Sector March 17, 2010
CME / Stantec / Marbek / ODYNA G‐3
Exhibit G‐3: Technical Best Practices in the Paper Sub‐sector
Exhibit G‐4: Technical Best Practices in the Transportation Equipment and Machine Manufacturing Sub‐sector

Advancing Opportunities in Energy Management in Ontario Industrial and Management Sector March 17, 2010
CME / Stantec / Marbek / ODYNA G‐4
Exhibit G‐5: Technical Best Practices in the Food and Beverage Sub‐sector
Exhibit G‐6: Technical Best Practices in the Non‐Metallic Mineral Sub‐sector

Advancing Opportunities in Energy Management in Ontario Industrial and Management Sector March 17, 2010
CME / Stantec / Marbek / ODYNA G‐5
Exhibit G‐7: Technical Best Practices in the Fabricated Metal Sub‐sector
Exhibit G‐8: Technical Best Practices in the Plastic and Rubber Sub‐sector

Advancing Opportunities in Energy Management in Ontario Industrial and Management Sector March 17, 2010
CME / Stantec / Marbek / ODYNA G‐6
Exhibit G‐9: Technical Best Practices in the Other Manufacturing Sub‐sector

Advancing Opportunities in Energy Management in Ontario Industrial and Management Sector March 17, 2010
CME / Stantec / Marbek / ODYNA G‐7
Exhibit G‐10: Base Year Technical Best Practice Market Penetration Rates End use Measure Name Chemical Primary
Metal Petroleum and Coal
Paper Transportation Equipment & Machinery
Food, Beverage, & Tobacco
Mining Non‐Metallic Mineral
Fabricated Metal
Other Plastics & Rubber
Sub‐Metering 19% 31% 19% 25% 21% 17% 31% 20% 8% 18% 24%
Energy Management 39% 23% 39% 22% 35% 39% 28% 41% 28% 19% 37%
System
Integrated Control System 25% 14% 25% 14% 8% 21% 14% 11% 0% 6% 0%
Condensing Boiler 7% 0% 7% 5% 5% 7% 0% 0% 0% 5% 0%
Instantaneous Steam Generation
10% 2% 10% 10% 13% 8% 2% 1% 1% 10% 3%
High Efficiency Burner 20% 25% 20% 25% 17% 20% 25% 25% 25% 20% 5%
Economizer 90% 60% 80% 75% 60% 40% 60% 60% 65% 65% 0%
Boiler Right Sizing and Load Management
50% 20% 50% 25% 60% 46% 20% 50% 20% 50% 57%
Blowdown Heat Recovery 95% 20% 95% 75% 30% 0% 20% 20% 20% 30% 65%
Boiler combustion air preheat
90% 30% 90% 70% 10% 10% 10% 10% 10% 0% 10%
Process Heat Recovery to Preheat Makeup Water
50% 10% 50% 25% 33% 38% 10% 35% 20% 40% 17%
Condensate Return 80% 60% 80% 70% 75% 83% 100% 67% 60% 75% 57%
Advanced boiler controls 35% 15% 35% 40% 40% 25% 35% 20% 20% 30% 17%
Blowdown Control 50% 35% 50% 40% 56% 58% 35% 40% 40% 25% 33%
Insulation 85% 60% 85% 75% 95% 85% 70% 75% 60% 75% 65%
Boiler Maintenance 90% 65% 90% 70% 95% 85% 85% 85% 80% 75% 65%
Boiler Water Treatment 90% 80% 90% 80% 95% 92% 80% 90% 70% 75% 70%
Minimize Deaerator Vent Losses
45% 35% 45% 45% 65% 38% 35% 45% 40% 62% 35%
Steam boilers and steam systems
Steam Trap Survey and Repair
50% 30% 50% 50% 71% 31% 45% 50% 50% 30% 50%
Direct‐Contact Hot Water Heaters
25% 0% 25% 20% 0% 10% 0% 0% 0% 10% 0%
High Efficiency Burner 20% 25% 20% 25% 17% 20% 25% 25% 25% 20% 5%
Hot water heaters and boilers
Water‐heater right sizing and load management
50% 20% 50% 25% 60% 46% 20% 50% 20% 50% 57%

Advancing Opportunities in Energy Management in Ontario Industrial and Management Sector March 17, 2010
CME / Stantec / Marbek / ODYNA G‐8
End use Measure Name Chemical Primary Metal
Petroleum and Coal
Paper Transportation Equipment & Machinery
Food, Beverage, & Tobacco
Mining Non‐Metallic Mineral
Fabricated Metal
Other Plastics & Rubber
Blowdown Heat Recovery 95% 20% 95% 75% 30% 0% 20% 20% 20% 30% 65%
Boiler combustion air preheat
90% 30% 90% 70% 10% 10% 10% 10% 10% 0% 10%
Process Heat Recovery to Preheat Makeup Water
50% 10% 50% 25% 33% 38% 10% 35% 20% 40% 17%
Advanced water‐heater controls
35% 15% 35% 40% 40% 25% 35% 20% 20% 30% 17%
Blowdown Control 50% 35% 50% 40% 56% 58% 35% 40% 40% 25% 33%
Insulation 85% 60% 85% 75% 95% 85% 70% 75% 60% 75% 65%
Boiler Water Treatment 90% 80% 90% 80% 95% 92% 80% 90% 70% 75% 70%
Water‐heater Maintenance
90% 65% 90% 70% 95% 85% 85% 85% 80% 75% 65%
Insulation 85% 60% 85% 75% 95% 85% 70% 75% 60% 75% 65% Steam systems (imported steam)
Steam Trap Survey and Repair
50% 30% 50% 50% 71% 31% 45% 50% 50% 30% 50%
High Efficiency Oven 20% 5% 20% 10% 16% 20% 10% 5% 5% 0% 5%
High Efficiency Dryer 35% 35% 35% 20% 35% 35% 15% 15% 35% 40% 67%
High‐efficiency Kilns 60%
High‐efficiency Furnaces 60% 35% 60% 5% 0%
Induction Barrel Heating 1% 0% 0% 0% 1% 1% 0% 0% 0% 1% 1%
High efficiency burner 35% 35% 35% 20% 16% 35% 20% 45% 40% 40% 20%
Exhaust Gas Heat Recovery
6% 3% 6% 3% 7% 8% 1% 6% 3% 5% 11%
Process heat recovery to preheat product
8% 5% 8% 5% 9% 10% 3% 8% 5% 7% 13%
High efficiency burner controls
20% 20% 20% 8% 15% 15% 5% 25% 10% 20% 8%
Advanced heating and Process Control
30% 60% 30% 20% 35% 25% 20% 50% 50% 50% 50%
Insulation 75% 80% 75% 60% 83% 100% 35% 67% 82% 75% 100%
Furnaces/ kilns/ ovens/ dryers
Air Curtains 50% 5% 50% 20% 31% 17% 5% 50% 42% 27% 17%
Cooling & Refrigeration
High efficiency multiplex compressors
15% 8% 15% 5% 10% 3% 3% 10% 26% 30% 21%

Advancing Opportunities in Energy Management in Ontario Industrial and Management Sector March 17, 2010
CME / Stantec / Marbek / ODYNA G‐9
End use Measure Name Chemical Primary Metal
Petroleum and Coal
Paper Transportation Equipment & Machinery
Food, Beverage, & Tobacco
Mining Non‐Metallic Mineral
Fabricated Metal
Other Plastics & Rubber
High Efficiency Chiller 12% 6% 12% 4% 8% 20% 2% 8% 10% 24% 9%
Optimized Distribution System
50% 3% 50% 3% 5% 22% 3% 2% 14% 8% 23%
Free‐cooling 25% 83% 25% 0% 25% 29% 100% 17% 23% 26% 38%
Floating head pressure controls
50% 1% 50% 3% 3% 22% 2% 2% 14% 33% 25%
Premium efficiency refrigeration control system
8% 0% 8% 0% 33% 50% 4% 0% 14% 40% 44%
Smart Defrost Controls 5% 0% 5% 10% 0% 15% 0% 0% 0% 17% 9%
Doors, Covers and Curtains
40% 16% 40% 20% 21% 72% 10% 13% 12% 11% 24%
Improve insulation of refrigeration system
75% 13% 75% 25% 50% 82% 10% 100% 50% 50% 56%
Premium efficiency pump 1% 1% 1% 6% 3% 2% 1% 0% 0% 1% 5%
Impeller Trimming 8% 7% 8% 5% 1% 4% 2% 2% 13% 2% 2%
Optimization of pumping system
2% 1% 2% 8% 3% 2% 2% 1% 1% 1% 7%
Pumps
Premium Efficiency Control with ASDs
21% 17% 21% 12% 2% 9% 5% 5% 32% 5% 4%
Premium efficiency fans and blowers
1% 0% 1% 4% 0% 1% 0% 0% 0% 1% 8%
Impeller Trimming 13% 4% 13% 2% 8% 3% 22% 1% 3% 1% 50%
Optimized duct design to improve efficiency
10% 0% 10% 0% 6% 1% 20% 0% 0% 0% 40%
Premium efficiency control, with ASD
15% 5% 15% 3% 8% 3% 24% 2% 3% 2% 59%
Synchronous Belts 11% 6% 11% 0% 0% 0% 0% 0% 14% 0% 0%
Fans/Blowers
Minimize damper losses on fans
3% 0% 3% 0% 2% 1% 6% 0% 3% 0% 10%
Premium Efficiency Motors
1% 7% 1% 4% 1% 2% 1% 1% 3% 5% 1%
Correctly sized motors 2% 5% 2% 8% 7% 5% 1% 1% 7% 2% 4%
Optimized motor control 3% 5% 3% 10% 9% 7% 1% 1% 9% 5% 7%
Other Motors
Synchronous Belts 10% 3% 10% 0% 2% 0% 7% 0% 10% 0% 8%

Advancing Opportunities in Energy Management in Ontario Industrial and Management Sector March 17, 2010
CME / Stantec / Marbek / ODYNA G‐10
End use Measure Name Chemical Primary Metal
Petroleum and Coal
Paper Transportation Equipment & Machinery
Food, Beverage, & Tobacco
Mining Non‐Metallic Mineral
Fabricated Metal
Other Plastics & Rubber
Premium Efficiency ASD Compressor
15% 20% 15% 5% 33% 33% 15% 15% 26% 15% 15%
Replace pneumatic motors with mechanical
3% 1% 3% 1% 3% 1% 1% 1% 2% 3% 5%
Low pressure blower to replace compressed air
8% 2% 8% 2% 5% 3% 1% 1% 3% 5% 15%
Optimized sizing and pressure of compressor system
20% 10% 20% 7% 25% 9% 12% 12% 12% 10% 20%
Optimized distribution system (incl. pressure)
50% 25% 50% 17% 62% 23% 30% 30% 29% 25% 50%
Optimized sizes of air receiver tanks
75% 65% 75% 70% 73% 57% 65% 70% 67% 71% 71%
Use cooler air from outside for make up air
65% 55% 65% 70% 20% 15% 65% 55% 22% 57% 59%
Adjustable Speed/Variable frequency drive
11% 3% 11% 3% 9% 10% 3% 7% 6% 8% 7%
Sequencing Control 55% 17% 55% 15% 46% 50% 15% 33% 30% 41% 36%
Compressed air Systems
Air leak survey and repair 68% 50% 68% 73% 58% 36% 53% 90% 80% 50% 82%
Improved energy efficient design
22% 28% 25% 28% 17% 25% 28% 32% 25% 14% 28%
Improved energy efficient electrode material
28% 27% 28% 27% 26% 25% 18% 32% 23% 16% 31%
Electro‐chemical
Automated and continuous operation
29% 27% 29% 25% 30% 27% 17% 28% 30% 32% 28%
Improved equipment efficiency
28% 27% 28% 27% 26% 25% 18% 32% 23% 16% 31% Process Specific
Optimized process controls
29% 27% 29% 25% 30% 27% 17% 28% 30% 32% 28%
High‐efficiency packaged HVAC
13% 5% 13% 5% 30% 35% 5% 5% 23% 25% 13%
Solar Walls 0% 0% 0% 0% 2% 0% 0% 0% 2% 0% 0% Radiant Heaters 30% 25% 30% 26% 35% 33% 28% 28% 35% 28% 30% Ground Source Heat Pump
65% 25% 65% 5% 10% 21% 5% 13% 29% 15% 7%
Ventilation Optimization 12% 10% 12% 10% 22% 20% 18% 8% 10% 11% 22%
Ventilation Heat Recovery 8% 0% 8% 3% 8% 0% 2% 0% 23% 11% 23%
Air Compressor Heat Recovery
11% 0% 11% 3% 12% 13% 2% 11% 8% 10% 16%
HVAC
Automated Temperature 40% 35% 35% 20% 42% 50% 33% 29% 60% 70% 53%

Advancing Opportunities in Energy Management in Ontario Industrial and Management Sector March 17, 2010
CME / Stantec / Marbek / ODYNA G‐11
End use Measure Name Chemical Primary Metal
Petroleum and Coal
Paper Transportation Equipment & Machinery
Food, Beverage, & Tobacco
Mining Non‐Metallic Mineral
Fabricated Metal
Other Plastics & Rubber
Control Reduced Temperature Settings
50% 38% 50% 20% 42% 50% 45% 29% 65% 75% 53%
Destratification Fans 5% 5% 5% 5% 12% 8% 3% 5% 10% 8% 10% Warehouse Loading Dock Seals
45% 40% 45% 40% 55% 48% 30% 35% 40% 45% 48%
Air Curtains 52% 45% 52% 45% 65% 65% 40% 40% 45% 65% 55% High efficiency lights and ballasts
18% 8% 18% 15% 22% 20% 8% 11% 21% 18% 17%
High‐efficiency lighting design
11% 5% 11% 7% 10% 11% 0% 7% 8% 5% 11%
Lighting
Automated lighting controls
28% 38% 28% 25% 37% 25% 28% 33% 40% 39% 59%

Advancing Opportunities in Energy Management in Ontario Industrial and Management Sector March 17, 2010
CME / Stantec / Marbek / ODYNA H‐1
Appendix H Economic Potential Scenario Results

Advancing Opportunities in Energy Management in Ontario Industrial and Management Sector March 17, 2010
CME / Stantec / Marbek / ODYNA H‐2
Exhibit H‐1: Economic Potential Natural Gas Savings by Milestone Year
Economic Potential Natural Gas Savings (PJ) Sub‐Sector 2010 2015 2020 2025 2030
Primary Metal 9.1 13.2 14.2 16.7 17.9
Chemical 10.9 13.5 14.5 15.9 16.1
Paper 6.9 8.0 9.0 9.9 10.5
Non‐Metallic Mineral 6.2 8.3 9.7 11.9 13.4
Petroleum and Coal 5.9 6.8 7.9 9.3 10.1 Transportation Equipment and Machinery 5.7 6.4 6.4 6.8 7.1
Food, Beverage and Tobacco 5.0 5.9 6.1 6.5 6.7
Mining 3.8 4.3 4.3 4.5 4.6
Fabricated Metal 2.0 2.2 2.3 2.7 2.8
Plastics and Rubber 1.0 1.2 1.2 1.4 1.5
Other 10.8 12.9 12.9 15.1 15.6
Totals 67 83 88 101 106
Exhibit H‐2: Economic Potential Electricity Savings by Milestone Year
Economic Potential Electricity Savings (PJ) Sub‐Sector 2010 2015 2020 2025 2030
Primary Metal 6.3 8.2 9.0 9.9 10.2
Chemical 3.4 3.7 4.0 4.2 4.3
Paper 6.0 6.3 6.7 7.4 7.7
Non‐Metallic Mineral 1.6 1.9 2.2 2.6 2.8
Petroleum and Coal 2.3 2.3 2.5 2.7 2.9 Transportation Equipment and Machinery 4.9 5.0 5.1 5.3 5.2
Food, Beverage and Tobacco 2.6 2.7 2.8 2.8 2.8
Mining 3.4 3.5 3.5 3.6 3.6
Fabricated Metal 2.5 2.5 2.5 2.7 2.7
Plastics and Rubber 2.9 3.2 3.4 3.7 3.8
Other 5.7 5.9 6.2 6.6 6.6
Totals 42 45 48 52 52

Advancing Opportunities in Energy Management in Ontario Industrial and Management Sector March 17, 2010
CME / Stantec / Marbek / ODYNA H‐3
Exhibit H‐3: Economic Potential RPP Savings by Milestone Year
Economic Potential RPP Savings (PJ) Sub‐Sector 2010 2015 2020 2025 2030
Primary Metal 2.4 3.3 3.4 3.7 4.0
Chemical 1.7 2.1 2.2 2.6 2.5
Paper 0.6 0.6 0.7 0.8 0.9
Non‐Metallic Mineral 0.6 0.8 0.9 1.0 1.1
Petroleum and Coal 5.8 6.2 6.7 8.7 9.6 Transportation Equipment and Machinery 0.4 0.5 0.5 0.6 0.6
Food, Beverage and Tobacco 0.6 0.7 0.7 0.8 0.9
Mining 0.7 0.8 0.8 0.8 0.9
Fabricated Metal 0.2 0.2 0.2 0.2 0.2
Plastics and Rubber 0.5 0.5 0.6 0.7 0.7
Other 0.9 1.0 1.0 1.2 1.3
Totals 14 17 18 21 23
Exhibit H‐4: Economic Potential Other Fuel Savings by Milestone Year
Economic Potential Other Fuel Savings (PJ) Sub‐Sector 2010 2015 2020 2025 2030
Primary Metal 18 25 21 21 21
Chemical 3.0 3.3 2.8 2.8 2.8
Paper 0.4 0.4 0.4 0.4 0.4
Non‐Metallic Mineral 5.7 7.2 6.5 6.8 7.1
Petroleum and Coal ‐ ‐ ‐ ‐ ‐ Transportation Equipment and Machinery ‐ ‐ ‐ ‐ ‐
Food, Beverage and Tobacco ‐ ‐ ‐ ‐ ‐
Mining 0.6 0.6 0.5 0.5 0.5
Fabricated Metal ‐ ‐ ‐ ‐ ‐
Plastics and Rubber ‐ ‐ ‐ ‐ ‐
Other 0.8 0.8 0.7 0.8 0.8
Totals 29 37 32 33 33

Advancing Opportunities in Energy Management in Ontario Industrial and Management Sector March 17, 2010
CME / Stantec / Marbek / ODYNA I‐1
Appendix I GHG and CAC Emissions

Advancing Opportunities in Energy Management in Ontario Industrial and Management Sector March 17, 2010
CME / Stantec / Marbek / ODYNA I‐2
Exhibit I‐1: Economic Potential GHG Emissions by Milestone Year
Economic Potential GHG Emissions (million tonne)
Sub‐sector 2007 2010 2015 2020 2025 2030
Primary Metal 11.9 8.8 10.8 10.1 10.6 11.3
Chemical 4.9 3.6 4.1 4.0 4.3 4.6
Paper 3.3 2.0 2.2 2.1 2.2 2.4 Non‐Metallic Mineral 4.0 2.9 3.1 3.1 3.4 3.9
Petroleum and Coal 2.9 2.3 2.3 2.3 2.5 2.8 Transportation Equipment and Machinery 2.3 1.3 1.4 1.3 1.4 1.4 Food, Beverage and Tobacco 1.9 1.1 1.1 1.1 1.1 1.2
Mining 1.9 1.5 1.5 1.4 1.5 1.5
Fabricated Metal 0.8 0.6 0.5 0.5 0.5 0.5
Plastics and Rubber 0.8 0.6 0.6 0.6 0.7 0.7
Other 4.8 3.0 3.0 2.8 2.8 2.9
Total 39 28 31 29 31 33
Exhibit I‐2: Economic Potential CAC Emissions by Milestone Year
Economic Potential CAC Emissions (kg)
Sub‐sector 2007 2010 2015 2020 2025 2030
Primary Metal 38,548,095 28,956,763 35,467,675 32,329,968 34,166,433 36,027,826
Chemical 11,786,338 8,892,824 10,147,164 9,460,308 10,125,737 10,920,479
Paper 5,071,503 3,163,320 3,425,685 3,202,465 3,453,146 3,750,132
Non‐Metallic Mineral 12,236,354 8,890,971 9,646,985 9,380,134 10,461,791 11,715,394
Petroleum and Coal 6,443,524 5,034,959 5,171,560 5,155,406 5,645,422 6,390,363 Transportation Equipment and Machinery 2,539,623 1,462,644 1,548,785 1,459,435 1,531,749 1,634,700 Food, Beverage and Tobacco 2,993,938 1,758,661 1,844,865 1,713,414 1,792,713 1,910,428
Mining 3,477,906 2,754,249 2,916,850 2,604,614 2,695,870 2,763,004
Fabricated Metal 797,859 500,327 489,165 439,515 420,578 448,009
Plastics and Rubber 689,200 503,294 581,504 590,633 657,625 727,421
Other 8,292,231 5,309,088 5,438,709 4,887,883 4,828,046 5,019,154
Total 92,876,570 67,227,100 76,678,948 71,223,775 75,779,110 81,306,908

ODYNA
Advancing Opportunities in Energy Management in Ontario Industrial and Management Sector March 17, 2010
Project ID: 28070
Marbek 222 Somerset Street West, Suite 300Ottawa, Ontario K2P 2G3; Canada Tel: +1 (613) 523‐0784 Fax: +1 (613) 523‐0717 www.marbek.ca
Canadian Manufacturers and Exporters6725 Airport Road; Suite 200 Mississauga, Ontario L4V 1V2; Canada Tel: +1 (905) 672‐3466 Fax: +1 (905) 672‐1764 www.cme-mec.ca
Stantec Consulting Ltd. 845 Prospect Street Fredericton, New Brunswick, E3B 2T7; Canada Tel: +1 (506) 452‐7000 Fax: +1 (506) 452‐0112 www.stantec.com
ODYNA 168 Huron Street London, Ontario N6A 2J4; CanadaTel: +1 (416) 726‐3723 Fax: +1 (416) 776‐7812