cmaq and remsad- model performance and ongoing improvements brian timin, carey jang, pat dolwick,...
Post on 18-Dec-2015
216 views
TRANSCRIPT

CMAQ and REMSAD- Model Performance and Ongoing Improvements
Brian Timin, Carey Jang, Pat Dolwick, Norm Possiel, Tom Braverman
USEPA/OAQPS
December 3, 2002

Introduction
USEPA has performed an annual simulation of CMAQ and REMSAD for a 1996 base year
An operational evaluation has been completed for both models Performance evaluations have uncovered some weaknesses in
the model formulation and inventories OAQPS has identified a list of CMAQ model improvement
priorities

1996 National CMAQ and REMSAD- Model Setup
CMAQ- May 2001 release w/MEBI solver REMSAD- Version 7.01 Model Setup:
– Domain: CMAQ and REMSAD: 36km, 12 layers, ~38 m surface layer
– Emissions: CMAQ and REMSAD: 1996 NEI w/adjustments, processed via SMOKE
– Meteorology: 1996 MM5– Chemistry:
CMAQ: CB-IV chemical mechanism w/ fast solver (MEBI) REMSAD: micro-CB-IV chemical mechanism
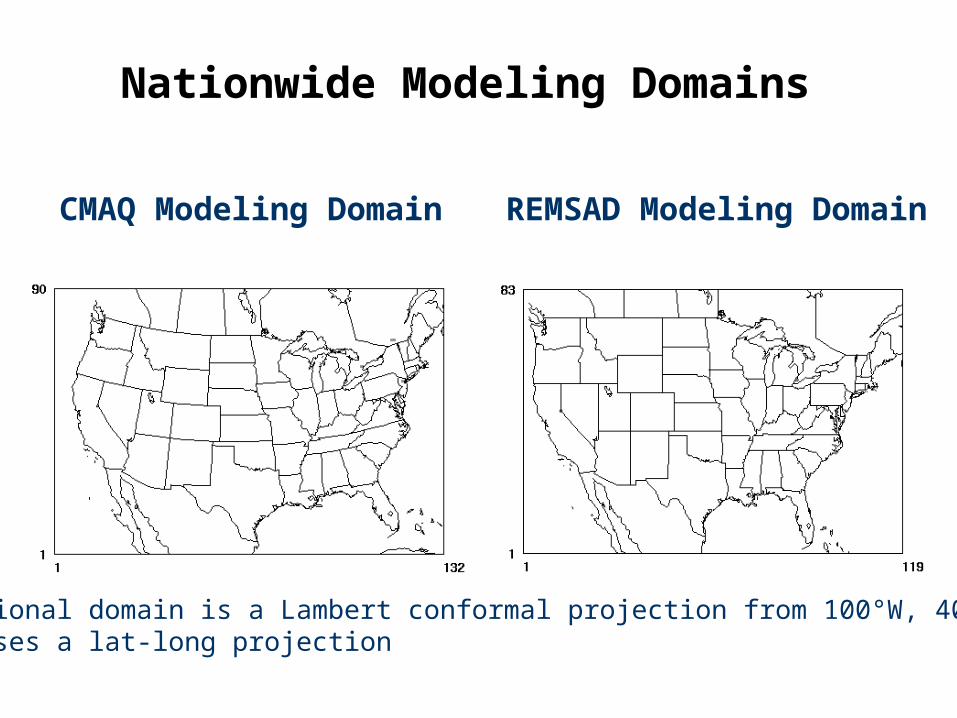
CMAQ Modeling Domain
Nationwide Modeling Domains
REMSAD Modeling Domain
CMAQ National domain is a Lambert conformal projection from 100°W, 40°NREMSAD uses a lat-long projection
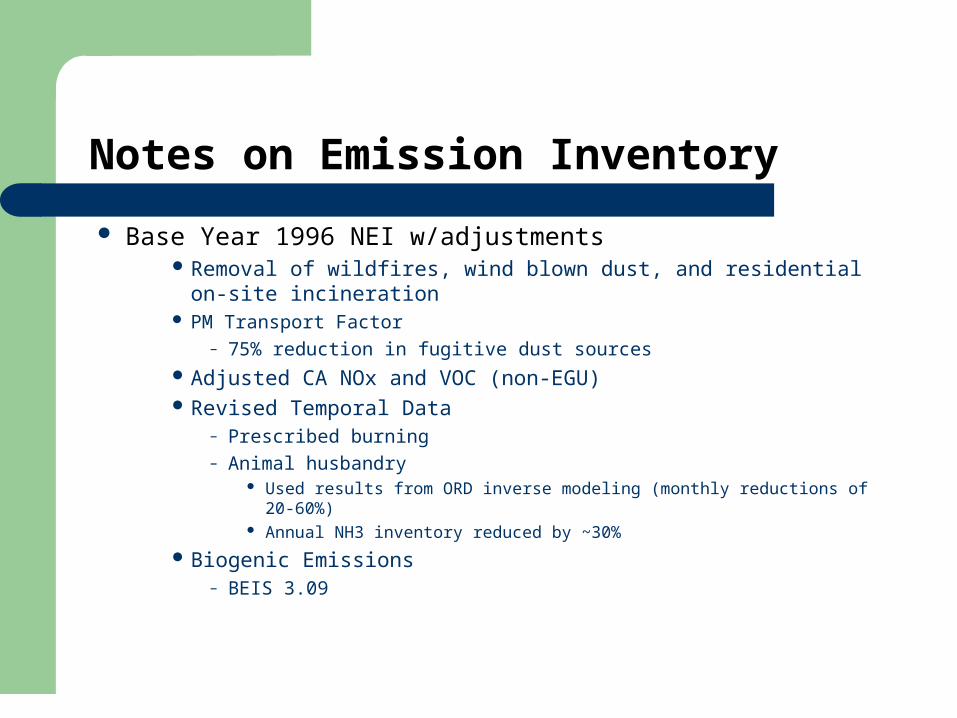
Notes on Emission Inventory
Base Year 1996 NEI w/adjustments Removal of wildfires, wind blown dust, and residential on-site
incineration PM Transport Factor
– 75% reduction in fugitive dust sources Adjusted CA NOx and VOC (non-EGU) Revised Temporal Data
– Prescribed burning– Animal husbandry
Used results from ORD inverse modeling (monthly reductions of 20-60%) Annual NH3 inventory reduced by ~30%
Biogenic Emissions– BEIS 3.09
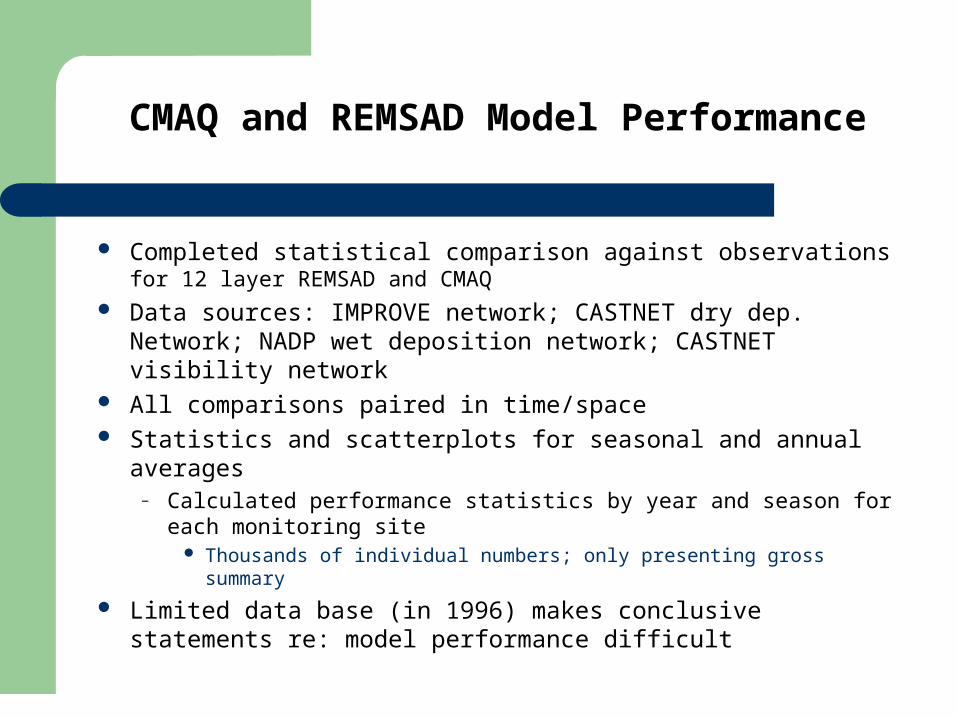
CMAQ and REMSAD Model Performance
Completed statistical comparison against observations for 12 layer REMSAD and CMAQ
Data sources: IMPROVE network; CASTNET dry dep. Network; NADP wet deposition network; CASTNET visibility network
All comparisons paired in time/space Statistics and scatterplots for seasonal and annual averages
– Calculated performance statistics by year and season for each monitoring site
Thousands of individual numbers; only presenting gross summary
Limited data base (in 1996) makes conclusive statements re: model performance difficult

IMPROVE Annual Average Performance Statistics Annual mean predicted/annual mean observed
IMPROVE PM Species National East WestPM2.5 -32% -15% -49%Sulfate Ion -19% -10% -39%Nitrate Ion 5% 82% -55%Elemental Carbon 1% 23% -20%Organic Aerosols -45% -42% -47%Soil/Other 38% 225% -18%
IMPROVE PM Species National East WestPM2.5 8% 3% 16%Sulfate Ion -2% 5% -19%Nitrate Ion 200% 262% 150%Elemental Carbon 14% -2% 28%Organic Aerosols 1% -30% 26%Soil/Other 80% 204% 43%
REMSAD
CMAQ

Seasonal Average Sulfate Performance
Seasonal Average Sulfate- IMPROVEAnnual REMSAD 1996 Modeling (nrd96)
0
2
4
6
8
10
12
14
0 2 4 6 8 10 12 14
Improve Observations (ug/m3)
RE
MS
AD
Pre
dic
tio
ns
(ug
/m3)
Summer
Fall
Spring
Winter
Seasonal Average Sulfate- IMPROVEAnnual CMAQ 1996 Modeling (nrd96_vae2)
0
2
4
6
8
10
12
14
0 2 4 6 8 10 12 14
Improve Observations (ug/m3)
CM
AQ
Pre
dic
tio
ns
(ug
/m3)
Summer
Fall
Spring
Winter
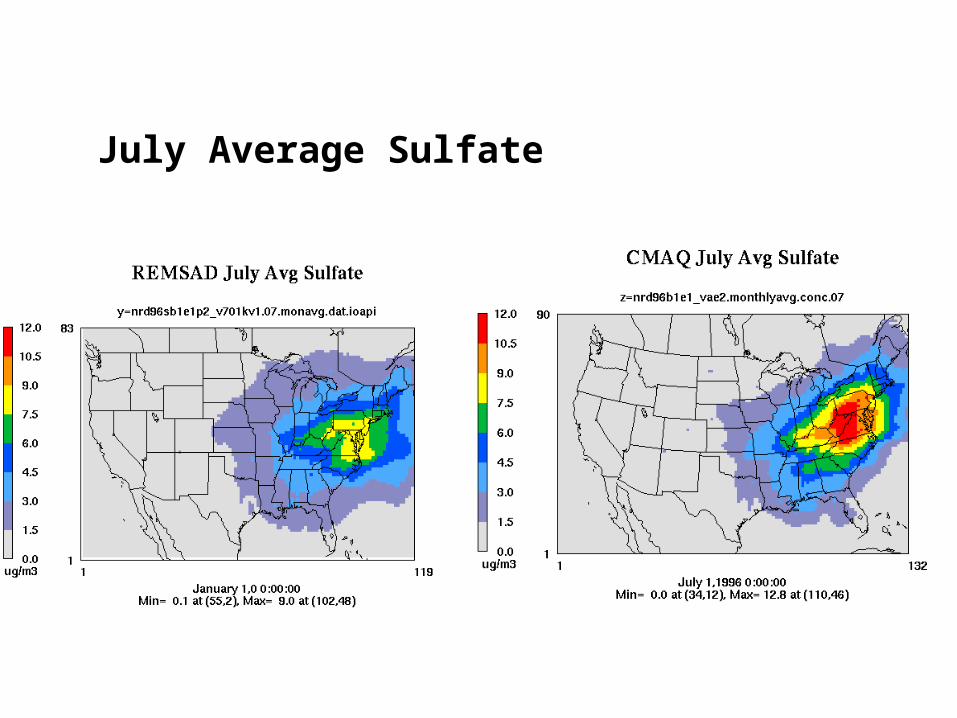
July Average Sulfate
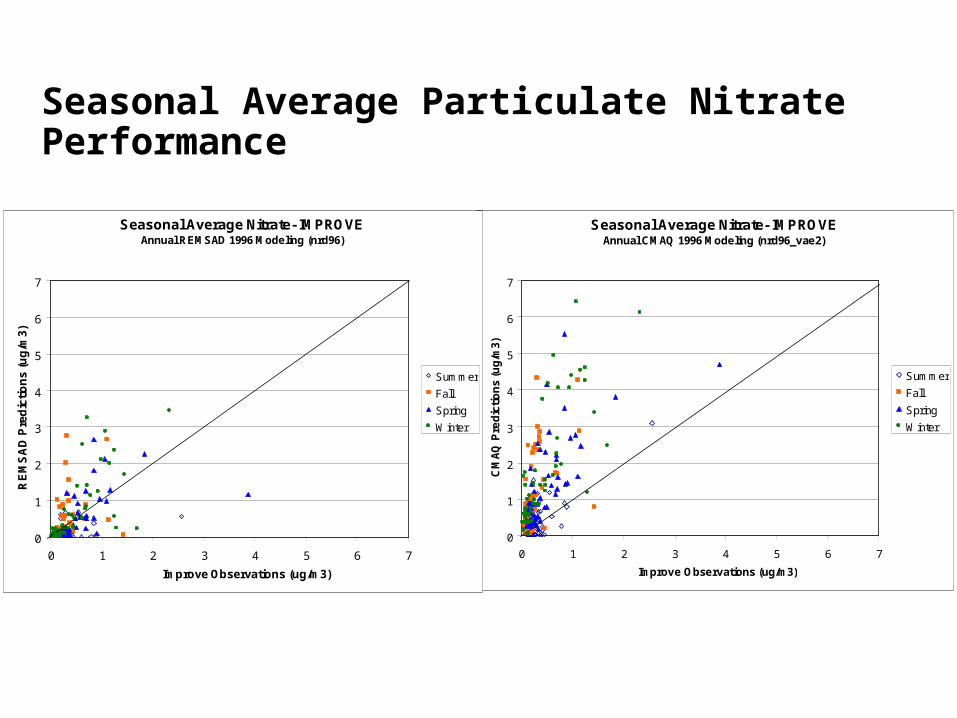
Seasonal Average Particulate Nitrate Performance
Seasonal Average Nitrate- IMPROVEAnnual CMAQ 1996 Modeling (nrd96_vae2)
0
1
2
3
4
5
6
7
0 1 2 3 4 5 6 7
Improve Observations (ug/m3)
CM
AQ
Pre
dic
tio
ns
(ug
/m3)
Summer
Fall
Spring
Winter
Seasonal Average Nitrate- IMPROVEAnnual REMSAD 1996 Modeling (nrd96)
0
1
2
3
4
5
6
7
0 1 2 3 4 5 6 7
Improve Observations (ug/m3)
RE
MS
AD
Pre
dic
tio
ns
(u
g/m
3)
Summer
Fall
Spring
Winter

January Average Particulate Nitrate

Seasonal Average Organic Aerosols Performance
Seasonal Average Organic Aerosols- IMPROVEAnnual REMSAD 1996 Modeling (nrd96)
0
1
2
3
4
5
6
7
0 1 2 3 4 5 6 7
Improve Observations (ug/m3)
RE
MS
AD
Pre
dic
tio
ns
(ug
/m3)
Summer
Fall
Spring
Winter
Seasonal Average Organic Aerosols- IMPROVEAnnual CMAQ 1996 Modeling (nrd96_vae2)
0
1
2
3
4
5
6
7
0 1 2 3 4 5 6 7
Improve Observations (ug/m3)
CM
AQ
Pre
dic
tio
ns
(ug
/m3)
Summer
Fall
Spring
Winter

July Average Organic Aerosols
AE2 Aerosol

Seasonal Average Crustal/Other PM2.5 Performance
Seasonal Average Soil/Other PM2.5- IMPROVEAnnual REMSAD 1996 Modeling (nrd96)
0
1
2
3
4
5
6
0 1 2 3 4 5 6
Improve Observations (ug/m3)
RE
MS
AD
Pre
dic
tio
ns
(ug
/m3)
Summer
Fall
Spring
Winter
Seasonal Average Soil/Other PM2.5- IMPROVEAnnual CMAQ 1996 Modeling (nrd96_vae2)
0
1
2
3
4
5
6
0 1 2 3 4 5 6
Improve Observations (ug/m3)
CM
AQ
Pre
dic
tio
ns
(ug
/m3)
Summer
Fall
Spring
Winter

July Average Crustal/Other PM2.5

Winter Average NitrateCMAQ 1996 vs. Observed 2001-2002 (IMPROVE and Urban Speciation)
Qualitative comparison of spatial patterns with more recent urban speciation data

Model Performance- Summary of Individual Species
CMAQ tends to predict higher concentrations than REMSAD; especially in the West
REMSAD slightly underpredicts sulfate in the East; CMAQ slightly overpredicts sulfate
Nitrate is overpredicted in the East– Total nitrate (particulate + nitric acid) is overpredicted in all seasons
Indicates an overestimation of nitric acid
REMSAD underpredicts organic carbon; CMAQ is relatively unbiased– Large uncertainty in the primary organic inventory (no wildfires), the organic
measurements, and the secondary organic chemistry– CMAQ is predicting much more biogenic SOA; but it is using an aerosol yield approach
(AE2) Much of the biogenic SOA in REMSAD is being partitioned into the gas phase

Model Performance- Individual Species
Elemental carbon is generally unbiased– Large uncertainty in measurement of elemental carbon (EC/OC split)
IMPROVE sites have very low EC concentrations
Soil/other concentrations are overpredicted– Inventory issues
Fugitive dust, unspeciated emissions from construction, paved roads, etc. in urban areas
NADP wet concentration comparisons– Sulfate
CMAQ overpredicts in the East; REMSAD underpredicts – Nitrate
Both models overpredict in the East; REMSAD underpredicts in the West– Ammonium
REMSAD underpredicts; CMAQ slightly overpredicts in the East

Next Steps
Additional evaluation techniques can be applied– Further comparisons to more recent urban speciation data– Closer look at individual sites, days, seasons, regions
Time series plots 20% best/worst days for visibility
Plan to model 2001 base year – Significantly more ambient data available
Continue to look at PM monitoring issues and how they affect model performance evaluation
– Uncertainty in nitrate observed data– EC/OC split– Monitoring network protocol differences


OAQPS CMAQ Model Improvement Priorities (non-inventory)
Winter nitrate overprediction (general nitric acid overprediction)– Chemistry– Dry deposition
SOA overpredictions (biogenic) with 2002 release– Emission factors– Aerosol yields– Gas/particle partitioning
Horizontal diffusion– Relatively low explicit diffusion
Run times– Decreased run time will allow more refined modeling of longer time periods

Model Improvement Priorities(modeling inventory)
Ammonia inventory– Currently using adjusted 1996 inventory based on ORD monthly inverse
modeling estimates– Need long term methodological improvements
Primary organic carbon– Need improved fire emissions– May be missing some organic sources
Primary semi-volatiles?
Primary unspeciated PM2.5 (PM-Other)– Modeled concentrations are grossly overestimated – Unspeciated fraction in certain speciation profiles is very high
Solid waste combustion (89% unspeciated) Coal combustion (85% unspeciated) Wood waste combustion (65% unspeciated)

Primary PM2.5 Emissions CMAQ- Partial Solution
The primary PM emissions in the 2001 CMAQ release were emitted in the wrong module
– Emitted in the AERO module – Should be emitted in the VDIFF module– Problem corrected in the 2002 release– Primary PM2.5 concentrations reduced by 5-35%

July Average “PM-Other” Concentrations
PM2.5-Other 2001 Release
Ratio of 2002/2001 Release

Winter Nitrate- CMAQ vs. REMSAD
Much of the difference in winter nitrate predictions between CMAQ and REMSAD can be traced to different implementations of the dry deposition routines
Nitrate concentrations were found to be sensitive to dry deposition of NH3, HNO3, and NO2
Improvements and adjustments are needed in both CMAQ and REMSAD, particularly in the areas of:
– Treatment of snowcover and freezing temperatures– Specification of land use and surface roughness – Treatment of soluble species when canopies are wet
January nitrate concentrations agreed to within ~25% after the dry deposition routines were made more similar to each other through a series of sensitivity runs (with REMSAD)

January Nitrate Comparison After Dry Deposition Sensitivities
Dry Deposition- CMAQ
CMAQ contains 2 dry deposition routines; RADMDRY and M3DRY
– M3DRY is a new routine Many improvements over the old Wesely routine (RADMDRY)
– MM5-PX (Pleim/Xiu land surface model) output is needed to take advantage of many of the improvements in M3DRY
– Most significant change is enhanced deposition velocities for soluble species when canopy is wet
M3DRY does not currently have a “temperature function” or a specific treatment for snow or frozen ground
– ORD is working on improvements to M3DRY Adding freezing temperature and snowcover treatment
– M3DRY may increase dry deposition of soluble species (e.g NH3)

Additional Issues- CMAQ 2002 Release
CMAQ 2002 release contains new AE3 aerosol mechanism– Includes ISORROPIA nitrate partitioning and SOA gas/particle partioning
Ran sensitivity test of 2002 release with AE3 for January and July 1996
– Particulate nitrate increases due to heterogeneous chemistry Gas phase N2O5 rate constant lowered Added a heterogeneous N2O5 reaction to aerosol mechanism
– N2O5---> HNO3 (particulate nitrate)
– Biogenic SOA increases by a factor of 3 to 4 AE3 biogenic SOA (July) is too high in parts of the country (especially the
West)– Aerosol yields increased by a factor of 4 (in new release)
– SOA partitioning is dominated by particle phase

AE2 vs AE3January Average Particulate Nitrate
CMAQ 2001- AE2 CMAQ 2002- AE3
AE3 includes both effect of ISORROPIA and heterogeneous chemistry

AE2 vs AE3July Average Biogenic SOA
CMAQ 2001- AE2 CMAQ 2002- AE3

SOA Gas/Particle PartitioningJuly Average % Biogenic SOA in Particle Phase

Horizontal Diffusion
Kh in CMAQ may be too low, especially at 36km resolution– CMAQ Kh is indirectly proportional to grid cell size– REMSAD, UAM-V, and CAMx Kh is directly proportional to grid cell size
At 36km resolution the Kh in CAMx is ~17,000 m2/sec and the Kh in CMAQ is ~25 m2/sec (both using PPM advection)
Which methodology is more scientifically correct?

Summary of OAQPS CMAQ Model Improvement Priorities (non-inventory)
Winter nitrate overprediction (general nitric acid overprediction)– Gas phase chemistry (daytime and nighttime)
Daytime NO2 + OH rate constant– SAPRC– CB-IV 2002
Nighttime– N2O5 gas phase rate constant and heterogeneous reaction
– Dry deposition (M3DRY routine) Snowcover and freezing temperatures Wet canopy
AE3 SOA overpredictions (biogenic)– Terpene emission factors– Aerosol yields– Gas/particle partitioning

Summary of OAQPS CMAQ Model Improvement Priorities (non-inventory)
Horizontal diffusion– Is current methodology OK?– Does CMAQ need more explicit diffusion when using “accurate”
advection schemes (PPM and Bott)? Run times
– Can CMAQ be made to run faster?– 2001 release is 3 times slower than REMSAD– 2002 release (with CB-IV) is almost 4 times slower than REMSAD
SAPRC will slow it down even more
OAQPS is working with ORD to address all of the above issues