clydeplan green network background report
DESCRIPTION
Strategic Development Plan Main Issues Report Background Report Green Network PrioritiesTRANSCRIPT

Strategic Development PlanMain Issues Report - Background Report January 2015
Green Network Priorities

STRATEGIC DEVELOPMENT PLAN
MAIN ISSUES REPORT
BACKGROUND REPORT 10
GREEN NETWORK PRIORITIES
January 2015


Contents
1 Background .................................................................................................................... 1
2 Introduction to the Methodology ..................................................................................... 1
3 Data Layer Identification ................................................................................................ 3
3.1 Vacant and Derelict Land ........................................................................................ 4
3.2 Built Development ................................................................................................... 5
3.3 Underperforming Greenspace ................................................................................. 5
3.4 Health & Wellbeing ................................................................................................. 6
3.5 Climate Change Adaptation .................................................................................... 7
3.6 Access to Greenspace ............................................................................................ 9
3.7 Habitat Connectivity .............................................................................................. 10
4 Data Preparation .......................................................................................................... 13
4.1 Data buffering ....................................................................................................... 13
4.2 Data weighting ...................................................................................................... 13
4.3 Data layer creation ................................................................................................ 14
5 GIS Analysis to derive Opportunities Maps .................................................................. 19
5.1 The Green Network Opportunities Maps ............................................................... 20
6 Identification of Strategic Delivery Areas ...................................................................... 24
7 Appendices .................................................................................................................. 28


1
1 Background
The planning process is a primary mechanism through which the Green Network should be
delivered. It is therefore critical that strategic planners have robust and defensible evidence
for the decisions they make in where effort and resources are targeted. The Green Network
Opportunities Mapping analysis undertaken for the emerging Clydeplan Strategic
Development Plan (Clydeplan) provides that regional, strategic decision support evidence
base
The Green Network Opportunities Mapping approach employs Geographical Information
Systems (GIS) based analysis which identifies correlations and adjacencies between a
range of Green Network related data. Geographical locations where a strong correlation
exists are taken to be areas where the opportunity exists to deliver multiple Green Network
benefits through the prioritisation of delivery.
The analysis for Clydeplan builds on the methodology developed to identify Green Network
Priorities for the first Glasgow and Clyde Valley (GCV) Strategic Development Plan (SDP1)
and uses new and improved data1.
The Opportunities Mapping methodology used to identify the spatial priorities in SDP1 was
well received and subsequently applied at a local authority level across the GCV to identify
local priorities for Local Development Plans, Supplementary Guidance and Action Plans.
2 Introduction to the Methodology
Clydeplan Main Issues Report (MIR) identifies again the Green Network as a key component
of a successful city region. Since the publication of SDP1 the GCV Green Network
Partnership (the Partnership) has created or acquired new and improved data, and thinking
on the role of the Green Network across a range of agendas has developed. Table 1 below
compares the data layers used to represent Green Network priorities and opportunities for
Clydeplan with the data used in the first GCV Strategic Development Plan (SDP1).
The identification of Green Network spatial priorities in Clydeplan MIR employs the same
GIS based analysis but with a refined methodology and draws upon improved data where
this is available and includes new datasets on climate change, health and vacant and
derelict land, meaning that now seven data layers have been used in the analysis for
Clydeplan.
The methodology uses Geographical Information Systems (GIS) based analysis to identify
locations across the GCV where there is correlation between a range of spatial datasets
relevant to the Green Network. Areas where there is significant correlation are taken to
represent the opportunity to derive multiple benefits through delivery of the Green Network.
The methodology has four steps.
1. Data Layer identification
2. Data preparation
1 The full methodology employed in SDP1 is set out in the GCV SDP Background Report 08: Green
Network Spatial Priorities

2
3. Analysis of opportunities against priorities to derive Opportunities Maps
4. Combine Opportunities Maps to identify Strategic Delivery Areas
The refined methodology provides Opportunities Maps for four Green Network Priorities:
Health & Wellbeing
Climate Charge Adaptation
Access to Greenspace
Habitat Connectivity.
The four Opportunities maps were combined to identify regionally significant opportunities for
Green Network delivery (Strategic Delivery Areas). Sixteen Strategic Delivery Areas have
been identified.
Table 1: A comparison of data layers used in the Clydeplan analysis compared to the SDP1 analysis.
Data layer Clydeplan SDP1
Land Use Opportunities
Vacant & Derelict Land In-house produced dataset based on 2012/13 national vacant and derelict land data which identifies sites with potential for naturalisation or creation of either temporary or permanent greenspace.
Not included
Built Development Flagship Regeneration Areas, Community Growth Areas, Strategic Economic Investment Locations, Strategic Centres Development Opportunities
Flagship Regeneration Areas and Community Growth Areas
Underperforming Greenspace
Interpretation of local authority open space qualitative data where it exists and the SDP1 approach where it doesn’t
Interpretation of PAN 65 map to infer which spaces could perform better
Green Network Delivery Priorities
Health & Wellbeing In-house produced dataset based on hospital admissions for heart disease and strokes and prescription levels for depression, anxiety and psychosis at a datazone level.
SIMD 15% most deprived datazones
Climate Change Adaptation In-house produced dataset incorporating priority areas for surface water flooding, overheating and air quality.
Not included
Access to Greenspace In-house network analysis to identify areas out with a 400m walking network of multifunctional, useable open spaces
Analysis of access deficits to open space by Forest Research
Habitat Connectivity SNH’s priority habitat creation areas derived from the Integrated Habitat Network (IHN) model
Analysis of IHN model by Forest Research

3
3 Data Layer Identification
Since the Opportunities Mapping approach was developed to identify Green Network
priorities for SDP1 the extent and quality of Green Network related data has improved.
There has also been a growing recognition across a number of sectors of the role the Green
Network can play in delivering social, health, environmental and economic benefit. The
analysis applied to identify Green Network priorities for Clydeplan has therefore drawn on a
wider range of data, which is also of better quality.
The way in which the Partnership defines opportunities and priorities associated with the
Green Network has also developed. Figure 1 below illustrates the three land use
opportunities data layers and the four Green Network delivery priorities data layers used in
the Opportunities Mapping analysis.
Figure 1: The seven data layers used in the Opportunities Mapping analysis.
For the Green Network analysis which underpins the Clydeplan analysis these are defined
as:
Land use opportunities (Opportunities) – locations where the opportunity exists to deliver
or enhance the Green Network through land use change:
Vacant and Derelict Land: V&DL registered land with potential to add to the Green Network
Built Development: regionally significant new built development and areas of regeneration
Underperforming Greenspace: Greenspace areas with potential for significant improvement

4
Green Network delivery priorities (Priorities) – locations where the expansion or
enhancement of the Green Network has the potential to deliver the greatest benefit for a
range of outcomes:
Health & Wellbeing: providing active spaces in areas characterised by low activity levels
Climate Change Adaptation: providing resilience to the impacts of climate change
Access to Greenspace: addressing access to open space deficits
Habitat Connectivity: addressing fragmentation of ecosystems
The paragraphs below explain the purpose, rationale and data sources for each data layer
used in the Opportunities Mapping analysis.
3.1 Vacant and Derelict Land
3.1.1 Purpose
The purpose of this data layer is to identify land which is on the Scottish Vacant and Derelict
Land register that has the potential to become a greenspace, temporary greenspace or open
mosaic habitat within the GCV Green Network.
3.1.2 Rationale
The third National Planning Framework (NPF3)2 has identified that one of the priorities for
the lead organisations in the Central Scotland Green Network (CSGN) should be
“addressing vacant and derelict land”. NPF3 also states:
“Well-designed green infrastructure can support regeneration efforts within our towns and
cities, and improved attractiveness and environmental performance can act as a catalyst for
economic investment. Temporary uses for vacant and derelict land, for example for
community growing or supporting biodiversity, can also help to attract investment in specific
sites or wider areas. Whilst re-use of vacant land remains a priority, in some cases greening
initiatives could be the best permanent solutions for sites where built development is
unrealistic for cost or other reasons”.
According the Scottish Vacant and Derelict Land Survey 2012, there is around 4,500
hectares of vacant and derelict land (V&DL) in the GCV region. A recent study completed by
the Partnership on behalf of the Central Scotland Green Network Trust3 identified the extent
of V&DL sites, within the CSGN area, with potential to become new permanent
greenspaces, temporary greenspaces or temporary biodiversity habitats within a wider
Green Network.
3.1.3 Data sources
The primary data source was:
The Scottish Vacant and Derelict Land Survey (2011 and 2012)
This was supplemented by information extracted from the following report:
Open mosaic habitats on previously developed land: survey and recommendations for habitat planning and management in Scotland (commissioned by SNH and written by Buglife, 2013)
2 http://www.scotland.gov.uk/Publications/2014/06/3539
3 Hislop M., Corbett A. (2014), ‘Costing the CSGN – Capital cost estimates for the major components
of the CSGN’, The CSGN Trust and the GCV Green Network Partnership
5
3.2 Built Development
3.2.1 Purpose
The purpose of this data layer is to identify regionally significant areas where regeneration
programmes within existing urban areas or planned new development on greenfield sites will
provide an opportunity to integrate green network delivery within plans for built development.
3.2.2 Rationale
Scottish Planning Policy (SPP)4 states:
“Planning should direct the right development to the right place. This requires spatial
strategies within development plans to promote a sustainable pattern of development
appropriate to the area.”
SPP goes on to state that one of the policy principles that should guide decision making
should be the consideration of:
“…whether the permanent, temporary or advanced greening of all or some of a site could
make a valuable contribution to green and open space networks, particularly where it is
unlikely to be developed for some time, or is unsuitable for development due to its location or
viability issues.”
In relation to green infrastructure as part of development proposals, SPP states:
“Planning should protect, enhance and promote green infrastructure, including open space
and green networks, as an integral component of successful placemaking. The planning
system should consider green infrastructure as an integral element of places from the outset
of the planning process.”
3.2.3 Data sources
The data was sourced from the GCV Strategic Development Planning Authority (SDPA).
The data was collated by the SDPA in partnership with GCV local authorities and the
Scottish Government.
3.3 Underperforming Greenspace
3.3.1 Purpose
The purpose of this data layer is to identify existing open space which is currently
underperforming and has a significant potential to deliver greater public benefit in relation to
the outcomes of the GCV Green Network.
3.3.2 Rationale
SPP states that local development plans should:
“identify and protect open space identified in the open space audit and strategy
as…capable of being brought into use to meet local needs.”
“seek to enhance existing…green infrastructure,…through a design-led approach,
applying standards which facilitate appropriate provision, addressing deficits or
surpluses within the local context.”
Planning Advice Note 65 (PAN65) ‘Planning and Open Space’5 states:
4 http://www.scotland.gov.uk/Publications/2014/06/5823

6
“Development plans should safeguard important open spaces from development in the long
term and identify spaces that require significant improvement.”
A recent study completed by the Partnership on behalf of the Central Scotland Green
Network Trust6 estimated that approximately 2000 hectares of greenspace within the GCV
region is failing an acceptable quality standard.
3.3.3 Data sources
Two data sources were used to assess the level of underperforming greenspace. These
were:
The qualitative component of local authority Open Space Audits were the primary data source
Where no qualitative Open Space Audit was available greenspace scotland’s Greenspace Map (2011) was used.
3.4 Health & Wellbeing
3.4.1 Purpose
The purpose of this data layer is to identify neighbourhoods where the resident community
displays high levels of health conditions indicative of inactivity.
3.4.2 Rationale
SPP states that one of the principles that should guide policies and decisions is:
“improving health and well-being by offering opportunities for social interaction and physical
activity.”
The Chief Medical Officer’s Annual Report for 20117 states:
“Inactivity accounts for at least 2,500 deaths each year in Scotland… Increased physical
fitness would reduce premature death by 30% and can help prevent and treat more than 20
chronic diseases. Getting Scotland fit would increase life expectancy by almost a year.
Furthermore, physical activity offsets much of the health problems of obesity - releasing cash
and improving health outcomes at scale.”
The report goes on to say that increased physical activity levels (around 30 minutes of brisk
walking, 5 days per week) can reduce the risk of many illnesses, including: heart attack and
stroke (20 -35% reduction); diabetes (30 – 40% reduction); and, depression and dementia
(20 – 30% reduction).
Recent research undertaken by the partner organisations in the GreenHealth Project 8
reported that:
“international studies have found that green space levels and use are associated with
physical and/or mental health benefits.”
5 http://www.scotland.gov.uk/Publications/2008/05/30100623/0
6 Hislop M., Corbett A. (2014), ‘Costing the CSGN – Capital cost estimates for the major components
of the CSGN’, The CSGN Trust and the GCV Green Network Partnership 7 http://www.scotland.gov.uk/Publications/2012/12/7521
8 http://www.hutton.ac.uk/sites/default/files/files/projects/GreenHealth-InformationNote7-Contribution-
of-green-and-open-space-in-public-health-and-wellbeing.pdf
7
The GreenHealth Project team’s analysis of Scottish statistics revealed that:
“more green space in urban neighbourhoods was associated with a lower risk of mortality for
working-age men in the poorest two income deprivation quartiles; those resident in the
greenest urban areas were 16% less likely to die than those in the least green urban
areas….Such an association is absent for women of all income groups…, and is likely linked
to lower green space use.”
The team’s analysis of the Scottish urban population found that socio-economic inequalities
in cardiovascular and respiratory mortality were narrower in urban areas with relatively more
green space than in those with relatively less, though the associations were not statistically
significant9.
The team’s analysis of Scottish Heath Survey data found that:
“those who used woods and forests for physical activity enjoyed some mental health
benefits. In particular, they had a lower risk of poor mental health than non-users of these
types of green spaces, whilst regular use of woods and forests appeared to be more
protective of mental health than exercising in the gym or streets.”
The team also looked at the relationship between an objective measure of stress (salivary
cortisol) and levels of green space and found that higher green-space levels in deprived
urban neighbourhoods were associated with lower stress levels amongst men and women.
3.4.3 Data sources
The physical health components of the data were downloaded from the Scottish
Neighbourhood Statistics web site. These were:
Number of hospital admissions with a main diagnosis of Coronary Heart Disease at a datazone level (2011)
Number of hospital admissions with a main diagnosis of Cerebrovascular Disease at a datazone level (2011)
The mental health and well-being component of the data was extracted from the Scottish
Indices of Multiple Deprivation. This was:
Estimated proportion of population being prescribed drugs for anxiety, depression or psychosis at a datazone level (2010)
All three data components were then joined to a base datazone shapefile for the GCV to
allow spatial representation of the data.
3.5 Climate Change Adaptation
3.5.1 Purpose
The purpose of this data layer is to identify areas that are likely to be affected by predicted
climatic changes to the region (flooding, overheating and air pollution) and where adaptive
measure may be necessary.
9 Mitchell R., Popham F. (2008) Effect of exposure to natural environment on health inequalities: an
observational population study. The Lancet 72(9650): 1655-1660

8
3.5.2 Rationale
In 2007, all 32 Scottish local authorities showed their commitment to acting on climate
change by signing Scotland's Climate Change Declaration. This represented a voluntary
commitment to take action and report annually on work to reduce emissions and adapt to the
unavoidable impacts of climate change.
The duties for public bodies contained in Part 4 of the Climate Change (Scotland) Act 2009
require that:
“a public body must, in exercising its functions, act in the way best calculated to contribute to
the delivery of emissions reduction targets (known as ‘mitigation’), in the way best calculated
to help deliver any statutory climate change adaptation programme, and in a way that it
considers is most sustainable”
Scottish Planning Policy states that one of the principles that should guide policies and
decisions is:
“supporting climate change mitigation and adaptation including taking account of flood risk.”
The Scottish Climate Change Adaptation Programme, ‘Climate Ready Scotland’10 states
that:
“climate change and extreme weather events have already impacted many aspects of our
natural environment and our society, including buildings and property, health, agriculture,
forestry, transport, water resources and energy demand.”
“Planning for, and managing the risks posed by the impacts of climate change supports the
Scottish Government purpose of increasing sustainable economic growth.”
“The most obvious reason for taking action to prepare and adapt to the changing climate is
to minimise the disruption or damage – and associated cost – caused by the changing
climate.”
The European Environment Agency’s report ‘Urban adaptation to climate change in
Europe’11 states:
“Adaptation relates strongly to using and expanding green infrastructure such as parks,
forests, wetlands, green walls and roofs, wherever feasible and sustainable. Such
infrastructure serves to provide a cooling effect on cities as well as playing a role in
managing floods. Measures which combine grey and green infrastructures have the potential
to deliver robust and flexible solutions over a long period.”
3.5.3 Data sources
Two of the data components were created by and sourced from SEPA. These were:
Low probability (1:1000 year or 1:200 + climate change) surface water flooding extents (2013)
Air Quality Management Areas (2014)
10
http://www.scotland.gov.uk/Publications/2014/05/4669/downloads 11
http://www.eea.europa.eu/publications/urban-adaptation-to-climate-change

9
The third data component was created in-house based on work done for the Partnership by
Glasgow Caledonian University. The base data was:
Urban overheating priority areas (2014)
3.6 Access to Greenspace
3.6.1 Purpose
The purpose of this data layer is to identify locations where the resident population lives
more than a five minute walk to their local greenspace and can therefore be described as
deficient in greenspace provision.
3.6.2 Rationale
The ‘Scotland’s People and Nature Survey 2013/14’ 12 reveals that Scotland’s urban
residents value greenspaces as attractive places where children can play, where it is safe to
be physically active, and where it is possible to relax and unwind. However, the same survey
reveals that 45% of Scotland’s urban residents live more than a five minute walk from their
local greenspace.
Accessibility to greenspace is key component of the standards framework developed by
SNH and greenspace scotland and published as guidance in ‘Developing Open Space
Standards’13. In the guidance it states:
“The accessibility standard is: Everyone will live within a 5 minute walk of a publicly usable
open space of at least 0.2 hectares in size.”
The guidance goes on to justify the accessibility standard:
“International research into the impacts of greenspace on health and on wider quality of life
shows that having greenspace within a 5 minute walk of home is a strong indicator for health
and quality of life benefits…. Generally, in urban design, a 5 minute walk is considered to
equate to a distance of 400 metres ‘door to space’.”
The guidance also says:
“GIS software can assess walking distance using streets and paths to give a more accurate
assessment of accessibility on the basis of ‘network analysis’.”
To develop this data layer we have used GIS network analysis to assess walking distance to
greenspace from residential addresses to identify places where greenspace provision falls
below the suggested accessibility standard.
3.6.3 Data sources
The data was created in-house using GIS network analysis. The analysis used two sources
for the greenspace to which access was being assessed. These were:
The quantitative component of local authority Open Space Audits, including access point information, were the primary data sources
Where no Open Space Audit was available greenspace scotland’s Greenspace Map (2011) was used.
12
http://www.snh.gov.uk/docs/A1471713.pdf 13
http://www.greenspacescotland.org.uk/1greenspace-standards.aspx

10
The network analysis was based on Ordinance Survey’s Integrated Transport Network
dataset (2013)
3.7 Habitat Connectivity
3.7.1 Purpose
The purpose of this data layer is to identify those locations where habitat creation would
deliver the greatest return in terms of reduced habitat fragmentation through new habitat
connectivity.
3.7.2 Rationale
Planning authorities, and all public bodies, have a duty under the Nature Conservation
(Scotland) Act 2004 to further the conservation of biodiversity.
Scottish Government’s ‘2020 Challenge for Scotland’s Biodiversity’ 14 explains the
relationship between biodiversity and ecosystems:
“Biodiversity is all of life: animals, plants, fungi and microorganisms and their interactions
with their environment. Together, these form living systems, called ecosystems, which
sustain nature and upon which our own survival depends.”
It then states that Scotland’s ecosystems are widely degraded:
“ecosystems across Scotland are not meeting their full potential. It is not that they are close
to collapse; rather the evidence suggests degradation across wide areas and so reducing
their value.”
It goes on to say that ‘fragmentation of habitats’ is one of the extensive issues that have led
to the degradation of ecosystems, and that the Government want to reverse the trend by
pursuing the Aichi target of restoring 15% of degraded ecosystems by 2020.
SNH15 describe ‘habitat fragmentation’ as:
“the process where larger areas of habitat are split apart into smaller, separated areas.”
The European Environment Agency’s report ‘Landscape Fragmentation in Europe’ 16
describes the ongoing process of fragmentation and its relationship to ecological
connectivity:
“Despite many improvements in legislation to better protect biodiversity, reduce pollution,
and improve water quality, urban sprawl is still increasing and the construction of new
transport infrastructure is continuing at a rapid pace. As a consequence, fragmentation of
landscapes is rising and the remaining ecological network provides less and less
connectivity.”
The EU 2020 Biodiversity Strategy17 states why habitat fragmentation is an important issue,
not only because of its impacts on biodiversity, but because of the impact on ecosystem
services upon which we all rely:
14
http://www.scotland.gov.uk/Publications/2013/06/5538/downloads 15
http://www.snh.gov.uk/land-and-sea/managing-the-land/spatial-ecology/why-do-we-need-networks/ 16
http://www.eea.europa.eu/publications/landscape-fragmentation-in-europe
11
“The EU is one of the most fragmented continents in the world. Thirty percent of the land is
moderately to highly fragmented due to urban sprawl, infrastructure developments and
changing land uses. This not only affects biodiversity but also undermines the many services
that healthy ecosystems provide society, such as a clean water supply, protection against
floods and erosion etc.”
The EU 2020 Biodiversity Strategy goes on to extol the benefits of green infrastructure as
part of the solution to fragmentation:
“Building a green infrastructure can help overcome many of these challenges. It can
reconnect fragmented natural areas and improve their functional connectivity within the
wider countryside. It can also encourage a better use of nature-based approaches to tackle
climate change and to improve resource efficiency, for instance through more integrated
spatial planning and the development of multifunctional zones that are capable of delivering
benefits to both biodiversity, the land user, and to society at large.”
3.7.3 Data sources
The data was extracted from the Integrated Habitat Network model data (2013) downloaded
from SNH website. The data set priorities for five habitat types. These were:
Broadleaved woodland
Neutral grassland
Acid grassland
Fen, marsh and swamp
Heathland
17
http://ec.europa.eu/environment/nature/info/pubs/docs/brochures/2020%20Biod%20brochure%20final%20lowres.pdf

12
13
4 Data Preparation
4.1 Data buffering
The premise on which the GIS analysis is based is the identification of geographical
locations where there is correlation between the data layers. In some cases the relationship
between the data layers is such that this is best represented through direct correlation i.e.
they both occupy the same area of land. For example, this would be the case between the
habitat connectivity priorities and underperforming open space where habitat creation could
be part of the open space enhancement.
In other cases the relationship is defined more by proximity and adjacency than by direct
correlation. For example, the role that the Green Network can play in reducing surface water
flooding could be through the interception of water and temporarily storing it away from the
area which actually floods. Similarly, the Green Network delivered through a Community
Growth Area has the potential to provide benefits not only within the red line boundary of the
development but also to adjacent communities, perhaps by addressing an existing open
space deficit.
In the two cases cited above the core datasets for climate change adaptation and new built
development, were buffered to reflect their “sphere of influence” in the analysis. The
rationale for the buffer thresholds used is set out below. Note - The opportunities mapping
analysis is based on 100m x 100m cells and therefore any buffering must be created in
100m increments.
Climate change adaptation – For climate change adaptation in urban areas, where the
primary benefit is likely to be flood reduction, the density of the urban form combined with
complex topography means that a relatively tight buffer of 100m metres was chosen. There
may be cases where the Green Network can provide adaptive capacity at greater distances
but it was felt that the greatest benefits were likely to be in closer proximity to the area at risk
of flooding.
New built development – Large scale new development which abuts existing urban areas
can, with considered masterplanning and design, deliver benefits to existing communities as
well as to new residents. Given the distance threshold of 400m for access to greenspace
has been used in other parts of the analysis (see 2.1.2 above for rationale), a 400m buffer
was applied to the boundaries of the new built development data. This reflects the potential
for adjacent communities to access appropriately located greenspace within new
development.
4.2 Data weighting
To reflect the relative potential of the seven data layers to deliver on their associated Green
Network benefits, each was given a high or medium weighting (see Table 2 below). The
actual numbers attributed to the data layers don’t relate to a calculable value and are used
only to demonstrate relative importance.
In the first run of the analysis all data was weighted as either 2 or 1, however, when areas
identified as high scoring were examined more closely some were revealed to consist only of
opportunities with no priority data. Given the aim of the analysis was to identify correlations
between the four priorities and the three opportunities an alternative approach was required
14
to ensure each run of the analysis contained a priority and high scores were not based solely
on coincidence of opportunities.
A solution was found by applying even weightings to the opportunities and odd weightings to
the priorities. In this way high scoring areas with odd scores could be certain to contain a
priority and only these were considered on the final outputs.
Table 2: Weighting of the data layers
Opportunities Component Weighting Rationale
Vacant & Derelict Land
Creation of permanent greenspace on VDL in urban areas
4
The removal of vacant and derelict land from the register to create new permanent greenspace in urban areas has the potential to deliver significant Green Network benefits
Naturalisation of rural VDL
2 Naturalisation of rural VDL and the creation temporary greenspace on VDL have the potential to deliver some Green Network benefit but of less significance than permanent, urban greenspace
Creation of temporary greenspace on VDL
2
Built Development
Flagship Regeneration Areas (FRA)
4
FRAs and CGAs are locations of major land use change and represent a significant opportunity for delivery of the Green Network.
Community Growth Areas (CGA)
4
Strategic Economic Investment Locations (SEIL)
2 SEILs and SCDO may offer some opportunity but not on the scale of FRAs and CGAs.
Strategic Centres Development Opportunities (SCDO)
2
Priorities Component Weighting Rationale
Health & Wellbeing
Mental health 3 Research shows a stronger link between access to open space and mental well-being than with improvements to physical health.
Heart disease and stroke
1
Climate Change Adaptation
Flooding 3 The Green Network can play a role in off-setting the effects of overheating and in improving air quality however the greatest adaption potential is in reducing surface water flooding.
Overheating 1
Air Quality 1
Access to Greenspace
All priority areas 3 All communities which don’t have access to good quality greenspace are of equal importance
Habitat Connectivity
All habitats 3 All habitats and habitat networks are of equal importance
4.3 Data layer creation
After weighting and buffering the data as detailed above, the layers were converted from
feature classes to raster format at a 100m grid resolution to allow the analysis to be applied.
15
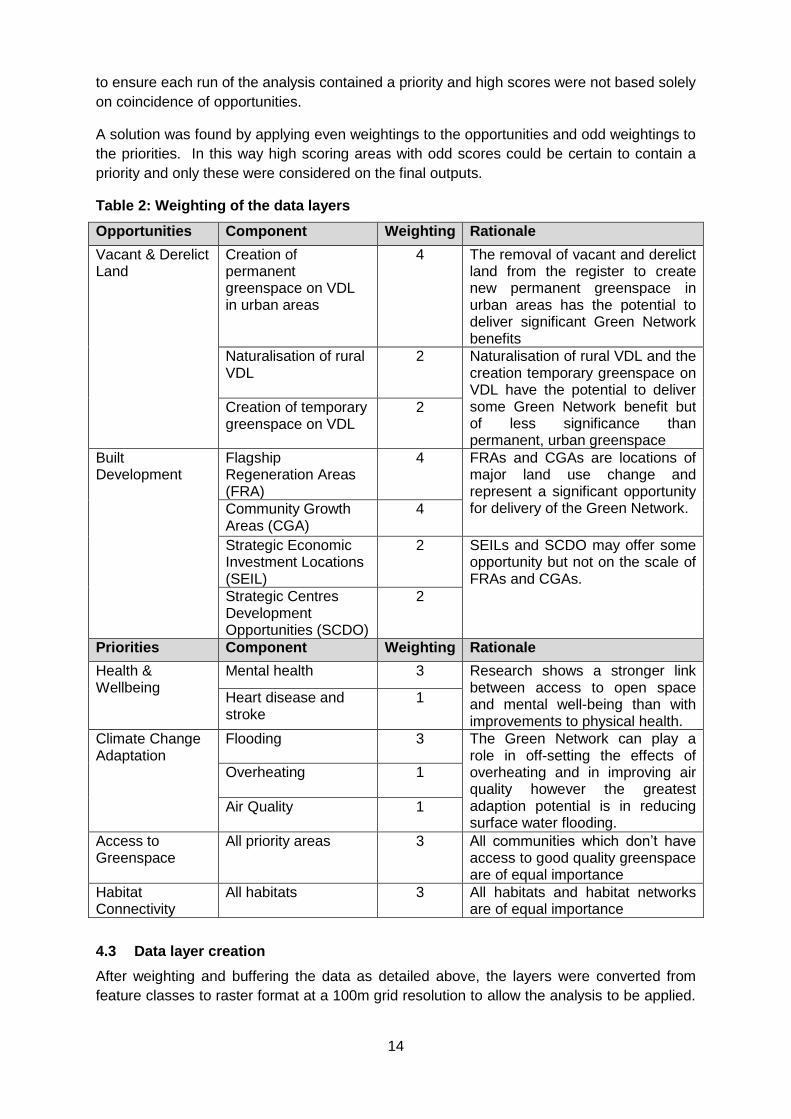
Each of the final data layers from the data preparation process, which were used in the final
analysis is shown below.
Figure 2: Vacant and Derelict Land opportunities with high and medium weighting
16
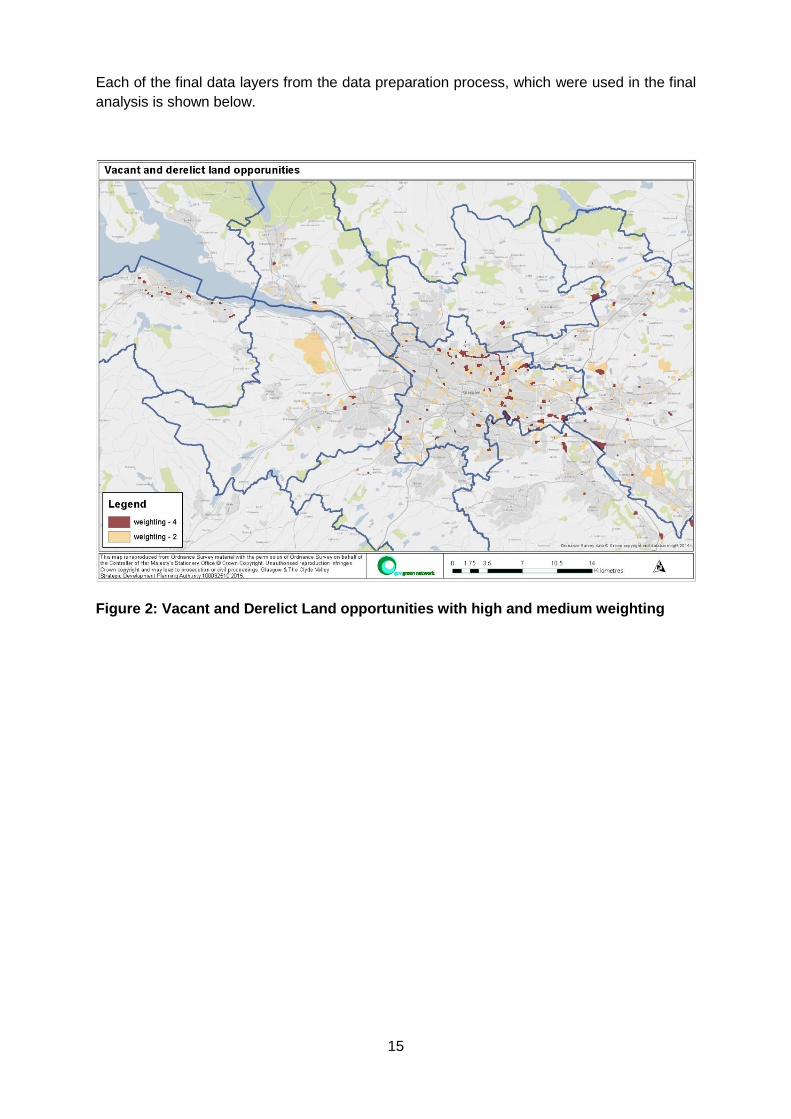
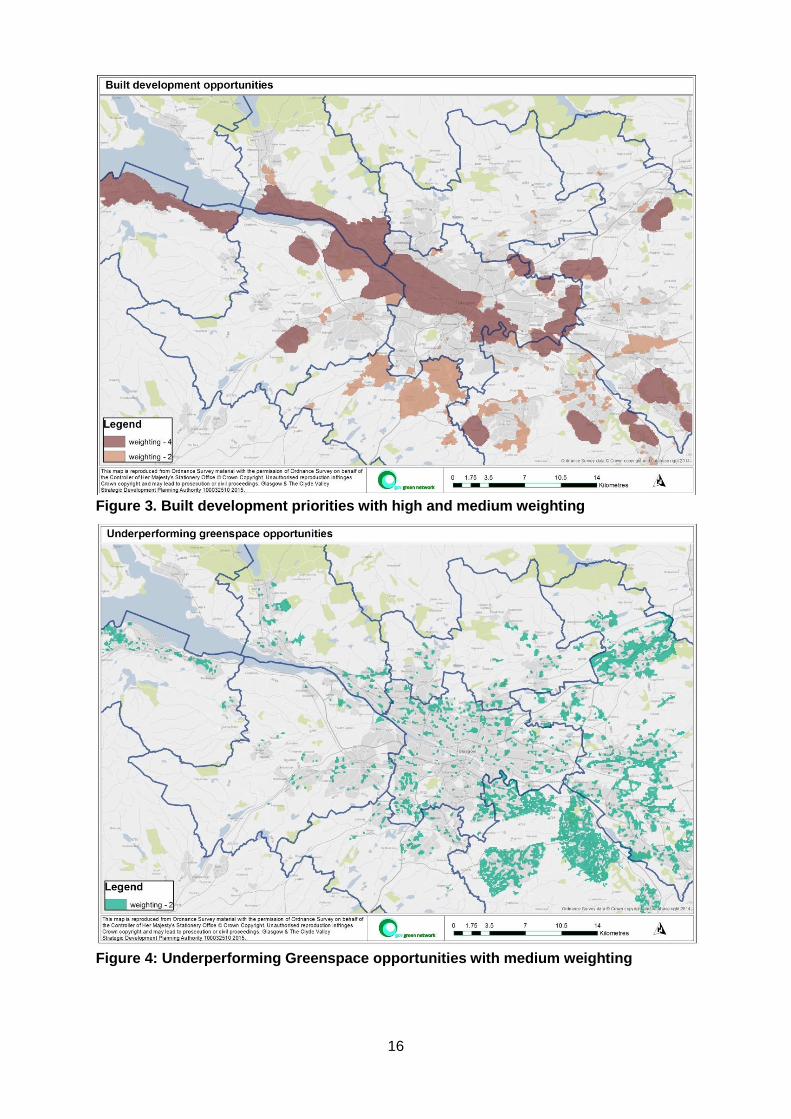
Figure 3. Built development priorities with high and medium weighting
Figure 4: Underperforming Greenspace opportunities with medium weighting

17
Figure 5: Health & Wellbeing priorities with high and medium weightings
Figure 6: Climate change adaptation priorities with high and medium weighting

18
Figure 7: Access to greenspace priorities with high weighting
Figure 8: Habitat Connectivity priorities with high weighting

19
5 GIS Analysis to derive Opportunities Maps
Opportunities Maps were created by analysing the correlation of areas of land use
opportunity with the areas of priority for Green Network delivery. Figure 9 below illustrates
the process of analysis to derive the four Opportunities Maps.
Figure 9: Concept diagram of how seven data layers were analysed and combined to identify the Green Network Strategic Delivery Areas
As with SDP1, the analysis was based on a 100m square resolution on which the weighted
datasets were overlain to identify correlations. However, the methodology for Clydeplan
has been refined from SDP1 in that rather than simply looking for correlations between all
the data layers each of the four priorities was assessed against the three combined land use
opportunities. This gives a more realistic interpretation of where the real opportunities for
delivery exist.
Figure 10 below illustrates how the land use opportunity data layers were analysed against
the Health and Wellbeing priorities data layer to derive the Health and Wellbeing
Opportunities Map. A similar analysis was undertaken for the Climate Change Adaptation
priorities, Access to Greenspace priorities and Habitat Connectivity priorities.

20
Figure 10: An illustration of the GIS analysis of land use opportunities against health and wellbeing priority areas to derive the Health and Wellbeing Opportunities Map.
5.1 The Green Network Opportunities Maps
The Green Network Opportunities Maps are the outputs of the analysis illustrated in Figure
10 above, for each Green Network delivery priority assessed against the combined land use
opportunities, and they are shown in the paragraphs below. The outputs show the 100m
cells on which the analysis is based that have the top three possible scores when the
weighted datasets are overlain. For a cell to be shown it must also contain the priority which
is being considered i.e. the score cannot just comprise opportunities.
5.1.1 Health and well-being
Figure 11 below shows locations where there is the greatest correlation between priority
areas for poor health and mental well-being and land use opportunities for the delivery of
Green Network measures which could encourage healthier lifestyles i.e. underperforming
open space, vacant and derelict land and new development.

21
Figure 11: Health and Wellbeing Opportunities Map
5.1.2 Climate change adaptation
Figure 12 below shows locations where there is the greatest correlation between priority
areas for climate change adaptation measures and opportunities for delivery i.e.
underperforming open space, vacant and derelict land and new development.
Figure 12: Climate Change Adaptation Opportunities Map

22
5.1.3 Access to open space
Figure 13 below shows locations where there is the greatest correlation between priority
areas for improved access to open space and opportunities for delivery i.e. underperforming
open space, vacant and derelict land and new development.
Figure 13: Access to Greenspace Opportunities Map
5.1.4 Habitat connectivity
Figure 14 below shows locations where there is the greatest correlation between priority
areas for habitat connectivity interventions as defined by SNH and the opportunities for
delivery i.e. underperforming open space, vacant and derelict land and new development.

23
Figure 14: Habitat Connectivity Opportunities Map
24
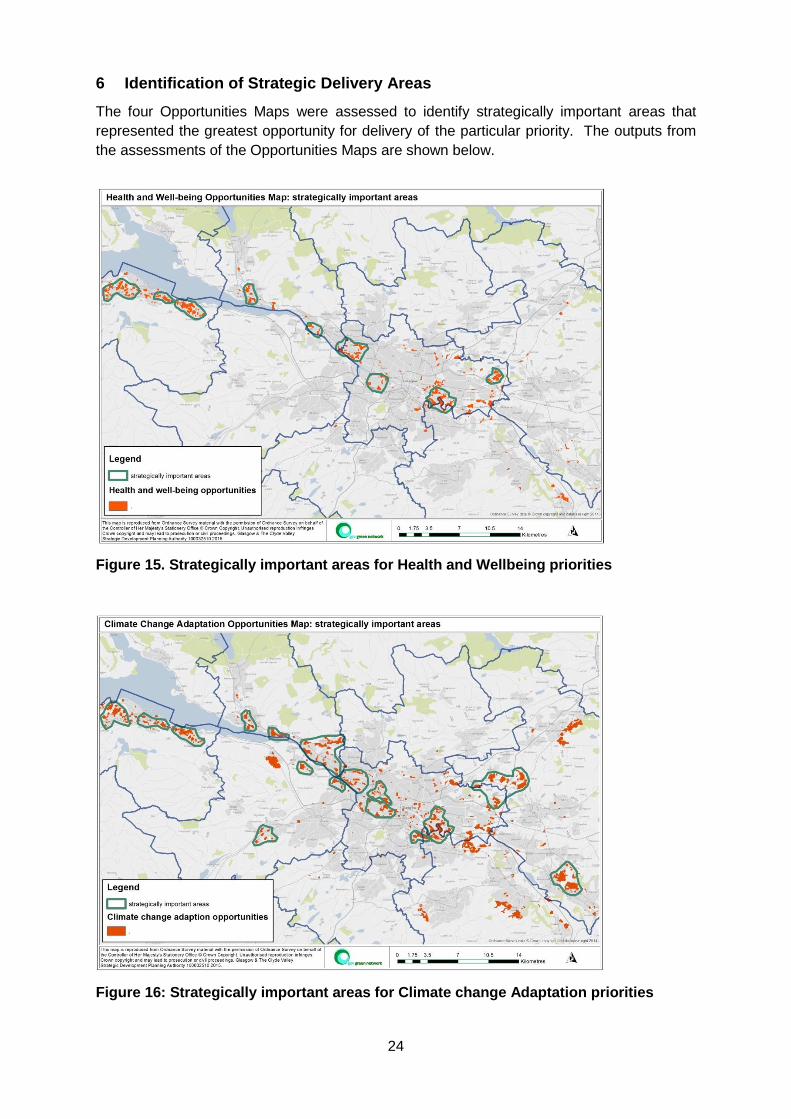
6 Identification of Strategic Delivery Areas
The four Opportunities Maps were assessed to identify strategically important areas that
represented the greatest opportunity for delivery of the particular priority. The outputs from
the assessments of the Opportunities Maps are shown below.
Figure 15. Strategically important areas for Health and Wellbeing priorities
Figure 16: Strategically important areas for Climate change Adaptation priorities

25
Figure 17: Strategically important areas for Access to Greenspace priorities
Figure 18: Strategically important areas for Habitat Connectivity priorities
Sixteen locations emerged from the strategically important areas and these are identified in
Clydeplan as Strategic Delivery Areas (SDA) for the GCV Green Network. They are
represented in Figure 19 below (see Appendix 5 for larger scale map).

26
Figure 19: Green Network Strategic Delivery Areas (SDAs)
Table 3 below sets out the sixteen SDAs in more detail and identifies the priorities that could
be delivered in these areas though Green Network delivery on land use opportunities.
Table 3: Strategic Delivery Areas
Strategic Delivery Areas Local authority Green Network Priority
Health
Access
Climate change
Habitats
1. Upper Greenock Inverclyde X X X
2. East Greenock Inverclyde X X X X
3. Port Glasgow Inverclyde X X X X
4. Dumbarton West Dunbartonshire X X X
5. Bowling West Dunbartonshire X X X
6. Clydebank West Dunbartonshire X X X X
7. Erskine Renfrewshire X X
8. Johnstone / Black Cart Corridor
Renfrewshire X X X
9. Renfrew Renfrewshire X X X
10. Yoker/Whitecrook Glasgow X X X X
11. Glasgow West End Glasgow X X
12. Govan / Ibrox Glasgow X X X
13. Toryglen Glasgow X X
14. Clyde Gateway Glasgow/South Lanarkshire
X X X X
15. Gartloch / Gartcosh Glasgow/North Lanarkshire
X X X X
16. Ravenscraig North Lanarkshire X X X

27
The SDAs are represented in the Clydeplan Main Issues Report in the following diagram:
Figure 20: Clydeplan Main Issues Report: Green Network Strategic Delivery Areas

28
7 Appendices
Appendix 1: Health and Wellbeing Opportunities Map

29
Appendix 2: Climate Change Adaptation Opportunities Map

30
Appendix 3: Access to Open Space Opportunities Map

31
Appendix 4: Habitat Connectivity Opportunities Map

32
Appendix 5: GCV Green Network Strategic Delivery Areas

ClydeplanLower Ground Floor, 125 West Regent Street, Glasgow G2 2SA0141 229 7730 • [email protected] • www.clydeplan-sdpa.gov.uk