clustering cloud workload traces to improve the ... · clustering cloud workload traces to improve...
TRANSCRIPT

Clustering Cloud Workload Traces to Improve the
Performance of Cloud Data Centers
Suhad A. Yousif and Auday Al-Dulaimy
Abstract: Cloud computing is the cutting edge model in the
IT industry. It offers compute and storage services on demand
in a pay-as-you-go manner. Cloud services are delivered by
providing an access to shared resources. The resources exist in
the physical machines, which are hosted in cloud data centers
found globally. For enhanced resource utilization, this paper
characterizes and clusters the tasks of Google workload trace
based on the resource usage of tasks. According to their
resource usage, tasks with similar resource requirements are
grouped together. Task clustering aims to help the cloud data
center scheduler identify the optimal virtual machine
placement strategy. The proposed strategy then seeks to place
the virtual machines allocated to the tasks from complemented
group or clusters on the same physical machines. Such
placement prevents competition for the resources of the same
physical machine, which may enhance system performance in
the cloud data center. In this paper, two clustering algorithms
are applied: k-mean clustering (using the Euclidean and
Manhattan methods as the distance measure metrics) and
density-based clustering. Applied algorithms implemented with
Weka, which is a software that contains a collection of machine
learning algorithms to perform the data mining tasks.
Index Terms: Cloud Computing, Data Center
Performance, Google Workload Trace, Virtual Machine
Placement.
Manuscript received on March 21, 2017; Revised on April 10, 2017;
Accepted on April 20, 2017.
Suhad A. Yousif: Department of Computer Science, College of
Science, Al-Nahrain University, Baghdad, Iraq. ( Email: [email protected] ; [email protected] ).
Auday Al-Dulaimy: Department of Mathematics & Computer
Science, Faculty of Science, Beirut Arab University, Beirut, Lebanon. ( Email: [email protected] ) .
I. INTRODUCTION
Cloud computing is currently the cutting edge model in
the IT industry. It offers compute and storage services on
demand in a pay-as-you-go manner. Cloud services are
delivered by providing an access to shared resources, and
such resources are hosted in cloud data centers with specific
configurations.
The cloud computing model serves numerous
applications. These applications have various characteristics
and have diverse demands for the resources of the Physical
Machines (PMs). For example, the requirements of database
applications (which perform intensive read and write
operations of disks) differ from the requirements of a
scientific computing application (which demands significant
computing power from the CPU). Therefore, based on the
different demands of dissimilar tasks of the cloud
applications, clustering the tasks into groups or clusters is
feasible.
The clustering process can identify the characterization
that can enhance the performance of historical workload
traces in terms of many key performance metrics, such as
improving the utilization of the PMs hosted in the cloud data
centers.
Numerous works in the literature have examined the
Google workload traces for diverse purposes.
In [1], the authors focused on studying and
characterizing the running time of the resource usage of
tasks. They intended to find a task classification that can
reproduce the performance of historical workload traces in
terms of certain key performance metrics.
In [2], the authors analyzed the Google workload trace
and suggested instructions that can be useful in designing
realistic cloud workloads.
The authors in [3] investigated the Google workload
trace to develop effective cloud-based resource schedulers.
In [4], the authors examined and discussed the
statistical summary of Google workload trace. They utilized
Proceedings of the World Congress on Engineering 2017 Vol I WCE 2017, July 5-7, 2017, London, U.K.
ISBN: 978-988-14047-4-9 ISSN: 2078-0958 (Print); ISSN: 2078-0966 (Online)
WCE 2017

the k-mean clustering algorithm to identify common groups
of the tasks in the workload.
Finally, the authors in [5] presented a study of the
Google workload trace to build and to evaluate a predictive
model for node failures. They used an SQL platform to
process massive amounts of data and to generate a set of
features that characterize the PM state over time.
To the best of our knowledge, no work from the
literature has applied the clustering algorithms used in this
work. So, the key contributions of this paper are:
1- Clustering cloud workload traces into groups of
common behavior tasks by applying two clustering
algorithms: k-mean clustering (using the Euclidean
and Manhattan methods as the distance measure
metrics) and density-based clustering.
2- Suggesting a virtual machine (VM) placement
strategy based on the groups resulting from the
clustering process.
The rest of this paper is organized as follows: Section
Two provides a brief description on the selected workload
trace. Section Three presents the methodology of this paper,
including the proposed system model and the description of
the applied clustering algorithm. Results of the clustering
algorithms and the performance analysis are presented in
Section Four. Section Five draws the conclusions and
explains future directions.
II. WORKLOAD DESCRIPTION
The task information is based on real data provided by
Google. Tasks of the Google workload trace are collected
from large cloud systems (over 12,500 compute nodes) for
29 days. The traces consist of different types of over 25
million tasks belonging to approximately 930 users. Real
workload traces can reflect a high level of realism when
used directly in performance evaluation experiments. Each
task in the trace has twenty attributes as displayed in Table 1
below. Further details on this data are available in [6].
Table 1: Task attributes
Attribute No. Attribute Details
1 Time
2 Job ID
3 Task Index
4 Comparison Operator
5 Attribute Name
6 Attribute Value
7 Start Time
8 End Time
9 Job ID
10 Task Index
11 Machine ID
12 CPU Rate
13 Canonical Memory Usage
14 Assigned Memory Usage
15 Unmapped Page Cache
16 Total Page Cache
17 Maximum Memory Usage
18 Disk I/O Time
19 Local Disk Space Usage
20 Maximum CPU Rate
III. METHODOLOGY
This section describes the system model and the
clustering algorithms applied in this work to cluster the
tasks in the workload.
A- System Model
The proposed system depends on the classic cloud
computing model, wherein cloud users request the services
offered by the cloud providers directly or via cloud brokers.
Thus, the three main system components in this work are:
Cloud User (CU), Cloud Broker (CB), and Cloud Provider
(CP) as illustrated in Figure 1.
Figure 1: System Model Overview.
CU requests the required service(s) as a task(s) via CB
or directly from CP. To gain some benefits, CB works on
behalf of CU for requesting services.
Meanwhile, CP manages two main components:
1- Meta-Scheduler (MS): This component is an
essential node, which acts as an interface between
users and their brokers from one side and the
infrastructure of a provider from the other side.
MS works in two phases.
First phase (analyzing phase): the MS
classifies the submitted tasks into clusters and
analyzes their service requirements.
Second phase (provisioning phase): the MS
reserves the resources required by tasks from a
specific data center and then sends the tasks to
the data center possessing the reserved
resources to serve and execute the tasks.
2- Data Centers (DCs): DCs are located in different
geographical regions. DCs host the infrastructure
of the CPs represented by the compute and storage
resources of the PMs. The VMs are hosted on the
PMs. To achieve an efficient VM placement, each
Proceedings of the World Congress on Engineering 2017 Vol I WCE 2017, July 5-7, 2017, London, U.K.
ISBN: 978-988-14047-4-9 ISSN: 2078-0958 (Print); ISSN: 2078-0966 (Online)
WCE 2017

data center periodically updates the MS through
information regarding the available resources.
CP receives the users’ tasks as a Bag-of-Tasks. In this
work, it is assumed that each task is served by one VM. In
the MS, tasks are categorized and their required resources
are reserved before sending them to be served in the selected
data center.
At the selected data center, the scheduler performs two
key processes: VM allocation and VM placement. VM
allocation involves the mapping of the tasks to VMs.
Allocation is performed based on the analysis and
reservation performed in the MS. VM placement entails the
mapping of the VMs into their best fit PMs. Placement can
be performed based on the strategy proposed in [7].
In [7], the VM placement strategy considers the types
of tasks in the VM placement process.
This work differs from the work presented in [7],
because it considers the new proposed task clusters in its
VM placement strategy.
This strategy in the placement process seeks to prevent
conflict in the usage of resources when placing the VMs on
the same PM, consequently improving the performance in
the data center.
B- Clustering Algorithms
Cluster analysis identifies groups of objects. In this
work, groups are identified through their similarities in
resource usage in terms of their compute or non-compute
resources; subsequently, tasks are assigned into clusters.
Based on the virtualization concept, task clustering
aims to assign the VMs which do not request or utilize the
same type of resources on the same PM. This placement
strategy prevents any competition on the same PM resources
through the hosted VMs.
As stated in [6], each task has many attributes; some of
these attributes are related to the CPU, while others pertain
to other types of PM resources (e.g., hard disk). The values
of attributes vary among the tasks. Every task of the cloud
application has different demands for the resources on the
PM, hence the variation. The differences in their demands
allow for the clustering of the tasks of the cloud application
into distinct clusters.
Thus, certain attributes are selected to cluster the
workload trace into Compute-Intensive Tasks (CITs) and
Non compute-Intensive Tasks (NITs). The selected
attributes are as follow
- For CITs, the selected attributes are: CPU rate,
maximum CPU rate, cycles per instruction, and
sampled CPU usage.
- For NITs, the selected attributes are: disk I/O time,
local disk space usage, and maximum disk I/O
time.
Two clustering algorithms used in this work are: K-
mean clustering (using the Euclidean and Manhattan
methods as the distance measure metrics) and density-based
clustering.
i) K-mean Clustering:
A popular method for cluster analysis in data
mining, K-mean clustering aims to partition a space of
n points into k clusters, wherein each point belongs to
the cluster with the nearest mean, serving as a prototype of
the cluster.
All spaces to be clustered have a distance measure,
leaving a distance between any two points in the space.
Many metrics are used to measure distance. This work
applies the following metrics:
Euclidean distance measure: the square root of the
sums of the squares of the differences between the
coordinates of the points in each dimension.
Applicable for all types of spaces, it is the standard
measure in the k-mean algorithm.
Manhattan distance measure: the sum of the
magnitudes of the differences in each dimension.
ii) Density-Based Clustering:
This method collects the points that are closely packed
(points with many nearby neighbors), and marks as outliers
those points resting alone in low-density regions (those with
distant neighboring points). The idea of this clustering
algorithm is that a cluster in a space is a contiguous region
of high-point density.
IV. PERFORMANCE ANALYSIS
This section presents the performance analysis of the
proposed clustering methods applied to cloud workload
traces.
All experiments were performed on a computer with
Intel CoreTM i5-3210M CPU @ 2.50 GHz and 8GB of
memory, using Windows 10.
The clustering process was performed using Weka [8].
Weka is the software which contains a collection of machine
learning algorithms used for performing data mining tasks.
In Weka, algorithms can be applied directly to a specified
dataset or the user code. Weka can also perform data pre-
processing, regression, clustering, classification, and
visualization.
Approximately 12,500 tasks are tested in the
experiments. Tasks are randomly selected, which suits the
cloud computing model as tasks are submitted in
unpredictable manner.
Results of clustering based on selecting attributes
related to CITs (CPU rate, maximum CPU rate, cycles per
instruction, and sampled CPU usage), together with the
required clustering time, are presented in Table 2.
Conversely, results of clustering based on selecting
attributes related to NITs (disk I/O time, local disk space
usage, and maximum disk I/O time) , together with the
required clustering time, are shown in Table 3.
Proceedings of the World Congress on Engineering 2017 Vol I WCE 2017, July 5-7, 2017, London, U.K.
ISBN: 978-988-14047-4-9 ISSN: 2078-0958 (Print); ISSN: 2078-0966 (Online)
WCE 2017
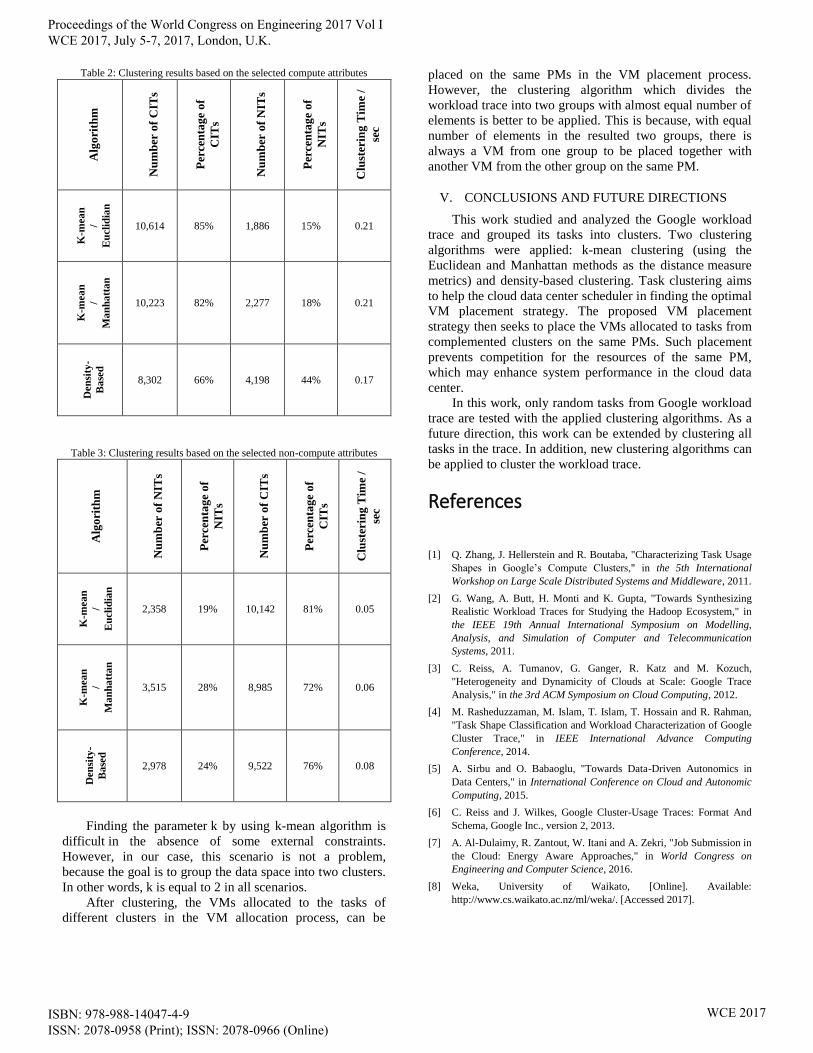
Table 2: Clustering results based on the selected compute attributes
Alg
ori
thm
Nu
mb
er o
f C
ITs
Per
cen
tag
e o
f
CIT
s
Nu
mb
er o
f N
ITs
Per
cen
tag
e o
f
NIT
s
Clu
ster
ing
Tim
e /
sec
K-m
ea
n
/
Eu
cli
dia
n
10,614 85% 1,886 15% 0.21
K-m
ea
n
/
Ma
nh
att
an
10,223 82% 2,277 18% 0.21
Den
sity
-
Ba
sed
8,302 66% 4,198 44% 0.17
Table 3: Clustering results based on the selected non-compute attributes
Alg
ori
thm
Nu
mb
er o
f N
ITs
Per
cen
tag
e o
f
NIT
s
Nu
mb
er o
f C
ITs
Per
cen
tag
e o
f
CIT
s
Clu
ster
ing
Tim
e /
sec
K-m
ea
n
/
Eu
cli
dia
n
2,358 19% 10,142 81% 0.05
K-m
ea
n
/
Ma
nh
att
an
3,515 28% 8,985 72% 0.06
Den
sity
-
Ba
sed
2,978 24% 9,522 76% 0.08
Finding the parameter k by using k-mean algorithm is
difficult in the absence of some external constraints.
However, in our case, this scenario is not a problem,
because the goal is to group the data space into two clusters.
In other words, k is equal to 2 in all scenarios.
After clustering, the VMs allocated to the tasks of
different clusters in the VM allocation process, can be
placed on the same PMs in the VM placement process.
However, the clustering algorithm which divides the
workload trace into two groups with almost equal number of
elements is better to be applied. This is because, with equal
number of elements in the resulted two groups, there is
always a VM from one group to be placed together with
another VM from the other group on the same PM.
V. CONCLUSIONS AND FUTURE DIRECTIONS
This work studied and analyzed the Google workload
trace and grouped its tasks into clusters. Two clustering
algorithms were applied: k-mean clustering (using the
Euclidean and Manhattan methods as the distance measure
metrics) and density-based clustering. Task clustering aims
to help the cloud data center scheduler in finding the optimal
VM placement strategy. The proposed VM placement
strategy then seeks to place the VMs allocated to tasks from
complemented clusters on the same PMs. Such placement
prevents competition for the resources of the same PM,
which may enhance system performance in the cloud data
center.
In this work, only random tasks from Google workload
trace are tested with the applied clustering algorithms. As a
future direction, this work can be extended by clustering all
tasks in the trace. In addition, new clustering algorithms can
be applied to cluster the workload trace.
References
[1] Q. Zhang, J. Hellerstein and R. Boutaba, "Characterizing Task Usage
Shapes in Google’s Compute Clusters," in the 5th International
Workshop on Large Scale Distributed Systems and Middleware, 2011.
[2] G. Wang, A. Butt, H. Monti and K. Gupta, "Towards Synthesizing
Realistic Workload Traces for Studying the Hadoop Ecosystem," in
the IEEE 19th Annual International Symposium on Modelling,
Analysis, and Simulation of Computer and Telecommunication
Systems, 2011.
[3] C. Reiss, A. Tumanov, G. Ganger, R. Katz and M. Kozuch,
"Heterogeneity and Dynamicity of Clouds at Scale: Google Trace
Analysis," in the 3rd ACM Symposium on Cloud Computing, 2012.
[4] M. Rasheduzzaman, M. Islam, T. Islam, T. Hossain and R. Rahman,
"Task Shape Classification and Workload Characterization of Google
Cluster Trace," in IEEE International Advance Computing
Conference, 2014.
[5] A. Sirbu and O. Babaoglu, "Towards Data-Driven Autonomics in
Data Centers," in International Conference on Cloud and Autonomic
Computing, 2015.
[6] C. Reiss and J. Wilkes, Google Cluster-Usage Traces: Format And
Schema, Google Inc., version 2, 2013.
[7] A. Al-Dulaimy, R. Zantout, W. Itani and A. Zekri, "Job Submission in
the Cloud: Energy Aware Approaches," in World Congress on
Engineering and Computer Science, 2016.
[8] Weka, University of Waikato, [Online]. Available:
http://www.cs.waikato.ac.nz/ml/weka/. [Accessed 2017].
Proceedings of the World Congress on Engineering 2017 Vol I WCE 2017, July 5-7, 2017, London, U.K.
ISBN: 978-988-14047-4-9 ISSN: 2078-0958 (Print); ISSN: 2078-0966 (Online)
WCE 2017