cluster-level adaptive interventions and sequential ...tnecamp/slide show_ibc_2016_2464158.pdf ·...
TRANSCRIPT

Cluster-level adaptive interventions and sequential, multiple assignment,
randomized trials: Estimation and sample size considerations
Tim NeCampUniversity of Michigan
Joint work with Amy Kilbourne and Daniel Almirall
JITAIs

2
Overview
• Cluster level Adaptive Interventions• Trial Design to Develop Cluster-level
Adaptive Interventions• Sample Size Formula and Simulation Results

Cluster-level Interventions
• Often times, interventions are delivered at the cluster level, e.g.:– A new curriculum for 8th grade math classes– Family therapy sessions– Intervention designed to increase the adoption
of an evidence based practice (EBP) in routine clinical settings
3

Towards Cluster-level AdaptiveInterventions
• However, due heterogeneity in clusters…– Within cluster heterogeneity– Between cluster heterogeneity
4
it is often necessary to use an adaptiveapproach to intervention

5
Adaptive Implementation of Effective Programs Trial (ADEPT) (Kilbourne et al., 2014)
REP+EF
Month 6 Month 240 Month 12
Third-stageSecond-stageFirst-stage
Add IF (REP+EF+IF)
REP
REP
Discontinue EF (REP)
A clinic is “not responding” at months 6 and 12 if < 50% of the pre-specified patients identified have received ≥3 Life Goals sessions
REP
An Example of a Cluster-Level Adaptive Intervention
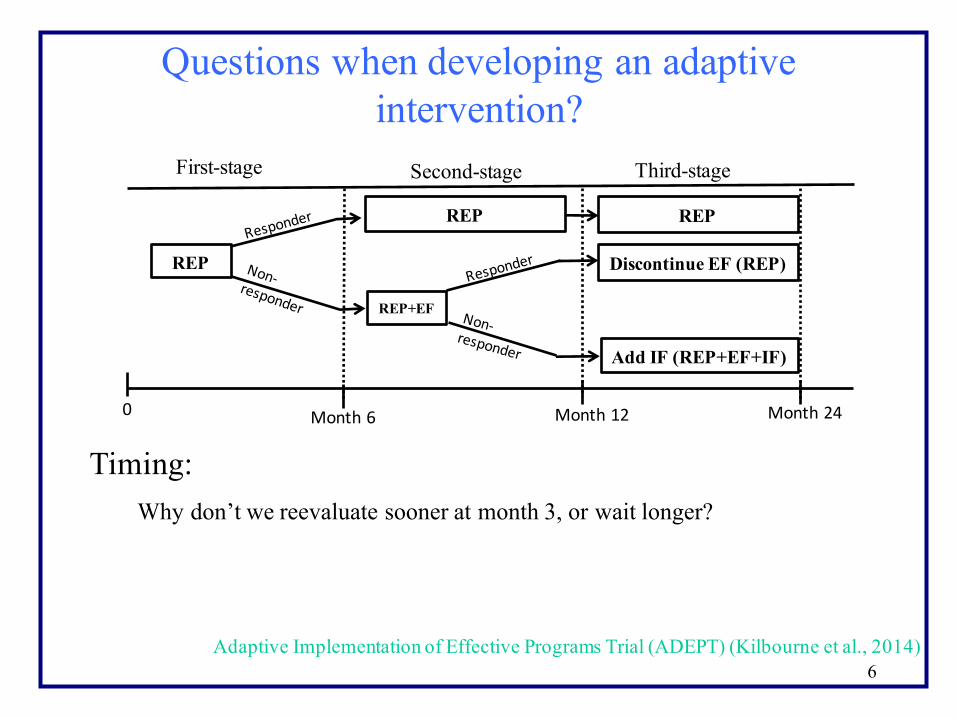
6Adaptive Implementation of Effective Programs Trial (ADEPT) (Kilbourne et al., 2014)
REP+EF
Month 6 Month 240 Month 12
Third-stageSecond-stageFirst-stage
Add IF (REP+EF+IF)
REP
REP
Discontinue EF (REP)
REP
Questions when developing an adaptive intervention?
Timing: Why don’t we reevaluate sooner at month 3, or wait longer?

7Adaptive Implementation of Effective Programs Trial (ADEPT) (Kilbourne et al., 2014)
REP+EF
Month 6 Month 240 Month 12
Third-stageSecond-stageFirst-stage
Add IF (REP+EF+IF)
REP
REP
Discontinue EF (REP)
REP
Questions when developing an adaptive intervention?
Sequence:Why don’t we start with REP+EF?
Why do we stop giving EF to second stage responders?

8
Sequential Multiple Assignment Randomized Trials (SMARTs)
• Sequential multiple assignment randomized trials (SMARTs) are trial designs used to build high-quality adaptive interventions.
• Here we consider cluster randomized SMARTs, where the unit of randomization is a cluster and the outcomes are measured at the patient level.

9
ADEPT: SMART trial design
REP+EF Continue REP+EF
Discontinue EF (REP)
Continue REP+EF+IF
Discontinue EF+IF (REP )
REF+EF+IF
Month 6 Month 24
A
B
C
D
E
0 Month 12
CellsThird-stageSecond-stage
Non-‐responding sites after 6 months of REPenter the study
First-stage
R
R Add IF (REP+EF+IF)
Adaptive Implementation of Effective Programs Trial (ADEPT) (Kilbourne et al., 2014)

Comparison of Embedded Adaptive Interventions in a SMART
• Common primary aim in a SMART
• Can be conceptualized as:– Comparing two pre-specified embedded
adaptive interventions
– Select the best embedded adaptive intervention
10
Oetting et al. (2010)
Ghosh et al. (2015); Li Z and Murphy SA (2011)

11
Adaptive intervention 1
REP+EF Continue REP+EF
Discontinue EF (REP)
Continue REP+EF+IF
Discontinue EF+IF (REP )
REF+EF+IF
Month 6 Month 24
A
B
C
D
E
0 Month 12
CellsThird-stageSecond-stage
Non-‐responding sites after 6 months of REPenter the study
First-stage
R
R Add IF (REP+EF+IF)
Adaptive Implementation of Effective Programs Trial (ADEPT) (Kilbourne et al., 2014)

12
Adaptive intervention 2
REP+EF Continue REP+EF
Discontinue EF (REP)
Continue REP+EF+IF
Discontinue EF+IF (REP )
REF+EF+IF
Month 6 Month 24
A
B
C
D
E
0 Month 12
CellsThird-stageSecond-stage
Non-‐responding sites after 6 months of REPenter the study
First-stage
R
R Add IF (REP+EF+IF)
Adaptive Implementation of Effective Programs Trial (ADEPT) (Kilbourne et al., 2014)

13
Adaptive intervention 3
REP+EF Continue REP+EF
Discontinue EF (REP)
Continue REP+EF+IF
Discontinue EF+IF (REP )
REF+EF+IF
Month 6 Month 24
A
B
C
D
E
0 Month 12
CellsThird-stageSecond-stage
Non-‐responding sites after 6 months of REPenter the study
First-stage
R
R Add IF (REP+EF+IF)
Adaptive Implementation of Effective Programs Trial (ADEPT) (Kilbourne et al., 2014)

Methodology to Compare Embedded Adaptive Interventions
• By design, clusters could have different probabilities of receiving a particular sequence of interventions.
• We extended the use of inverse probability weighted(IPW) regression estimators for cluster-randomized SMART data.
• The regression methodology allows for estimation of adaptive intervention effects conditional on baseline covariates.
14Orellana et al. (2010); Murphy et al. (2001); Robins et al. (2000); Hernan et al. (2000); Robins (1999)
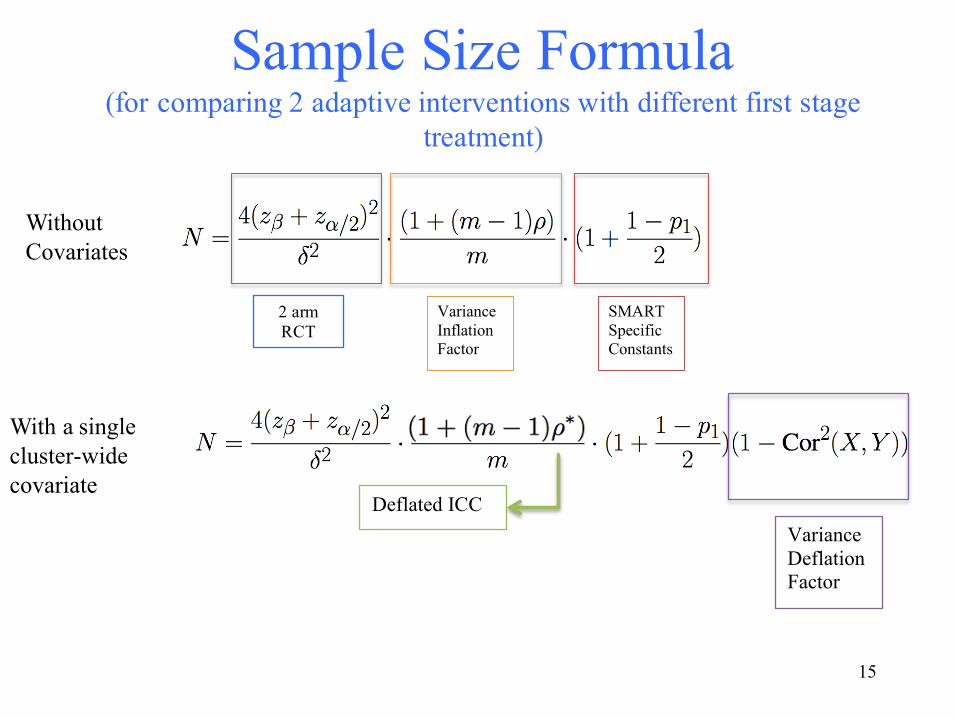
Sample Size Formula(for comparing 2 adaptive interventions with different first stage
treatment)
15
Regular Constants
Variance Inflation Factor
SMART Specific Constants
2 arm RCT
Without Covariates
Variance Deflation Factor
Deflated ICC
With a single cluster-wide covariate
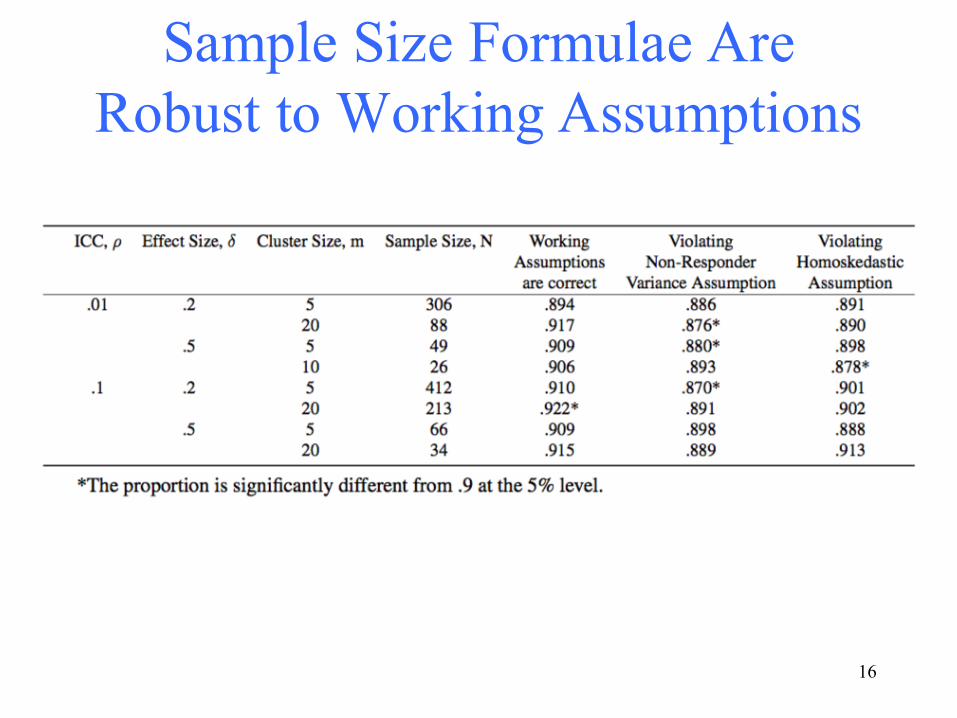
Sample Size Formulae Are Robust to Working Assumptions
16
Future Work
• Extensions of formula to allow for individual level covariates
• Combining cluster-randomized and individual-randomized SMARTs
• Develop random effects methodology for cluster-randomized SMARTs
17

Thank you!
• Collaborators: – Daniel Almirall– Amy Kilbourne
• Funding– NIH grants: R01MH099898, P50DA039838,
R01HD073975, R01DA039901
18Questions?

Citations• Kilbourne AM, Almirall D, Eisenberg D, Waxmonsky J, Goodrich DE, Fortney JC, Kirchner JE,
Solberg LI, Main D, Bauer MS et al. (2014) Protocol: Adaptive implementation of effective programs trial (adept): cluster randomized smart trial comparing a standard versus enhanced implementation strategy to improve outcomes of a mood disorders program. Implement Science 9: 132
• Ghosh P, Cheung Y and Chakraborty B (2015) Sample size calculations for clustered smart designs. In: Kosorok MR and Moodie EE (eds.) Adaptive Treatment Strategies in Practice: Planning Trials and Analyzing Data for Personalized Medicine, chapter 5. Alexandria, Virginia: SIAM, pp. 55–70.
• Li Z and Murphy SA (2011) Sample size formulae for two-stage randomized trials with survival outcomes. Biometrika 98(3): 503–518.
• Oetting A, Levy J, Weiss R and Murphy S (2011) Statistical methodology for a smart design in the development of adaptive treatment strategies. In: Shrout P, Keyes K and Ornstein K (eds.) Causality and psychopathology: Finding the determinants of disorders and their cures. Arlington, VA: Oxford University Press, pp. 179–205.
• Orellana L, Rotnitzky A and Robins J (2010) Dynamic regime marginal structural mean models for estimating optimal dynamic treatment regimes, part i: Main content. International Journal of Biostatistics 6(2): Article 8.
• Murphy SA, van der Laan MJ, Robins JM and CPPRG (2001) Marginal mean models for dynamic regimes. Journal of the American Statistical Association 96: 1410–1423. 19

More Citations• Herna ́n M, Brumback B and Robins J (2000) Marginal structural models to estimate the causal effect
of zidovudine on the survival of hiv-positive men. Epidemiology 11(561-70).
• Robins JM (1999) Association, causation, and marginal structural models. Synthese 121: 151– 179. • Robins JM, Hernan M and Brumback B (2000) Marginal structural models and causal inference.
Epidemiology 11(5): 550–560.
• Lu, X., Nahum-Shani, I., Kasari, C., Lynch, K. G., Oslin, D. W., Pelham, W. E., et al. (2015). Comparing dynamic treatment regimes using repeated-measures outcomes: modeling considerations in SMART studies. Stat Med. doi:10.1002/sim.6819
• Nahum-Shani I, Qian M, Almirall D, Pelham W, Gnagy B, Fabiano G, Waxmonsky J, Yu J and Murphy S (2012) Experimental design and primary data analysis methods for comparing adaptive interventions. Psychological Methods 17: 457–477.
20

Extra Slides
21

Methodology• We developed an inverse probability weighted
(IPW) regression approach in order to obtain estimates of the intervention effects
• We parameterize the mean as:
22Orellana et al. (2010); Murphy et al. (2001); Robins et al. (2000); Hernan et al. (2000); Robins (1999)

Methodology
• The estimates are obtain by solving:
•
• I here is an indicator function which is 1 if you are consistent with adaptive intervention (a1,a2)
• W is the known inverse probability weight.• V is the working correlation matrix
23
Orellana et al. (2010); Nahum-Shani et al. (2012); Lu et al. (2015)
*

24
REP+EF Continue REP+EF
Discontinue REP+EF
Continue REP+EF+IF
Discontinue REP+EF+IF
REF+EF+IF
Month 6 Month 24
A
B
C
D
E
0 Month 12
CellsThird-stageSecond-stage
Non-‐responding sites after 6 months of REPenter the study
First-stage
R
R Add IF (REP+EF+IF)

Using sample size formula with ADEPT
• In ADEPT we projected:– 16 patients per site (m = 16)– .01 is the estimated pre-trial ICC (ρ = .01)– .3 is the estimate response rate to first stage
intervention REP + EF (p1 = .3)With an effect size of .2, Type I error of .05, and desired power of 80% we would need
N = 77
25

Extensions to the Prototypical SMART Study
26
1st Treatment 1 (T11) 2nd Treatment 2 (T22)
2nd Treatment 1 (T21)
1st Treatment 2 (T12)
A
B
C
D
E
CellsSecond-stageFirst-stage
R
R2nd Treatment 3 (T23)
2nd Treatment 5 (T25)
2nd Treatment 4 (T24)
2nd Treatment 6 (T26)R
F