cluster investigations of non-infectious health events
Post on 20-Dec-2015
213 views
TRANSCRIPT

Cluster Investigations of Non-Infectious Health
Events

Goals
Describe cluster investigations of non-infectious health events
Discuss key factors which should be considered before carrying out a cluster investigation
Outline the basic steps of a cluster investigation
Cluster investigations of non-infectious diseases
Critical public health function May link specific exposures to
diseases Example: Limb deformities in infants
related to maternal use of thalidomide in Europe in 1960s (1)
Led to U.S. legislation requiring rigorous testing process for approval of new pharmaceutical products
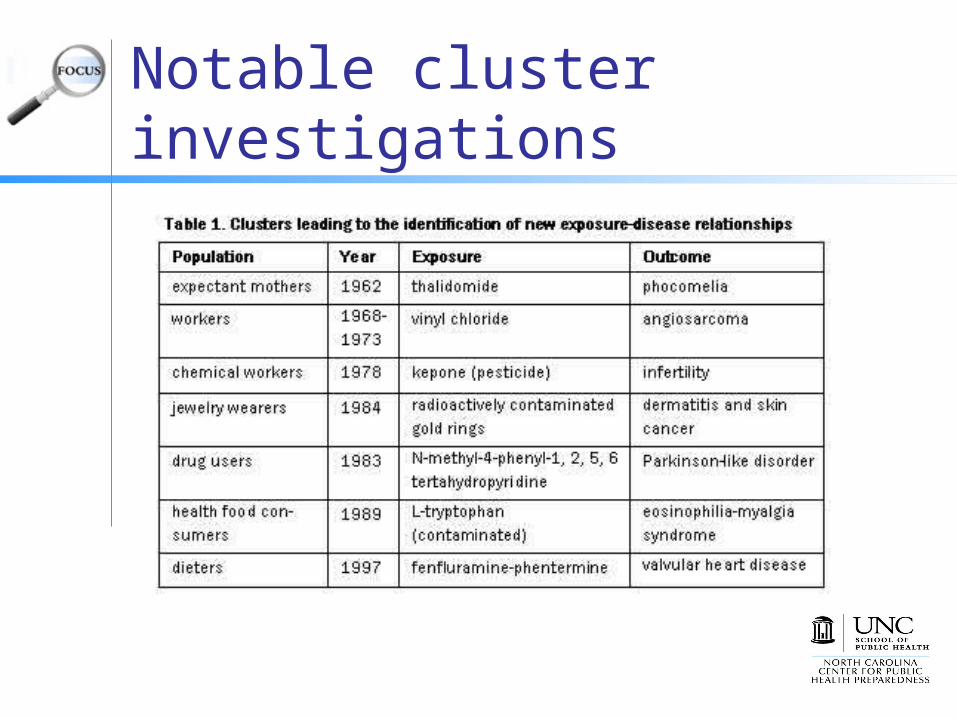
Notable cluster investigations

Non-infectious disease cluster investigations may be difficult Hard to confirm apparent geographic or
temporal excess in case numbers Supposed clusters may represent normal
disease patterns Confounding factors such as age Different pathogenic processes may result
in diseases that look alike but are not linked Example—primary brain cancer vs. brain
metastases spread from cancer in another organ

Non-infectious disease cluster investigations may be difficult Often impossible to establish a
definitive cause-and-effect relationship Small case numbers Problems isolating single potential exposure Difficulty in reconstructing exposure
histories (2)
Large-scale epidemiologic studies may be required Difficult to carry out
Ensuring a successful investigation Standardized step-wise process for
receiving/evaluating cluster reports Centralized tracking system, data collection
tools, clear lines of communication Well-trained staff and adequate resources
Experienced investigators, access to laboratories
Perceived problems must be addressed responsibly and sympathetically Effective, credible communication with public
and other agencies

To investigate or not? Investigating a link between exposure and
disease may be impossible but it is important to respond to threats perceived by the public
Keep in mind: Value of using a step-wise process with clear
decision points Share policy of using step-wise process with medical
community, general public, media Deliberate and transparent approach when carrying
out any investigation Recognize local concern but stay within stated
investigation process Develop effective methods of communication

Basic steps in investigating non-infectious disease clusters
Each step in a cluster investigation requires: Collecting and
analyzing data Decision to take
immediate action (if needed)
Decision to proceed to next step or not (3)
Figure 1. Flowchart of cluster investigation

Step 1: Initial ascertainment of cluster
Begin by collecting data: Identifying information from person
reporting the cluster Demographic information for cluster
cases Clinical information on cluster cases Identifying information for cluster
cases
Step 1—continued Enter information collected into a
tracking system Example: EpiInfo, Microsoft Access or
Excel Notify health department staff, local
health officers and appropriate agencies
Begin seeking information on disease causes and compare this information with the reported cluster
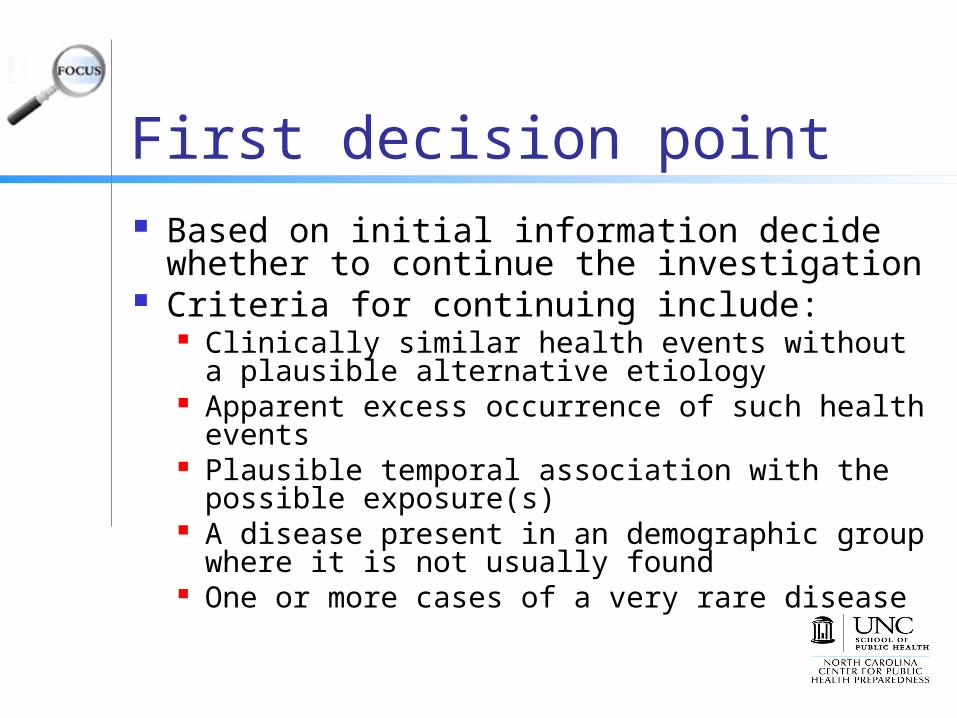
First decision point Based on initial information decide
whether to continue the investigation Criteria for continuing include:
Clinically similar health events without a plausible alternative etiology
Apparent excess occurrence of such health events
Plausible temporal association with the possible exposure(s)
A disease present in an demographic group where it is not usually found
One or more cases of a very rare disease
If investigation ends
Create a brief summary report and share with person reporting cluster and health department supervisors
If investigation is halted, explain why to person reporting. Example: variety in diagnoses (e.g.,
different types of cancers) argues against a common origin

Step 2: Assessment of excess occurrence Estimating excess occurrence
Confirm whether the number of cluster cases is greater than expected
Estimate an occurrence rateNumber of people with the health event Total population at risk
Population at risk = all people in the geographic area where the exposure occurred over a designated time period

To estimate an occurrence rate Select an appropriate geographic area
and time period Geographic area should include all persons
at risk for the health event but not large enough to include those not at risk
Designated time period should be consistent with time period during which supposed exposure took place
Defining the geographic area and time period too narrowly or too broadly may over- or under-estimate problem

How size of geographic area affects occurrence rate
Figure 2. Finding the occurrence rate in the population at risk
Occurrence rate of 20% (left) vs. 8% (right)

Determining cases and finding a reference population Determine which cases from the reported
cluster to include in a preliminary analysis Find a reference population comparable to
the population in which the cluster appeared Example—residents from a similar geographic
area Estimate an expected occurrence rate for
the reference population from existing surveillance data

Compare occurrence rates Compare observed occurrence rate
based on the cluster with the expected rate from the reference population
Use appropriate statistical tests to compare rates 5 or more cases and appropriate
denominator—Chi-square tests or Poisson regression
Small case numbers—group cases across geographic areas or time periods

Case Verification Case definition should include clinical criteria and
restrictions on time, place, and person Sensitive case definition
Broad criteria, may include several related diseases or health events, captures more true cases but includes false positives
Specific case definition Narrow criteria, focuses on one health event, uses
confirmatory testing, excludes true cases (false negatives)
Example—cluster of cancer cases linked to benzene exposure
Sensitive case definition = diagnosis of any form of blood cancer
Specific case definition = diagnosis of leukemia

Using multiple case definitions Example – investigation of childhood
cancer cases in Dover Township and Toms River, NJ, 1995 (4)
Industrial pollutants released into Toms River contaminated Dover’s municipal well
Investigation of all childhood cancers and subgroups of selected cancers
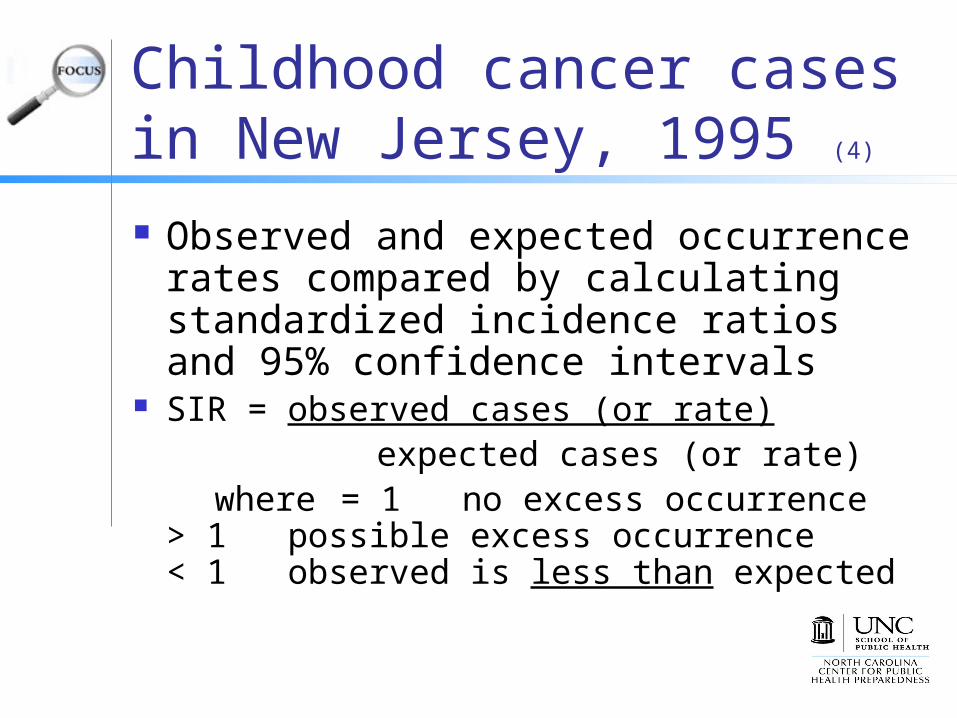
Childhood cancer cases in New Jersey, 1995 (4)
Observed and expected occurrence rates compared by calculating standardized incidence ratios and 95% confidence intervals
SIR = observed cases (or rate) expected cases (or rate) where = 1 no excess occurrence
> 1 possible excess occurrence< 1 observed is less than
expected
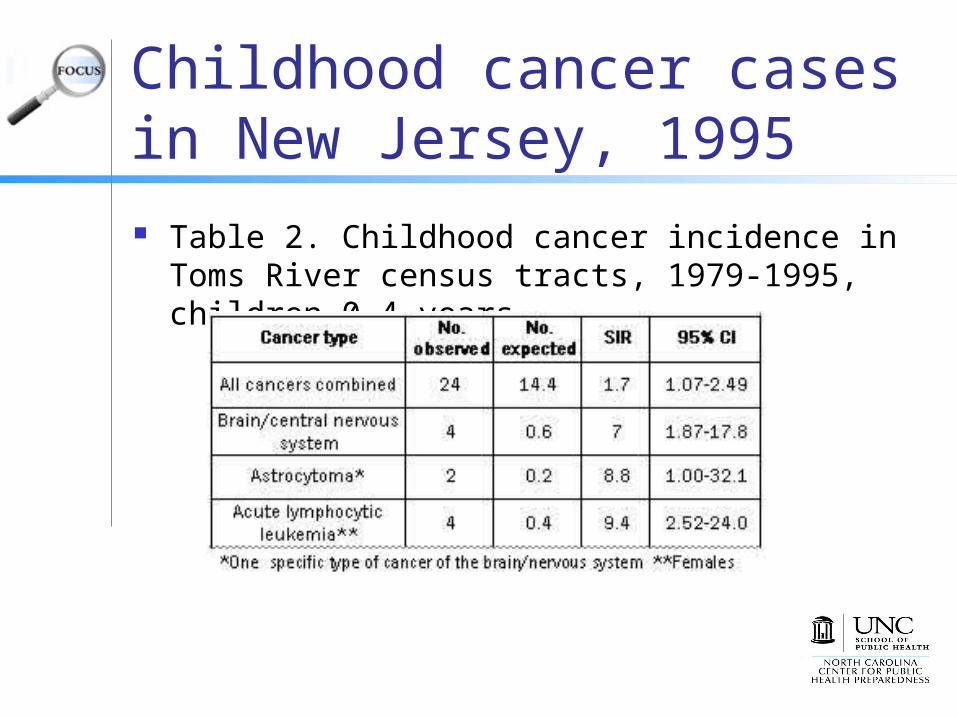
Childhood cancer cases in New Jersey, 1995 Table 2. Childhood cancer incidence in Toms
River census tracts, 1979-1995, children 0-4 years

Case-Verification Examine case-patients’ medical records Refer to relevant health registries Obtain copies of relevant laboratory,
pathology, or other reports Obtain clinical/laboratory re-evaluations
(e.g. retest biopsy or other specimens) May need to do additional case-finding
Case-Finding In an expanded assessment:
Reconsider initial case definition Reassess geographic/time boundaries Ascertain all potential cases within
geographic and time boundaries Identify appropriate database sources Perform literature review Assess likelihood that clustered events are
related to supposed exposure(s)
Case-Finding Review additional data sources or medical
records Formal surveys of the community reserved for
later stages in the investigation If excess occurrence of disease confirmed
with evidence of association with supposed exposure, consider etiologic study
If excess occurrence not confirmed or confirmed with no plausible relationship to supposed exposure, conclude investigation

Step 3: Determining the feasibility of an etiologic study
First, determine epidemiologic and logistical feasibility of an etiologic study
Construct a testable hypothesis Clearly state hypothesis Include the target population, health
event(s) and exposure(s) of interest

Determining feasibility Pros and cons of different study
designs Potential challenges and ways to
address them Potential for finding additional cases,
expanding the case definition and changing the time/geographic periods
Collecting additional data and associated costs

Etiologic study—measuring exposure
Do clinical or environmental tests for the exposure exist? How sensitive are they? Given the lapse of time since
exposure will the test be useful? Is the reported exposure history a
good predictor of true exposure?

Determining study benefits May be difficult to determine whether
an etiologic study will justify the effort Etiologic studies may not be successful
unless disease is rare or frequency has suddenly increased
Etiologic agent must be measurable and leave a physiologic response
Appropriate unexposed control group is needed—levels of exposure must vary within population to carry out study (6)
Assess study implications Consider epidemiologic and policy
implications Consider community reactions If etiologic study is feasible and likely
benefits justify the effort, carry out study If etiologic study is logistically impossible,
too expensive or will not affect policies or programs, end investigation

Step 4: Conducting an etiologic investigation Etiologic study should generate
knowledge about broader epidemiologic and public health issues raised
Begin by writing a formal study protocol Lay out steps in data collection,
processing, quality assurance and data analysis
Further study design decisions will be unique to the particular study
Conclusion Cluster investigations allow public
health officials to interact with the community and be responsive to public needs
May provide information about previously unsuspected exposure-disease relationships
Can be an unproductive drain on public health resources
References1. Lenz W. Kindliche mißbildungen nach medikament-einnahme
während der gravidat [Malformations in children after a drug taken during pregnancy]. Dtsch Med Wochenschr. 1961;86:2555–2556.
2. Cartwright RA. Cluster investigations: Are they worth it? Med J Aust. 1999;171(4):172. http://www.mja.com.au/public/issues/ 171_4_160899/cartwright/cartwright.html. Accessed August 13, 2008.
3. CDC. Guidelines for investigating clusters of health events. MMWR Morb Mortal Wkly Rep. 1990;39(RR-11):1-16. http://www.cdc.gov/mmwr/preview/mmwrhtml/00001797.htm. Accessed August 13, 2008.
4. New Jersey Department of Health and Senior Services and ATSDR. Childhood Cancer Incidence Health Consultation: A Review and Analysis of Cancer Registry Data, 1979-1995, for Dover Township (Ocean County), New Jersey. 1997. http://www.state.nj.us/health/eoh/hhazweb/cansumm.pdf. Accessed August 13, 2008.

References5. Bender AP, Williams AN, Johnson RA, Jagger HG.
Appropriate public health responses to clusters: The art of being responsibly responsive. Am J Epidemiol. 1990;132:S48-S52.
6. Rothman KJ. A sobering start for the cluster busters’ conference. Am J Epidemiol 1990;132:S6-S13.
7. Fischoff B, Lichtenstein S, Slovic P, et al. Acceptable Risk. Cambridge, UK: Cambridge Univ Press; 1981.
8. Greenberg MR, Wartenberg D. Understanding mass media coverage of disease clusters. Am J Epidemiol. 1990;132:S192-5.
9. Covello VT, Allen F. Seven Cardinal Rules of Risk Communication. Washington, DC: US Environmental Protection Agency, Office of Policy Analysis; 1988. OPA publication 87-020.