cluster electricity savings
TRANSCRIPT
Cluster Electricity SavingsSustainable and Cheap Electricity
A Financial Understanding of the costs and benefits and possibilities of Renewable Energy
By David LipschitzMy Power Station TechnologySolar Power Africa Conference
27th August 2012Phone: 021 551 9935; 074 119 3246
Email: [email protected]; skype: MyPowerStation(c) My Power Station Technology cc 2012
Permission is given to copy parts of this presentation as long as the Author is referenced 1

Our Challenge
(c) My Power Station Technology 2012 2
Data from AEE – Institute for Sustainable Technologies, Austria, 2009

Objective of Presentation• What’s possible regarding making electricity
ourselves and being energy efficient?• Not in depth training
(c) My Power Station Technology 2012 3
Riverside Renewable EnergyHolt LogisticsGloucester Marine TerminalNew Jersey, USA• 9MW Roof Top PV• $42m• ~ 110,000 square meters• 80% of energy requirement

Riaan Smit@ Wind Energy Conference, Cape Town, Tuesday 29th May 2012
• South Africa needs a
– “New Future Vision”• Riaan is Chief Engineer in National Planning at Eskom
(c) My Power Station Technology 2012 4

Agenda• Electricity Generation; Assumptions & Risks• Electricity and Infrastructure Challenges• Some Questions & Myths• Our Environment– We live in Exponential Times
• Electricity & “The Grid”– Can we rely on The Grid?– Can we make electricity ourselves cost effectively?
• How to get started?• Q&A
(c) My Power Station Technology 2012 5
The Risks
• Mainly our 20th Century assumptions• Compare wind and nuclear risks• Donor assistance risks
(c) My Power Station Technology 2012 6

Assumptions• Our economy has an assumption built into it– Cheap and reliable Electricity ??
• But 150% increase over the past 5 years– Cheap build ??
• But R79 bn quote: R125 bn now; 6 months behind schedule
– Cheap raw materials ??– Reliable Distribution Systems ??• Transformer life: was 35 years -> now 12.5 years
• Decreasing Costs works for IT ✔– Lets find out if it can work for electricity?
• How risky are our assumptions?(c) My Power Station Technology 2012 7

Risks
(c) My Power Station Technology 2012 8
IRP2010 v8 (nothing re PV; nothing re Net Metering)
Cheap?Reliable?
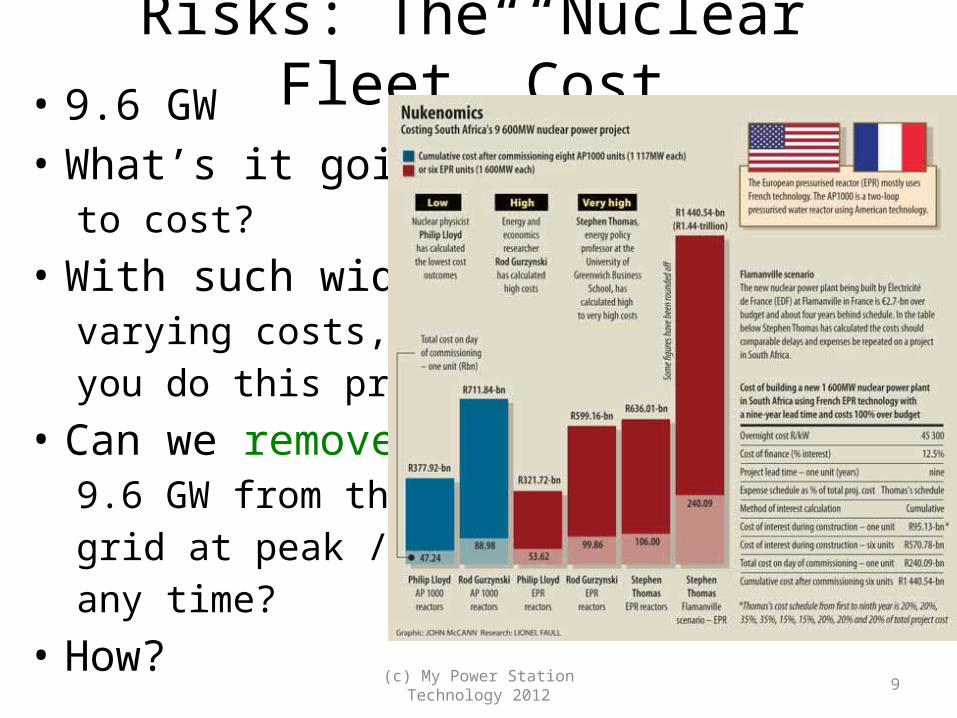
Risks: The “Nuclear Fleet” Cost• 9.6 GW• What’s it going
to cost?• With such widely
varying costs, wouldyou do this project?
• Can we remove9.6 GW from thegrid at peak /any time?
• How?(c) My Power Station Technology 2012 9
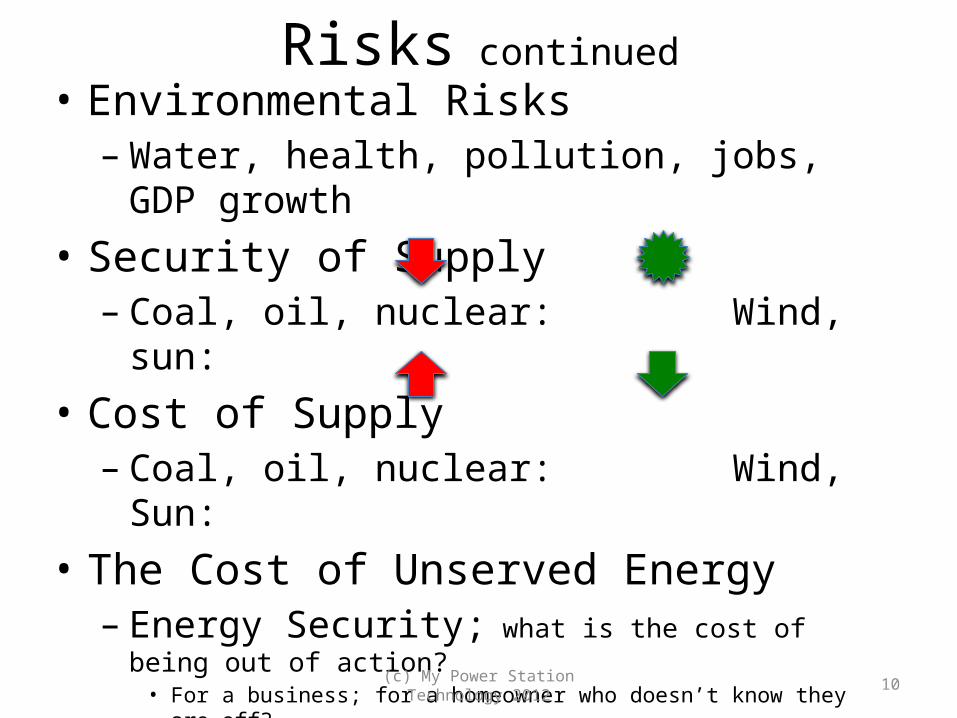
Risks continued• Environmental Risks– Water, health, pollution, jobs, GDP growth
• Security of Supply– Coal, oil, nuclear: Wind, sun:
• Cost of Supply– Coal, oil, nuclear: Wind, Sun:
• The Cost of Unserved Energy– Energy Security; what is the cost of being out of action?
• For a business; for a homeowner who doesn’t know they are off?
– R75 per kWh• Nuclear Waste Management
(c) My Power Station Technology 2012 10

Donor Assistance Risks (DAR)
• What are the risks?– Dependence on outside funding– If the exchange rate weakens, repayments get
higher– Little capacity building– An expected “repayment” for donor assistance
• What chance is there that we can build our future infrastructure needs without DAR?
(c) My Power Station Technology 2012 11
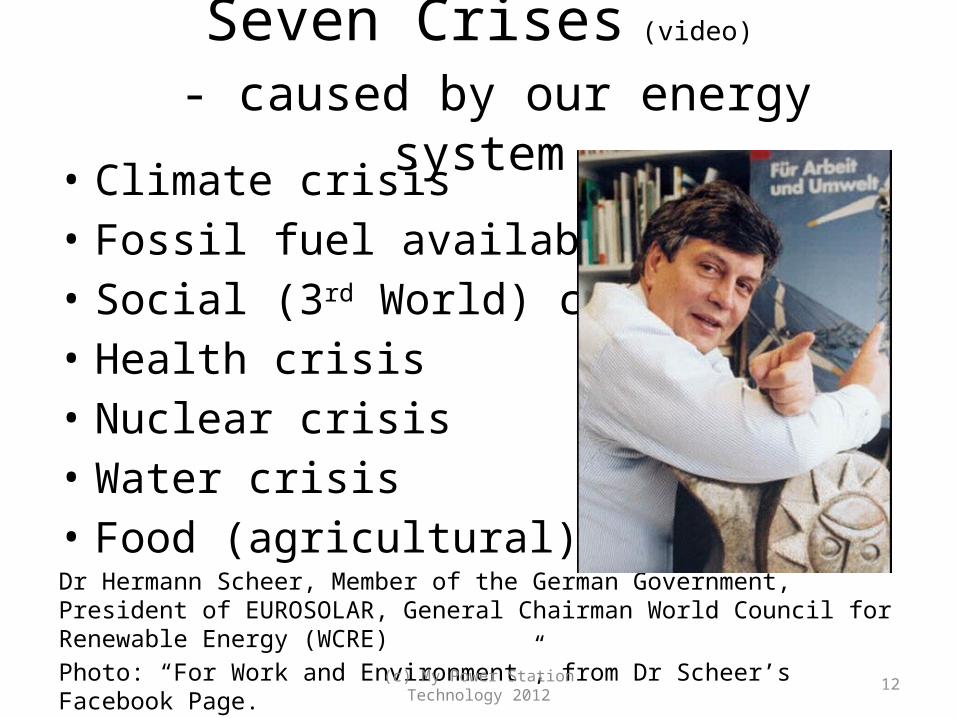
Seven Crises (video)
- caused by our energy system• Climate crisis• Fossil fuel availability crisis• Social (3rd World) crisis• Health crisis• Nuclear crisis• Water crisis• Food (agricultural) crisisDr Hermann Scheer, Member of the German Government, President of EUROSOLAR, General Chairman World Council for Renewable Energy (WCRE)Photo: “For Work and Environment”, from Dr Scheer’s Facebook Page.
(c) My Power Station Technology 2012 12
Crises / Risks of the Fossilised Fuel IndustryDr Scheer at Retech Conference, February 2009, Las Vegas, USA
• [3rd world]:– 40 countries are unable to pay their energy bill– Their oil import bill is more than their total export
earnings• COP 17 and global treaties– How do we organise the technological revolution?– Which technological revolution happened as a
result of a global treaty? Not One!• We should do it because it is an advantage of
us(c) My Power Station Technology 2012 13

The [3rd world] My brackets ([])
• The so called “third world” is where the new empires are starting– Where development is happening
• The “third world”– Has population growth– Has resources• Most of the Developed World is stagnating
– Has growth potential• The Developed (1st) world– Stuck in an old paradigm?
(c) My Power Station Technology 2012 14

China’s 12th 5-year plan tabled in 2011• “Has a striking change from the past”• “From– A focus on investment-driven, high energy and
low-cost manufacturing”
• “To– Low-carbon industries, new energy, next
generation information technology and high-end manufacturing
– China’s goal is to achieve 15% global share of these industries, compared with 3% now (in 2011)”
(c) My Power Station Technology 2012 15
South Africa is still stuck here!Note that the Chinese quote comes from the NPC document! Page 69, NPC Plan 2020

BRICSBrazil, Russia, India, China, South Africa
• Page 69: NPC Report: “Brazil, China, India, Indonesia, South Korea and Russia will account for more than half of all global growth, growing by an average of 4.7% a year to 2025, by which time their share of global GDP will have grown from 36% to 45%.”– My Comment: [It is time for South Africa and Africa to
shed its association with its colonial masters, England, France, Germany, Portugal, Spain, and the USA, which are part of the dying Western Empire, and change to a much closer association with the Asian Tigers, BRICS (China (9.5%)), Indonesia, South Korea, and of-course the African Tigers: Ghana (13.5%) (2nd highest), Mozambique (7.2%), Ethiopia (7.5%), Nigeria (6.9%), Botswana (6.2%), South Africa (3.4%). 36 Africa countries growing faster than the RSA.
– Qatar (18.7%), India (7.8%), Russia (4.3%), Brazil (2.8%), Germany (2.7%), USA (1.5%), UK (1.1%), Portugal (-2-2%), Greece (-6%)]
– Growth rates in % are net growth after inflation.(c) My Power Station Technology 2012 16

The “Downturn”
• Is it possible that we’re creating it ourselves?– By focusing on cost savings instead of growth?
• Just something to think about– I’m not saying we’ve created our recession, but I
wonder if its in our minds, as a self-fulfilling prophesy
– Also in South Africa:• One has to do the same thing over and over again• A huge waste of resources, time and energy
(c) My Power Station Technology 2012 17

What’s electricity for anyway?• It’s like ICT, except ICT depends on Electricity
• It’s an enabler to get the country moving• Fast, cheap, reliable pathways from a to b will
get our economy going– Communications (Infrastructure)– Electricity, Population Growth, Resources• David Murrin: “Breaking the Code of History”
• Can the “Energy Internet” finally happen?– Thomas Friedman in “Hot, Flat and Crowded”
(c) My Power Station Technology 2012 18
The Numbers• How to understand the really big numbers?
• Should we think differently?– Do we need cars? How many? What sort? Can
they be shared?– Do people need to go to work or can they
telework?– Should our systems stay centralised or can they be
decentralised– How would we design the system if there was no
coal or nuclear energy?(c) My Power Station Technology 2012 19

News on 15th May 2012• “Work to begin on 68km R5.2 billion
(R5,200,000,000) railway line to supply Majuba Power Station with 14 million tons of Coal per annum”– http
://www.engineeringnews.co.za/article/work-on-r52bn-majuba-rail-line-to-begin-in-nov-eskom-2012-05-14
• R100 billion being spent on new coal mines• At least R2 Trillion on New Power Stations
– & R166 bn on The Grid (Eskom Transmission Plan)
• 5,000 x 1,200 kWh per month houses can be permanently “removed” from the grid per R1bn, so R2 Trillion is at least 10 million houses
(c) My Power Station Technology 2012 20

R2.3 trillion
R2,300,000,000,000• Repayments– At 10% over 20 years– R23,000,000,000 per month• R23 billion per month is what the people of South
Africa will be paying for their new electricity fleet if we follow the old 20th Century technology path
– 50 million people; 7 million taxpayers• R3,285 per taxpayer per month
– for capex repayments only
(c) My Power Station Technology 2012 21
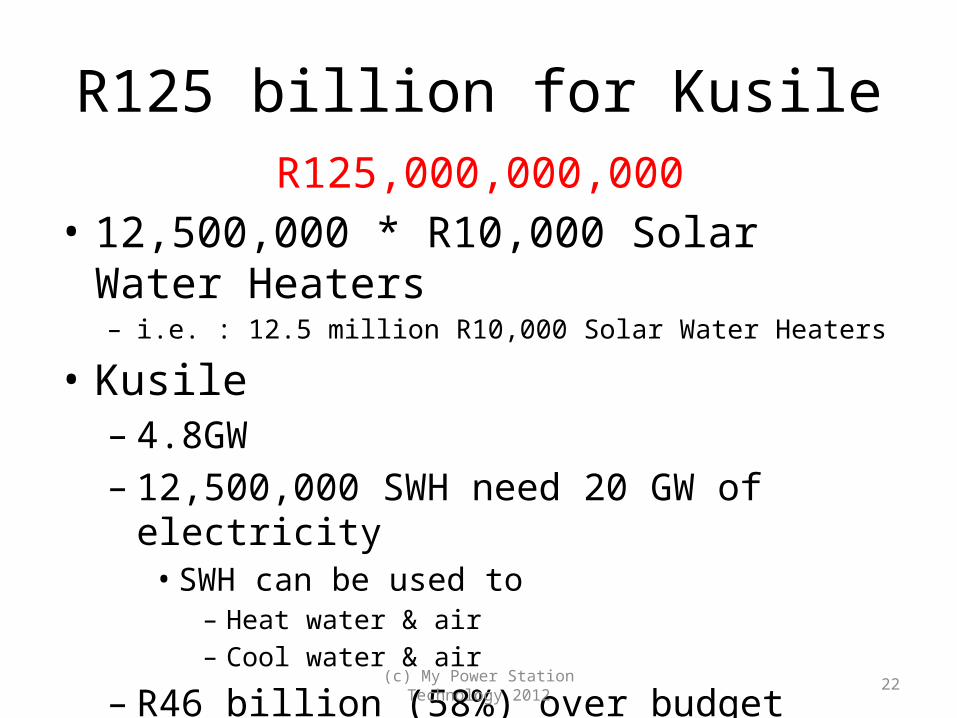
R125 billion for KusileR125,000,000,000
• 12,500,000 * R10,000 Solar Water Heaters– i.e. : 12.5 million R10,000 Solar Water Heaters
• Kusile– 4.8GW– 12,500,000 SWH need 20 GW of electricity• SWH can be used to
– Heat water & air– Cool water & air
– R46 billion (58%) over budget already
(c) My Power Station Technology 2012 22
Money
• Existing or New?• Can’t we use existing money to finance our
new build?
(c) My Power Station Technology 2012 23
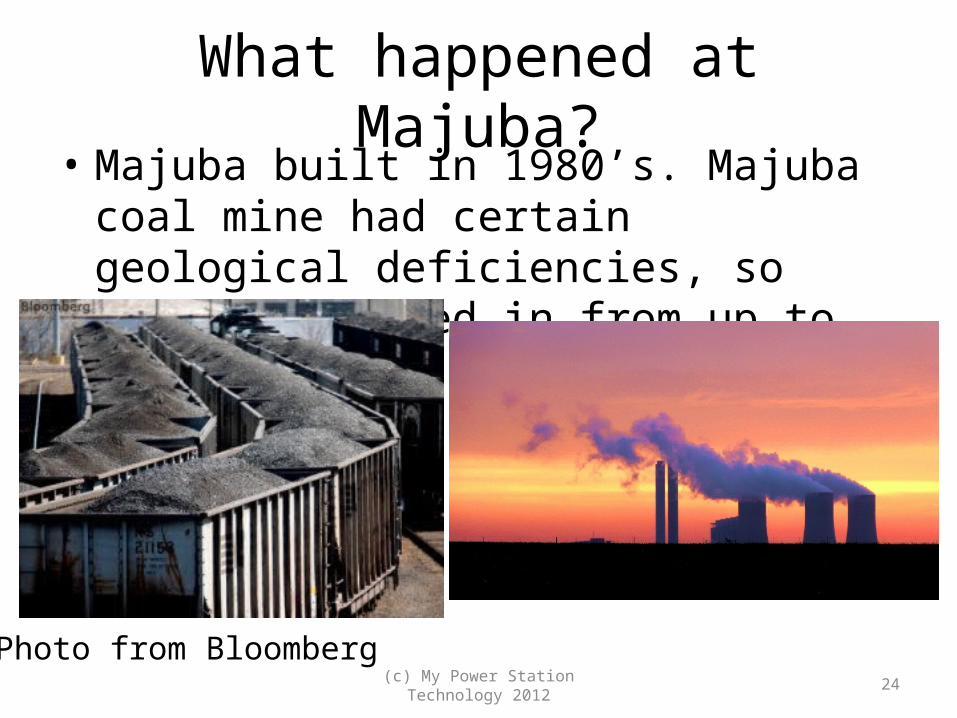
What happened at Majuba?• Majuba built in 1980’s. Majuba coal mine had
certain geological deficiencies, so coal is trucked in from up to 68 km away.
(c) My Power Station Technology 2012 24
Photo from Bloomberg
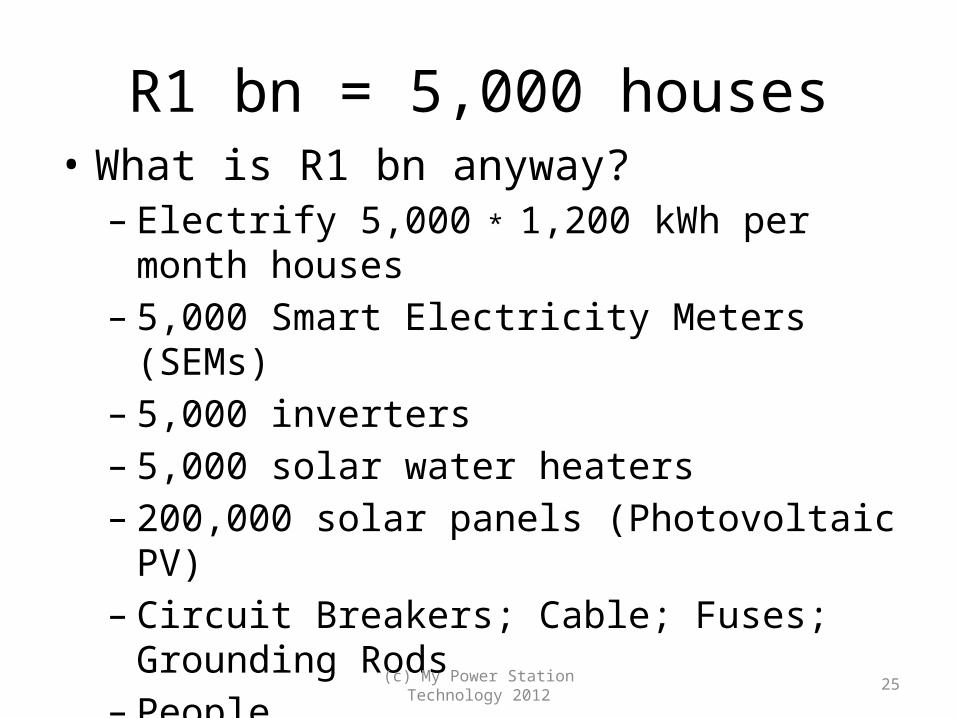
R1 bn = 5,000 houses• What is R1 bn anyway?– Electrify 5,000 * 1,200 kWh per month houses– 5,000 Smart Electricity Meters (SEMs)– 5,000 inverters– 5,000 solar water heaters– 200,000 solar panels (Photovoltaic PV)– Circuit Breakers; Cable; Fuses; Grounding Rods– People• 250 installers per year for the PV• Manufacturers; designers; support people; etc
(c) My Power Station Technology 2012 25
And• Only govt loan guarantees are required– Supported by the Trevor Manuel and National
Planning Commission (NPC Plan 2030)• No subsidies• No government borrowing• No new regulations, in fact deregulation is
required• And best of all:– Electricity plus People plus Resources enables:• Clean Economic GROWTH -> more money for govt• Massive Employment
(c) My Power Station Technology 2012 26

News on 28th March 2012• President Jacob Zuma at the BRICS conference
seeking R1 trillion for the next 20 years infrastructure expansion program
• Other BRICS countries growing at 10% per annum after inflation; SA at 2%– 10% + 5% inflation = R450 billion this year!
• Does government need to borrow this R1 trillion with us citizens as surety?– 1 million new jobs; R1,000,000 debt per job!– 50 mil to 57 mil people by 2020: need 3.15 mil jobs!
• Is there a better way?(c) My Power Station Technology 2012 27

We’re in trouble!!• South Africa– No new base load power station build in the past
20 years– vs: China: 1 GW per week added to their grid!!!– China installed 18 GW of Wind in 2011; 40 GW
was installed worldwide. Zero in South Africa• Can you see where South Africa’s going?• New Coal Power Stations: only 10 GW– Electricity is already sold!!– 10.5 GW will be decommissioned in 2020’s
(c) My Power Station Technology 2012 28

Electricity Build and Decommissioning
(c) My Power Station Technology 2012 29
From White Paper on Renewable Energy, 2003
2008 Load Shedding
Spare Capacity
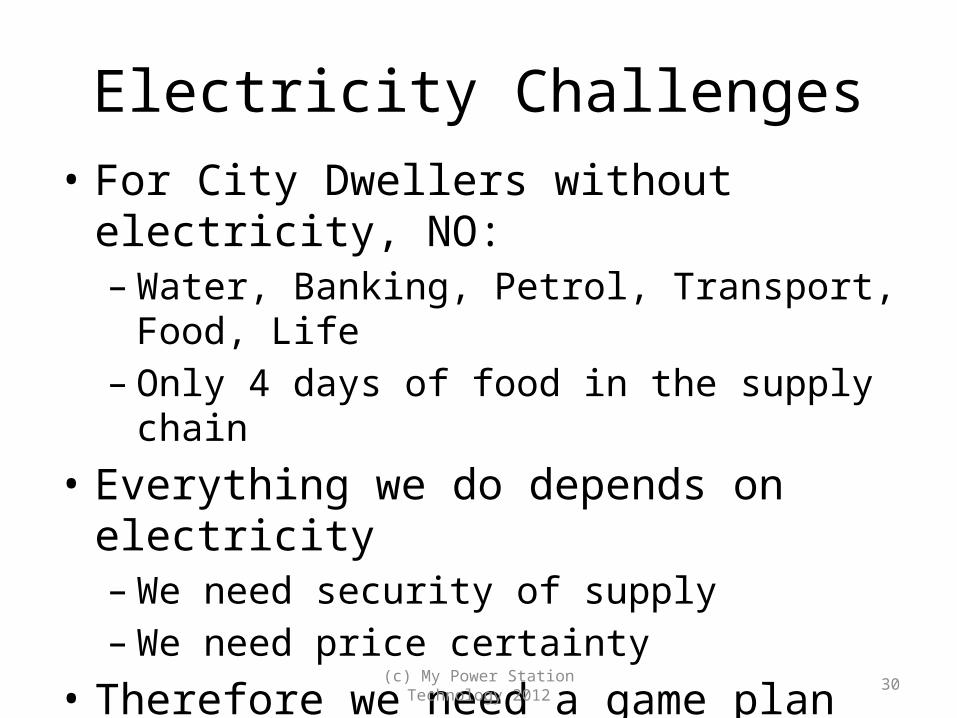
Electricity Challenges• For City Dwellers without electricity, NO:– Water, Banking, Petrol, Transport, Food, Life– Only 4 days of food in the supply chain
• Everything we do depends on electricity– We need security of supply– We need price certainty
• Therefore we need a game plan to make this a reality
(c) My Power Station Technology 2012 30
Agenda• Generating Electricity & Assumptions ✔• Electricity and Infrastructure Challenges ✔• Some Questions• Our Environment– We live in Exponential Times
• Electricity & “The Grid”– Can we rely on it?– Can we make it ourselves cost effectively?
• How to get going?• Q&A
(c) My Power Station Technology 2012 31

Some Questions• http://www.surveymonkey.com/s/NetMeterin
g-2012-12-22
• If you could make your own electricity cheaper than you could buy it, would you want to do this?
• Do you know what Net Metering is?• Do you want to make money and conserve the environment?
(c) My Power Station Technology 2012 32

The Big Energy Myth• From Dr Hermann Scheer’s Book “The Solar
Economy” pp 169 to 170– “Once the fear of the small scale has been dispelled,
once RE has demonstrated that it can replace fossil energy in its entirety, then the aura of the centralised nuclear/fossil industry will quickly fade. While fossil mythology remains unchallenged, humanity is faced with the absurd prospect of choosing death over a solution it is afraid to embrace. … Ordinary people are caught up in the myth of big technology … We need an active and engaged society” (another thing Trevor Manuel & the National Planning Commission calls for)
(c) My Power Station Technology 2012 33
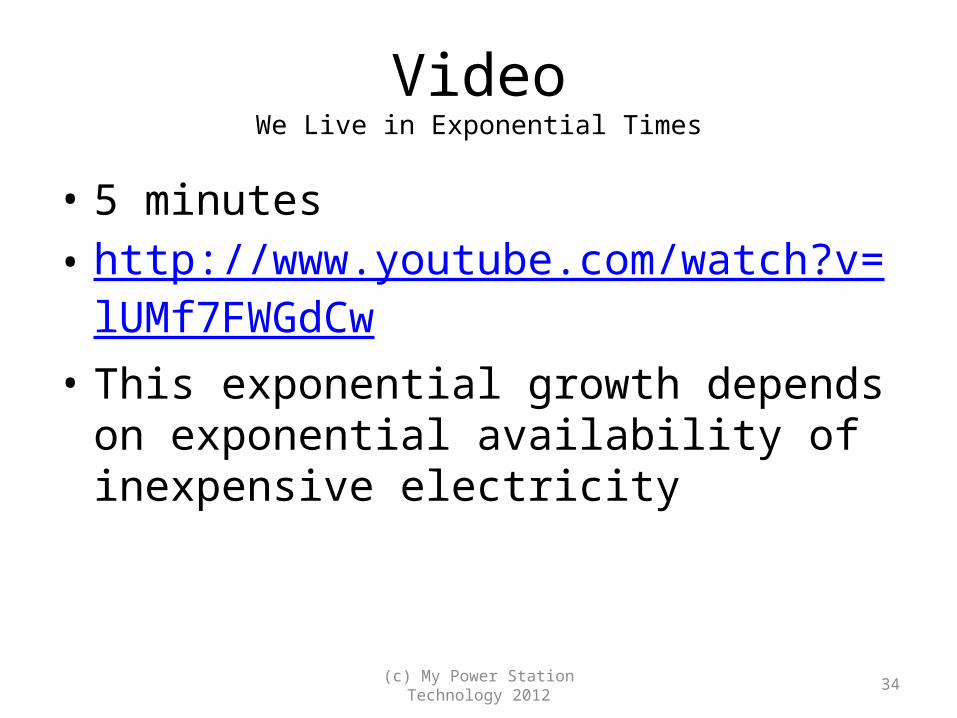
VideoWe Live in Exponential Times
• 5 minutes• http://www.youtube.com/watch?v=
lUMf7FWGdCw• This exponential growth depends on
exponential availability of inexpensive electricity
(c) My Power Station Technology 2012 34

Our Environment: GDP• World GDP Growth
(c) My Power Station Technology 2012 35

Our Environment: Wind
(c) My Power Station Technology 2012 36
In 2011 Capacity Installed: China 18GW; Doubled every year 2005 to 2009;Total Installed Wind Capacity Worldwide in 2011: 41,000 MW!World Wide Wind Total Installed Capacity: 238,000 MW (238 GW)

Our Environment• Photovoltaic (PV) Production
(c) My Power Station Technology 2012 37

What is PV?Photovoltaic Panels
(c) My Power Station Technology 2012 38

World Energy Growth Rates by SourcePercent Annual Average Growth
(c) My Power Station Technology 2012 39

Solar Insolation Map
(c) My Power Station Technology 2012 40
Germany: 2.4 ave peak sun hours per day; SA 5.9 (5 after derate factor)
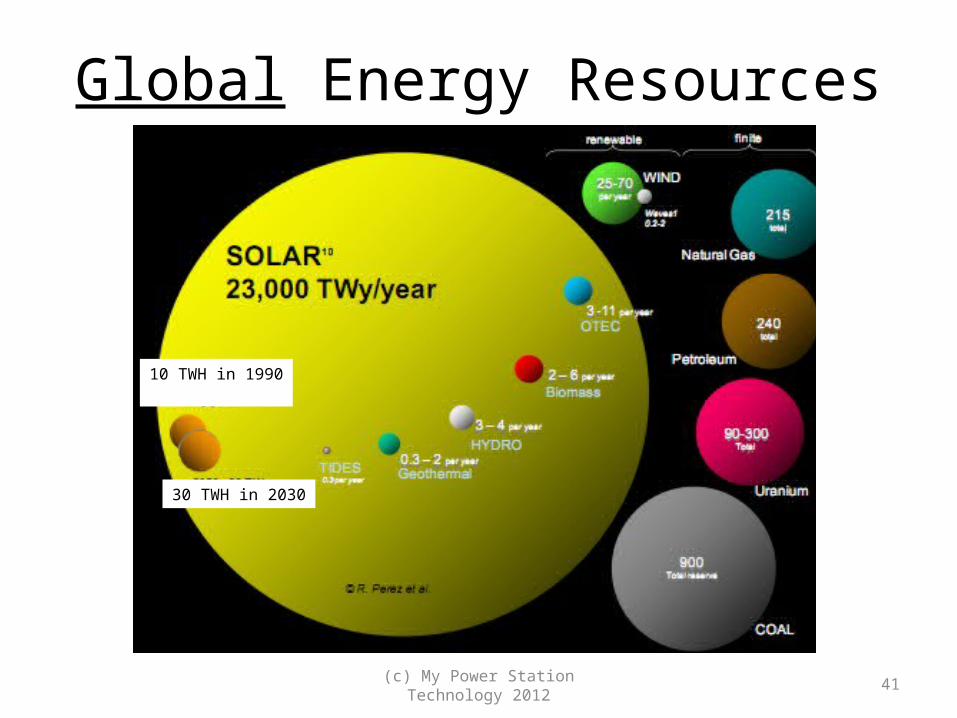
Global Energy Resources
(c) My Power Station Technology 2012 41
30 TWH in 2030
10 TWH in 1990

How long do we have?At 3% electricity consumption growth
(c) My Power Station Technology 2012 42
Agenda• Generating Electricity & Assumptions ✔• Electricity and Infrastructure Challenges ✔• Some Questions ✔• Our Environment ✔– We live in Exponential Times
• Electricity & “The Grid”– Can we rely on it?– Can we make it ourselves cost effectively?
• How to get going?• Q&A
(c) My Power Station Technology 2012 43

The Grid
(c) My Power Station Technology 2012 44
From Eskom AnnualReport 2009

Terminology• Grid Tie: an electrical system that is connected to the
government electricity grid• Reverse Feed / Embedded Generation: where someone
besides Eskom sells electricity to the Grid• Net Metering: where the consumer buys and sells
electricity at the same price• Feed In Tariff: where the Grid Operator / Utility pays the
“Embedded Generator” a higher rate to feed the grid• Time of Use Metering: where electricity is bought (and
sold) at different rates depending on grid demand (during off-peak, standard time, and peak-time, or in the future on a second by second basis)
• Inverter / Grid Tied Inverter: Changes DC to AC electricity• Island: allows a grid-tie inverter to operate during a power
failure, whilst isolating it from the grid(c) My Power Station Technology 2012 45
Buying and Selling Electricity
• Normally– We buy electricity• From Eskom• From the Cities, who buy from Eskom
• Now– We can produce electricity• We can use it ourselves• We can sell it to The Grid• We can sell it to our own customers!
(c) My Power Station Technology 2012 46

Producing Electricity (Energy) 1
• History– Before Electricity• Windmills; Pumps; Water-Mills; Steam
– “Base Load” (after electricity “invented”)• Coal, Nuclear, Hydro-electric (3)
– Now• Sun, wind, river, tide, ocean-current, geo-thermal (6)• Sun: PV, CSP, Tower, Solar Water Heating (+3)
– PV = Photovoltaics (like the leaves of a tree)– CSP = Concentrated Solar Power (with or without storage)
(c) My Power Station Technology 2012 47
Producing Electricity (Energy) 2
• History– Benefits and Costs• Base load electrical systems dramatically reduced our
costs and allowed the industrial revolution to happen• But this assumed unlimited, cheap, supply of
equipment and raw materials (coal, etc)• But: population growth and industrial growth have put
huge constraints on the systems• And: at the same time, maintenance costs have been
rising rapidly for power stations, transmission and distribution systems
(c) My Power Station Technology 2012 48

Reliability of equipment
• What happens when there is a problem?• Disruption in power supply– Unplanned and prolonged downtimes– Destruction of equipment– Sudden cut offs
• No proper shutdowns• Customer dissatisfaction/frustration
(c) My Power Station Technology 2012 49
Uni of Joburg talk at Transformer and SwitchGear ConferenceJoburg April 2012
Trust & Expectations
• Can we rely on the system?• Should we rely on the system?• What is “the system”?• We expect– The system to be up– Maybe we expect “load shedding” because of
what happened in 2008– Many private people and businesses installed
generators to give themselves security of supply(c) My Power Station Technology 2012 50

Opportunity to sell electricity
• To Cities, Eskom, other users• Especially at peak time– Average electricity cost to City of Cape Town is 55
cents per kwh– E.g.: Ankerlig near Atlantis produces 1,350 MW,
uses 25,000 litres of diesel per minute, at a cost of between R4 and R11 per kwh
– So, we can produce at R1.32 per kwh and sell at R3 per kwh!
(c) My Power Station Technology 2012 51

Why FITs? Why any kind of incentive?• Introduced in Germany in 1991– In 1993, the FIT was $1.34 per kWh– In 1993 Rands, this was R4.57 per kWh– In 2012 Rands, this was R11.32 per kWh– In 2001 in South Africa:• Per kWh: Domestic 24.59c; Manu and Mining 12.32c
• The FIT had three principles– The Utility must connect anyone to the grid– They must buy all the energy that is produced– They must buy at a fixed price for the length of the
contract, ie 15 to 20 years(c) My Power Station Technology 2012 52

So what did FITs do?• Brought down the cost of Renewable Energy• Note that the FIT contract is similar to the
contract the government signs with Eskom to build a power station– An agreement to buy a certain amount of
electricity– At a certain price– For a certain period of time
• There are “FITs” in our car production system– Government gives R5 billion of incentives to car companies annually– The Joule needs R9.5 billion. And South Africa would have its own
electrical car!
(c) My Power Station Technology 2012 53
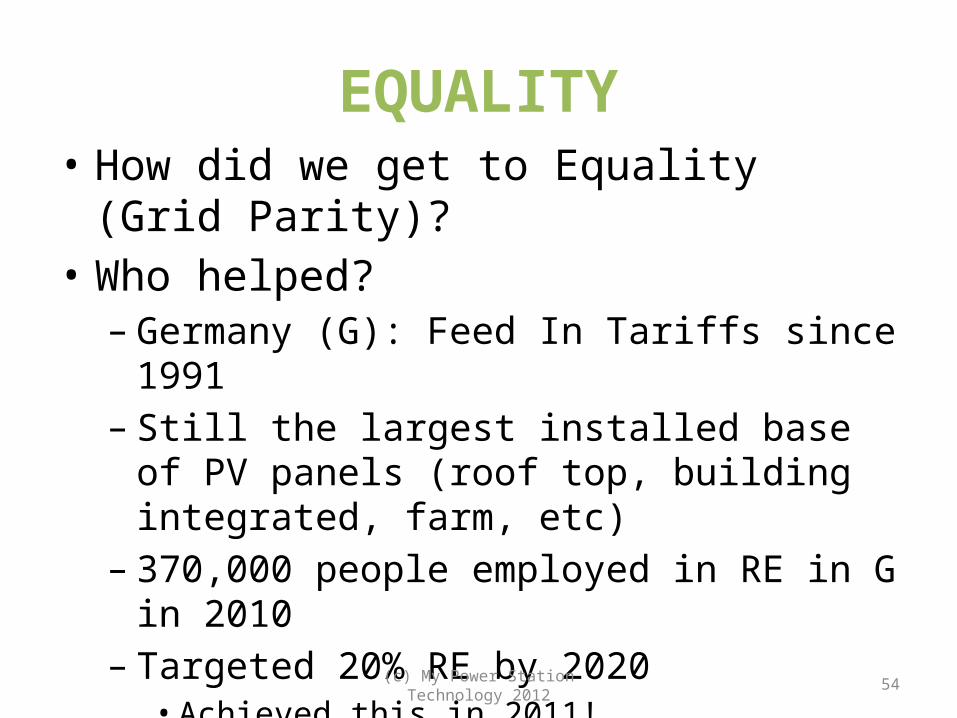
EQUALITY• How did we get to Equality (Grid Parity)?• Who helped?– Germany (G): Feed In Tariffs since 1991– Still the largest installed base of PV panels (roof
top, building integrated, farm, etc)– 370,000 people employed in RE in G in 2010– Targeted 20% RE by 2020• Achieved this in 2011!• Now targeting 35% by 2020• Solved the “Grid Destabilisation” problem in 2011
(c) My Power Station Technology 2012 54
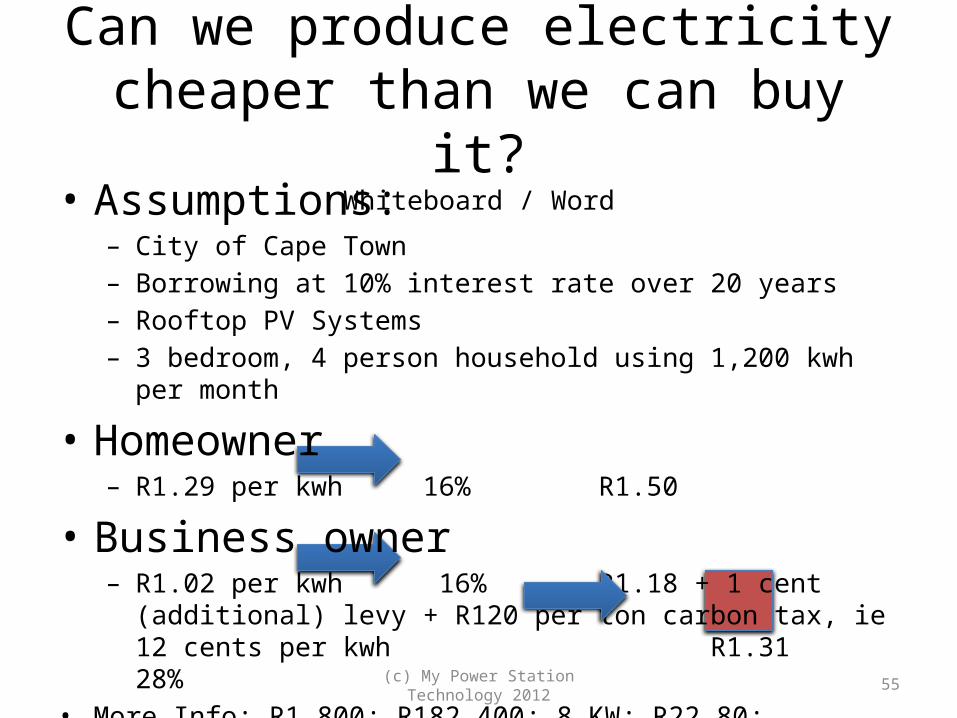
Can we produce electricity cheaper than we can buy it?
Whiteboard / Word• Assumptions:
– City of Cape Town– Borrowing at 10% interest rate over 20 years– Rooftop PV Systems– 3 bedroom, 4 person household using 1,200 kwh per month
• Homeowner– R1.29 per kwh 16% R1.50
• Business owner– R1.02 per kwh 16% R1.18 + 1 cent (additional) levy + R120 per
ton carbon tax, ie 12 cents per kwh R1.31 28%• More Info: R1,800; R182,400; 8 KW; R22.80; R182,400; R20 per watt?
How?(c) My Power Station Technology 2012 55

The real savings in being energy independent (kw vs kwh)
• If you spend R1m a year on electricity• And you can install your own system for
R900,000 per year• What would you prefer?
• If you buy your own system, then at 10% per annum over 20 years, the R900,000 equates to a capital cost of R7.5M
(c) My Power Station Technology 2012 56
The Cherry on Top
• Once you’ve paid off the system, it is YOURS• Your electricity cost doesn’t increase every
year …☞ … which means that you can plan for the future!
• And: you can save 65%+ of your electricity cost over 20 years
(c) My Power Station Technology 2012 57
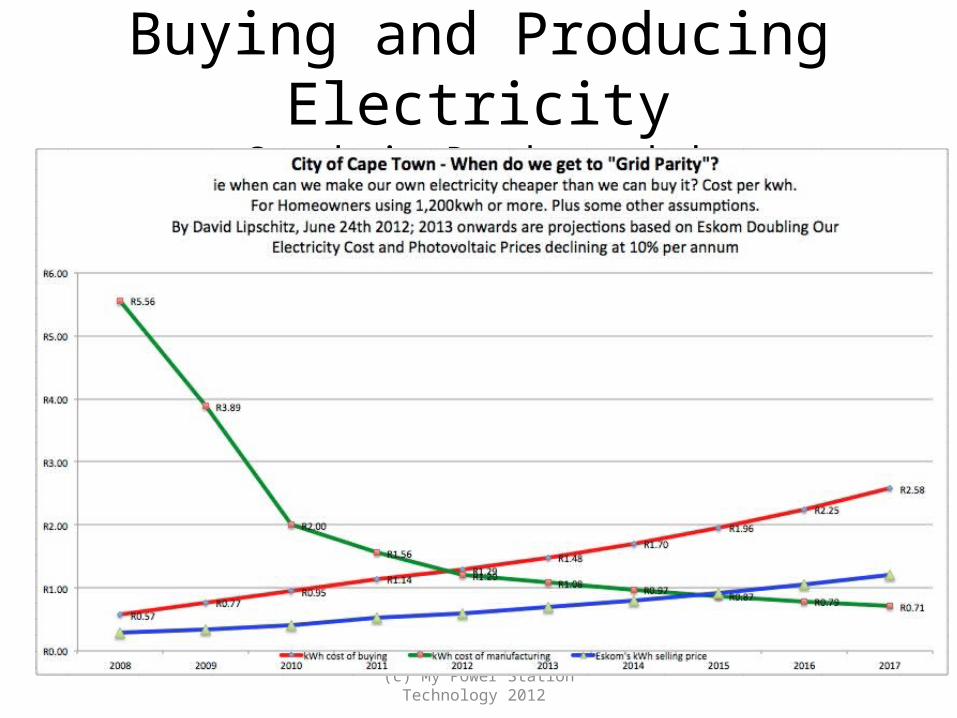
Buying and Producing ElectricityGraph in Rand per kwh
(c) My Power Station Technology 2012

Fix your price and save
(c) My Power Station Technology 2012 59

NegaWatts, not MegaWatts
(c) My Power Station Technology 2012 60
PV = Photovoltaic SystemEE = Energy Efficiency: Spend to saveER = Eskom ESCO Rebate (approximate)
NegaWatts = Negative Watts

Haven’t taken into account
• Potential sales to the City of Cape Town• Net Metering through the transformer• Retail Wheeling• Time of Use Tariffs• Carbon Credits• Eskom ESCO rebate• DR (Demand Response)
(c) My Power Station Technology 2012 61
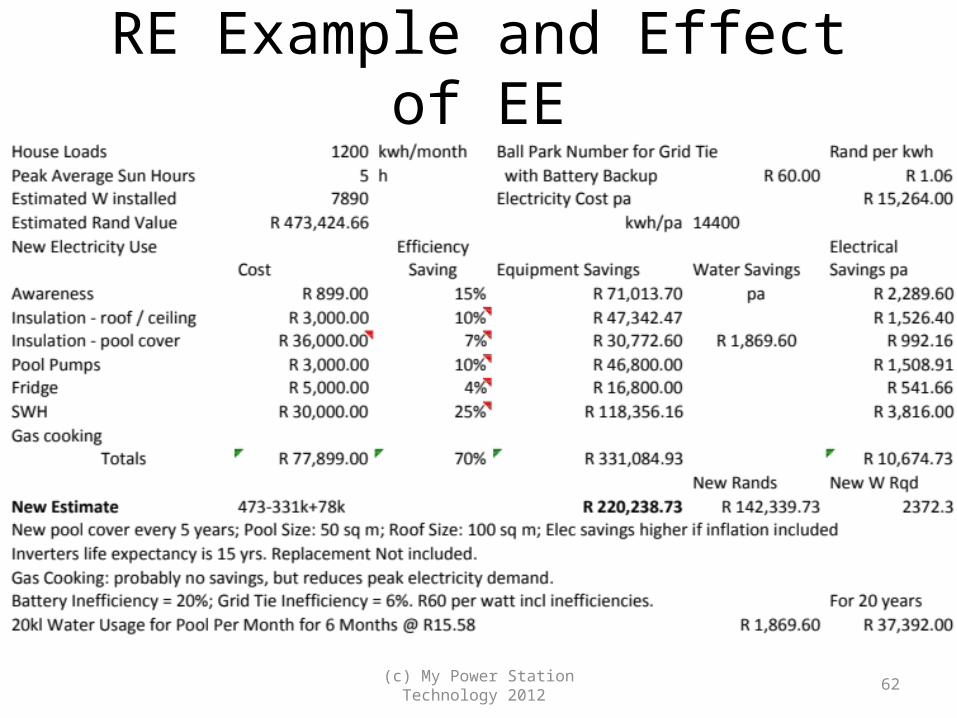
RE Example and Effect of EE
(c) My Power Station Technology 2012 62
But what about “Night”?• For Night and Cloudy Days we will need
batteries and we will need to import electricity from the CoCT, preferably at “off peak time”
• We also need to prevent reverse feed because the CoCT won’t allow Reverse Feed
• So we need “Islands” & Batteries & Behaviour Change
• AND we need Energy Efficiency• We can save up to 77% of our electricity
requirement – and Eskom has an incentive for this (c) My Power Station Technology 2012 63
Government and Citizens• Is making our own electricity legal?• “Embedded Energy” Generation Legislation
Already Exists• SABS: NRS 097-01-2010 (December, 2010)• NERSA: Embedded Generation (2011)• Waiting for:– Eskom adoption– City adoption– Business and Homeowner adoption
(c) My Power Station Technology 2012 64
Countries with Net Metering• 13 Countries + 42 USA States• More than 20 years experience– Were already running in 1991
• Government’s White Paper on RE – Nov 2003– “Government is committed to the introduction of
greater levels of competition in electricity markets– The production and distribution of energy should
be sustainable and lead to an improvement in standard of living of citizens
– Barriers to entry should be lowered”(c) My Power Station Technology 2012 65

How to get started?• “Mandelaton” CID– Community Improvement District
• Milnerton Proper; Woodbridge Island; Lagoon Beach; Joe Slovo / Phoenix; Sunset Beach
• Measure: 2,000 meters * R6,000 each installed– Incl, Voltage, Current, Peak Demand,– Can tell what’s running by looking at “profiles”– Can control Geyser– Can switch loads on and off (DSM and rebates)– Is Wireless, so user needs internet connection
• Design, Finance, Implement, Insure, Maintain(c) My Power Station Technology 2012 66

Mandelaton CES
(c) My Power Station Technology 2012 67
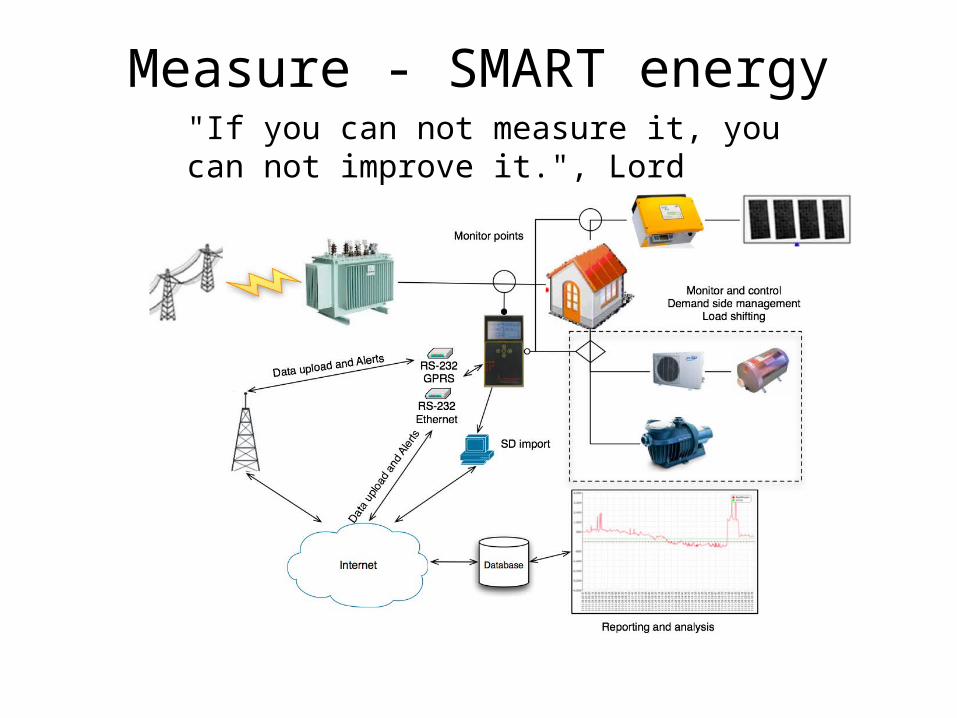
Measure - SMART energy"If you can not measure it, you can not improve it.", Lord Kelvin

What your electricity measurement should do
• Real time reporting• Onboard reporting• Long term data collection• RS-232 communication to
database via GSM, Wifi or Ethernet modules
• SMART control for geyser heating and pool pumps
• Load shifting and DR• SMART geyser element
management
Next Steps …• To get started with saving money on
electricity:• Please contact me, David Lipschitz, at:– 021 551 9935; 074 119 3246– [email protected]
(c) My Power Station Technology 2012 70

• End of presentation• The rest is for reference
(c) My Power Station Technology 2012 71

This is what a Renewable Energy System (without batteries) Looks Like …
(c) My Power Station Technology 2012 72
PV Array
CombinerBox
Grid Tie Inverter DB BoardMains
Utility
[Schematic excludes Grounding Systems; DC & AC Disconnect; Fuses; etc.]
Start here …

This is what a Renewable Energy System (with batteries) Looks Like …
(c) My Power Station Technology 2012 73
PV Array
CombinerBox
Solar Charge Controller Battery Bank
Inverter / Charger(Island System)
DB BoardMains
DB Board Backup Loads
Utility
[Schematic excludes Grounding Systems; DC & AC Disconnect; Fuses; etc.]
Start here …
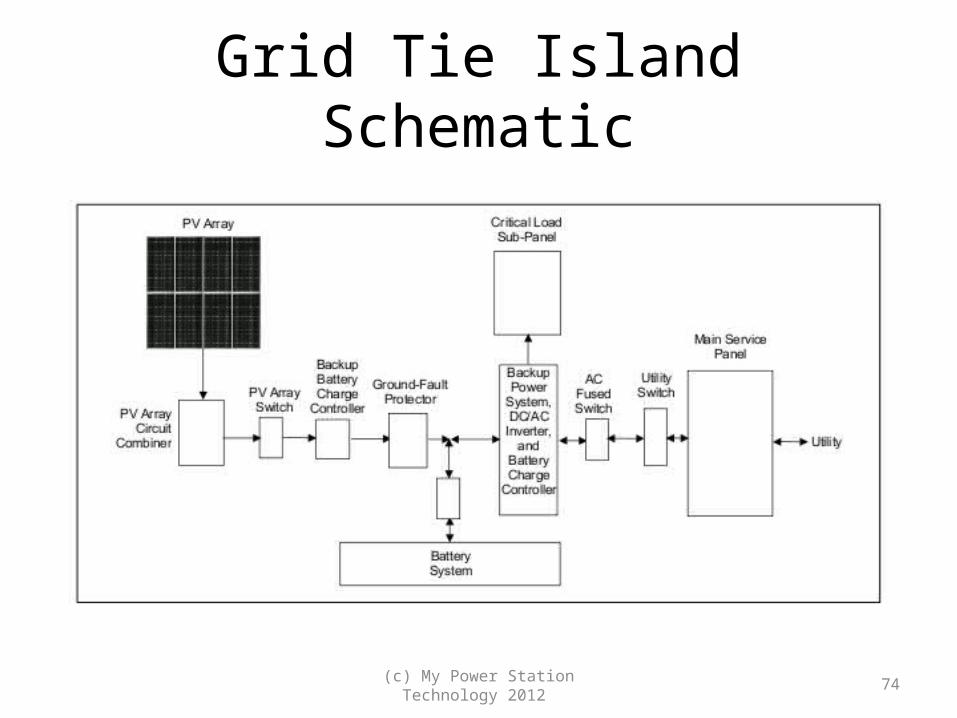
Grid Tie Island Schematic
(c) My Power Station Technology 2012 74
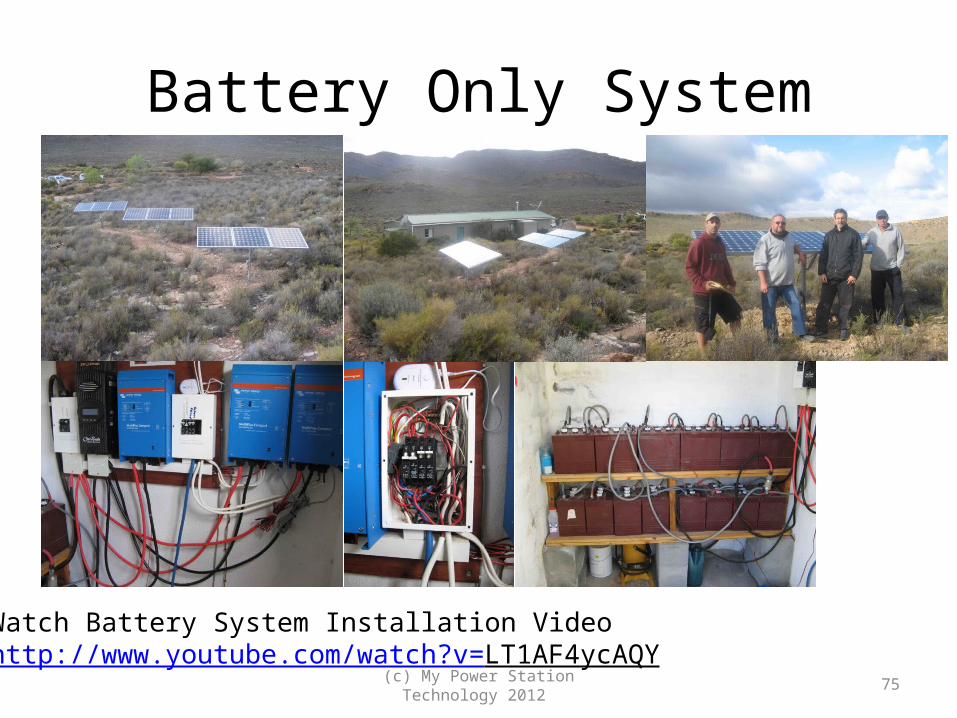
Battery Only System
(c) My Power Station Technology 2012 75
Watch Battery System Installation Videohttp://www.youtube.com/watch?v=LT1AF4ycAQY

David Lipschitz• BSc (Honours) MBA• My Power Station Technology cc: Energy Expert, Software Developer• Grid-Tied Photovoltaics Course: Feb 2009, Phoenix, AZ, USA• NABCEP Level 1 Certification
– North American Board of Certified Energy Practitioners
• Additional related technical training• Spoke / Chaired Energy Efficiency conference 2010• Spoke at Various other Energy Conferences• Presented in Parliament re. Climate Change Hearings• Presented to Parliament re. IRP2010 Hearings• Presented at Powering Africa Strategy Summit in November 2011• Contact Details:
– 021 551 9935– 074 119 3246– [email protected]
(c) My Power Station Technology 2012 76

Designs• We charge R6,800 plus VAT for a design for a private houses and for systems up to 10KW.
Above 10 KW we charge R50,000 plus VAT, excludes EIAs, Engineering or Architect Fees.• Why we charge for designs?
– A design includes a site visit, a formal design with a parts list, an Efergy electricity meter so that the client can become aware of their electricity use and reduce it, and an energy efficiency exercise
– If the client buys a system from us and the value of the system is over R80,000, we discount their installed price by the fee.
– This is fair as the design requires experience and designs in IT, Architecture, etc, aren’t free. Designs can take up to 3 days. All prices and equipment needs to be checked. If we do 10 designs and then someone buys from us, we need to constantly increase the prices of the systems to recover our sales cost investment; this means that we either go out of business or run at a loss, which isn’t in our or our clients bests interests
– We need to recover our educational investment of over R2 million so far in ensuring that we install systems that meet electricity needs, are properly grounded, cable sizes are correct, the proper circuit breakers and fuses are used, etc. At the moment we follow the USA NEC article 690 RE guidelines as far as possible as there aren’t guidelines in South Africa, although there are DC guidelines.
– Update November 2011: NERSA have published RFD Embedded Generation which refers to NRS 097-2-1:2010 (Grid Interconnection Of Embedded Generation). We are now waiting for implementation by Eskom and the Cities.
(c) My Power Station Technology 2012 77
Research
(c) My Power Station Technology 2012 78

Do wind turbines kill birds?
(c) My Power Station Technology 2012 79
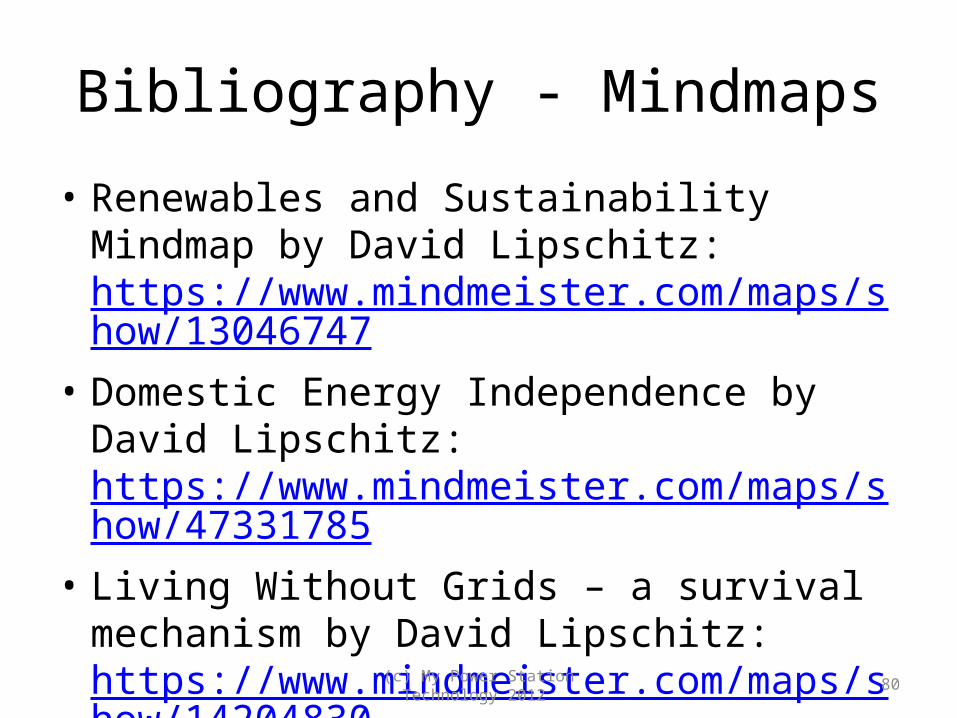
Bibliography - Mindmaps
• Renewables and Sustainability Mindmap by David Lipschitz: https://www.mindmeister.com/maps/show/13046747
• Domestic Energy Independence by David Lipschitz: https://www.mindmeister.com/maps/show/47331785
• Living Without Grids – a survival mechanism by David Lipschitz: https://www.mindmeister.com/maps/show/14204830
(c) My Power Station Technology 2012 80

Project Video and Example
• Gecko Rock– Specification:
http://mypowerstation.co.za/2010/09/16/my-power-station-completes-installation-of-power-station-at-gecko-rock-press-release-16th-september-2010/
– Video: http://www.youtube.com/watch?v=LT1AF4ycAQY
(c) My Power Station Technology 2012 81
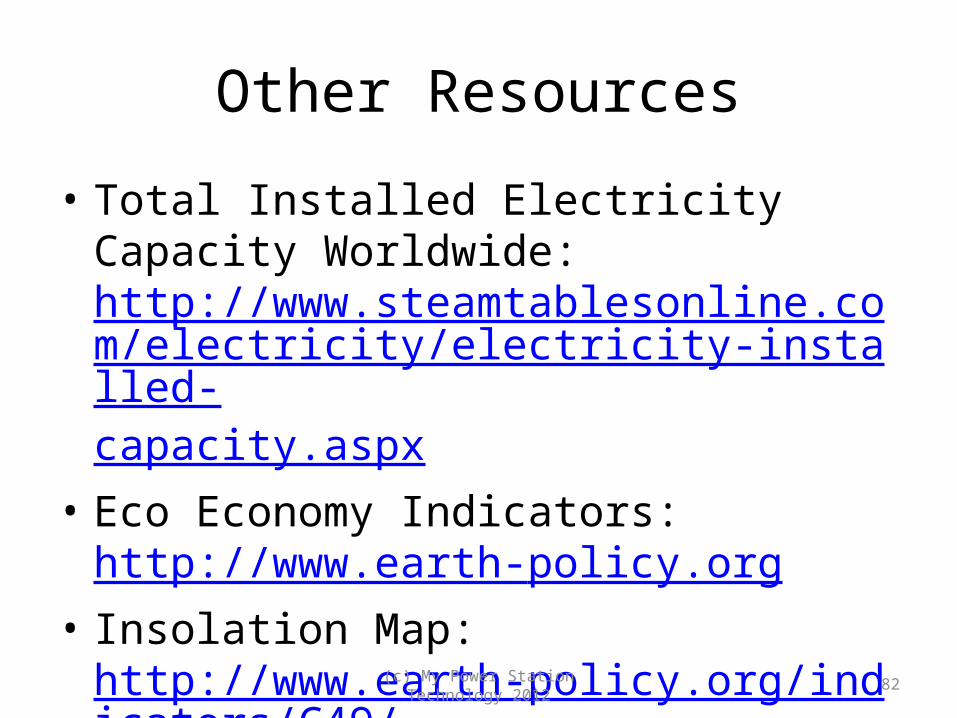
Other Resources
• Total Installed Electricity Capacity Worldwide: http://www.steamtablesonline.com/electricity/electricity-installed-capacity.aspx
• Eco Economy Indicators: http://www.earth-policy.org
• Insolation Map: http://www.earth-policy.org/indicators/C49/wind_power_2012
(c) My Power Station Technology 2012 82

Other Resources
• Books– Hot, Flat and Crowded by Thomas Friedman• 2008
– Bending the Curve by Robert Zipplies• 2008
– Screw Business as Usual by Richard Branson• 2011
– Breaking the Code of History by David Murrin• 2010
(c) My Power Station Technology 2012 83