cluster analysis in loss development
TRANSCRIPT

Cluster Analysis in Loss DevelopmentDave Clark
Munich Reinsurance America, Inc.
17 October 2018

Cluster Analysis in Loss DevelopmentDave Clark
Munich Reinsurance America, Inc.
17 October 2018

Agenda
1. Introduction
2. How to find clusters:
a) Cluster analysis
b) Principal Component Analysis (PCA)
c) Data transformation (curve fitting)
3. Practical considerations and observations
3

Introduction
Clustering
Clustering is about finding groups in a set of objects
– The objects in a group should be similar and groups should be different from each other
– No need to define the groups in advance (i.e. unsupervised learning)
– Essential to assess the usefulness and meaning of the identified groups
Original data Two clusters
4
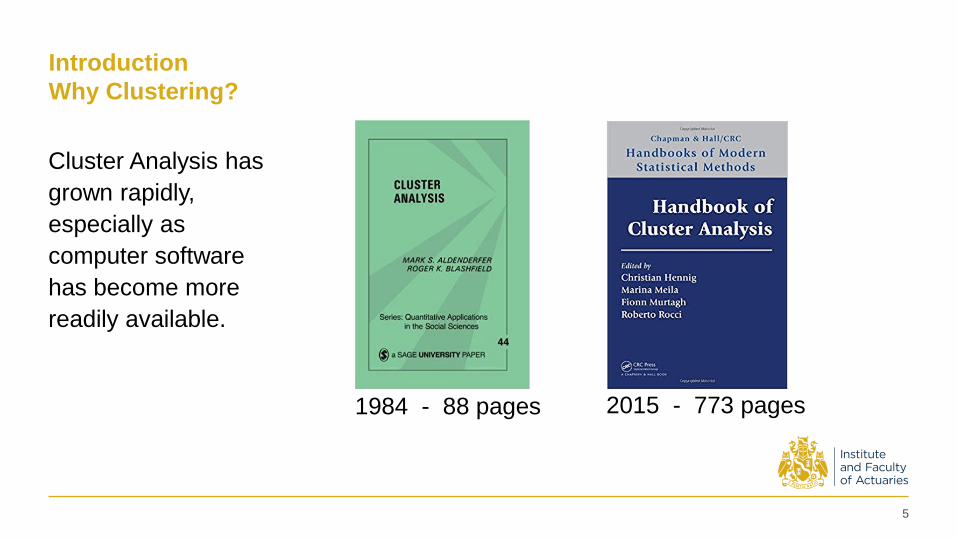
Introduction
Why Clustering?
Cluster Analysis has
grown rapidly,
especially as
computer software
has become more
readily available.
1984 - 88 pages 2015 - 773 pages
5

Introduction
Why Clustering?
What questions could be answered with cluster analysis?
» Test the data homogeneity
» Find a benchmark
» Identify drivers of development
What kind of data can be clustered?
• Segments, contracts or claims
• County or Region
• Loss development patterns, loss ratios, severity, frequency…
6

Introduction
How to Find Clusters?
Exploratory Data Analysis
• Cluster analysis
• Principal Component Analysis (PCA)
• Data transformation (curve fitting)
7

Introduction
Schedule P (Annual Statement) Example
PPAL
MedMal
WC
Co. 24 36 48 60 72
1 2.01 1.24 1.21 1.12 1.06
2 2.05 1.29 1.16 1.07 1.00
3 1.20 1.09 1.05 1.03 1.01
4 1.15 1.04 1.01 1.01 1.00
5 1.34 1.14 1.07 1.04 1.02
6 1.28 1.14 1.06 1.04 1.02
…
Co. Line Ownership Geographic Distribution
1 MedMal Mutual Regional Direct, Ind Agency
2 MedMal Stock National Direct, Ind Agency
3 PPAL Stock National MGA, Ind Agency
4 PPAL Stock Regional Ind Agency
5 WC Stock National MGA
6 WC Mutual Regional Ind Agency
…
8

Introduction
Where to Start?
Explanatory VariablesVariables used for
clustering, PCA, …
Co. Line Ownership Geographic Distribution 24 36 48 60 72
1 MedMal Mutual Regional Direct, Ind Agency 2.01 1.24 1.21 1.12 1.06
2 MedMal Stock National Direct, Ind Agency 2.05 1.29 1.16 1.07 1.00
3 PPAL Stock National MGA, Ind Agency 1.20 1.09 1.05 1.03 1.01
4 PPAL Stock Regional Ind Agency 1.15 1.04 1.01 1.01 1.00
5 WC Stock National MGA 1.34 1.14 1.07 1.04 1.02
6 WC Mutual Regional Ind Agency 1.28 1.14 1.06 1.04 1.02
… …
9

Cluster Analysis
How to Find Clusters?
Exploratory Data Analysis
• Cluster analysis
• Principal Component Analysis (PCA)
• Data transformation (curve fitting)
10

Cluster Analysis
Types of Clustering
Types of clustering algorithms
– Hierarchical vs. Partitioned
– Hard vs. Soft (ex: K-means vs. Fuzzy C-means)
– Complete vs. Partial
– Density Based Clusters (ex: DBSCAN)
K-means partitions the data in a user-specified number of clusters (K), in which
each observation belongs to the cluster with the nearest mean.
11

Cluster Analysis
Schedule P example: Cluster AnalysisK-means K-means K-medoids
LOB 2 clusters 3 clusters 3 clusters
MedMal 1 1 1
MedMal 1 1 1
MedMal 1 2 1
MedMal 1 1 1
MedMal 1 2 1
MedMal 1 2 1
PPAL 2 3 2
PPAL 2 3 2
PPAL 2 3 2
PPAL 2 3 2
PPAL 2 3 2
PPAL 2 3 2
WC 2 3 3
WC 2 3 3
WC 2 3 3
WC 2 3 3
WC 2 3 3
WC 2 3 3
PPAL
MedMal
WC
12

Cluster Analysis
Too Many Dimensions
12 24 36 48 60 72
5.70 2.01 1.24 1.21 1.12 1.06
3.86 2.05 1.29 1.16 1.07 1.00
1.92 1.20 1.09 1.05 1.03 1.01
1.64 1.15 1.04 1.01 1.01 1.00
2.19 1.34 1.14 1.07 1.04 1.02
2.33 1.28 1.14 1.06 1.04 1.02
…
Difficulty visualizing more than two
dimensions for validation purposes
13

Cluster Analysis
Too Many Dimensions
Data gets “lost in space”Randomly generated 100 points in 1D and 2D
“In high dimension spaces, distances between points become relatively uniform.”
The performance of clustering algorithms relying on L1 (sum of absolute values) or
L2 (Euclidian) metrics in high dimensional data may be compromised. Source: M. Steinbach, L. Ertoz, V. Kumar, “The Challenges of Clustering High Dimensional Data” [7]
14

PCA
How to Find Clusters?
Exploratory Data Analysis
• Cluster analysis
• Principal Component Analysis (PCA)
• Data transformation (curve fitting)
15
PCA
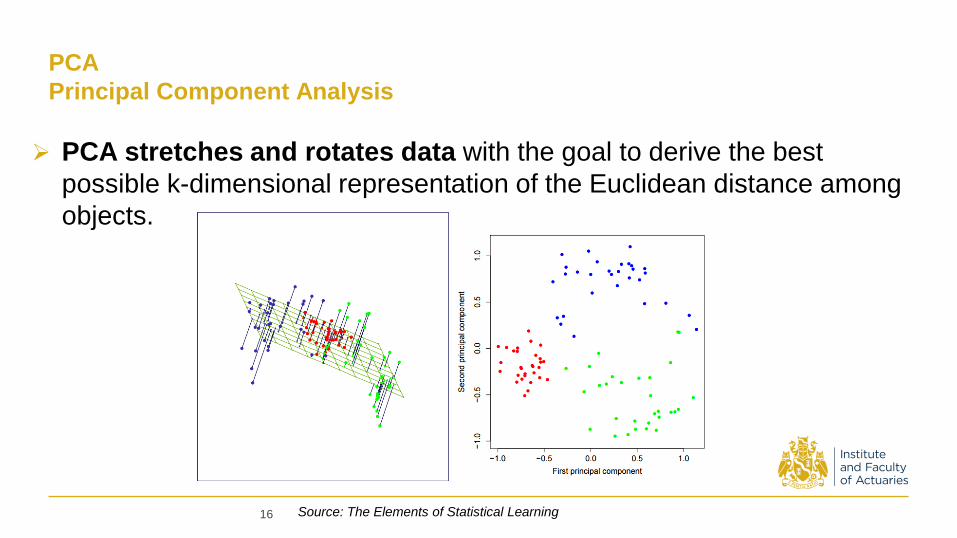
Principal Component Analysis
Source: The Elements of Statistical Learning
PCA stretches and rotates data with the goal to derive the best
possible k-dimensional representation of the Euclidean distance among
objects.
16
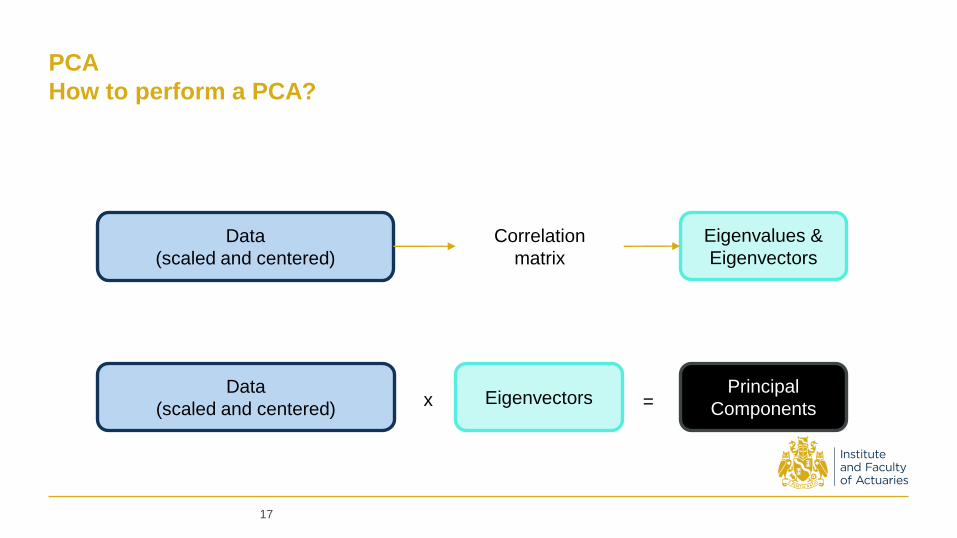
PCA
How to perform a PCA?
Data
(scaled and centered)
Correlation
matrix
Eigenvalues &
Eigenvectors
Principal
Componentsx =
Data
(scaled and centered) Eigenvectors
17

PCA
Interpretation
PCA provides an opportunity for interpretation
PC1 captures the mean loss development
PC2 indicates a change in the loss curve shape
x =
Co 24 36 48 60 72
1 0.99 0.46 2.07 2.18 1.43
2 1.08 0.89 1.17 0.66 -1.04
3 -0.83 -0.82 -0.75 -0.60 -0.78
4 -0.94 -1.30 -1.39 -1.14 -0.96
…
Dim 1 2
24 0.47 -0.39
36 0.46 -0.38
48 0.49 -0.12
60 0.46 0.36
72 0.34 0.75
Co PC1 PC2
1 3.18 1.04
2 1.45 -1.44
3 -1.67 -0.07
4 -2.57 -0.10
…
Principal
Componentsx =
Data
(scaled and centered) Eigenvectors
18

PCA
Interpretation
19

PCA
Schedule P example: Visualization
20

PCA
Explanatory Variables
Explanatory Variables
Co. Line Ownership Geographic Distribution 24 36 48 60 72
1 MedMal Mutual Regional Direct, Ind Agency 2.01 1.24 1.21 1.12 1.06
2 MedMal Stock National Direct, Ind Agency 2.05 1.29 1.16 1.07 1.00
3 PPAL Stock National MGA, Ind Agency 1.20 1.09 1.05 1.03 1.01
4 PPAL Stock Regional Ind Agency 1.15 1.04 1.01 1.01 1.00
5 WC Stock National MGA 1.34 1.14 1.07 1.04 1.02
6 WC Mutual Regional Ind Agency 1.28 1.14 1.06 1.04 1.02
… …
21
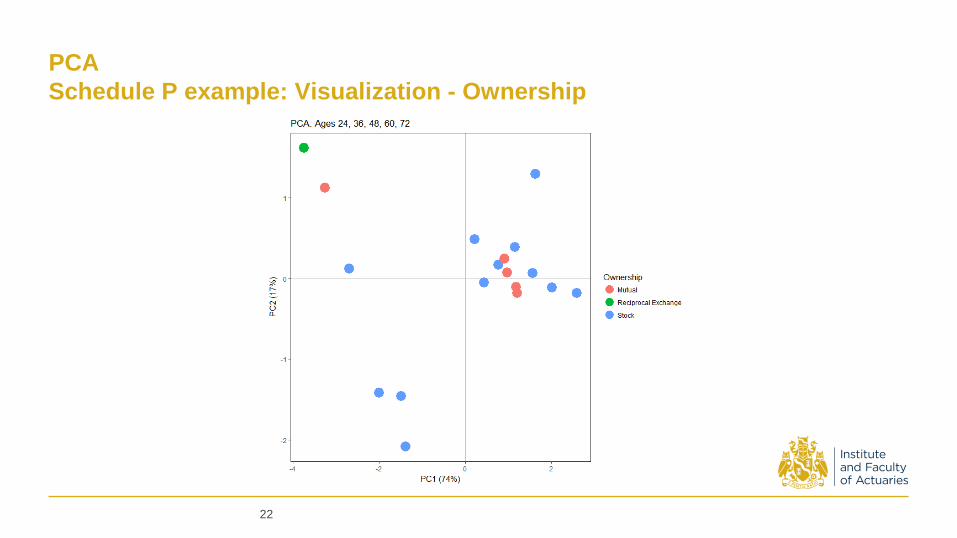
PCA
Schedule P example: Visualization - Ownership
22

PCA
Schedule P example: Visualization - LOB
23

Data Transformation
How to Find Clusters?
Exploratory Data Analysis
• Cluster analysis
• Principal Component Analysis (PCA)
• Data transformation (curve fitting)
24

Data Transformation
Sherman Curve
Sherman proposed a curve that fits to the typical LDF pattern
𝐴𝑇𝐴𝑡 = 1 +𝑆𝑐𝑎𝑙𝑒
𝑡 + 𝑐
𝑆ℎ𝑎𝑝𝑒
25

Data Transformation
How to estimate the parameters?
Sherman recommends estimating the parameters by using log-linear
regression
All actual age-to-age factors must be strictly greater than 1
Fitting a logged value rather than actual amounts
GLM to the rescue!
Apply GLM with log-link on actual data
26

Data Transformation
Pros & Cons
Allows comparison of loss development patterns of different sizes
Does not work well for flat curves
The focus is on the fit and not on maintaining the distances between points
27

Data Transformation
Schedule P example: Sherman curve
PPAL
MedMal
WC
28

Practical Considerations
How Many Clusters Do You See?
29

Practical Considerations
The Coins Experiment
30

Practical Considerations
Clustering Illusion
“The predisposition to detect patterns and make connections is what
leads to discovery and advance. The problem, however, is that this
tendency is so strong and so automatic that we sometimes detect
patterns when they do not exist.”
T. Gilovich, “How We Know What Isn't So - The Fallibility of Human Reason in Everyday Life”
31

Practical Considerations
Correlations between lines of business
Compare the first principal component for two different lines, written by the same
company
Schedule P data for loss reserving posted on the CAS website
54 companies with CAL and GL lines
20 companies with WC and GL lines
Data is from 1988 to 1997
Check if historical dependency is preserved in more recent years
32

Practical Considerations
First principal component for WC/GL
1988 - 1997
PCA on Reported loss
1998 - 2007
33

Practical Considerations
First principal component for CAL/GL
1988 - 1997
PCA on Reported loss1998 - 2007
34

Conclusion
Key Takeaways
Clustering techniques help us obtain a better understanding of the loss
development:
– Explore the structure of data
– Go beyond “just” practical grouping of data
– Identify variables impacting the development
Each method has strengths and weaknesses
– Look for robustness between methods
35

Selected References
1. D. Clark (2017) Estimation of Inverse Power Parameters via GLM, Actuarial Review, May-June 2017 , https://ar.casact.org/estimation-of-inverse-
power-parameters-via-glm/
2. T. Hastie, R. Tibshirani, J. Friedman (2009) The Elements of Statistical Learning - Data Mining, Inference, and Prediction, Springer
https://web.stanford.edu/~hastie/Papers/ESLII.pdf
3. C. Hennig (2015) Clustering strategy and method selection, In C. Hennig, M. Meila, F. Murtagh, and R. Rocci (Eds.). Handbook of Cluster
Analysis. Chapman and Hall/CRC, http://www.homepages.ucl.ac.uk/~ucakche/
4. C. Hennig, M.Meila, F. Murtagh, R.Rocci (2017) Handbook of Cluster Analysis, CRC Press
5. P. Tan, M. Steinbach, V. Kumar (2005) Cluster Analysis: Basic Concepts and Algorithms, In P. Tan, M. Steinbach, V. Kumar, Introduction to
Data Mining, Pearson Addison Wesley, http://www-users.cs.umn.edu/~kumar/dmbook/index.php
6. J. Shlens (2003) A Tutorial on Principal Component Analysis: Derivation, Discussion and Singular Value Decomposition, arXiv preprint
arXiv:1404.1100, 2014, https://www.cs.princeton.edu/picasso/mats/PCA-Tutorial-Intuition_jp.pdf
7. M. Steinbach, L. Ertoz, V. Kumar, “The Challenges of Clustering High Dimensional Data”, https://www-
users.cs.umn.edu/~kumar001/papers/high_dim_clustering_19.pdf
8. J. VanderPlas, “Python Data Science Handbook”, O'Reilly Media, http://shop.oreilly.com/product/0636920034919.do
9. CAS Schedule P data for Loss Reserving: http://www.casact.org/research/index.cfm?fa=loss_reserves_data
36

17 October 2018 37
Thank you!

Risk Solutions
Imprint
17/10/2018 Münchener Rückversicherungs-Gesellschaft
17/10/2018 Munich Reinsurance Company
©
©
17 October 2018 38Cluster Analysis in Loss Development – Dave Clark
Munich Reinsurance America, Inc.