cluster 4 exploring the universe - education and advanced learning
TRANSCRIPT

Senior 1
����������
��� ����
���������� �����������

Senior 1 Science Appendix 4.1
Cluster 4, Exploring the Universe A93
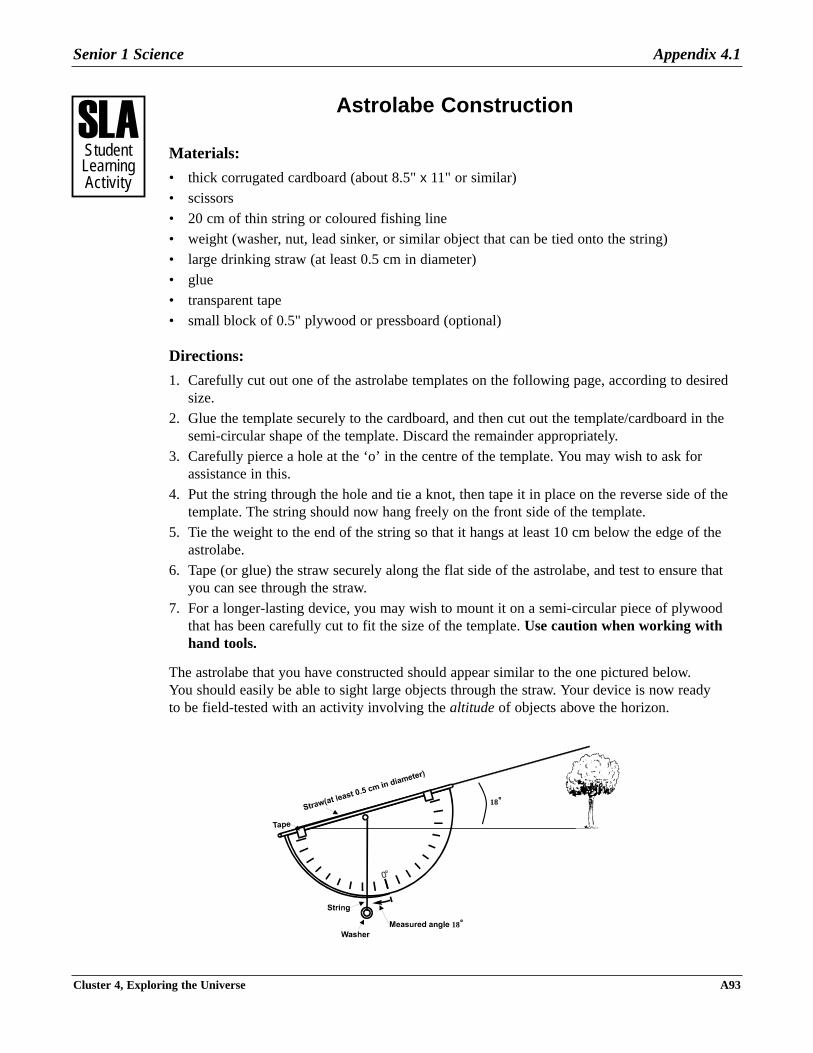
Astrolabe Construction
Materials:
• thick corrugated cardboard (about 8.5" x 11" or similar)
• scissors
• 20 cm of thin string or coloured fishing line
• weight (washer, nut, lead sinker, or similar object that can be tied onto the string)
• large drinking straw (at least 0.5 cm in diameter)
• glue
• transparent tape
• small block of 0.5" plywood or pressboard (optional)
Directions:
1. Carefully cut out one of the astrolabe templates on the following page, according to desiredsize.
2. Glue the template securely to the cardboard, and then cut out the template/cardboard in thesemi-circular shape of the template. Discard the remainder appropriately.
3. Carefully pierce a hole at the ‘o’ in the centre of the template. You may wish to ask forassistance in this.
4. Put the string through the hole and tie a knot, then tape it in place on the reverse side of thetemplate. The string should now hang freely on the front side of the template.
5. Tie the weight to the end of the string so that it hangs at least 10 cm below the edge of theastrolabe.
6. Tape (or glue) the straw securely along the flat side of the astrolabe, and test to ensure thatyou can see through the straw.
7. For a longer-lasting device, you may wish to mount it on a semi-circular piece of plywoodthat has been carefully cut to fit the size of the template. Use caution when working withhand tools.
The astrolabe that you have constructed should appear similar to the one pictured below.You should easily be able to sight large objects through the straw. Your device is now readyto be field-tested with an activity involving the altitude of objects above the horizon.
���StudentLearningActivity
18°°
18°°

Appendix 4.1 Senior 1 Science
A94 Cluster 4, Exploring the Universe

Cluster 4, Exploring the Universe A95
Senior 1 Science Appendix 4.2
Locating Celestial Objects Using a System ofCoordinates
Purpose:
To use the constructed astrolabe and an orienteering-type compass to locate and determinethe altitude and azimuth of a selection of objects in the night sky.
Note: If the activity cannot be done at night, substitute objects that are visible around youduring the day, (e.g., buildings, trees, etc.). This is not, however, the most desirable option.
Materials:
• student-constructed astrolabe
• orienteering-type compass for measuring azimuth
• logbook or chart to record measurements (see sample below)
• simplified star chart or planisphere
Procedure:
1. Select at least five objects in the night sky that you wish to locate and that will be visible atthe time you are doing the activity: the Moon; bright planets such as Venus, Mars, Jupiterand Saturn; easy to find stars such as Polaris (the North Star), Vega, and Arcturus are theeasiest to locate until you are more familiar with the night sky at your location.
2. Using the compass, determine the azimuth of the object by visually tracing a line from theobject in the sky straight down to the nearest horizon point, and reading its compass bearing(e.g., 90 degrees would be due east, 180 degrees would be due south, etc.). Record this inyour chart or logbook.
3. Using the “hand-angle technique” that you have learned and practised, estimate the altitudeof the object of interest. Record your estimates in the chart or a personal observationlogbook.
4. Using the astrolabe, look through the straw until you can see the object centred in the field ofview. While holding the instrument steady, use your free hand to pinch the string against thescale on the astrolabe until you are able to record the altitude. Repeat this at least two moretimes for the same object, and average the three readings in order to increase the precision.
5. Be prepared to discuss with a classmate or group how you determined your readings. It maybe useful to arrange for you and another classmate to observe the same selection of objects atthe same time, and compare your results.
Caution: DO NOT directly observe the Sun as part of this activity.
���StudentLearningActivity

Appendix 4.2 Senior 1 Science
A96 Cluster 4, Exploring the Universe
Data Chart: Azimuth and Altitude Readings
Date and Time of Object Viewed Azimuth Altitude Estimate Altitude asObservation (in degrees) Using Hand-Angle Measured by
from Compass Technique Astrolabe

Cluster 4, Exploring the Universe A97
Senior 1 Science Appendix 4.3
Observing and Charting the Motions of CelestialObjects
Purpose:
To observe and record, over a period of time, the apparent motions of easily visible celestialobjects, and to organize data for eventual display. The three objects of interest here will bethe Sun, Moon, and at least one bright planet (e.g., Venus, Mars, Jupiter, Saturn).
Materials:
• student-constructed astrolabe
• orienteering-type compass
• logbook or data chart for recording (see below)
• seasonal star charts (or planetarium software)
• plotting software such as Excel or Curve Expert
Procedure:
Tracking the Moon:
1. Use a calendar to determine when the next “New Moon” occurs. This will be Day 1 of theobservation program.
2. Over a period of 14 days (or longer if possible), and always observing at the same time eachevening, determine the altitude and azimuth of the Moon using your astrolabe and compass.A convenient time may be 8 p.m. in the fall or spring or 6 p.m. in the winter months.
3. In your data chart or logbook, record the position of the Moon as co-ordinates (e.g., altitude12°, azimuth 175°) (see chart below).
4. Sketch the appearance of the Moon and record the percentage of its face that is illuminated(i.e., First Quarter Moon is 50% illuminated from our point of view, Full Moon is 100%illuminated, etc.).
5. Continue to record these data for 14 successive nights. If cloudiness is a problem, skip thatday in the data entries. If you cannot observe, obtain a classmate’s data.
6. Plot your data (see graphs below). On the first graph, plot the Moon’s Azimuth vs. the DayNumber. On the second graph, plot the Moon’s Altitude vs. Day Number. Make your dotslarge enough to see clearly on the graph, and join them together with straight lines.
Extension:
1. Create a “rose petal diagram” by plotting your data on circular polar graph paper ifavailable. Use the outer circle to mark off your azimuth directions (i.e., 0° is north, 90° iseast, etc.). The lines that go out from the centre will be your altitude (with 0° altitude at thecentre of the circle and 90° altitude at the outer edge of the circle).
���StudentLearningActivity
Appendix 4.3 Senior 1 Science
A98 Cluster 4, Exploring the Universe
2. Investigate a second set of co-ordinates used by astronomers — Right Ascension andDeclination. Instead of changing with time as altitude and azimuth do, these co-ordinates aresimilar to longitude and latitude on the Earth. They remain constant as the Earth rotates andrevolves around the Sun. Good star charts will include the grid lines of right ascension anddeclination.
3. Plot the position of the Moon or planets over a series of evenings directly on a simplified starmap. This is a good way of tracking the apparent movements of these solar system objects. Ifyou are really adventurous, get some data on large asteroids (e.g., Vesta, Ceres) and followtheir movements from night to night.
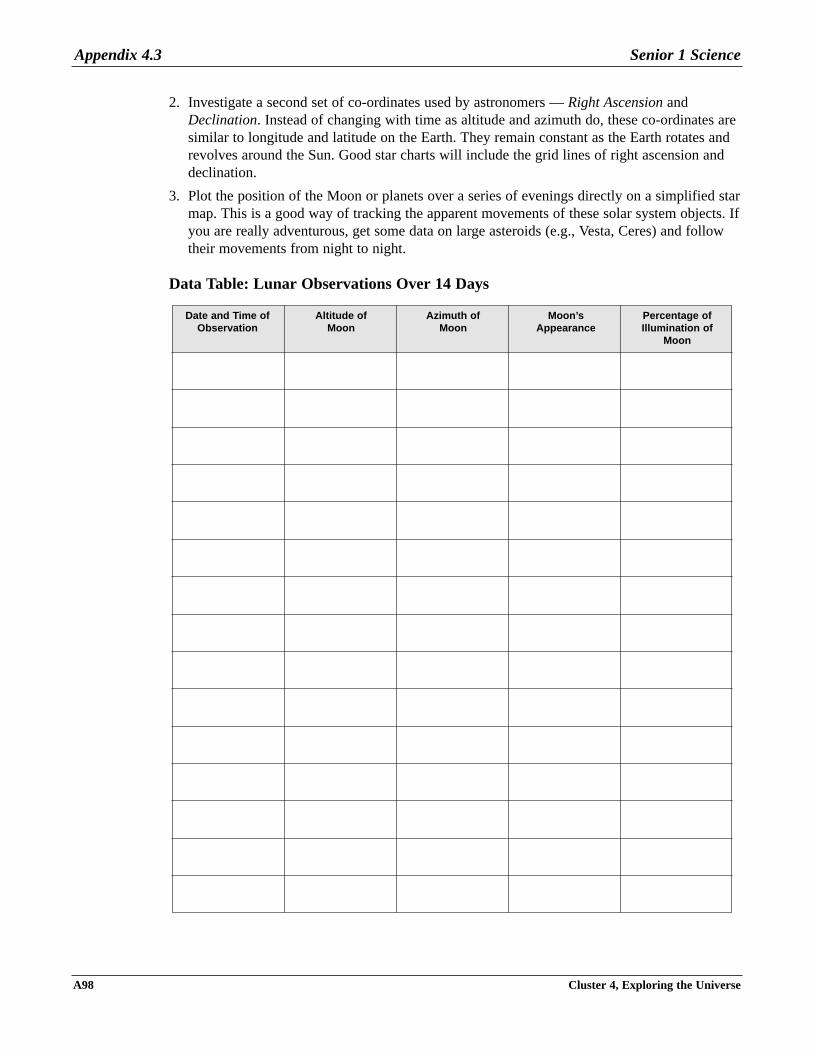
Data Table: Lunar Observations Over 14 Days
Date and Time of Altitude of Azimuth of Moon’s Percentage ofObservation Moon Moon Appearance Illumination of
Moon

Cluster 4, Exploring the Universe A99
Senior 1 Science Appendix 4.3
Data Plots of Lunar Observations:
Day
Nu
mb
er o
f O
bse
rvat
ion
0° 30° 60° 90° 120° 150° 180° 210° 240° 270° 300° 330° 360° 390°
Azimuth of Moon Above Horizon Over 14-Day Period
Azimuth (°)
10
9
8
7
6
5
4
3
2
1
Day Number of Observation
1 2 3 4 5 6 7 8 9 10 11 12 13 14
Altitude of Moon Above Horizon Over 14-Day Period
Alt
itu
de
(°)
90°
80°
70°
60°
50°
40°
30°
20°
10°
0°

Appendix 4.3 Senior 1 Science
A100 Cluster 4, Exploring the Universe
Extension:
Plot additional graphs from the data you’ve collected on the position of a planet such asVenus, Mars, or Jupiter. If you choose to plot position data for the Sun, it is stronglyrecommended that you consult tables of data available from such sources as the RoyalAstronomical Association of Canada (http://www.rasc.ca).
Make copies of the following blank chart to collect and organize your data.
Azimuth (180° = South Horizon)
20 40 60 80 100 120 140 160 180 200 220 240 260
Altitude vs. Azimuth for the Moon Over 14-Day Period
Alt
itu
de
90°
80°
70°
60°
50°
40°
30°
20°
10°
0°

Cluster 4, Exploring the Universe A101
Senior 1 Science Appendix 4.3
Data Table #__: Planet Observations Over Time
Name of Planet or Other Celestial Object: ______________________________________
Date and Time of Altitude of Azimuth of Right Ascension DeclinationObservation Planet or Object Planet or Object (optional) (optional)

Appendix 4.3
Senior 1 Science
A102
Cluster 4, E
xploring the Universe
Planet’s P
osition Over T
ime: A
ltitude/Azim
uth
Plot #___:
Plot of Planet’s Position in the Sky Over Time90°
80°
70°
60°
50°
40°
30°
20°
10°
0°0 30 60 90 120 150 180 210 240 270 300 330 360
Azimuth (Compass Bearing in Degrees) of Planet
Alt
itu
de
of
Pla
net
Ab
ove
Ho
rizo
n (
deg
rees
)

Cluster 4, Exploring the Universe A103
Senior 1 Science Appendix 4.3
Questions:
1. You see a certain star directly overhead while you are observing. What is the name given tothis location in the sky, and what would the star’s altitude be?
___________________________________________________________________________
___________________________________________________________________________
2. What are the co-ordinates of a planet that is visible in the southeast and is estimated to behalfway up in the sky from the horizon?
Altitude: _________________________ Azimuth: _________________________
3. What are the co-ordinates of the Moon when its position is due east and 10° above thehorizon?
Altitude: _________________________ Azimuth: _________________________
4. Wherever you are in the Northern Hemisphere, Polaris (the “North Star”) alwaysapproximates true north. (It is actually off true north by about one-fourth of a degree.) Youcan also determine your latitude by measuring the altitude of Polaris using the techniquesyou have already learned.
If you lived at Cross Lake, Manitoba (latitude is 54.0° N), what would be thealtitude/azimuth of Polaris at all times?
Altitude: _________________________ Azimuth: _________________________
5. Based on your observation of the Moon’s position over a 14-day period, describe the changesyou observed in its position from night to night (all observations made at the same time eachnight).
___________________________________________________________________________
___________________________________________________________________________
___________________________________________________________________________
___________________________________________________________________________
___________________________________________________________________________
___________________________________________________________________________
___________________________________________________________________________
6. If you observed the Moon’s azimuth to be 240° at 8 p.m. on one night, predict what itsazimuth would be on the next two consecutive nights at the same time.
Azimuth Day 2: ___________________ Azimuth Day 3: ____________________

Appendix 4.4 Senior 1 Science
A104 Cluster 4, Exploring the Universe
Motion of the Sun as Seen from Earth
Purpose:
To collect, graphically present, and interpret data on the position of the Sun over the courseof a school year. If time does not permit this, it is advisable, at the very least, to collect dataon the Sun’s position during the course of a single day.
Note: If you are observing for a period of hours over just one day, use the last two columnsof the data chart only.
Materials:
• access to a database of the Sun’s rising/setting positions or direct observations (conductedwith all necessary safety precautions)
• student-constructed astrolabe
• orienteering-type compass
• logbook or data chart (see chart on the following page)
• sunrise/sunset charts (or a planetarium software program)
• plotting software such as Excel or Curve Expert
���StudentLearningActivity

Cluster 4, Exploring the Universe A105
Senior 1 Science Appendix 4.4
Data Table: Solar Observations Over Time
Date and Time of Azimuth of Azimuth of Altitude of Sun Azimuth of SunObservation Sunrise Sunset (for single day (for single day
observing) observing)

Appendix 4.4
Senior 1 Science
A106
Cluster 4, E
xploring the Universe
Azim
uth of Sunrise
Graph of Azimuth of Sunrise Over 12 Months180°
150°
120°
90°
60°
30°
0°1 2 3 4 5 6 7 8 9 10 11 12
Month of the Year (January = 1)
Azi
mu
th o
f S
un
rise
(E
ast
= 90
)

Cluster 4, E
xploring the Universe
A107
Senior 1 ScienceA
ppendix 4.4
Azim
uth of Sunset
Graph of Azimuth of Sunset Over 12 Months360°
330°
300°
270°
240°
210°
180°1 2 3 4 5 6 7 8 9 10 11 12
Month of the Year (January = 1)
Azi
mu
th o
f S
un
set
(Wes
t =
270)

Appendix 4.4
Senior 1 Science
A108
Cluster 4, E
xploring the Universe
Sun’s Altitude
Graph of Altitude of Sun Over 12-Hour Period90°
80°
70°
60°
50°
40°
30°
20°
10°
0°6 7 8 9 10 11 12 13 14 15 16 17 18 19 20
Hour of the Day (Noon = 12)
Alt
itu
de
of
the
Su
n (
Deg
rees
Ab
ove
Ho
rizo
n)

Cluster 4, E
xploring the Universe
A109
Senior 1 ScienceA
ppendix 4.4
Sun’s Altitude and A
zimuth
Graph of Sun’s Position in the Sky Over One-Day Period
70°
60°
50°
40°
30°
20°
10°
0°0° 30° 60° 90° 120° 150° 180° 210° 240° 270° 300° 330° 360°
Azimuth of Sun (180º = South)
Alt
itu
de
of
the
Su
n (
Deg
rees
Ab
ove
Ho
rizo
n)

Appendix 4.4 Senior 1 Science
A110 Cluster 4, Exploring the Universe
Follow-up Questions:
1. Over the course of a period of months, what changes did you observe in
the position of the Sun at sunrise?_______________________________________________
___________________________________________________________________________
___________________________________________________________________________
the position of the Sun at sunset? _______________________________________________
___________________________________________________________________________
___________________________________________________________________________
2. In which two months of the year does the Sun rise and set exactly in the east (90) and west(270) respectively?
___________________________________ and ____________________________________
3. What is the significance of the two times of year mentioned in your answer to #2 above?What is the significance to the calendar?
___________________________________________________________________________
___________________________________________________________________________
___________________________________________________________________________
___________________________________________________________________________
4a. During what season of the year does the Sun rise furthest to the north on the horizon?
___________________________________________________________________________
4b. During what season of the year does the Sun set furthest to the south on the horizon?
___________________________________________________________________________
4c. Using your own background knowledge or independent research, what is responsible for thechanges you observed in the rising/setting of the Sun over a period of months?
___________________________________________________________________________
___________________________________________________________________________
___________________________________________________________________________
___________________________________________________________________________

Cluster 4, Exploring the Universe A111
Senior 1 Science Appendix 4.4
5. If you completed the data set on the altitude/azimuth of the Sun over a 12-hour period,answer the following based on your observations.
a. During what season of the year did you make these observations and/or collect your data?
________________________________________________________________________
b. At what time of day did the Sun reach its maximum altitude according to your data?
________________________________________________________________________
c. If your time in part (b) above was not 12:00 noon local time, how would you explain thisto a friend?
________________________________________________________________________
6. The planet Venus is unique in the solar system — its day is actually longer than its year! Aday (sunrise to sunrise) on Venus lasts 243 days. Venus also has retrograde rotation, whichmeans the planet rotates in a direction opposite to that of the Earth. On Venus, the Sun risesin the west and sets in the east! If you were an observer on Venus, what changes would youexpect to see in your graphs completed for this learning activity?
• ________________________________________________________________________
________________________________________________________________________
________________________________________________________________________
• ________________________________________________________________________
________________________________________________________________________
________________________________________________________________________
• ________________________________________________________________________
________________________________________________________________________
________________________________________________________________________
• ________________________________________________________________________
________________________________________________________________________
________________________________________________________________________
Appendix 4.5 Senior 1 Science
A112 Cluster 4, Exploring the Universe
Monitoring the Retrograde Motion of the Planet Mars
Background Information:
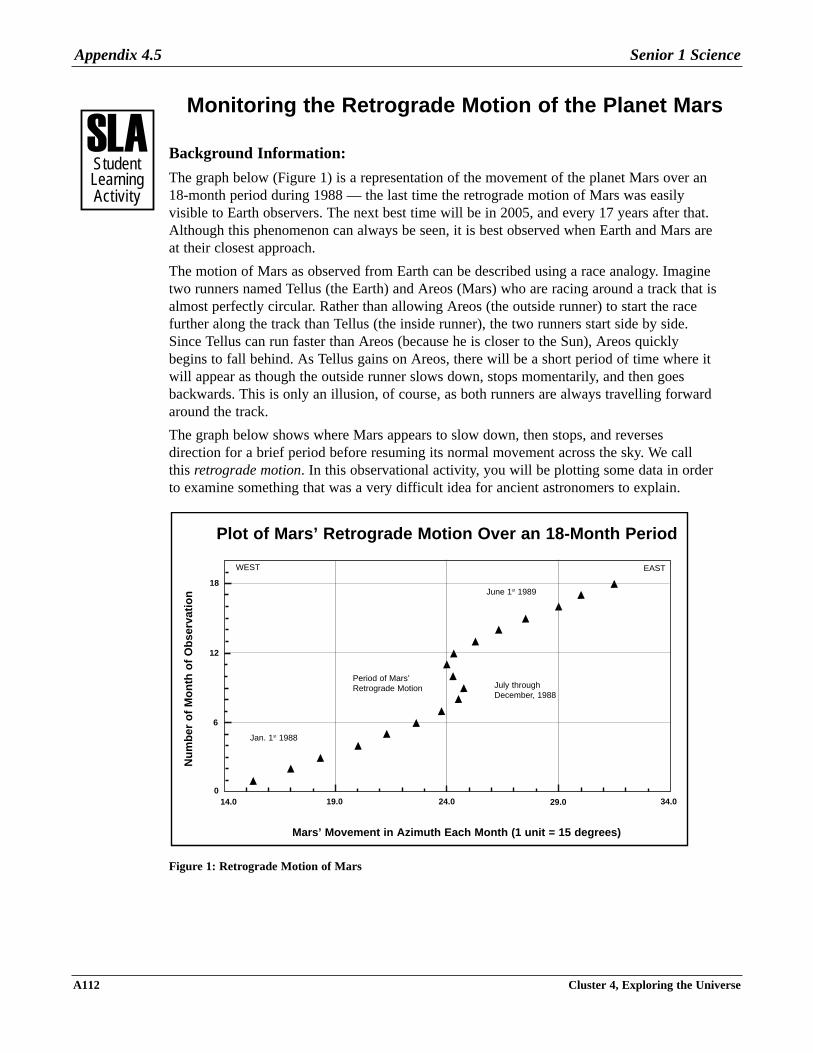
The graph below (Figure 1) is a representation of the movement of the planet Mars over an18-month period during 1988 — the last time the retrograde motion of Mars was easilyvisible to Earth observers. The next best time will be in 2005, and every 17 years after that.Although this phenomenon can always be seen, it is best observed when Earth and Mars areat their closest approach.
The motion of Mars as observed from Earth can be described using a race analogy. Imaginetwo runners named Tellus (the Earth) and Areos (Mars) who are racing around a track that isalmost perfectly circular. Rather than allowing Areos (the outside runner) to start the racefurther along the track than Tellus (the inside runner), the two runners start side by side.Since Tellus can run faster than Areos (because he is closer to the Sun), Areos quicklybegins to fall behind. As Tellus gains on Areos, there will be a short period of time where itwill appear as though the outside runner slows down, stops momentarily, and then goesbackwards. This is only an illusion, of course, as both runners are always travelling forwardaround the track.
The graph below shows where Mars appears to slow down, then stops, and reversesdirection for a brief period before resuming its normal movement across the sky. We callthis retrograde motion. In this observational activity, you will be plotting some data in orderto examine something that was a very difficult idea for ancient astronomers to explain.
Figure 1: Retrograde Motion of Mars
Plot of Mars’ Retrograde Motion Over an 18-Month Period
Mars’ Movement in Azimuth Each Month (1 unit = 15 degrees)
Nu
mb
er o
f M
on
th o
f O
bse
rvat
ion
Jan. 1st 1988
Period of Mars’Retrograde Motion July through
December, 1988
June 1st 1989
EASTWEST
18
12
6
014.0 19.0 24.0 29.0 34.0
���StudentLearningActivity

Cluster 4, Exploring the Universe A113
Senior 1 Science Appendix 4.5
Does This Planet Have Retrograde Motion?
Purpose:
To monitor and record the motion of Mars over time to better understand retrograde motion.
Procedure:
Using the data set that appears below, plot each position carefully on the blank graph on thenext page. Label each point you plot with the date of the observation to better simulateactual measurements. Join all of the points with a smooth line.
Data Chart: Planet Positions
Date of Observation Azimuth of Planet
July 1 112.5°
July 15 105.0°
August 1 98.25°
August 15 94.0°
September 1 93.75°
September 15 94.0°
October 1 97.5°
October 15 102.0°
November 1 108.75°
November 15 109.0°
December 1 101.25°
December 15 95.0°
January 1 90.0°

Appendix 4.5 Senior 1 Science
A114 Cluster 4, Exploring the Universe
Position of Planet
Follow-up Questions:
1. How does your plot compare with that of Mars (see Figure 1)? Identify at least twosimilarities and two differences.
___________________________________________________________________________
___________________________________________________________________________
___________________________________________________________________________
___________________________________________________________________________
2. Does this planet revolve around the Sun in the same direction as the Earth? Justify youranswer based on the data you have presented above.
___________________________________________________________________________
___________________________________________________________________________
___________________________________________________________________________
___________________________________________________________________________
Azimuth of Planet
Plot of Position of a Planet Over Seven Months of Observation
Day
of
Ob
serv
atio
n (
1 u
nit
= 1
5 D
ays)
225
150
75
090.0 95.0 100.0 105.0 110.0 115.0 120.0

Cluster 4, Exploring the Universe A115
Senior 1 Science Appendix 4.5
3. Write a simple procedure to make planetary observations (of Mars or Jupiter), includingrecording and graphing the data, and presenting the graph to your classmates.
• ________________________________________________________________________
________________________________________________________________________
• ________________________________________________________________________
________________________________________________________________________
• ________________________________________________________________________
________________________________________________________________________
• ________________________________________________________________________
________________________________________________________________________
4. Imagine that you are one of the ancient Greek astronomers (perhaps Ptolemy) and you areseeking an explanation as to why Mars periodically and mysteriously slows down, stopsmoving for a couple of weeks, reverses its motion against the background of distant stars,and then resumes its normal eastward movement across the sky. Furthermore, you havenoticed by searching your records that this happens most dramatically every 17 years or so.
Design a model of the cosmos that will satisfy the best minds of your age. Research the topicof retrograde motion and see how the early astronomers solved this problem. Report the five(5) most significant ideas from your research in the space below.
• ________________________________________________________________________
________________________________________________________________________
• ________________________________________________________________________
________________________________________________________________________
• ________________________________________________________________________
________________________________________________________________________
• ________________________________________________________________________
________________________________________________________________________
• ________________________________________________________________________
________________________________________________________________________
Appendix 4.5 Senior 1 Science
A116 Cluster 4, Exploring the Universe
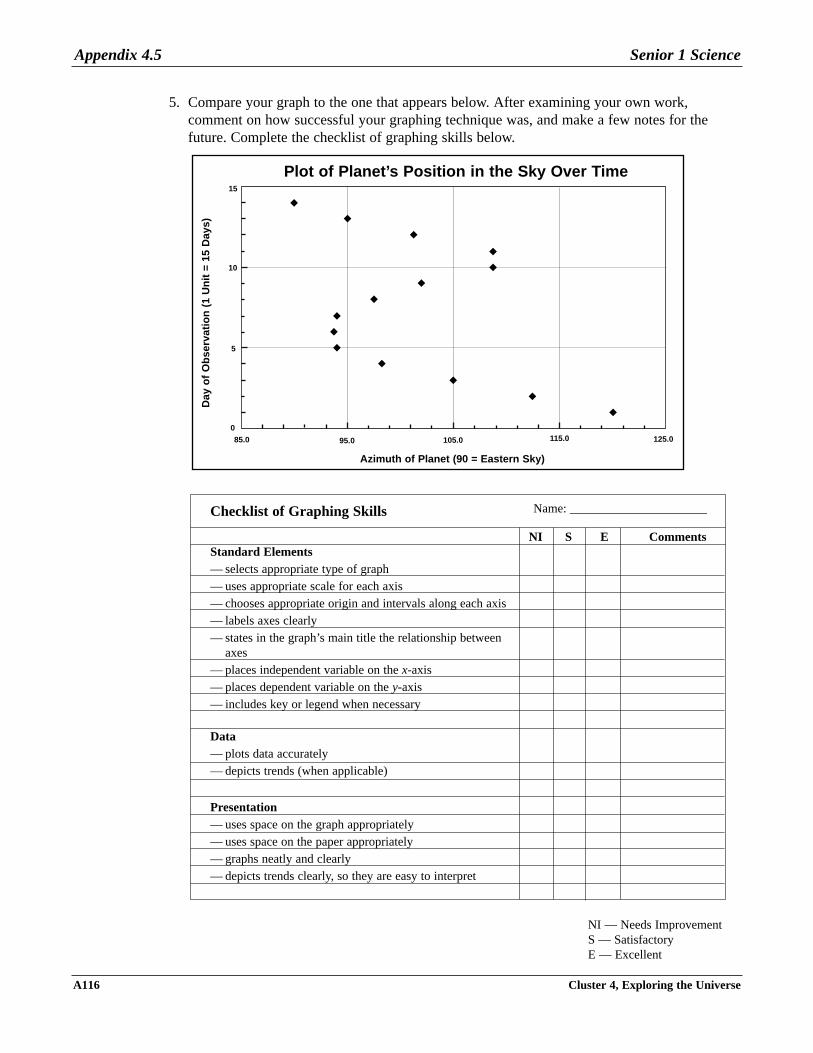
5. Compare your graph to the one that appears below. After examining your own work,comment on how successful your graphing technique was, and make a few notes for thefuture. Complete the checklist of graphing skills below.
Checklist of Graphing Skills
NI S E CommentsStandard Elements— selects appropriate type of graph— uses appropriate scale for each axis— chooses appropriate origin and intervals along each axis— labels axes clearly— states in the graph’s main title the relationship between
axes — places independent variable on the x-axis— places dependent variable on the y-axis— includes key or legend when necessary
Data— plots data accurately— depicts trends (when applicable)
Presentation— uses space on the graph appropriately— uses space on the paper appropriately— graphs neatly and clearly— depicts trends clearly, so they are easy to interpret
Name: ______________________
NI — Needs ImprovementS — SatisfactoryE — Excellent
Plot of Planet’s Position in the Sky Over Time
Azimuth of Planet (90 = Eastern Sky)
Day
of
Ob
serv
atio
n (
1 U
nit
= 1
5 D
ays)
15
10
5
0
85.0 95.0 105.0 115.0 125.0

Cluster 4, Exploring the Universe A117
Senior 1 Science Appendix 4.5
6a. Make any necessary modifications to your plot on the blank graph presented below. Be sureto base your changes on the items mentioned in your “Checklist of Graphing Skills.”
6b. Note the changes made to your graph in the space provided below.
• ________________________________________________________________________
________________________________________________________________________
________________________________________________________________________
• ________________________________________________________________________
________________________________________________________________________
________________________________________________________________________
• ________________________________________________________________________
________________________________________________________________________
________________________________________________________________________
• ________________________________________________________________________
________________________________________________________________________
________________________________________________________________________
Graph Title: _______________________________
Mo
nth
of
Ob
serv
atio
n (
1 u
nit
= 1
5 D
ays)
7
6
5
4
3
2
1
0

Appendix 4.6 Senior 1 Science
A118 Cluster 4, Exploring the Universe
The Search for Extraterrestrial Intelligence — The Drake Equation
Background Information:
The search for extraterrestrial life usually generates a discussion of UFOs and the extent towhich we believe in them. Internet sites provide information about the search for life in starsystems beyond the solar system. Space probes sent from Earth are carefully sterilized sothey do not contaminate any organism that may be contacted in space. Likewise, allincoming space probes are similarly sterilized for the same reason against what is called“back contamination” of the Earth.
The search for extraterrestrial intelligence (SETI) is an excellent example of how seriousscience can be distorted and corrupted by popularized accounts. The UFO debate is just onesuch situation. The SETI program is a well-funded attempt at scanning the heavens fortransmissions that may originate from past or presently communicating intelligent lifeforms.One of the founding members of the SETI research community, Dr. Frank Drake, developedan interesting probability relationship that has become known as the Drake Equation. Byentering values for certain symbols in this equation, one can speculate about the number ofintelligent, communicating civilizations in our galaxy. An example appears in this learningactivity (see the 1961 equation). The Drake Equation was developed as a way to focus onthe key factors which determine how many intelligent, communicating civilizations there arein our own Milky Way galaxy.
If you are you interested in participating actively in the SETI program, log on to thePlanetary Society website at http://www.planetary.org, and follow the SETI links from there.You will be looking for the seti@home hyperlinks.
The Drake Equation looks like this:
N0 = N* fp ne fl fi fc fL
Where N0 = Number of intelligent, communicating civilizations in our Milky Way galaxy.
N*= Number of stars in the Milky Way galaxy.
fp = Fraction of N having planetary systems.
ne = Number of planets per star capable of sustaining life.
fl = Fraction of ne where life evolves.
fi = Fraction of fl where intelligent life evolves.
fc = Fraction of fi that develops the means of radio frequency communication.
fL = Fraction of a planet’s natural history during which a civilization is actively communicating beyond itself into deep space.
The equation could be seen as providing answers to a number of questions.
N* represents the number of stars estimated to be in the Milky Way galaxy.
Question: How many stars are in the Milky Way galaxy?
Answer: Current estimates are 100 billion.
���StudentLearningActivity

Cluster 4, Exploring the Universe A119
Senior 1 Science Appendix 4.6
fp is the fraction of stars that have planets around them.
Question: What percentage of stars have planetary systems?
Answer: Current estimates range from 20% to 50%.
ne is the number of planets per star that are capable of sustaining life.
Question: For each star that does have a planetary system, how many planets are capable of sustaining life?
Answer: Current estimates range from 1 to 5.
fl is the fraction of planets in ne where life evolves.
Question: On what percentage of the planets that are capable of sustaining life does life actually begin and evolve?
Answer: Current estimates range from 100% (where life can evolve, it will) down to close to 0% (life is a very rare occurrence).
fi is the fraction of fl where intelligent life evolves.
Question: On the planets where life does evolve, what percentage of these evolve intelligent, self-aware lifeforms?
Answer: Estimates range from 100% (intelligence is such a survival advantage that it will certainly evolve) down to near 0%.
fc is the fraction of fi that communicate.
Question: What percentage of intelligent species have the means to communicate?
Answer: Estimates are from 10% to 20%.
fL is the fraction of the planet’s lifespan during which the actively communicating civilizations live.
Question: For each civilization that does develop the ability to communicate into deep space, for how long during the planet’s life does the civilization last?
Answer: This is perhaps the toughest of all the questions to answer. If we take Earth as an example, the expected lifetime of our Sun and the Earth is roughly 10 billion years. So far, we have been communicating with radio waves for less than 100 years. How long will our civilization survive? Will we destroy ourselves in a matter of years as some have predicted, or will we overcome our problems and survive for millenia to come? If we were destroyed tomorrow, the answer to this question would be 1/100,000,000th. If we survive for 10,000 years the answer will be 1/1,000,000th.
When all of these variables are multiplied together, we arrive at: N0, the number of activelycommunicating civilizations in the galaxy.
The real value of the Drake Equation is not in finding an answer that we can say is correct,but in discussing the questions that are attached to each of the terms in the equation. Hereyou get a chance to be in charge of the tremendous guesswork involved in filling in thevariables. As a technological and scientific society, we will learn more from astronomy,biology, and the other sciences and be able to better estimate the answers to the questionspresented above.

Appendix 4.6 Senior 1 Science
A120 Cluster 4, Exploring the Universe
Try the Drake Equation for Yourself:
For each of the variables in the equation, a sample number appears to assist you. In thespaces to the right of each number, enter your own estimates for that variable. According tothe Drake Equation and with the use of a calculator, multiply your numbers and fractions tocalculate N: the number of intelligent, communicating civilizations in the Milky Waygalaxy.
Note: Numbers that are listed as ‘f’ are written as decimal fractions. For example, 50% inthe line fc is entered as 0.50 into your calculator, and so on. If you arrive at an answer thatis less than 1.00 (the current known value for the Drake Equation), change one or more ofyour estimates.
N* = Number of stars in the Milky Way galaxy.
fp = Fraction of N having planetary systems.
ne = Number of planets per star capable of sustaining life.
fl = Fraction of ne where life evolves.
fi = Fraction of fl where intelligent life evolves.
fc = Fraction of fi that develop the means of radio frequency communication.
fL = Fraction of a planet’s natural history during which a civilization is activelycommunicating beyond itself into deep space.
Calculate N0 = N* fp ne fl fi fc fL
Example: (100,000,000,000) x (.50) x (1.00) x (.30) x (.20) x (.10) x (0.000 001)= N, the number of actively communicating civilizations in the galaxy.
300
1/1,000,000th (10,000 years)
10% = 0.10
20% = 0.20
30% = 0.30
1
50% = 0.50
100 billion

Sample Plots of Astronomical Data for TeacherReference, and Databases for Objects
Notes for Instruction:
The following data charts are provided to supplement previously recorded data or in lieu ofobservational data where direct data collecting is not possible. It is preferred, however, thatstudents acquire positioned data from astronomy software rather than use these data chartsand plots. A comprehensive list of websites offering such software can be found at:
http://www.GriffithsObs.org/ or http://www.seds.org/
1. Data Set and Plot of Sun’s Azimuth at Sunset Over Time
Day Azimuth of Sunset
21 239.7º
51 255.1º
80 272.7º
110 291.2º
140 305.2º
170 310.7º
200 304.8º
230 290.3º
260 272.1º
290 254.2º
320 239.2º
350 233.5º
Cluster 4, Exploring the Universe A121
Senior 1 Science Appendix 4.7
���TeacherSupportMaterial

Appendix 4.7 Senior 1 Science
A122 Cluster 4, Exploring the Universe
Plot of Sunset Position Over One Year at Teulon, ManitobaThe above plot illustrates that the position of sunset throughout the year follows a predictablepattern. In the winter (days 300 to 60), the Sun sets well to the southwest in the sky,corresponding with the shortest hours of daylight. As the year progresses, the Sun setsincreasingly towards the north, with sunset due west (270° azimuth) at the Vernal Equinox(first day of spring). On or near the Summer Solstice of June 21st, the Sun sets at its mostnortherly position (day 180), going down well to the northwest on the horizon. For theremainder of the year, until the Winter Solstice of December 21st, the sunset location movesprogressively southward on the horizon by about one Sun diameter per day (0.5 degree). TheEarth’s axial tilt of 23.5° is responsible for this apparent motion of the Sun throughout theyear.
Plot of Sunset Azimuth at Teulon, Manitoba
Day of the Year (January 1st = 0)
Azi
mu
th o
f S
un
set
(Wes
t =
270
deg
rees
)
0 60 120 180 240 300 360
330
300
270
240
210

Cluster 4, Exploring the Universe A123
Senior 1 Science Appendix 4.7
2. Data Set and Plot of Hours of Daylight Per Day for One Year at Churchill, Manitoba
Hours of Daylight Per Day at Churchill, Manitoba
Day of the Year
Ho
urs
of
Day
ligh
t P
er D
ay
0 60 120 180 240 300 3606.0
10.0
14.0
18.0
Alhough most students are aware that thereare more hours of daylight in the summerthan in the Manitoba winters, it is alwaysinstructive to see this represented throughplotting software in graphical mode. Theregularity of the increase and decrease ismarked, upon closer examination, by thefact that the lengthening of daylight duringthe spring and the decrease in daylight inthe fall are the two periods where the mostrapid day-to-day changes occur (note thesteepness of the plot during the intervals ofspring and fall). The levelling off of thecurve near the beginning of summer andwinter paints not only a good numericalpicture, but conjures emotions as well!
Day Hours of Daylight
21 8.867
51 10.55
80 12.375
110 14.308
140 15.892
170 16.583
200 15.879
230 14.251
260 12.34
290 10.483
320 8.833
350 8.152
Appendix 4.7 Senior 1 Science
A124 Cluster 4, Exploring the Universe
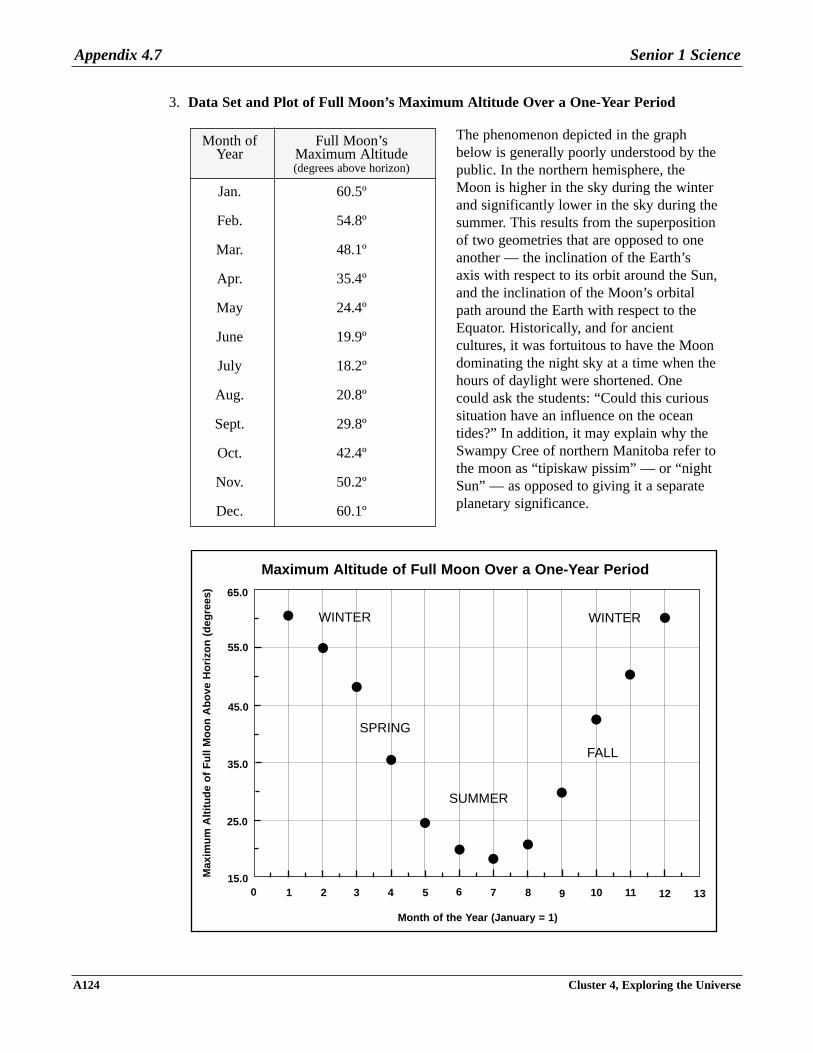
3. Data Set and Plot of Full Moon’s Maximum Altitude Over a One-Year Period
Maximum Altitude of Full Moon Over a One-Year Period
Month of the Year (January = 1)
Max
imu
m A
ltit
ud
e o
f F
ull
Mo
on
Ab
ove
Ho
rizo
n (
deg
rees
)
0
35.0
45.0
55.0
65.0
25.0
15.01 2 3 4 5 6 7 8 9 10 11 12 13
WINTER
SPRING
SUMMER
WINTER
FALL
The phenomenon depicted in the graphbelow is generally poorly understood by thepublic. In the northern hemisphere, theMoon is higher in the sky during the winterand significantly lower in the sky during thesummer. This results from the superpositionof two geometries that are opposed to oneanother — the inclination of the Earth’saxis with respect to its orbit around the Sun,and the inclination of the Moon’s orbitalpath around the Earth with respect to theEquator. Historically, and for ancientcultures, it was fortuitous to have the Moondominating the night sky at a time when thehours of daylight were shortened. Onecould ask the students: “Could this curioussituation have an influence on the oceantides?” In addition, it may explain why theSwampy Cree of northern Manitoba refer tothe moon as “tipiskaw pissim” — or “nightSun” — as opposed to giving it a separateplanetary significance.
Month of Full Moon’sYear Maximum Altitude
(degrees above horizon)
Jan. 60.5º
Feb. 54.8º
Mar. 48.1º
Apr. 35.4º
May 24.4º
June 19.9º
July 18.2º
Aug. 20.8º
Sept. 29.8º
Oct. 42.4º
Nov. 50.2º
Dec. 60.1º

Cluster 4, Exploring the Universe A125
Senior 1 Science Appendix 4.7
4. Data Set and Plot of Sun’s Altitude Above the Horizon at Noon, Winnipeg Manitoba.
Altitude of Sun Above Horizon at Noon OverOne Year at Winnipeg, Manitoba
Day of the Year
Su
n’s
Alt
itu
de
at N
oo
n (
Deg
rees
Ab
ove
Ho
rizo
n)
0
70°
WINTER
SUMMER
WINTER
60 120 180 240 300 36010°
20°
30°
40°
50°
60°
The data required to produce the plot belowcould also be generated through studentobservation using their constructedastrolabe (as discussed previously).Determining the amplitude of the “wave” inthis plot (exactly 23.5 degrees) shows that itmatches the current axial tilt of the Earth.
Day of Year Altitude of Sun at Noon
21 9.7º
51 29º
80 40.2º
110 51.8º
140 60º
170 63.1º
200 60.0º
230 51.5º
260 40º
290 28.6º
320 19.6º
350 16.2º

Appendix 4.7 Senior 1 Science
A126 Cluster 4, Exploring the Universe
5. Data Set and Plot of Moon’s Position in the Eastern Sky at Moonrise
6. Data Set and Plot of Sun’s Position at Sunrise, Flin Flon, Manitoba.
Moon’s Position in Eastern Sky at Moonrise
Day of the Year
Azi
mu
th o
f M
oo
nri
se (
90º
= E
ast)
0
135.0
60 120 180 240 300
105.0
75.0
45.0360
Day of Year Azimuth of Moon
21 60.7º
51 85.5º
80 97.5º
110 119.5º
140 124.7º
170 112.8º
200 95.0º
230 67.6º
260 53.5º
290 63.9º
320 84.8º
350 106.0º

Cluster 4, Exploring the Universe A127
Senior 1 Science Appendix 4.7
Position of Sun at Sunrise Flin Flon, Manitoba
Day of the Year
Azi
mu
th o
f S
un
rise
(90
º =
Eas
t)
0
130.0
60 120 180 240 30040.0
360
115.0
100.0
55.0
70.0
85.0
Day of Year Azimuth of Sunrise
1 124.6º
8 125.9º
13 126.5º
20 126.5º
79 88.7º
166 49.5º
258 84.0º
267 89.5º

Appendix 4.7 Senior 1 Science
A128 Cluster 4, Exploring the Universe
7. Data Set and Plot of Mars’ Retrograde Motions, 2003 A.D.
Plot of Mars’ Retrograde Motions, 2003 A.D.
Relative Position of Mars Against Background Stars
Mo
nth
of
Ob
serv
atio
n (
0 =
Jan
uar
y)
85.0
15
Mars Resumes itsEastward Motion
Period of Westward(Retrograde) Motion
Period of EastwardMotion
EAST
95.0 105.0 115.0 125.0
10
5
0
Mars’ Position Month
120º 1 (Jan. 2003)
112.5º 2 (Feb.)
105.0º 3 (Mar.)
98.25º 4 (Apr.)
94.0º 5 (May)
93.75º 6 (June)
94.0º 7 (July)
97.5º 8 (Aug.)
102.0º 9 (Sept.)
108.75º 10 (Oct.)
108.75º 11 (Nov.)
101.25º 12 (Dec.)
95.0º 13 (Jan. 2004)
90.0º 14 (Feb. 2004)

Cluster 4, Exploring the Universe A129
Senior 1 Science Appendix 4.8
The Great Astronomical Word Explosion
Instructions:
Complete each statement using the words and phrases below. This should be a useful reviewof many of the terms you have encountered in your introduction to astronomy. Some of thewords can be used more than once. The numbers are used only once.
Halley cultures and religions minerals white dwarfapparent the Earth star galaxieshydrogen Pluto 1000 Jupiterthe Sun expansion solar verificationcomet nuclear fusion instabilities one millionsuns moons gravity galaxycontraction Alpha Centauri light heliocentricBig Bang the Milky Way spiral thermonuclearsupernovas black hole ellipse planetnine 150 million one year 63,000Hubble aurora borealis dispersed light spectrummass geocentric four to five blueSirius Neptune ray of light asteroidspressure cloud of gas and dust red Uranusyears 10 to 15 billion years ago neutrons heliumradio waves 100 to 400 billion ring astronomicallight-year galaxies yellow-orange
1. A ____________________ is a celestial body that pursues an orbit around a central
________________________. Our solar system has ______________________ of them, and
some astronomers speculate that the belt of _______________________ between the orbits
of Mars and Jupiter was once a tenth planet that has been destroyed.
2. It is the force of ___________________________ that holds the planets in orbit around the
__________________________, and also causes the entire solar system to orbit around the
________________________________.
3. ___________________________ are natural satellites of planets. The large number of small
bodies between Mars and Jupiter are called the _____________________________, which
means “star-like.” Certain planets also have a _____________________________ system
that encircles them, comprised of thousands of small, rocky, and icy pieces of material left
over from the disintegration of a once-large satellite.
���StudentLearningActivity

Appendix 4.8 Senior 1 Science
A130 Cluster 4, Exploring the Universe
4. Certain asteroids, called the Trojans, cross the orbit of Mars and make close approaches to
the Earth. Their maximum size is about ___________________________ kilometres across.
Due to the fact that asteroids and moons are composed of rocky material, some people would
like to exploit them as sources of _________________________________ .
5. The largest planet in the solar system is ____________________________, and the smallest
is ______________________. The ‘third rocky one from the Sun’ is ___________________.
6. The four giant gas planets, listed in order of increasing distance from the Sun are
_______________________, ________________________, ______________________, and
_______________________ . They all have large families of _________________________
orbiting them.
7. An _____________________________________ unit (AU) is the average distance between
____________________________ and the ____________________. It is equivalent to about
_____________________ kilometres. A ____________________________ is a much larger
distance unit used by astronomers, and is the distance that a __________________________
traverses in ___________________________. A light-year is equivalent to about
_____________________________ AU’s.
8. A _________________________ is a solar system object that can can have a gas and dust
tail exceeding millions of kilometres in length. These celestial wonders of ice, rock, and
organic compounds travel around the Sun in elongated orbits called an
___________________________. In 1997, Hale-Bopp was one of the most brilliant to
recently enter the inner solar system, and was visible to the unaided eye for months.
However, it is __________________________ that is the most celebrated
__________________________, returning to put on a show with a period of about 76 years.

Cluster 4, Exploring the Universe A131
Senior 1 Science Appendix 4.8
9. The Sun is a _____________________________, an enormous sphere of gas that emits its
energy through the process of ____________________________. The temperatures in the
extreme outer layer of the Sun’s atmosphere, “the solar corona,” can reach
____________________ degrees Celsius. Every 10 years or so, ______________________
flares erupt from the Sun’s surface layers, eventually disturbing communication systems on
Earth. The beautiful ______________________________ near the North Pole is caused by
streams of charged particles which are emitted by the Sun and interact with the magnetic
field of the Earth high in the atmosphere.
10. The nearest star to the Earth is the ___________________________. The next nearest star
system to ours is _________________________, which is a triple-star system approximately
____________________________ light-years from Earth. The colour of its three stars,
indicating that they are Sun-like, is ___________________________. The hottest stars are
______________________ in colour, and the coolest stars are _____________________.
11. The ________________________ magnitude (brightness as seen from the Earth) of a star
differs from its absolute magnitude (a truer measure of a star’s brightness) because of the
great distance between the star and the Earth. This affects the quantity of ________________
that is observed in the night sky. The brightest star in the sky from our point of view is
___________________________ in the constellation Canis Major (the Great Dog), but it is
actually much less luminous than the nearby red giant star, Betelgeuse, in the constellation
Orion. Very often, stars appear bright simply because they are close to us.
12. A _________________________ is the remains of a supermassive star that is apparently
invisible due to the fact that tremendous _____________________ forces do not permit its
visible _____________________________ to escape and be seen.
13. Neither the ________________________ model of the universe (with the Earth at the centre)
nor the _______________________ model (with the Sun at the centre) represent the actual
conceptions of the cosmos accepted by astronomers today. The solar system is just one small
fraction of the galaxy called _____________________________. The universe is comprised
of perhaps hundreds of billions of ______________________________ like the nearest great
spiral galaxy to ours, the Andromeda Galaxy.

Appendix 4.8 Senior 1 Science
A132 Cluster 4, Exploring the Universe
14. A _____________________________ is actually an enormous collection of stars, dust, and
various gases, all bound together by gravitational attraction. The Milky Way contains
somewhere in the neighbourhood of __________________________ stars. Some galaxies
have a pinwheel-like appearance, and are called ______________________ galaxies (like the
Milky Way). Still others are irregular in form (like the Large Magellanic Cloud, for instance).
Quasars (which is a loose acronym for “quasi-stellar objects”) are strange sources of
________________________, and can emit as much energy as an entire galaxy of stars.
15. A large cloud of gas and dust called a _____________________________ is often called the
“birthplace of stars.” These clouds of gases, mostly ______________________________ and
_______________________, contract under the influence of _________________________.
A star is born when its _____________________________ furnace inside ignites as
temperatures rise to millions of degrees Celsius.
16. Depending on the initial ____________________ of the material from the nebula that
coalesces to form a star, the resulting star can end its life span as a small
__________________________, or as a spectacular _____________________ explosion that
leaves behind a super-dense remnant called a _____________________ star. The most
massive stars, those about 25 times heavier than our Sun, have the potential to become a
___________________________, from which time and space cannot escape. All of the
chemical elements that make up other stars, planets, and matter (including living beings like
you) are synthesized from the exploding stars.
17. By analyzing the rainbow-like colours of a ____________________ from a celestial body
(for example, a star beyond our Sun), it is possible to detect planets around it by looking for
small ____________________ in the motions of the central star. The ___________________
Space Telescope has already confirmed the existence of a number of planetary systems
around stars other than our Sun.

18. According to cosmologists (scientists studying the ultimate fate of the cosmos), it is thought
that after the universe’s initial period of ________________________, a period of
__________________________ will result in what has been called “the Big Crunch.” After
that, another _____________________________ could give rise to a whole new universe.
19. The _____________________________ Theory also proposes that all of the material that
now comprises the universe was originally concentrated in an exceedingly small volume of
space — infinitely small. This mass was under great ______________________, and upon
exploding rapidly outward, ______________________ the enormous mass of material that
ultimately gave rise to stars, galaxies, and a host of other celestial objects.
20. A diversity of peoples, _________________________________ have proposed their own
particular explanation for the origins of the universe, but these perspectives have not utilized
the methods and habits of mind traditionally used in the scientific ______________________
of ideas.
Cluster 4, Exploring the Universe A133
Senior 1 Science Appendix 4.8
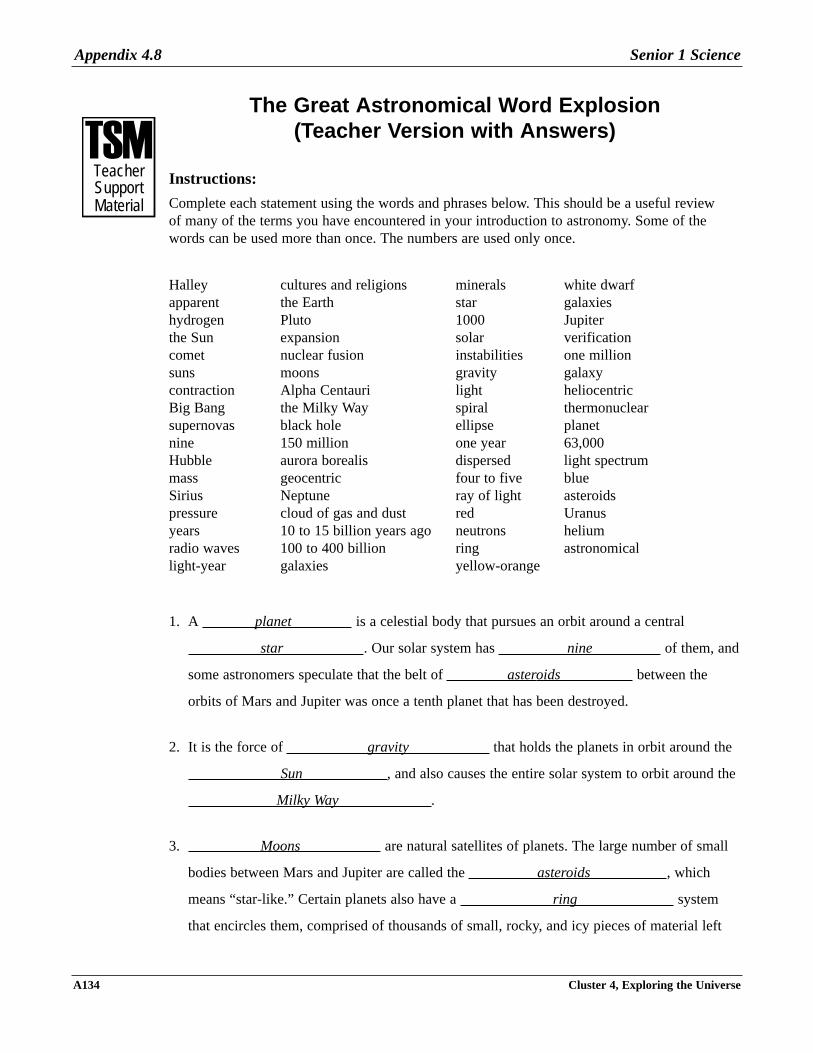
The Great Astronomical Word Explosion (Teacher Version with Answers)
Instructions:
Complete each statement using the words and phrases below. This should be a useful reviewof many of the terms you have encountered in your introduction to astronomy. Some of thewords can be used more than once. The numbers are used only once.
Halley cultures and religions minerals white dwarfapparent the Earth star galaxieshydrogen Pluto 1000 Jupiterthe Sun expansion solar verificationcomet nuclear fusion instabilities one millionsuns moons gravity galaxycontraction Alpha Centauri light heliocentricBig Bang the Milky Way spiral thermonuclearsupernovas black hole ellipse planetnine 150 million one year 63,000Hubble aurora borealis dispersed light spectrummass geocentric four to five blueSirius Neptune ray of light asteroidspressure cloud of gas and dust red Uranusyears 10 to 15 billion years ago neutrons heliumradio waves 100 to 400 billion ring astronomicallight-year galaxies yellow-orange
1. A planet is a celestial body that pursues an orbit around a central
star . Our solar system has nine of them, and
some astronomers speculate that the belt of asteroids between the
orbits of Mars and Jupiter was once a tenth planet that has been destroyed.
2. It is the force of gravity that holds the planets in orbit around the
Sun , and also causes the entire solar system to orbit around the
Milky Way .
3. Moons are natural satellites of planets. The large number of small
bodies between Mars and Jupiter are called the asteroids , which
means “star-like.” Certain planets also have a ring system
that encircles them, comprised of thousands of small, rocky, and icy pieces of material left
Appendix 4.8 Senior 1 Science
A134 Cluster 4, Exploring the Universe
���TeacherSupportMaterial

Cluster 4, Exploring the Universe A135
Senior 1 Science Appendix 4.8
over from the disintegration of a once-large satellite.
4. Certain asteroids, called the Trojans, cross the orbit of Mars and make close approaches to
the Earth. Their maximum size is about 1,000 kilometres across.
Due to the fact that asteroids and moons are composed of rocky material, some people would
like to exploit them as sources of minerals .
5. The largest planet in the solar system is Jupiter , and the smallest
is Pluto . The ‘third rocky one from the Sun’ is Earth .
6. The four giant gas planets, listed in order of increasing distance from the Sun are
Jupiter , Saturn , Uranus , and
Neptune . They all have large families of moons
orbiting them.
7. An astronomical unit (AU) is the average distance between
Earth and the Sun . It is equivalent to about
150 million kilometres. A light-year is a much larger
distance unit used by astronomers, and is the distance that a ray of light
traverses in one year . A light-year is equivalent to about
63,000 AU’s.
8. A comet is a solar system object that can can have a gas and dust
tail exceeding millions of kilometres in length. These celestial wonders of ice, rock, and
organic compounds travel around the Sun in elongated orbits called an
ellipse . In 1997, Hale-Bopp was one of the most brilliant to
recently enter the inner solar system, and was visible to the unaided eye for months.
However, it is Halley that is the most celebrated
comet , returning to put on a show with a period of about 76 years.

Appendix 4.8 Senior 1 Science
A136 Cluster 4, Exploring the Universe
9. The Sun is a star , an enormous sphere of gas that emits its
energy through the process of nuclear fusion . The temperatures in the
extreme outer layer of the Sun’s atmosphere, “the solar corona,” can reach
one million degrees Celsius. Every 10 years or so, solar
flares erupt from the Sun’s surface layers, eventually disturbing communication systems on
Earth. The beautiful aurora borealis near the North Pole is caused by
streams of charged particles which are emitted by the Sun and interact with the magnetic
field of the Earth high in the atmosphere.
10. The nearest star to the Earth is the Sun . The next nearest star
system to ours is Alpha Centauri , which is a triple-star system approximately
four to five light-years from Earth. The colour of its three stars,
indicating that they are Sun-like, is yellow-orange . The hottest stars are
blue in colour, and the coolest stars are red .
11. The apparent magnitude (brightness as seen from the Earth) of a star
differs from its absolute magnitude (a truer measure of a star’s brightness) because of the
great distance between the star and the Earth. This affects the quantity of light
that is observed in the night sky. The brightest star in the sky from our point of view is
Sirius (“serious”) in the constellation Canis Major (the Great Dog), but it is
actually much less luminous than the nearby red giant star, Betelgeuse, in the constellation
Orion. Very often, stars appear bright simply because they are close to us.
12. A black hole is the remains of a supermassive star that is apparently
invisible due to the fact that tremendous gravitational forces do not permit its
visible light to escape and be seen.
13. Neither the geocentric model of the universe (with the Earth at the
centre) nor the heliocentric model (with the Sun at the centre) represent the
actual conceptions of the cosmos accepted by astronomers today. The solar system is just one
small fraction of the galaxy called the Milky Way . The universe is
comprised of perhaps hundreds of billions of galaxies like the
nearest great spiral galaxy to ours, the Andromeda Galaxy.

Cluster 4, Exploring the Universe A137
Senior 1 Science Appendix 4.8
14. A galaxy is actually an enormous collection of stars, dust, and
various gases, all bound together by gravitational attraction. The Milky Way contains
somewhere in the neighbourhood of 100 to 400 billion stars. Some galaxies
have a pinwheel-like appearance, and are called spiral galaxies (like the
Milky Way). Still others are irregular in form (like the Large Magellanic Cloud, for instance).
Quasars (which is a loose acronym for “quasi-stellar objects”) are strange sources of
radio waves , and can emit as much energy as an entire galaxy of stars.
15. A large cloud of gas and dust called a nebula is often called the
“birthplace of stars.” These clouds of gases, mostly hydrogen and
helium , contract under the influence of gravity .
A star is born when its thermonuclear furnace inside ignites as
temperatures rise to millions of degrees Celsius.
16. Depending on the initial mass of the material from the nebula that
coalesces to form a star, the resulting star can end its life span as a small
white dwarf , or as a spectacular supernova explosion that
leaves behind a super-dense remnant called a neutron star. The most
massive stars, those about 25 times heavier than our Sun, have the potential to become a
black hole , from which time and space cannot escape. All of the
chemical elements that make up other stars, planets, and matter (including living beings like
you) are synthesized from the exploding stars.
17. By analyzing the rainbow-like colours of a light spectrum from a celestial body
(for example, a star beyond our Sun), it is possible to detect planets around it by looking for
small instabilities in the motions of the central star. The Hubble
Space Telescope has already confirmed the existence of a number of planetary systems
around stars other than our Sun.
18. According to cosmologists (scientists studying the ultimate fate of the cosmos), it is thought
that after the universe’s initial period of expansion , a period of
contraction will result in what has been called “the Big Crunch.” After
that, another expansion could give rise to a whole new universe.

19. The Big Bang Theory also proposes that all of the material that
now comprises the universe was originally concentrated in an exceedingly small volume of
space — infinitely small. This mass was under great pressure , and upon
exploding rapidly outward, dispersed the enormous mass of material that
ultimately gave rise to stars, galaxies, and a host of other celestial objects.
20. A diversity of peoples, cultures and religions have proposed their own
particular explanation for the origins of the universe, but these perspectives have not utilized
the methods and habits of mind traditionally used in the scientific verification
of ideas.
Appendix 4.8 Senior 1 Science
A138 Cluster 4, Exploring the Universe
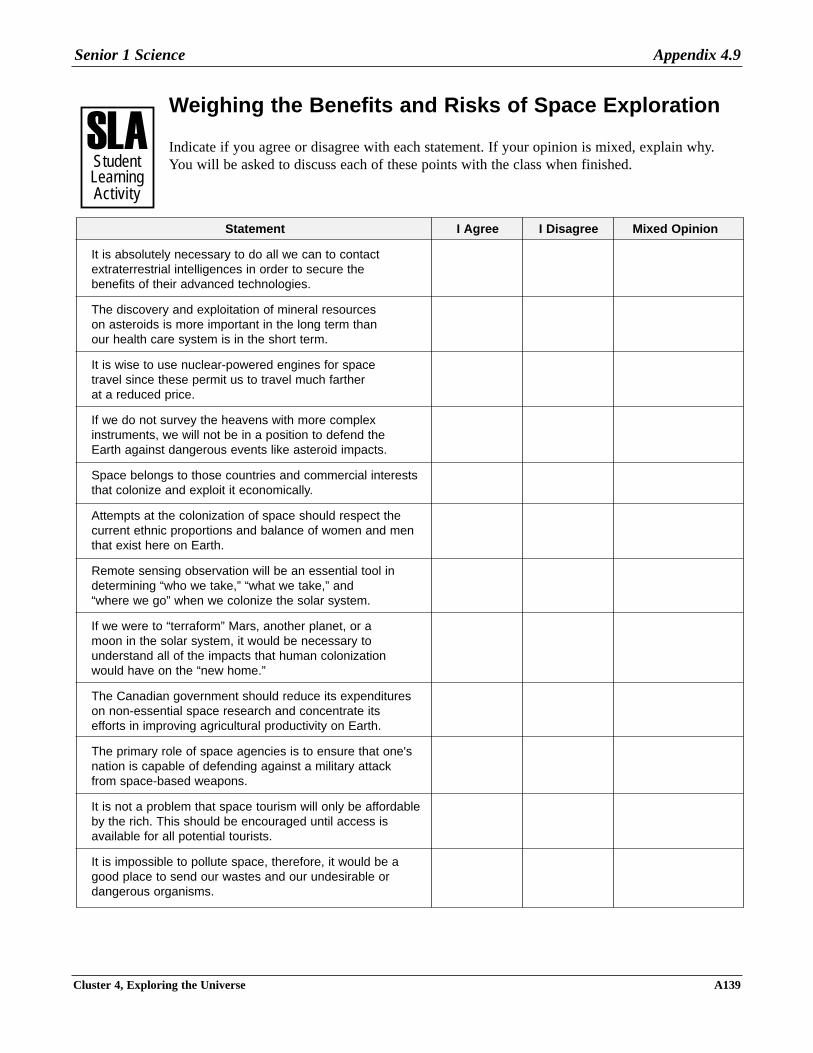
Weighing the Benefits and Risks of Space Exploration
Indicate if you agree or disagree with each statement. If your opinion is mixed, explain why.You will be asked to discuss each of these points with the class when finished.
Cluster 4, Exploring the Universe A139
Senior 1 Science Appendix 4.9
���StudentLearningActivity
Statement I Agree I Disagree Mixed Opinion
It is absolutely necessary to do all we can to contactextraterrestrial intelligences in order to secure the benefits of their advanced technologies.
The discovery and exploitation of mineral resources on asteroids is more important in the long term than our health care system is in the short term.
It is wise to use nuclear-powered engines for space travel since these permit us to travel much farther at a reduced price.
If we do not survey the heavens with more complex instruments, we will not be in a position to defend the Earth against dangerous events like asteroid impacts.
Space belongs to those countries and commercial interests that colonize and exploit it economically.
Attempts at the colonization of space should respect thecurrent ethnic proportions and balance of women and menthat exist here on Earth.
Remote sensing observation will be an essential tool in determining “who we take,” “what we take,” and “where we go” when we colonize the solar system.
If we were to “terraform” Mars, another planet, or amoon in the solar system, it would be necessary to understand all of the impacts that human colonization would have on the “new home.”
The Canadian government should reduce its expenditures on non-essential space research and concentrate its efforts in improving agricultural productivity on Earth.
The primary role of space agencies is to ensure that one's nation is capable of defending against a military attack from space-based weapons.
It is not a problem that space tourism will only be affordableby the rich. This should be encouraged until access is available for all potential tourists.
It is impossible to pollute space, therefore, it would be a good place to send our wastes and our undesirable or dangerous organisms.

Appendix 4.10 Senior 1 Science
A140 Cluster 4, Exploring the Universe
���StudentLearningActivity
Canadian Projects in the Space Sciences
Research three scientific projects or new technologies that affect Canadian efforts in spaceexploration. Identify and summarize the key results in the chart below. Be prepared todiscuss your research with the class.
Key Result Areas Project 1 Project 2 Project 3
Name of Canadianproject or new
technology
Brief description ofthe project or new
technology
Does the project ornew technology
involve internationalcooperation? If yes,
with which nation(s)?
What are the positiveresults of Canada’sparticipation in this
project ordevelopment of this
new technology?When will theseresults occur?
What are some ofthe concerns or
worries that surroundthis project or new
technology?
Identify one or two ofyour information
sources related to theadvantages of the
project or newtechnology.