cloudy boundary layers over the northeast pacific and ... · •cset and the soar studies provide a...
TRANSCRIPT

Cloudy boundary layers over the Northeast Pacific and Southern Ocean: Field observations, ERA5 and GCMs
Christopher S. Bretherton, Univ. of Washington
(plus many collaborators acknowledged during the talk)

• Clouds are a creature of weather that also are central to climate
• Fully exploiting this connection is the 21C way.

Forecast models and field studies: a synergy
• Field studies rely on forecast models and reanalyses
- Mission planning
- Data interpretation/context; trajectories
- Ancillary information for process modeling
• Field studies can improve forecast models
- Often motivated by global model biases
- Unique measurements with specific scientific goals
- Diversifies the community looking at forecast products
• Representativeness issues
- How to make the most of localized measurements?

Southern Ocean (SO) and Northeast Pacific (NEP) field studies
Science motivations
• In-situ documentation of Sc and Cu in the subtropical transitions and midlatitude cold-sector clouds, both causes of GCM biases
• Role of mesoscale organization of MBL clouds
• Aerosol-cloud interactions in these regimes and RFaci
• Liquid/ice partitioning in SO marine boundary layer clouds
Both field campaigns were designed to take advantage of and to complement the rich context of modern global weather forecast models, and to inform climate and weather model improvement.

Nudged-hindcast climate model testing
Strategy for testing/improving cloud/aerosol/PBL processes in a GCM
• GCM is run with its customary resolution, but as a ‘forecast’ model
• Relax GCM 3D u, v, T fields to time-varying interpolated reanalysis (GCM humidity, clouds, aerosols are freely evolving)
• Sample GCM output at lat/lon/times of field observations
Shown: NCAR CAM6: 1°x1° L32, MG2+MAM3, 24 hr nudging to MERRA-2
In process: ERA-5 nudged hindcasts with CAM6 and AM4 for SO studies.
Partners: A. Gettelman (NCAR), Y. Ming (GFDL)

ECMWF role
IFS/ERA5 are the state-of-the-art global model and reanalysis.
• How good are they in remote marine cloudy boundary layers?
• Does ERA5 get details of clouds and precipitation right?
• Is a hindcast nudged to ERA5 meteorology a good test of a climate model?
• How can field observations make models like IFS even better?


Cloud System Evolution in the Trades(CSET, Jul 1-Aug 15 2015)
Bruce Albrecht and Paquita Zuidema, U. Miami
Virendra Ghate, Argonne Natl. Labs
Chris Bretherton, Rob Wood, Hans Mohrmann, U. Washington
NCAR RAF CSET team
Albrecht et al. (2018, BAMS)
Wood et al. (2018); O et al. (2018)
Bretherton et al. (2019, MWR); Mohrmann et al. (2019, MWR)


CSET RF06-07 950 hPa
2 day GFS trajectories
V. Ghate/J. Mohrmann

CSET RF10Cloud radar
Lidar
GOES
Aircraft/dropsonde RH
Multiscale variability
On the NCAR G-V:
Cloud radar
Lidar
Dropsondes
In-situ meteorology
Cloud probes
Aerosol sizing
Ozone, CO
Turbulence

Representativeness issues and binning
Sparse sampling is a challenge
To compare complex CSET flights with models use:
- direct comparison along flight tracks (if not too noisy)
- 200 m x 5º longitude binning for a poor-man’s climatology
(a) (b) (c)
Bretherton et al. 2019

Liquid water content
(a) (b) (c)
Bretherton et al. 2019
Courtesy I. McCoy

ERA5
CSET
ERA5 ozone good above PBL, too high in the PBL
Courtesy I. McCoy

Turbulence (TKE dissipation rate)
(a) (b)
Another measurement with substantial small-scale variability
Bretherton et al. 2019

SOUTHERN OCEAN ATMOSPHERE RESEARCH (SOAR) 2016-2018
G. McFarquhar, U. Illinois C. Bretherton, R. Wood & R. Marchand, U. Washington
A. Protat, Australian BoMS. Alexander, AAD… and SOAR Science Teams
SOCRATES (Jan 15-Feb 26 2018):
NSF G-V deployment
CAPRICORN (2016-2018):
Australian R/V Investigator
MICRE (2017-2018):
Macquarie Island (DOE, AUS)
MARCUS (2017-2018):
AMF-2 on Aurora Australis:
Complementary space/time sampling:
All: mm radar, lidar, sondes, met,
aerosols + specialized
Other recent SO/Antarctic
campaigns have gathered data in
other regions: ORCAS & ARM-
AWARE (2016), ACE (2017)

The SOAR campaigns…complementary sampling strategies
SOCRATES
MARCUS
CAPRICORNMICRE

Cold sector mixed-phase boundary-layer clouds are particularly problematic for models
Cyclone compositing indicates consistent patterns of
insufficient reflected shortwave in the cold, dry regions of the cyclones (Williams et al. 2013)
Southern Ocean clouds are interesting and challenging to model
Large seasonal cycles of cloud droplet and CCNconcentrations exist over the SO. Biogenic sources arebelieved responsible, but much unknown aboutaerosol composition and the underlying physicalprocesses, especially at more southerly latitudes.
In SO ocean summer, biogenic gas/particlesources seem microphysically important
Courtesy R. Wood

Theme 1: Documenting the synoptically-varying vertical structure of Southern Ocean boundary layers and clouds
Theme 2: Variability of sources and sinks of SO CCN and INPs and seasonally-varying role of local biogenic sources.
Theme 3: Supercooled liquid clouds over the SO
Theme 4: Retrieving the properties of mixed-phase clouds
SOAR Themes

CAPRICORN: Clouds, Aerosols, Precipitation,
Radiation, and atmospherIc Composition Over the
southeRn ocean
Lead PI: Alain Protat
• 2016 (March – April, 35 days): CAP-1
• 2018 (Jan – Feb, 45 days): CAP-2 Coordinated with SOCRATES flights.
CAPRICORN-1
CAP-2
RV Investigator CAP-1
CAPRICORN goals:
• MBL-cloud-aerosol-precip
vs. latitude and weather
• A-Train and Himiwari evaluation
• ACCESS model, mixed-phase cld
Key CAPRICORN Measurements:
Cloud radar-Polarized lidar (Protat)
Microwave Radiometer (Mace)
Disdrometer (Klepp/Protat)
In-situ aerosol/sulfur chemistry (Moore)
IFN (DeMott)
Trace gases (CAP-1, Humphries)
Ocean water (CAP-1, Strutton)
Wind profiler (CAP-2, NCAR)
Sondes (BOM/NCAR)

SOCRATES: Southern Ocean Clouds Radiation Aerosol Transport Experimental Study
Lead PIs: Greg McFarquhar and Chris Bretherton
G-V Goal:▪ Characterize SO clouds, radiation, aerosols, and precipitation using
both cloud remote sensing and in-situ instrumentation on both
NSF/NCAR G-V and R/V Investigator

SOCRATES flights (Jan-Feb 2018)
• Cloud probes
• Aerosol/CCN/IFN
• W-band Doppler radar, lidar
• Dropsondes
• Turbulence
Investigator overflights
Macquarie Island overflights Macq
Is

A typical SOCRATES flight: RF10 8 Feb 2018

Mixed-phase: Secondary ice production dominant at 0 to -20 CE. Jarvinen/C. McCluskey (NCAR)
• INP concs. 0.1% of typical NH
• Lots of SLW but mixed with some
ice over broad temperature
range, especially 0 to -5℃
• Observed ice concentrations are
several orders of magnitude
above INP concentrations ->
secondary ice production
CAPRICORN I
Frozen drizzle droplets with spicule
Frozen drizzle droplets
PHIPS images

Reanalysis, nudged forecast skillful vs. in-situ u, v, T
ERA5 RMS u, v, T errors in remote SO remarkably small!24-hr CAM6 nudging to MERRA-2 maintains small errors – good!How about the hard stuff (clouds, precip, turbulence, aerosols, etc.)?
ERA5
SOCRATES-wide statistics vs. 1 min in-situ binned observations
RMSE ERA5 MERRA2 CAM6
U (m/s) 1.7 2.0 2.5V (m/s) 1.8 2.0 2.6T (K) 0.7 1.0 1.3RH (%) 17 19 27 (unnudged)
Courtesy I. McCoy

Relative humidity
CAM6 RH un-nudged, but still good
RMSE
17%
19%
27%
Courtesy I. McCoy

Cloud fraction
Courtesy I. McCoy
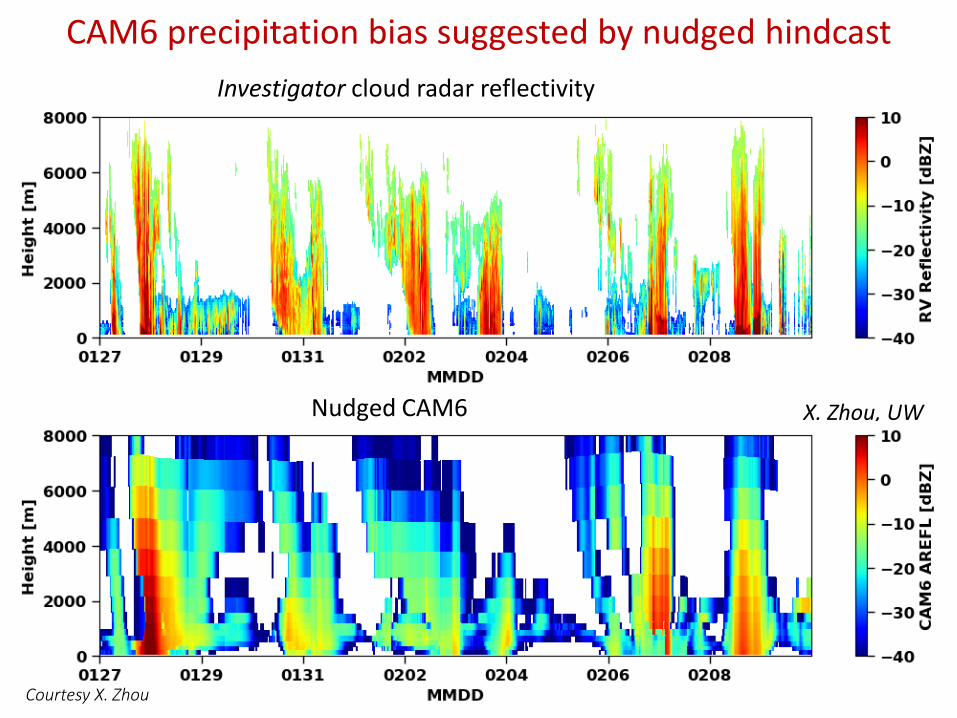
CAM6 precipitation bias suggested by nudged hindcast
Investigator cloud radar reflectivity
X. Zhou, UWNudged CAM6
Courtesy X. Zhou

Turbulence, LWC, Nd
Vertical velocity variance can be noisily estimated from 20 s samples. CAM6 overintensifies surface vs. cloud-driven turbulence.
CAM6 has decent liquid water profiles
CAM6 has low Nd in unstable BLs.
Courtesy R. Atlas

Conclusions
• High-quality forecasts greatly extend the reach of modern field campaigns, from planning to execution to context.
• CSET and the SOAR studies provide a wealth of comparison data for ECMWF models and reanalysis as well as for science.
• Reanalysis-nudged forecasts: a good test of GCM clouds/aerosols that makes use of the high quality of ERA5 and other modern reanalyses.
• Some fields (e. g. humidity) are good for direct comparison along flight tracks; others (e. g. cloud condensate) have small-scale structure that requires compositing to reveal meaningful observational signals.


MARCUS (Lead PI: Greg McFarquhar)
• Observations of SO clouds, aerosols, precipitation and radiation from AMF2 on an AAD icebreaker including near Antarctica.
• 29 October 2017 to 25 March 2018 (Austral spring-autumn)
Active remote sensing: 95-GHz radar & stabilized platform, lidar, ceilometer, radar wind profilerPassive remote sensing: AERI, Radiometers, Infrared thermometer, total sky imagerIn-situ aerosols: Size distributions, optical properties, absorptionGases: CO, O3
Meteorology: Wind speeds, rain gauges, disdrometers & soundings 4 times per day

CAM6 Accum/Aitken aerosol vs. UHSAS100, CN
Some skill for CCN-size aerosol CAM6 underestimates small aerosol
…room for improvement, especially when model predicts low CCN

High-resolution and LES modeling of SO clouds and aerosols
Vergara-Temprado et al. (2018) simulated a SE Atlantic cold-air outbreak with regional UK Unified Model at 2 km resolution.
They showed strong increase of simulated cloud cover with realistic ice nucleating particle concentrations 10-4-10-6 of previously assumed.
At UW, we are doing large-eddy simulation of SOCRATES cases.