cloud: to build or buy - can you justify on-premises it?
TRANSCRIPT

MT46: Cloud: to build or buy?
Can you justify on-premises IT?

Agenda:
• Adoption & trends
• Building the business case
• Myths and realities
• Next steps

IT operationsNeeds
• Meet service levels
• Extend security policies into the cloud
• Automate manual tasks
Business Driver
Transform to a
trusted service
provider/broker
State of cloud in the enterprise
Business leadersNeeds
• Faster time to market
• Enable transformation
• Improved efficiency and visibility
Business Driver
Leverage cloud as a
strategic advantage
Needs
• Advocated on-demand, self-service
• Choice of tools, resources and technology
Developers
Business Driver
More productivity,
fewer constraints
Challenges• No unified plan
• Disparate systems
• Limited cloud expertise
• Legacy systems
management

Can anyone get beyond the hype?
4
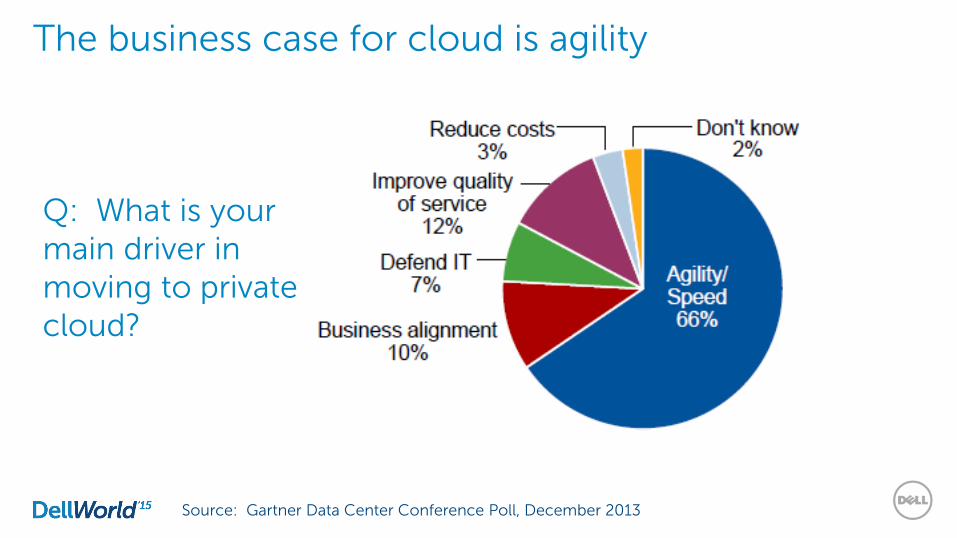
The business case for cloud is agility
Q: What is your main driver in moving to private cloud?
Source: Gartner Data Center Conference Poll, December 2013

Key takeaways: 2014 Forrester Report The public cloud market is now in hypergrowth
7
By the year 2020:
Public cloud market will rise to $191 Billion,increasing 20% over 2011
• Attractiveness of cloud is rising, but barriers to adoption still remain
• Concerns about security, integration, performance, and cost models remain.
• Cloud adoption will be a complement to, not a replacement of, on-premises
• Cloud will become an increasingly large part of technology market, especially as a complement to core on-premises transactional systems.
Global public cloud platform
services
Cloudbusinessservices
Cloud appsor
SaaS
$44 Billion
$14Billion
$131 Billion

From: ESG Research Report: 2015 IT Spending Intentions Survey. Source: Enterprise Strategy Group, 2015.
The increasing use of cloud computing to reduce/contain
costs – ESG Research

9From: ESG Research Report: 2015 IT Spending Intentions Survey. Source: Enterprise Strategy Group, 2015.
2014 to 2015 spending change in specific
technology areas – ESG Research
Q: To the best of your knowledge, to what extent will your organization’s 2015 IT spending for each technology listed change relative to 2014?(percent of respondents)
2015 spending will increase
2015 spending will stay flat
2015 spending will decrease

Forrester Total Economic Impact (TEI) of Private Cloud

Forrester’s Total Economic Impact: a framework for studying and quantifying impact of solutions or market trends on organizations & businesses.
• Survey of 40 customers across broad range of organizations, and two deep-dive customer interviews
• As part of the TEI methodology, Forrester synthesized a composite organization and applied financial & efficiency modeling to further validate analysis and results.
Baseline: The Total Economic Impact of Private CloudCost Savings And Business Benefits Enabled By Private Cloud

The analysis points to three year benefits of $13,545,616 versus three year costs of
$6,406,435, adding up to a net present value (NPV) of $7,139,181.
With private cloud:– IT management efficiency was improved 10%, – application delivery was reduced by 30 days, and – the composite organization experienced additional savings in business end-user
productivity and hardware, software, and facilities cost savings.
Overall results and key findings from exec summary
Source: Forrester Research, Inc.
ROI
111%
NPV
$7,139,181
Payback
13.2 months

TEI: “myths & realities”

Cloud = data center outsourcing
You need a one cloud solution
“Cloud means loss of control & securityCloud & Automation
means IT teams become obsolete
Common cloud assumptions
Cloud costs more to build than buy
“Cloud“ means public cloud
Cloud takes a long time to deploy
Virtualization=
Private Cloud
Cloud is alwaysabout money!

Of the customers interviewed or surveyed – “Prior to the investment in private cloud, most of these organizations had virtualized
less than 50% of their infrastructure environment. Approximately half of the respondents were also using public cloud resources at the time of the private cloud investment.”
Message here is: anyone can be a candidate for private & hybrid cloud, not just your mature, highly virtualized customers.
You have to be killing it with virtualization to be ready for a private cloud…
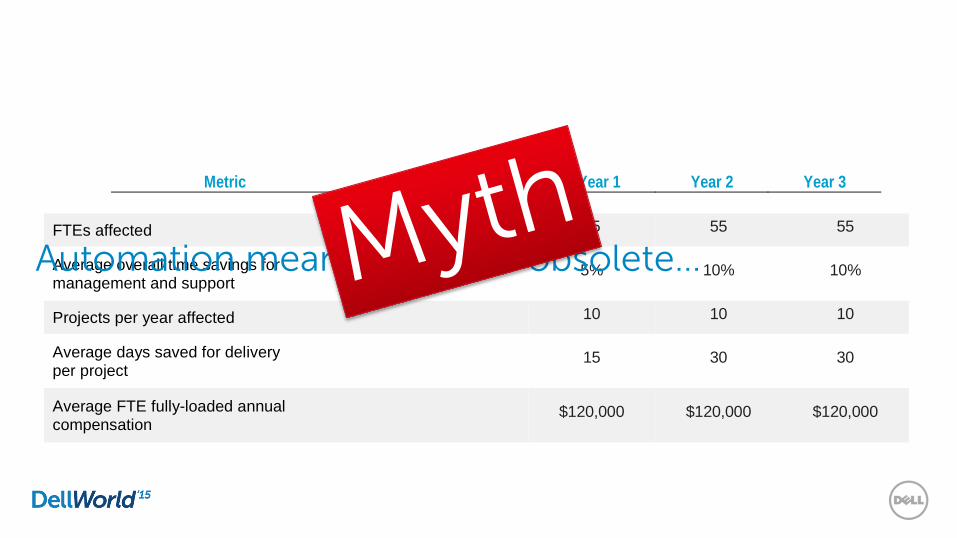
FTEs affected 55 55 55
Average overall time savings for management and support
5% 10% 10%
Projects per year affected 10 10 10
Average days saved for delivery per project
15 30 30
Average FTE fully-loaded annual compensation
$120,000 $120,000 $120,000
Metric Calculation Year 1 Year 2 Year 3
Source: Forrester Research, Inc.
Automation means IT staff is obsolete…

Among many other challenges, this was a common thread:– Provisioning of resources was often a lengthy process, which frustrated business
users and application developers responsible for innovation and operational efficiency. This meant that some business units relied on public cloud resources, circumventing IT…
“If we hadn’t gone the private cloud route, we would have been inundated with physical servers. Our data centers were constrained already and we didn’t want to build new ones. Or our users would have gone third party.”~ Staff technologist
Bad processes drive users underground

Internally, they have to SELL IT! – Private Cloud is NOT a “Field of Dreams” scenario (build it & they will come)
– Driving adoption of the platform is KEY
– Create new usage patterns & ways for IT & business units to work together
Customers surveyed spoke about how they REDEFINED their IT management– Broke down silos & changed the structure to suit the business better
– Created new, cross functional roles (i.e. Cloud admin)
– Take a “cloud first” approach
Business leaders and IT management MUST BE the driving force for change

The Organization experienced a number of quantified benefits:
6 (+1) Primary Economic Benefits
1. IT management and project delivery efficiencies.
2. Improved business agility and productivity.
3. Server and facilities cost savings.
4. Software, storage, and Networking cost savings.
5. Improved security and compliance.
6. Reduced downtime.
7. Decreased use of public cloud resources. While not quantified as part of the financial business case, this benefit is described in more detail within the study.

1. IT Management & Project Delivery EfficienciesSave hundreds of project days!
Source: Forrester Research, Inc.

Application innovation & performance improvement yield incremental revenue of $1M / year on average.
2. Business Agility & Productivity = BIG $$$It’s not just lip-service
Metric Calculation Year 1 Year 2 Year 3
Incremental revenue $1,000,000 $1,000,000 $1,000,000
Average improvement in business end-user productivity
2% 4% 4%
Business end-users affected 1,250 2,500 2,500
Average end-user fully-loaded compensation
$65,000 $65,000 $65,000
Productivity capture 30% 30% 30%
Improved business agility and productivity
B1+(B2*B3*B4*B5) $1,487,500 $2,950,000 $2,950,000
Risk adjustment ↓15%
Improved business agility and productivity (risk-adjusted)
$1,264,375 $2,507,500 $2,507,500
Source: Forrester Research, Inc.

While the organization’s networking cost savings are due to reducing the data center footprint and virtualizing networking assets, another important contributor to networking cost savings is potential reduction of ISP network costs.
By reducing the use of public cloud services, organizations may see further networking cost savings that are not included in this study.
4. Networking cost savings & avoidanceMetric Calculation Year 1 Year 2 Year 3
Annual software spend $17,760,000
Average software cost savings
1% 2% 2%
Annual storage spend $5,328,000
Average storage cost savings
7% 10% 28%
Annual networking spend $9,990,000
Average networking cost savings
3% 4% 6%
Software, storage, and networking cost
savings (D1*D2)+(D3*D4)+(D5*D6) $850,260 $1,287,600 $2,446,440
Risk adjustment ↓5%
Software, storage, and networking
cost savings (risk-adjusted) $807,747 $1,223,220 $2,324,118
Source: Forrester Research, Inc.

• Public cloud services reduction
• While The Organization continues to host some of its applications on the public cloud, bringing applications in-house helped to reduce public cloud costs by approximately $240,000 per year.
• Potential adjustment in amount of big pipes required to support # of users receiving application services externally (this was not included in this study)
• Benefit of unified governance & control of externally hosted data & apps (efficient hybrid cloud usage becomes the norm)
7. Reduction of public cloud usage + Full visibility for seamless hybrid cloud environment

Total benefits roll upBenefit Category Year 1 Year 2 Year 3 Total Present Value
IT management and project delivery efficiencies $359,308 $718,615 $718,615 $1,796,538 $1,460,447
Improved business agility and productivity $1,264,375 $2,507,500 $2,507,500 $6,279,375 $5,105,668
Server and facilities cost savings $310,175 $474,715 $506,350 $1,291,240 $1,054,732
Software, storage, and networking cost savings $807,747 $1,223,220 $2,324,118 $4,355,085 $3,491,385
Improved security and compliance $693,500 $693,500 $693,500 $2,080,500 $1,724,632
Reduced downtime $285,000 $285,000 $285,000 $855,000 $708,753
Total benefits (risk-adjusted) $3,720,105 $5,902,550 $7,035,083 $16,657,738 $13,545,616
Source: Forrester Research, Inc.
Next Steps - Driving the transformation

Technology is not the reason implementations fail

People make hybrid cloud real
Challenges:
- Staff buy-in
- Shifting IT culture
- New IT-business relationship
- Turning IT into change leaders
- Developing career paths
- Better implement matrix organizations
Leadership:
- What is their motivation?
Changing roles:
- Capacity planning
- Service management process owners
New org. structures:
- Service-focused
- Incubated
- Cloud brokerage
New roles:
- Orchestration/brokerage specialist
- Service manager
- Infrastructure admin
- Cloud service provider expert
- Cloud service architect

CIO checklist
Decide if private or hybrid is right for your organization
Private cloud is growing but giving way to hybrid cloud
Identify the right use cases/services for your cloud.
Build internal cloud champions.
Keep a maniacal focus on the business goals.
Create metrics that measure success —especially agility.
Design with future public cloud interoperability in mind — think broker.
Incubate your private cloud project —staff, processes and technology.

Scan this code & Download the Forrester TEI NOW!

Placeholder -- Dell cloud estimator tool

Things to do when you leave Dell World
Meet with your Dell team, do a whiteboard session and run your ROI numbers;
Research your cloud options – start small, think future;

Things to do while you’re here at Dell World
Expo areas to see
• Explore the solutions center “Data Center” and “Cloud” areas
Other sessions to attend
• MT47: So you need to build a private cloud. What now? Best practices for building your cloud
• MT48: Prescriptive Cloud Services for the Future Ready Enterprise
• MT51: Extensibility: The key to managing your entire cloud portfolio

Thanks!

Add’l slide library

Financial Summary: 13.2 month payback, 111% ROI
Source: Forrester Research, Inc.

VRTX compared to public cloud for database services
63.9% lower five year TCO,
13 month payback
Opex factors:
Cost per VM running OLTPdatabase services
*Includes hardware, software, maintenance, energy and administrative salary
Build versus buy? On premises can have better TCO
Principled Technologies study, Jun. 2013 - http://www.principledtechnologies.com/Dell/VRTX_vs_cloud_0613.pdf

Build versus buy? On premises can have better TCO
MS private cloud on Dell m1000e versus public cloud
$359,193
$959,494
$0
$200,000
$400,000
$600,000
$800,000
$1,000,000
$1,200,000
Dell solutionwith Microsoft private cloud
Leading publiccloud service
Do
llars
(US)
Five-year TCO
Year 5
Year 4
Year 3
Year 2
Year 1
62.6% lower
five year TCO,
15 month
payback
Principled Technologies study, Aug. 2014 - http://www.principledtechnologies.com/Dell/Microsoft_Private_Cloud_TCO_0914.pdf

Controlling cloud costs:
• OLTP database services simulatedfor 3500 orders per minute
• Cost/VM running workload on public cloud versus on-premises including hardware, software, energy and administrative salary
Build versus buy? On premises can have better TCO
Principled Technologies study, Aug. 2014 - http://www.principledtechnologies.com/Dell/Microsoft_Private_Cloud_TCO_0914.pdf
$600K
saved *
*$600,301.01 saved with the Dell – Microsoft cloud solution
MS private cloud on Dell m1000e versus public cloud