cloud deposition monitoring clingmans dome, tn
TRANSCRIPT

Cloud Deposition Monitoring Clingmans Dome, TN
Summary Report, October 2012
G r e a t S m o k y M o u n t a i n s N a t i o n a l P a r k

AMEC Environment & Infrastructure, Inc.
Cloud Deposition Monitoring Clingmans Dome, TN
Great Smoky Mountains National Park
Summary Report
Prepared for:
U.S. Environmental Protection Agency Clean Air Markets Division Office of Air and Radiation
Washington, DC
EPA Contract Number: EP-W-09-028
Prepared by:
AMEC Environment & Infrastructure, Inc. Gainesville, FL
AMEC Project Number: 6064110217
October 2012

Cloud Deposition Monitoring – Clingmans Dome, TN – Great Smoky Mountains National Park – Summary Report
i AMEC Environment & Infrastructure, Inc.
Table of Contents
1.0 Introduction ................................................................................................................1 2.0 Project Description and Methods .............................................................................2
2.1 Field Operations ....................................................................................................2 2.2 Laboratory Operations ..........................................................................................3 2.3 Data Management .................................................................................................4 2.4 Quality Assurance .................................................................................................5
3.0 Project Results ............................................................................................................6 3.1 Liquid Water Content and Cloud Frequency ........................................................6 3.2 Sample Collection and Acceptance ......................................................................7 3.3 Cloud Water Chemistry ........................................................................................8 3.4 Cloud Water Deposition .....................................................................................12 3.5 Total Deposition..................................................................................................15
4.0 Conclusions ...............................................................................................................17 4.1 Cloud Water Concentrations and Deposition Estimates .....................................17 4.2 Future Studies .....................................................................................................19
5.0 References .................................................................................................................21 List of Tables List of Figures

Cloud Deposition Monitoring – Clingmans Dome, TN – Great Smoky Mountains National Park – Summary Report
ii AMEC Environment & Infrastructure, Inc.
List of Tables Table 3-1. Number of Cloud Water Samples Accepted for Analyses Table 4-1. Power Plant Emission Reductions (percent) from 2000 through 2011 for
Tennessee and Nearby States
List of Figures Figure 3-1. Monthly Cloud Frequency Statistics (1995–2007, 2009–2011) Figure 3-2. Monthly Mean Liquid Water Content Statistics (1995–2007, 2009–2011) Figure 3-3. Mean Major Ion Concentrations of Cloud Water Samples (1995–2007,
2009–2011) Figure 3-4. Mean Minor Ion Concentrations of Cloud Water Samples (Cations and Chloride)
1995–2007, 2009–2011 Figure 3-5. Mean Seasonal Cloud Water versus Mean Seasonal Precipitation Sulfate
Concentrations, 1995–2011 Figure 3-6. Mean Seasonal Cloud Water versus Mean Seasonal Precipitation Nitrate
Concentrations, 1995–2011 Figure 3-7. Seasonal Deposition Estimates for Major Ions (1999–2007, 2009–2011) Figure 3-8. Seasonal Deposition Estimates for Hydrogen (1999–2007, 2009–2011) Figure 3-9. Mean 3-year Seasonal Deposition Estimates for Major Ions, 1999–2001
and 2009–2011 Figure 3-10. Cloud Water and Wet Sulfate Deposition Estimates (June through September,
1995–2011) Figure 3-11. Cloud Water and Wet Nitrate Deposition Estimates (June through September,
1995–2011) Figure 3-12. Seasonal Sulfur Deposition (2000–2011) Figure 3-13. Seasonal Nitrogen Deposition (2000–2011) Figure 4-1. Seasonal Cloud Water SO2-
4 Concentrations and Depositions and TVA Annual SO
2 Emissions (2000–2011) Figure 4-2. Seasonal Cloud Water NO-
3 Concentrations and Depositions and TVA Annual NOx Emissions (2000–2011)

Cloud Deposition Monitoring – Clingmans Dome, TN – Great Smoky Mountains National Park – Summary Report
iii AMEC Environment & Infrastructure, Inc.
List of Acronyms and Abbreviations AMEC AMEC Environment & Infrastructure, Inc. °C degrees Celsius Ca2+
calcium ion CASTNET Clean Air Status and Trends Network CCV continuing calibration verification spikes CLOUD cloud water deposition computer model Cl- chloride ion CLD303 Clingmans Dome, TN sampling site cm centimeter DAS data acquisition system EPA U.S. Environmental Protection Agency g/m3
grams per cubic meter GRS420 Great Smoky Mountains National Park, TN dry deposition sampling site H+
hydrogen ion HNO
3 nitric acid K+
potassium ion kg/ha kilograms per hectare Lpm liters per minute LWC liquid water content m meters MADPro Mountain Acid Deposition Program MCCP Mountain Cloud Chemistry Program Mg2+
magnesium ion N nitrogen Na+
sodium ion NADP National Atmospheric Deposition Program NTN National Trends Network NAPAP National Acid Precipitation Assessment Program NH +
4 ammonium ion NO-
3 nitrate ion NOx oxides of nitrogen NPS National Park Service pH p(otential of) H(ydrogen) PVM particle volume monitor QA quality assurance QAPP Quality Assurance Project Plan QC quality control RPD relative percent difference

Cloud Deposition Monitoring – Clingmans Dome, TN – Great Smoky Mountains National Park – Summary Report
iv AMEC Environment & Infrastructure, Inc.
List of Acronyms and Abbreviations (continued) S sulfur SO2-
4 sulfate ion SO
2 sulfur dioxide TN11 Elkmont, TN NADP/NTN wet deposition sampling site TVA Tennessee Valley Authority µeq/L microequivalents per liter µg/filter micrograms per filter
Cloud Deposition Monitoring – Clingmans Dome, TN – Great Smoky Mountains National Park – Summary Report
1 AMEC Environment & Infrastructure, Inc.
1.0 Introduction The Mountain Acid Deposition Program (MADPRO) began in 1993 as part of the Environmental Protection Agency’s (EPA) Clean Air Status and Trends Network (CASTNET) and operated through September 2011. MADPRO data contributed to CASTNET’s objective of determining the status and trends in air quality and pollutant deposition as well as relationships among emissions, air quality, and ecological effects. The program accomplished this by updating the cloud water concentration and deposition data collected by the Mountain Cloud Chemistry Project (MCCP) during the National Acid Precipitation Assessment Program (NAPAP) of the 1980s.
Cloud water samples were collected at Clingmans Dome, TN (CLD303) in the Great Smoky Mountains National Park during the warm season (usually May through October) and analyzed for their pollutant constituents. The cloud water concentrations were then used for estimation of cloud deposition of these pollutants.
CLD303 was operated under the direction and funding of EPA and the Tennessee Valley Authority (TVA) with infrastructure support provided by the National Park Service (NPS). For more details on the operating history of MADPRO, as well as the MCCP, please refer to previous MADPRO reports (http://java.epa.gov/castnet/documents.do) and MADPro: Cloud Deposition to the Appalachian Mountains, 1994 to 1999 (EPA, 2000).
The MADPRO task order under EPA Contract No. EP-W-09-028 will end 31 October 2012. To date, the collection site has been decommissioned, all samples have been analyzed, and the 2011 results reported in the 2011 annual report (AMEC, 2012). The purpose of this report is to provide a summary of project results and conclusions with suggestions for future cloud water research.
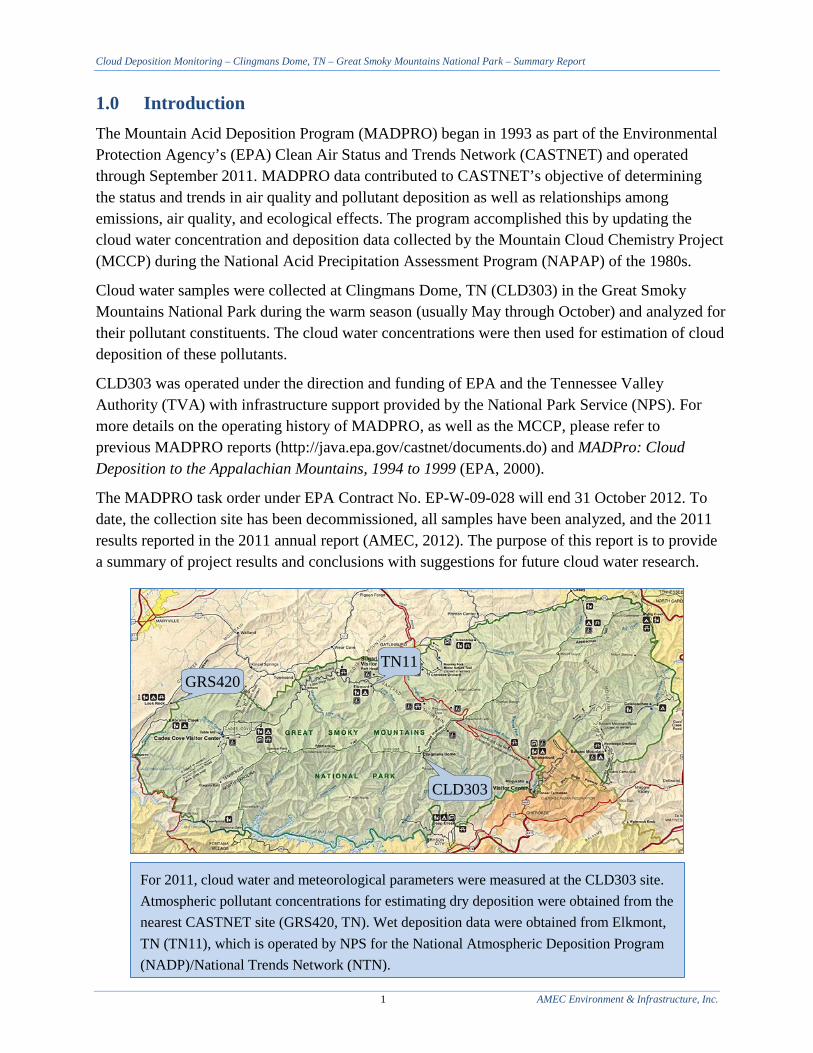
For 2011, cloud water and meteorological parameters were measured at the CLD303 site. Atmospheric pollutant concentrations for estimating dry deposition were obtained from the nearest CASTNET site (GRS420, TN). Wet deposition data were obtained from Elkmont, TN (TN11), which is operated by NPS for the National Atmospheric Deposition Program (NADP)/National Trends Network (NTN).
GRS420 TN11
CLD303

Cloud Deposition Monitoring – Clingmans Dome, TN – Great Smoky Mountains National Park – Summary Report
2 AMEC Environment & Infrastructure, Inc.
2.0 Project Description and Methods Clingmans Dome (35'33'47"N, 83'29'55"W) is the highest mountain [summit 2,025 meters (m)] in the Great Smoky Mountains National Park. The solar-powered CLD303 site was situated at an elevation of 2,014 m approximately 100 m southeast of the summit tourist observation tower. Electronic instrumentation was housed in a small NPS building, and the cloud water collector, particle volume monitor (PVM), and meteorological sensors were positioned on top of a 50-foot scaffold tower. Collection of cloud water samples was initiated each spring, as soon as local conditions would allow, and continued through the warm season, generally ending in October.
2.1 Field Operations The cloud collection system consisted of an automated cloud water collector for bulk cloud water sampling, a PVM for continuous determination of cloud liquid water content (LWC) and cloud frequency, and a data acquisition system (DAS) for collection and storage of electronic information from the various monitors and sensors. Continuous measurements of wind speed, wind direction, temperature, solar radiation, relative humidity, wetness, and precipitation were collected through 2004. Beginning in 2005, only those sensors essential for the operation of the cloud collector (namely, temperature and precipitation sensors and a rain gauge) were deployed. The scalar wind speed data required for calculation of cloud deposition estimates were obtained from the NPS instrument situated on a tower located next to the cloud collection tower. Prior to 2005, the site deployed the same 3-stage filter pack system for dry deposition estimation that is used at all CASTNET sites. Starting in 2005, these data were obtained from the Great Smoky Mountains National Park, TN, CASTNET site (GRS420), which is located 26 miles west, northwest of the Clingmans Dome cloud water sampling site.
The core of the automated cloud collection system is a passive string collector previously used in the MCCP study. The development and design of the original system is described in detail in Baumgardner et al. (1997).
Collector in Up Position
Cloud Water Collector

Cloud Deposition Monitoring – Clingmans Dome, TN – Great Smoky Mountains National Park – Summary Report
3 AMEC Environment & Infrastructure, Inc.
The PVM-100 by Gerber Scientific (Gerber, 1984) measures LWC and effective droplet radius of ambient clouds by directing a diode-emitted 780-nanometer wavelength laser beam along a 40-centimeter (cm) path. The forward scatter of the cloud droplets in the open air along the path is measured, translated, and expressed as water in grams per cubic meter (g/m3
) of air. The data logger was programmed so that the collector was activated and projected out of the protective housing when threshold levels for LWC (0.05 g/m3
) and ambient air temperature [≥ 2 degrees Celsius (°C)] were reached. Within the context of MADPro, a cloud was defined by a LWC of 0.05 g/m3
or higher, as measured by the PVM. In addition, the system was activated only when no precipitation was measured.
Filter packs for collection of dry deposition samples at the nearby GRS420 site were prepared and shipped to the field on a weekly basis and exchanged at the site every Tuesday. For a description of the filter pack set-up, types of filters used, and the fraction collected on each filter, refer to the CASTNET Quality Assurance Project Plan (QAPP) Revision 7.0 (AMEC, 2011). A discussion of filter pack sampling artifacts can be found in Anlauf et al. (1986) and Lavery et al. (2007). Filter pack flow at the CASTNET GRS420 site is maintained at 3.0 liters per minute (Lpm) with a mass flow controller.
2.2 Laboratory Operations Cloud water samples for the project were analyzed for sodium (Na+
), potassium (K+ ),
ammonium (NH +4), calcium (Ca2+
), magnesium (Mg2+ ), chloride (Cl-), nitrate (NO-
3), and sulfate (SO2-
4) ions in the AMEC Environment & Infrastructure, Inc. (AMEC) CASTNET laboratory in Gainesville, FL. All samples were analyzed for pH and conductivity in the AMEC CASTNET laboratory for comparison with the field values.
Particle Volume Monitor

Cloud Deposition Monitoring – Clingmans Dome, TN – Great Smoky Mountains National Park – Summary Report
4 AMEC Environment & Infrastructure, Inc.
Concentrations of the three anions (SO2-4 , NO-
3, and Cl-) were determined by micromembrane-suppressed ion chromatography. Analysis of samples for Na+
, Mg2+ , Ca2+
, and K+ was performed
with a Perkin-Elmer Optima 7300 Dual View inductively coupled argon plasma-atomic emission spectrometer. The automated indophenol method using a Bran+Luebbe Autoanalyzer 3 was used to determine NH +
4 concentrations.
Filter pack samples were loaded, shipped, received, extracted, and analyzed at the CASTNET laboratory. For specific extraction procedures refer to Anlauf et al. (1986) and the CASTNET QAPP (AMEC, 2011). Filter packs contain three filter types in sequence: a Teflon filter for collection of aerosols, a nylon filter for collection of nitric acid (HNO
3) and SO 2, and dual
potassium carbonate-impregnated cellulose filters for collection of SO 2. Following receipt from
the field, exposed filters and unexposed blanks were extracted and analyzed for SO2-4 , NO-
3, Cl-, and the cations, NH +
4, Na+ , Mg2+
, Ca2+ , and K+
, as described previously for cloud water samples. Refer to the CASTNET QAPP (AMEC, 2011) for detailed descriptions of laboratory receipt, breakdown, storage, extraction, and analytical procedures.
Atmospheric concentrations derived from filter extracts were calculated based on the volume of air sampled following validation of the hourly flow data. Atmospheric concentrations of particulate SO2-
4 , NO- 3, NH +
4, Na+ , K
+ , Ca2+
, Mg2+ , and Cl- were calculated based on analysis of
Teflon filter extracts; HNO 3 was calculated based on the NO-
3 found in the nylon filter extracts; some SO
2 was trapped by the nylon filter, so SO 2 was calculated based on the sum of SO2-
4 found in nylon and cellulose filter extracts.
2.3 Data Management Continuous data (temperature, precipitation, LWC, and cloud collector status information) were collected in hourly and 5-minute averages. Hourly data were collected daily via Internet protocol-based polling. The hourly data and associated status flags were ingested into Microsoft Excel spreadsheets. The PVM data were validated based on the end-of-season calibration results, periodic calibration check results, and information provided by status flags and logbook entries.
Discrete data for cloud water sample results and filter pack sample results were managed by Element, the laboratory information management system. In Element, the analytical batches were
3-Stage Filter Pack

Cloud Deposition Monitoring – Clingmans Dome, TN – Great Smoky Mountains National Park – Summary Report
5 AMEC Environment & Infrastructure, Inc.
processed through an automated quality control (QC) check routine. For each analytical batch, an alarm flag was generated if any of the following occurred:
• Insufficient QC data were run for the batch; • Sample response exceeded the maximum standard response in the standard curve
(i.e., sample required dilution); • Continuing calibration verification (CCV) spikes exceeded recovery limits; or • Reference samples exceeded accuracy acceptance limits.
A batch with one or more flags was accepted only if written justification was provided by the Laboratory Operations Manager or his designee.
For cloud water samples, an additional check involved calculating the percent difference of cations versus anions (ion balance), which provided another diagnostic for determining whether the analysis should be repeated or verified.
Atmospheric concentrations for filter pack samples were calculated by merging validated continuous flow data with the laboratory data [micrograms per filter (µg/filter)].
2.4 Quality Assurance The quality assurance (QA) program consisted of the same routine audits performed for CASTNET, if applicable, and testing/comparison of instruments unique to cloud water sampling. QA procedures are documented in greater detail in the MADPro Quality Assurance Plan, which is Appendix 10 to the CASTNET QAPP (AMEC, 2011).

Cloud Deposition Monitoring – Clingmans Dome, TN – Great Smoky Mountains National Park – Summary Report
6 AMEC Environment & Infrastructure, Inc.
3.0 Project Results 3.1 Liquid Water Content and Cloud Frequency The cloud LWC is an important measurement for the determination of deposition of cloud water. The LWC value also defines when the site is in cloud and is, therefore, integral in calculating the cloud frequency at the site. Monthly cloud frequencies for the project were determined by calculating the relative percent of all hourly LWC values equal to or greater than 0.05 g/m3
, or:
where: n is the number of valid hourly LWC values per month and CF is cloud frequency
Any month with less than 70 percent valid LWC data was not considered representative of the monthly weather conditions for that month. Cloud frequencies varied substantially from month to month, year to year, and from location to location. Figure 3-1 presents the mean monthly project cloud frequency statistics from 1995 through 2011 and illustrates the wide range of cloud frequency values from the project monthly minimum value of 12.9 percent in September 2005 to the maximum value of 67.9 percent for June 2004. Figure 3-1. Monthly Cloud Frequency Statistics (1995–2007, 2009–2011)
Note: * Values associated with this column are based on seasonal averages.
0
10
20
30
40
50
60
70
80
June July August September Project Mean*
Perc
ent C
loud
Fre
quen
cy
Project Mean
Project Minimum
Project Maximum
2004
2001
2001 2007
2001
2010 2006
2007
2005
2010
n )g/m 0.05values LWChourly valid of (#*100CF
3≥=

Cloud Deposition Monitoring – Clingmans Dome, TN – Great Smoky Mountains National Park – Summary Report
7 AMEC Environment & Infrastructure, Inc.
The project monthly mean, minimum, and maximum LWC values for the months of June through September for 1994 through 2007 and 2009 through 2011 are shown in Figure 3-2. Mean LWC was calculated by taking the average of all hourly LWC values equal to or greater than 0.05 g/m3
during the month. Only valid values passing the 70 percent completeness criterion were plotted. LWC values varied from a project minimum of 0.157 g/m3
in August 2007 to a project maximum of 0.418 g/m3
in September 2002. Figure 3-2. Monthly Mean Liquid Water Content Statistics (1995–2007, 2009–2011)
Note: * Values associated with this column are based on seasonal averages.
3.2 Sample Collection and Acceptance Since the onset of the project, 1,876 samples were collected with 1,717 of these samples passing acceptance criteria (Table 3-1). Samples were accepted and used for estimation of cloud water deposition on the cation-to-anion ratio. Samples were usually eliminated if:
• Both the anion sum and cation sum were ≤ 100 microequivalents per liter (µeq/L), and the absolute value of the relative percent difference (RPD) was > 100 percent; or
• Either the anion sum or the cation sum was > 100 µeq/L, and the absolute value of the RPD was > 25 percent.
The RPD was calculated from the following formula:
RPD = 200* |cations – anions|/(cations + anions)
0.00
0.05
0.10
0.15
0.20
0.25
0.30
0.35
0.40
0.45
June July August September Project Mean*
Liqu
id W
ater
Con
tent
(g/m
3 )
Project Mean
Project Minimum
Project Maximum
2000 2006
2007 2000 2000
1999 2005 2009
2002
2009

Cloud Deposition Monitoring – Clingmans Dome, TN – Great Smoky Mountains National Park – Summary Report
8 AMEC Environment & Infrastructure, Inc.
On occasion, samples exceeding these criteria were accepted and used for analyses. In most of these cases, a low field pH value [high hydrogen (H+
) concentration] caused the cation sum to be larger, which in turn caused exceedance of the criteria. Table 3-1. Number of Cloud Water Samples Accepted for Analyses
Year Total Number of
Samples Number of Samples
Accepted Percent Accepted 1994a 14 9 64 1995a 142 136 96 1996a 122 105 86 1997a 334 324 97 1998a 341 269 79 1999a 174 174 100 2000b 104 102 98 2001c 73 70 96 2002c 75 65 87 2003c 78 78 100 2004c 73 73 100 2005c 64 63 98 2006c 45 45 100 2007c 54 54 100 2009c 85 58 68 2010c 55 50 91 2011c 43 42 98
Total 1876 1717 92% Note: a Hourly samples — sample collection bottle changed every hour.
b Hourly + daily samples (62 hourly and 42 24-hour samples in year 2000) c Daily samples — sample collection bottle changed every 24 hours.
3.3 Cloud Water Chemistry Seasonal mean concentrations of the major ions (SO2-
4 , H+ , NH +
4, and NO- 3) are presented in
Figure 3-3 where a “season” is defined as the period June through September. The seasonal concentrations of these major ions basically exhibit the same pattern of increases and decreases with respect to each other with a few exceptions over the years. In general, after a period of increase from 1995 to 2001, the major ion concentrations in cloud water have decreased except for a 3-year period from 2005 through 2007 when all seasonal concentrations, except for hydrogen, increased. There appears to be a rather precipitous decline in concentrations after 2007. However, the project did not operate in 2008, and the decrease in concentrations may not have been as steep if data had been available for 2008. Nevertheless, the major ion concentrations do not exhibit much of a trend since 1995. This lack of a discernible trend is partially explained by the climatic and ecological factors unique to high-elevation ecosystems.

Cloud Deposition Monitoring – Clingmans Dome, TN – Great Smoky Mountains National Park – Summary Report
9 AMEC Environment & Infrastructure, Inc.
Figure 3-3. Mean Major Ion Concentrations of Cloud Water Samples (1995–2007, 2009–2011)
Note: * Laboratory pH data instead of field pH data were used for calculating the 2001, 2006, 2007, 2009, 2010, and 2011 hydrogen
concentration values.
0
50
100
150
200
250
300
350
400
450
500
550
600
µeq/
L
Sulfate
Nitrate
Ammonium
Hydrogen

Cloud Deposition Monitoring – Clingmans Dome, TN – Great Smoky Mountains National Park – Summary Report
10 AMEC Environment & Infrastructure, Inc.
The seasonal mean concentrations of the minor ions of (Ca2+ , Mg2+
, Na+ , K
+ , and Cl-) are
presented in Figure 3-4. As with the major ions, there is no discernible trend in these concentrations other than perhaps an upward trend in Ca2+
concentrations after the project low concentration of 27.07 µeq/L in 2004. Figure 3-4. Mean Minor Ion Concentrations of Cloud Water Samples (Cations and Chloride)
1995–2007, 2009–2011
Seasonal mean cloud water concentrations for SO2-
4 and NO- 3
were compared to seasonal mean precipitation concentrations for SO2-
4 and NO- 3. The precipitation
concentration data were obtained from the NADP/NTN site at Elkmont, TN (TN11). Figures 3-5 and 3-6 present these comparisons for SO2-
4 and NO- 3,
respectively, from 1995 through 2011. Precipitation concentrations do not show a discernible trend
but follow, with a few exceptions (in particular for SO2-4), the same general pattern of increases
and decreases as the cloud water concentrations, especially since 2004.
0
20
40
60
80
100
µeq/
L
Calcium
Magnesium
Sodium
Potassium
Chloride

Cloud Deposition Monitoring – Clingmans Dome, TN – Great Smoky Mountains National Park – Summary Report
11 AMEC Environment & Infrastructure, Inc.
Figure 3-5. Mean Seasonal Cloud Water versus Mean Seasonal Precipitation Sulfate Concentrations, 1995–2011
Figure 3-6. Mean Seasonal Cloud Water versus Mean Seasonal Precipitation Nitrate
Concentrations, 1995–2011
0
10
20
30
40
50
60
0
50
100
150
200
250
300
350
400
450
500
Precipitation Concentration (µeq/L)C
loud
Wat
er C
once
ntra
tion
(µeq
/L)
Cloud Sulfate
Precipitation Sulfate
0
2
4
6
8
10
12
14
16
18
20
0
50
100
150
200
250
Precipitation Concentration (µeq/L)C
loud
Wat
er C
once
ntra
tion
(µeq
/L)
Cloud Nitrate
Precipitation Nitrate

Cloud Deposition Monitoring – Clingmans Dome, TN – Great Smoky Mountains National Park – Summary Report
12 AMEC Environment & Infrastructure, Inc.
3.4 Cloud Water Deposition Cloud water depositions were estimated by applying the CLOUD model (Lovett, 1984), parameterized with site-specific cloud water chemistry, LWC, and wind speed data from CLD303 for 1994 through 2007 and 2009 through 2011.These data were screened by AMEC and provided to G.M. Lovett. The reports by Lovett, which discuss CLOUD and the CLOUD deposition modeling results for individual years, were included as an appendix in each corresponding MADPro annual report (e.g., AMEC, 2012). For a detailed description of the CLOUD model and Lovett’s procedures please see recent MADPro reports at http://java.epa.gov/castnet/documents.do under “Cloud Deposition,” and MADPro: Cloud Deposition to the Appalachian Mountains, 1994-1999 (EPA, 2000).
Data sets from 1997, 1999 through 2007, and 2009 through 2011 were sufficiently complete to estimate a seasonal value. A season is defined as June through September, and three of the four months were required to calculate the seasonal deposition. Figure 3-7 presents the seasonal deposition estimates as kilograms per hectare (kg/ha) for the major ions from 1999 through 2007 and from 2009 through 2011, and, unlike the cloud water concentrations (Figure 3-3), depicts an overall decrease in seasonal deposition estimates. Because the H+
deposition estimates are much lower with respect to the other three ions, only H+
deposition estimates are plotted in Figure 3-8 to better illustrate the decrease in these values over the years. Figure 3-7. Seasonal Deposition Estimates for Major Ions (1999–2007, 2009–2011)
0.0
10.0
20.0
30.0
40.0
50.0
60.0
70.0
80.0
90.0
100.0
1999 2000 2001 2002 2003 2004 2005 2006 2007 2008 2009 2010 2011
kg/h
a
Sulfate
Nitrate
Ammonium
Hydrogen

Cloud Deposition Monitoring – Clingmans Dome, TN – Great Smoky Mountains National Park – Summary Report
13 AMEC Environment & Infrastructure, Inc.
Figure 3-8. Seasonal Deposition Estimates for Hydrogen (1999–2007, 2009–2011)
The information in Figure 3-7 was also compared by averaging the data in 3-year increments from 1999 through 2001 and from 2009 through 2011 (Figure 3-9). The decreases in average SO2-
4 , NO- 3,
NH +4, and H+
deposition estimates were 77 percent (84.2 kg/ha versus 19.6 kg/ha), 74 percent (48.8 kg/ha versus 12.6 kg/ha), 56 percent (13.7 kg/ha versus 6.0 kg/ha), and 92 percent (1.58 kg/ha versus 0.13 kg/ha), respectively. Figure 3-9. Mean 3-year Seasonal Deposition Estimates for Major Ions, 1999–2001
and 2009–2011
0
10
20
30
40
50
60
70
80
90
1999-2001 2009-2011
kg/h
a
Sulfate
Nitrate
Ammonium
Hydrogen
0.00
0.20
0.40
0.60
0.80
1.00
1.20
1.40
1.60
1.80
2.00
1999 2000 2001 2002 2003 2004 2005 2006 2007 2008 2009 2010 2011
kg/h
a
Hydrogen

Cloud Deposition Monitoring – Clingmans Dome, TN – Great Smoky Mountains National Park – Summary Report
14 AMEC Environment & Infrastructure, Inc.
Wet deposition data from 1995 through 2011 were obtained from the NADP/NTN site TN11 for comparison to cloud water deposition estimates for 2000 through 2007 and 2009 through 2011. Figures 3-10 and 3-11 show the seasonal SO2-
4 and NO- 3 deposition estimates, respectively, for
both cloud water and precipitation data. The cloud water deposition estimates are plotted against the left y-axis, and the wet deposition values are plotted against the right y-axis. Starting in 2004, cloud water and wet deposition follow a similar pattern with some exceptions. Figure 3-10. Cloud Water and Wet Sulfate Deposition Estimates (June through September,
1995–2011)
0
2
4
6
8
10
12
14
0
10
20
30
40
50
60
70
80
90
100
Wet D
eposition (kg/ha)
Clo
ud W
ater
Dep
ositi
on (k
g/ha
)
Cloud Water Sulfate
Wet Sulfate

Cloud Deposition Monitoring – Clingmans Dome, TN – Great Smoky Mountains National Park – Summary Report
15 AMEC Environment & Infrastructure, Inc.
Figure 3-11. Cloud Water and Wet Nitrate Deposition Estimates (June through September, 1995–2011)
3.5 Total Deposition The total deposition components (dry, wet, and cloud) for sulfur (S) and nitrogen (N) are presented in Figures 3-12 and 3-13 for 2000 through 2011. The dry deposition component was estimated from the filter pack concentrations obtained from the GRS420 CASTNET site. For detailed information on the derivation of these components please refer to previous MADPRO reports (http://java.epa.gov/castnet/documents.do) and the CASTNET QAPP (AMEC, 2011). The figures show that both sulfur and nitrogen total deposition fluxes have decreased since 2000 with the biggest reductions in cloud deposition.
Cloud water sulfur deposition decreased by 79 percent since 2000 while dry and wet sulfur depositions decreased by 70 and 33 percent, respectively. Cloud water sulfur deposition accounted for approximately 71 to 89 percent of the total sulfur deposition to CLD303 from 2000 through 2011.
Cloud water nitrogen deposition decreased by 63 percent since 2000, and dry nitrogen deposition decreased by 48 percent. However, wet nitrogen deposition has not shown a discernible change since 2000. Cloud water nitrogen deposition contributed approximately 69 to 90 percent to the total nitrogen deposition from 2000 through 2011.
0
1
2
3
4
5
6
7
8
0
10
20
30
40
50
60
70
Wet D
eposition (kg/ha)
Clo
ud W
ater
Dep
ositi
on (k
g/ha
)
Cloud Water Nitrate
Wet Nitrate

Cloud Deposition Monitoring – Clingmans Dome, TN – Great Smoky Mountains National Park – Summary Report
16 AMEC Environment & Infrastructure, Inc.
Figure 3-12. Seasonal Sulfur Deposition (2000–2011)
Figure 3-13. Seasonal Nitrogen Deposition (2000–2011)
0.0
5.0
10.0
15.0
20.0
25.0
30.0
2000 2001 2002 2003 2004 2005 2006 2007 2008 2009 2010 2011
Nitr
ogen
Dep
ositi
on (k
g/ha
)
Dry Nitrogen
Wet Nitrogen
Cloud Nitrogen
0.0
5.0
10.0
15.0
20.0
25.0
30.0
35.0
2000 2001 2002 2003 2004 2005 2006 2007 2008 2009 2010 2011
Sulf
ur D
epos
ition
(kg/
ha)
Dry Sulfur
Wet Sulfur
Cloud Sulfur

Cloud Deposition Monitoring – Clingmans Dome, TN – Great Smoky Mountains National Park – Summary Report
17 AMEC Environment & Infrastructure, Inc.
4.0 Conclusions 4.1 Cloud Water Concentrations and Deposition Estimates
The steady decline in dry sulfur and nitrogen species concentrations measured by filter pack sampling at the lower elevation CASTNET sites and in estimates of total (dry + wet) deposition in the eastern United States have also been measured in cloud water sample concentrations and depositions from CLD303 over the 10-year period from 2000 through 2009.
Similarly, emissions from TVA-operated power plants (Figures 4-1 and 4-2) also declined from 2000 through 2009. Emissions increased in 2010, and although emissions decreased in 2011, they were higher than 2009 levels (TVA, 2012). Seasonal cloud water concentrations measured in 2007 and 2009 mirrored these emission reductions, as well as the increase in 2010. However, seasonal cloud water concentrations of both sulfate and nitrate increased again in 2011 when emissions decreased. One possible reason for cloud water concentrations not always tracking emissions trends may be the influence of cloud LWC and weather conditions, which can vary substantially from one collection season to another (Figure 3-2) and affect the concentration of pollutants within a cloud. Figure 4-1. Seasonal Cloud Water SO2-
4 Concentrations and Depositions and TVA Annual Sulfur Dioxide (SO
2) Emissions (2000–2011)
0.0
10.0
20.0
30.0
40.0
50.0
60.0
70.0
80.0
90.0
100.0
0
100
200
300
400
500
600
700
800
2000 2001 2002 2003 2004 2005 2006 2007 2008 2009 2010 2011
Sulf
ate
Dep
ositi
on (k
g/ha
)
SO2
Emis
sion
s (10
00 to
ns p
er y
ear)
, Su
lfat
e C
once
ntra
tion
(µeq
/L)
Sulfate Ion Concentration
Sulfur Dioxide Emissions
Sulfate Ion Deposition

Cloud Deposition Monitoring – Clingmans Dome, TN – Great Smoky Mountains National Park – Summary Report
18 AMEC Environment & Infrastructure, Inc.
Figure 4-2. Seasonal Cloud Water NO- 3 Concentrations and Depositions and TVA Annual
Oxides of Nitrogen (NOx) Emissions (2000–2011)
Power plant emissions have been reduced significantly in nearby states, as shown in Table 4-1 (EPA, in press), and, depending on weather patterns, have also had an impact on cloud water concentrations at CLD303. Table 4-1. Power Plant Emission Reductions (percent) from 2000 through 2011 for Tennessee
and Nearby States
SO 2 NOx
Kentucky 58 63 Virginia 69 64 Tennessee 72 83 North Carolina 84 74 South Carolina 67 73 Georgia 64 70 Alabama 65 66 Source: EPA (in press) In general, cloud water sulfur and nitrogen depositions correspond closely with TVA emissions, as well as emissions from power plants from neighboring states. Cloud water depositions are also affected by cloud LWC and its frequency, local wind speeds, and other meteorological conditions. Deposition rates can, therefore, exhibit an opposite trend relative to concentrations and emissions. Since cloud water is the major contributor to total deposition at high elevation sites such as CLD303, and because cloud water deposition can be significantly influenced by cloud LWC, complex terrain, local wind speeds etc., the sensitive high-elevation ecosystems of
0.0
10.0
20.0
30.0
40.0
50.0
60.0
70.0
80.0
0
50
100
150
200
250
300
350
2000 2001 2002 2003 2004 2005 2006 2007 2008 2009 2010 2011
Nitr
ate
Dep
ositi
on (k
g/ha
)
NO
xEm
issi
ons (
1000
tons
per
yea
r),
Nitr
ate
Con
cent
ratio
n (µ
eq/L
)
Nitrate Ion Concentration
Oxides of Nitrogen EmissionsNitrate Ion Deposition

Cloud Deposition Monitoring – Clingmans Dome, TN – Great Smoky Mountains National Park – Summary Report
19 AMEC Environment & Infrastructure, Inc.
the Great Smoky Mountains and other similar locations can continue to experience damage from acidification because of poorly buffered soils and other ecological factors well after sulfur and nitrogen emissions decrease.
The cloud water concentration and deposition data compiled from this study show that both concentrations and depositions have declined since 2000. The decline in concentrations is more variable from year to year than the decline in depositions. Deposition estimates correspond relatively well with emission reductions at TVA power plants and from power plants in neighboring states. The data show that high-elevation ecosystems are subject to different stresses than lower elevation areas as shown by the much greater deposition of sulfur and nitrogen species from cloud water at CLD303 compared to the lower elevation CASTNET sites. Lower elevation sites experience deposition only in the forms of dry and wet deposition.
4.2 Future Studies
The MADPRO project was instrumental in demonstrating that sensitive high-elevation ecosystems can continue to experience damage from acidification well after emission reductions have occurred. Since all the complex factors that determine deposition rates to these types of ecosystems are not completely understood, it is recommended that similar studies be initiated in the near future. One of the biggest obstacles to conducting this type of research is that study sites are often remote, difficult to access, and have no ready source of power. The CLD303 site was battery operated using solar panels with access to a generator when needed. However, generator power had to be manually initiated and, as a result, was not always available. The cloud collection system would shut down if the site experienced a several day duration cloud event and manpower was not available to turn on the generator.
Recommendations for future projects include having a reliable source of power for operations as well as dedicated, physically capable, technically competent, and readily available site operators for troubleshooting, maintenance, and laboratory activities. Being a site operator for a cloud collection site is a very demanding job, and without the appropriate personnel, collection of meaningful data can be compromised. Due to the logistics and instrumentation involved in cloud water sampling, this type of research is more complicated and, therefore, more expensive with respect to filter pack or precipitation sampling. Sponsorship with ample funding is highly recommended for successful operation of cloud water sampling efforts.

Cloud Deposition Monitoring – Clingmans Dome, TN – Great Smoky Mountains National Park – Summary Report
20 AMEC Environment & Infrastructure, Inc.
Cloud Deposition Monitoring – Clingmans Dome, TN – Great Smoky Mountains National Park – Summary Report
21 AMEC Environment & Infrastructure, Inc.
5.0 References AMEC Environment & Infrastructure, Inc. (AMEC). 2012. Cloud Deposition Monitoring,
Clingmans Dome, TN, Great Smoky Mountains National Park –2011. Prepared for the U.S. Environmental Protection Agency (EPA), Office of Air and Radiation, Clean Air Markets Division, Washington, DC. Contract No. EP-W-09-028. Gainesville, FL.
AMEC Environment & Infrastructure, Inc. (AMEC)*. 2011. Clean Air Status and Trends
Network (CASTNET) Quality Assurance Project Plan Revision 7.0. Prepared for the U.S. Environmental Protection Agency (EPA), Office of Air and Radiation, Clean Air Markets Division, Washington, DC. Contract No. EP-W-09-028. Gainesville, FL.
Anlauf, K.G., Wiebe, H.A., and Fellin, P. 1986. Characterization of Several Integrative Sampling
Methods for Nitric Acid, Sulfur Dioxide, and Atmospheric Particles. JAPCA, 36:715-723.
Baumgardner, R.E., Kronmiller, K.G., Anderson, J.B., Bowser, J.J., and Edgerton, E.S. 1997.
Development of an Automated Cloud Water Collection System for Use in Atmospheric Monitoring Networks. Atmospheric Environment, 31(13):2003-2010.
Gerber, H. 1984. Liquid Water Content of Fogs and Hazes from Visible Light Scattering.
Journal of Climatology and Applied Meteorology, 23:1247-1252. Lavery, T.F., Rogers, C.M., Baumgardner, R., and Mishoe, K.P. 2007. Intercomparison of
CASTNET NO- 3 and HNO
3 Measurements with Data from Other Monitoring Programs. Journal of Air & Waste Management Association (JAWMA).
Lovett, G.M. 1984. Rates and Mechanisms of Cloud Water Deposition to a Subalpine Balsam Fir
Forest. Atmospheric Environment. 18:361-371. Tennessee Valley Authority (TVA). 2012. Air Quality.
http://www.tva.com/environment/air/index.htm. Accessed October 2012. U.S. Environmental Protection Agency (EPA). In press. Clean Air Interstate Rule, Acid Rain
Program, and Former NOx Budget Trading Program 2011 Progress Report. http://www.epa.gov/airmarkets/progress/progress-reports.html.
U.S. Environmental Protection Agency (EPA). 2000. Mountain Acid Deposition Program
(MADPro): Cloud Deposition to the Appalachian Mountains, 1994–1999. EPA/600/R-01/016.
* Formerly known as MACTEC Engineering and Consulting, Inc.