cloud adoption and risk report...2016 2017 2018 4.4 5.6 5.64 6 cloud adoption and risk report report...
TRANSCRIPT

REPORT
Cloud Adoption and Risk Report2019

REPORT
2 Cloud Adoption and Risk Report
Through analysis of billions of anonymized cloud events across a broad set of enterprise organizations*, we can determine the current state of how the cloud is truly being used, and where our risk lies. Consider that nearly a quarter of data in the cloud is sensitive, and that sharing of sensitive data in the cloud has increased 53% year-over-year. If we don’t appropriately control access and protect our data from threats, we put our enterprises at risk.
IaaS/PaaS providers like AWS are increasing the productivity of our developers and making our organizations extraordinarily agile. However organizations on average have at least 14 misconfigured IaaS instances running at any given time, resulting in an
average of 2,269 misconfiguration incidents per month. Prominently, 5.5% of all AWS S3 buckets in use are misconfigured to be publicly readable. We can see the risk of immediate and grand-scale loss of data starting to grow with these trends. We need to get the basics right, or face losing the opportunity for business acceleration before the gas pedal can hit the floor.
The majority of threats to data in the cloud result from compromised accounts and insider threats. 80% of organizations are going to experience at least 1 comprised account threat in the cloud this month. 92% currently have stolen cloud credentials for sale on the Dark Web.
Cloud Adoption and Risk Report
Executive Summary Cloud services bring a momentous opportunity to accelerate business through their ability to quickly scale, allow us to be agile with our resources, and provide new opportunities for collaboration. As we all take advantage of the cloud, there’s one thing we can’t forget—our data. When using software-as-a-service (SaaS) we are responsible for the security of our data, and need to ensure it is accessed appropriately. When using infrastructure-as-a-service (IaaS) or platform-as-a-service (PaaS), we are additionally responsible for the security of our workloads, and need to ensure the underlying application and infrastructure components are not misconfigured.
Connect With Us
2019
*Many of the data points we cite in this report are determined by enterprise policy. For example, classifications of “sensitive data” are set by the organizations in our study, not McAfee. Our visibility is limited to the results of that policy, not the actual data.
3 Cloud Adoption and Risk Report
REPORT
Fortunately, the cloud is still bringing more opportunities than threats. Cloud use is extremely broad, with most organizations using approximately 1,935 cloud services, up 15% year-over-year. Unfortunately, most think they only use 30.
Key Findings ■ 21% of all files in the cloud contain sensitive data, up
17% over the past two years. ■ The amount of files with sensitive data shared in the
cloud has increased 53% YoY. ■ Sharing sensitive data with an open, publicly accessible
link has increased by 23% over the past two years. ■ 94% of IaaS/PaaS use is in AWS, but 78% of
organizations using IaaS/PaaS use both AWS and Azure.
■ Enterprise organizations have an average of 14 misconfigured IaaS/PaaS instances running at one time, resulting in an average of 2,269 individual misconfiguration incidents per month.
■ 5.5% of AWS S3 buckets have world read permissions, making them open to the public.
■ The average organization generates over 3.2 billion events per month in the cloud, of which 3,217 are anomalous, and 31.3 are actual threat events.
■ Threat events in the cloud, i.e. compromised account, privileged user, or insider threat have increased 27.7% YoY.
■ 80% of all organizations experience at least 1 compromised account threat per month.
■ 92% of all organizations have stolen cloud credentials for sale on the Dark Web.
■ Threats in Office 365 have grown by 63% in the last two years.
■ The average organization uses 1,935 unique cloud services, an increase of 15% from last year. Most organizations think they use about 30.

REPORT
4 Cloud Adoption and Risk Report
Table of Contents
5 Breaking Down Sources of Cloud Data Risk
7 When Sharing Isn’t Caring—Cloud Collaboration as a Blessing and a Curse
8 You Can Bet Your IaaS is Misconfigured —So Don’t Forget the Basics
10 Internal and External Threats11 Compromised accounts11 Insider threats11 Privileged user threats12 Cloud threat funnel12 Cloud Usage Trends13 Average number of services14 Native security controls vary by provider15 The top cloud services15 Top 10 enterprise cloud services16 Top 10 collaboration and file sharing
services
16 Top 10 consumer cloud services17 Top 10 social media services17 Perception vs Reality—Total Cloud
Services18 Perception vs Reality—“Over Trusting”
Cloud Services to Keep Data Secure

5 Cloud Adoption and Risk Report
REPORT
Breaking Down Sources of Cloud Data RiskThe use of cloud services is ubiquitous—we’ve seen this rise over the past decade to the point where many of our organizations couldn’t function today without the cloud. Critical to this growth is the understanding that data, and most importantly sensitive data, now lives in the cloud and must be protected. In our last survey on cloud adoption in mid-2018, we found that 83% of organizations worldwide store sensitive data in the cloud.1 Even as the absolute number of files stored in the cloud has increased rapidly, the percentage of files that contain sensitive data has also grown, today standing at 21% with an increase of 17% over the past two years.
So not only do most organizations place trust in their public cloud service providers to store their sensitive data, nearly a quarter of all data in the cloud meets the need for stringent protection.
Let’s get specific and look at the categories classified as sensitive data here:
Figure 1. Types of sensitive data in the cloud.
Not surprisingly, the classification of “confidential data” takes the largest share of all sensitive data in the cloud at 27%. More interesting is the increase in trust—the total amount of confidential data stored in the cloud rose 28% over the past two years. During that time, we’ve seen services like Box and Microsoft Office 365 rise in popularity, concurrently carrying with them the shift of corporate data to the cloud.
Figure 2. Confidential data in the cloud—percentage of total data in the cloud.
of all files in the cloud contain sensitive data.21%
27% Confidential
20% Email
17%Password protected
16% Pll
12%Payment 9% PHI
Perc
enta
ge o
f tot
al d
ata
in th
e cl
oud
3.00%
3.50%
4.00%
4.50%
5.00%
5.50%
6.00%
2016 2017 2018
4.4%
5.6% 5.64%

6 Cloud Adoption and Risk Report
REPORT
Specifically, with the rise in popularity of Office 365, we see an even larger increase in sensitive data flowing through cloud-based email, primarily Exchange Online. Today, 20% of all sensitive data in the cloud runs through email services like Exchange Online in Office 365, a volume which has increased 59% in the past two years. Email remains one of the easiest vectors for data loss, and moving it to the cloud removes visibility for IT teams that could once monitor SMTP traffic on their own servers. We’ll see a few more trends related to data flowing through email in the next section—but for now the growth and inherent loss of visibility remain significant on their own.
Figure 3. Sensitive data in cloud-based email—percentage of total data in the cloud.
Let’s look at the rest of the sensitive data types we evaluated for additional insight:
Figure 4. Sensitive data types in the cloud—percentage of total data in the cloud.
The first insight we can take from the remaining data types is a sharp decline of -20% YoY in Personally Identifiable Information (PII) in the cloud, which could be a result of several trends. For one, the proportion of cloud use in corporate environments is increasingly for business, as opposed to personal use. Many cloud services, such as Dropbox, came into the enterprise as consumer services and quickly transitioned to business use cases as their utility became apparent. Another cause could be end-user diligence, keeping PII out of the cloud as a result of security awareness. We may need to give our end-users the benefit of the doubt on this one.
Next, we see gradual increases in personal healthcare information (PHI) and password protected data, at
Perc
enta
ge o
f tot
al d
ata
in th
e cl
oud
2.00%
2.50%
3.00%
3.50%
4.00%
4.50%
5.00%
2016 2017 2018
2.7%
4.1% 4.3%
Perc
enta
ge o
f tot
al d
ata
in th
e cl
oud
1.00%
2.00%
3.00%
3.50%
5.50%
6.00%
1.50%
2.50%
4.00%
4.50%
5.00%
Confidential Email Passowordprotected
Pll Payment PHI
2016 2017 2018

7 Cloud Adoption and Risk Report
REPORT
16% and 13% respectively over the past two years. While healthcare information accounts for only 9% of all sensitive data in the cloud, it is encouraging to see trust increase for this highly regulated industry. Lastly, payment data remains stable at approximately 12% of all sensitive data in the cloud on an annual basis.
What we take away from this breakdown is the increase in trust to store broad categories of sensitive information in the cloud. As the proportion of our data shifts from servers we own to services we use, so does the potential risk. It’s critical that we understand what goes into the cloud, so we can protect it with that growing proportion of risk in mind.
When Sharing isn’t Caring—Cloud Collaboration as a Blessing and a CurseOur data lives in the cloud, and as we learned, nearly a quarter of it requires protection to limit our risk. However, the risk of exposure is counter to one of the key tenets of many cloud services—collaboration. Cloud storage services like Box, or productivity suites like Office 365 are used to increase the fluidity of collaboration. But of course, collaboration means sharing, and that sharing can lead to the loss of our sensitive data.
Looking at global cloud use today, we see that 22% of cloud users actively share files in the cloud and 48% of all files in the cloud are eventually shared. Both are on the rise. The number of active sharing cloud users is up 33% over the past two years, and total files shared is also up 12% over the same period.
Figure 5. Percentage of cloud users who share files.
Figure 6. Percentage of files shared in the cloud.
16%
17%
18%
21%
19%
20%
2016
23%
22%
2017 2018
16.76%
18.45%
22.3%
40%
41%
42%
46%
43%
45%
2016
48%
47%
2017 2018
44%
49%
43.1%
46.6%
48.3%

8 Cloud Adoption and Risk Report
REPORT
If the 48% of files being shared were limited to party invites and pet photos we’d have a much easier time managing our cloud risk. There are two areas that we need to draw our attention to here: what kind of data is being shared, and where it’s going. Let’s start with where:
Figure 7. Where cloud files are shared.
Two categories immediately raise red flags: personal email addresses, and anyone with a link. Anyone using a corporate cloud account and sending data to a personal email address is invariably removing that data from any oversight by the information security team. Even worse however is data shared to anyone with an open link, potentially leading to uncontrollable sprawl of data to completely unknown individuals and organizations. Once a file in a service like Box or OneDrive is set to open access by “anyone with a link”, that is essentially like running a web hosting service for the world, letting anyone hit that link and have the data.
Now of course the heart of the risk lies in the content of what’s being shared, and where it’s going. Currently 8% of all files shared in the cloud contain sensitive data. Over the past two years, files shared with sensitive data to “anyone with a link” have risen 23%, files sent to a personal email address are up 12%, and those shared with business partners up 10%. It’s imperative to understand and control how sensitive data is being shared to reduce risk while maintaining business acceleration through the use of the cloud.
You Can Bet Your IaaS is Misconfigured—So Don’t Forget the BasicsData doesn’t just live in SaaS applications like Salesforce or Office 365. Amazon Web Services (AWS) has been not-so-quietly driving the transformation of server and data center infrastructure to cloud-based services, classified as Infrastructure-as-a-Service (IaaS) and Platform-as-a-Service (PaaS – think serverless computing like AWS Lambda). Today, 65% of organizations around the world use some form of IaaS, 52% for PaaS.1
The draw is undeniable. Servers are expensive to buy and maintain, not to mention slow to roll out. IaaS and PaaS erase those problems, giving IT teams the option to spin up VMs, containers, or functions-as-a-service at will. The ability to rapidly scale and the boost in agility are far too compelling to ignore.
Naturally, this isn’t just the AWS show. Microsoft has Azure, and Google their Cloud Platform (GCP), among others. The market dynamic is interesting here on two fronts, one of which especially has implications for IT strategy. First, when we look at IaaS/PaaS usage
62% Business partners
14% Personal
emailaddresses
12% Other
12% Anyone with a link
94% AWS
4% Azure 1% GCP
Figure 8. Usage share for IaaS.

9 Cloud Adoption and Risk Report
REPORT
worldwide, AWS absolutely leads the pack with 94% of all access events, leaving 3.7% for Azure and 1.3% for GCP. However, 78% of organizations are currently using both AWS and Azure together, typically as an official multicloud strategy. So, AWS is used the most, but in the vast majority of organizations, employees have Azure accounts too. The implication here comes down to visibility and management. When our infrastructure runs in two or more providers, much like using multiple SaaS apps, do we have consistent security across them?
Figure 9. Multicloud vs single cloud.
In our research we found that on average, enterprises using IaaS/PaaS have 14 misconfigured services running at any given time, resulting in an average of 2,269 misconfiguration incidents per month. Here are the top 10 AWS misconfigurations we see:
1. EBS data encryption is not turned on.
2. There’s unrestricted outbound access.
3. Access to resources is not provisioned using IAM roles.
4. EC2 security group port is misconfigured.
5. EC2 security group inbound access is misconfigured.
6. Unencrypted AMI discovered.
7. Unused security groups discovered.
8. VPC Flow logs are disabled.
9. Multi-factor authentication is not enabled for IAM users.
10. S3 bucket encryption is not turned on.
Misconfiguration “sounds” bad on its own, but why should we really care? Again, it comes down to the data. When organizations we work with turn on Data Loss Prevention (DLP), they see an average of 1,527 DLP incidents in their IaaS/PaaS storage per month. That means they detected sensitive data that either shouldn’t be there, or that requires additional monitoring and security controls. All told, 27% of organizations using/PaaS have experienced data theft from their cloud infrastructure.1
There are a few more common misconfigurations we see that didn’t make the list but have serious implications for data loss and risk to our IaaS/PaaS environments. First, looking at our view of the AWS universe, we can see that 5.5% of all S3 storage buckets have “world read” permissions, meaning they are open to the public. Despite the news over the past few years with so many public incidents of data exposure in open S3 buckets, this common but serious misconfiguration remains stubbornly unmoving.
of S3 storage buckets have “world read” permissions.
5.5%
78%AWS + Azure
22%AWS
Alone

10 Cloud Adoption and Risk Report
REPORT
Lastly, we have a peculiar incident trend that is relatively rare, but its implications make it worth covering. On average, we see that enterprise organizations have at least 1 AWS S3 bucket set with “open write” permissions, giving anyone in the world access to inject their own data into our environments. Not only that, but most organizations access 25 of these “open write” buckets from their corporate network, most often through a third party (take the case of someone reading a news site where the content being streamed comes from an S3 bucket mistakenly misconfigured to be “open write”). Open write is like a free-for-all to anyone trying compromise our organizations. Want to modify our S3 records? Have at it. Want to inject malicious code? Even better. This one is an open book (literally), and needs to be checked and shut down both for the S3 buckets we own and the ones from 3rd and 4th parties.
Internal and External ThreatsSecurity incidents are no longer isolated to PCs and applications on the network, owed primarily to the scale of corporate data stored in the cloud today as well as the sheer number of events taking place in the cloud. The average enterprise organization experiences 31.3 cloud-related security threats each month, a 27.7% increase over same period last year. Broken down by category, these include insider threats (both accidental and malicious), privileged user threats, and threats arising from potentially compromised accounts.
Figure 10. Cloud threats per month per organization.
We continue to see steady growth in cloud services in terms of how many new services are being sanctioned by IT departments, the number of users being provisioned to these services, and the amount of data they hold. Given the overall trend towards migrating on-premises IT resources to the cloud, a rise in security threats shouldn’t be surprising.
2016 2017 2018
20.4
24.5
31.3

Figure 11. Cloud threats by category.
Compromised accountsOn average, organizations experience 12.2 incidents each month in which an unauthorized third-party exploits stolen account credentials to gain access to corporate data stored in a cloud service. These incidents affect 80.3% of organizations at least once a month. Additionally, 92% of companies have cloud credentials for sale on the Dark Web. This sounds like a losing battle, but many business-critical cloud services support multifactor authentication which can help reduce risk from compromised accounts.
Insider threatsOrganizations experience an average of 14.8 insider threat incidents each month, and 94.3% of organizations experience at least one per month on average. Insider threats include behaviors that unintentionally expose an organization to risk, such as mistakenly sharing a spreadsheet with employee Social Security numbers externally. They also include malicious activity, such as a salesperson downloading their full contact list before leaving to join a competitor.
Privileged user threats Privileged user threats occur monthly at 58.2% of organizations, with organizations experiencing an average of 4.3 each month. These threats can take different forms, ranging from an administrator accessing data in an executive’s account to modifying security settings in a way that unintentionally weakens security. While not as common as insider threats associated with regular users, the high level of application permissions for privileged users can make these threats especially damaging.
11 Cloud Adoption and Risk Report
REPORT
Average # of compromisedaccount threats in cloud permonth per organization
Average # of privileged userthreats in cloud per monthper organization
Average # of insider threatsin cloud per month perorganization
2017
12.3
3.6
8.6
2016
10.9
3.3
6.2
2018
14.8
4.3
12.2

12 Cloud Adoption and Risk Report
REPORT
Cloud Threat FunnelAs the number of cloud services and cloud users has grown, so has the amount of cloud activity. The average organization today generates more than 3.2 billion unique transactions in cloud services each month (such as user login, upload file, edit document, and so forth). With this volume of data, it would be impossible to manually search through an audit trail of user activity to identify potential threats. In response, organizations are investing in user and entity behavior analytics (UEBA) tools, which use machine learning to identify anomalous events against the background noise of everyday activity.
Figure 12. Funnel of events leading to cloud threats.
More than 30 cloud threats month after month is significant. Any one true positive threat can compromise
our organizations and brands. The data above demonstrates the two sides of behavior analytics 1. Effective behavior analytics allowed us to detect (and respond to) those 30 threats, and, 2. Effective behavior analytics delivered a 100M signal to noise return ratio, whittling 3.2B events down to 31 threats. Without this level of automation, the sheer volume of false positives would have inundated our capability to respond.
Cloud Usage TrendsWe see more cloud services launch every week. Not surprisingly, the number of different cloud services in use has grown in lockstep with the increasing number of cloud services in the market.
Figure 13. Cloud usage over time—average number of cloud service in use per organization by type.
3,263,144,325Total events per month
3,217Anomalousevents per
month
31.3Threats
per month
2013
457
169
626
638
259
2014
897
854
333
2015
1187
1018
409
2016
1427
1169
513
2017
1682
1353
582
2018
1935
Consumer cloud apps
Enterprise cloud apps
13 Cloud Adoption and Risk Report
REPORT
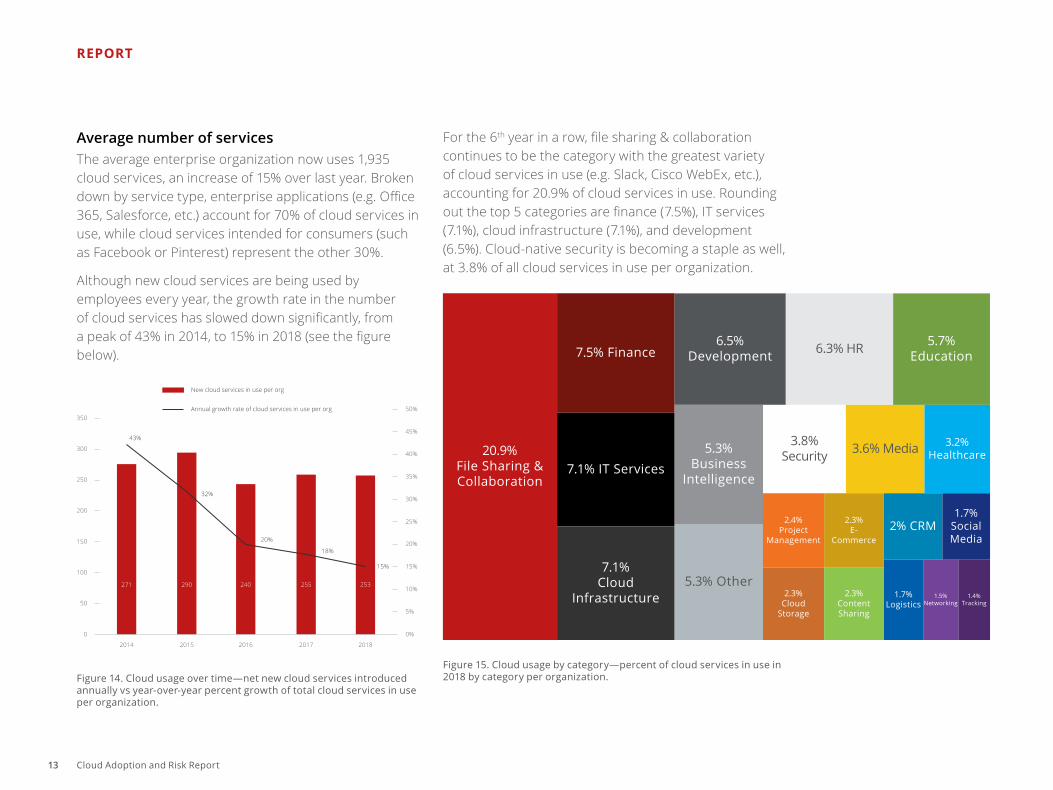
Average number of servicesThe average enterprise organization now uses 1,935 cloud services, an increase of 15% over last year. Broken down by service type, enterprise applications (e.g. Office 365, Salesforce, etc.) account for 70% of cloud services in use, while cloud services intended for consumers (such as Facebook or Pinterest) represent the other 30%.
Although new cloud services are being used by employees every year, the growth rate in the number of cloud services has slowed down significantly, from a peak of 43% in 2014, to 15% in 2018 (see the figure below).
Figure 14. Cloud usage over time—net new cloud services introduced annually vs year-over-year percent growth of total cloud services in use per organization.
For the 6th year in a row, file sharing & collaboration continues to be the category with the greatest variety of cloud services in use (e.g. Slack, Cisco WebEx, etc.), accounting for 20.9% of cloud services in use. Rounding out the top 5 categories are finance (7.5%), IT services (7.1%), cloud infrastructure (7.1%), and development (6.5%). Cloud-native security is becoming a staple as well, at 3.8% of all cloud services in use per organization.
Figure 15. Cloud usage by category—percent of cloud services in use in 2018 by category per organization.
5%
0%
10%
15%
20%
25%
30%
35%
40%
45%
50%
50
0
100
150
200
250
300
350
2014 2015 2016 2017 2018
43%
32%
20%
18%
15%
271 290 240 255 253
New cloud services in use per org
Annual growth rate of cloud services in use per org
7.5% Finance
20.9%File Sharing &Collaboration
7.1% IT Services
7.1%Cloud
Infrastructure
6.5%Development
5.3%Business
Intelligence
5.3% Other
6.3% HR
3.8%Security
2.4%Project
Management
2.3%Cloud
Storage
3.6% Media
2.3%E-
Commerce
2.3%ContentSharing
5.7%Education
3.2%Healthcare
2% CRM1.7%
SocialMedia
1.7%Logistics
1.5%Networking
1.4%Tracking

14 Cloud Adoption and Risk Report
REPORT
Native security controls vary by providerNo two cloud service providers offer the same set of security controls. Across over 25,000 cloud services in use today, only 8% meet the strict data security and privacy requirements of enterprises as defined by the CloudTrust Program. Digging deeper, we find that fewer than 1 in 10 providers encrypt data stored at rest, and even fewer support the ability for a customer to encrypt data using their own encryption keys. Due in part to the implementation of the EU General Data Protection Regulation (GDPR), encryption using customer-managed keys is rapidly becoming a requirement for organizations who store EU resident data in the cloud that crosses national borders.
Next, given the prevalence of data breaches caused by stolen credentials, it is alarming to find that only 19.2% of cloud services support multi-factor authentication.
Figure 16. Security controls on stored data vary by provider.
What happens to data once uploaded to a cloud provider? This continues to be one of the biggest concerns we hear from our customers. Fewer than half of providers specify that customer data is owned by the customer (the rest either claim ownership over all data uploaded, or don’t legally specify who owns the data). An even smaller number of cloud providers delete data immediately on account termination, with the remainder keeping data up to one year, some even claiming the right to maintain copies of data indefinitely.
Due to the general lack of critical security controls across cloud services, employees will inevitably (and inadvertently) select risky cloud services to use. While the vast majority of cloud service users are simply looking to become more efficient and productive, they can nonetheless put enterprise data at risk. Of the 1,935 cloud services in use at the average organization, 173 of them rank as high risk services (8.9%).
Figure 17. Cloud application usage by risk level.
Encrypt data at rest
8.1%
Encrypt data withcustomer-managed keys
0.7%
Delete data immediately onaccount termination
13.3%
Specify that customerowns all data uploaded
37.3%
Support multifactorauthentication
18.1% 173High risk apps
295Medium risk apps
1467Low risk apps

15 Cloud Adoption and Risk Report
REPORT
The top cloud servicesEven at enterprise organizations there is a significant proportion of consumer services in use. While some consumer cloud services pivot over time to be classified as enterprise services, the vast majority are social media, and generally less-secure for our data. Below, we break down the top services in both categories.
Figure 18. Type of cloud services used by the average company.
Top 10 enterprise cloud servicesToday, 70% of all cloud services we see in use are enterprise services, accounting for 71.8% of uploaded data. Office 365 is the top enterprise cloud service by user count, followed by Salesforce and Cisco WebEx. From a security standpoint, the top 10 enterprise cloud services are significantly more likely to have enterprise-class security controls than the average consumer cloud service.
70%Enterprise
30%Consumer
1
2
3
4
5
OneDrive
Exchange Online
Salesforce
SharePoint Online
ServiceNow
Box
Cisco Webex
Yammer
Workday
Slack
6
7
8
9
10
16 Cloud Adoption and Risk Report
REPORT
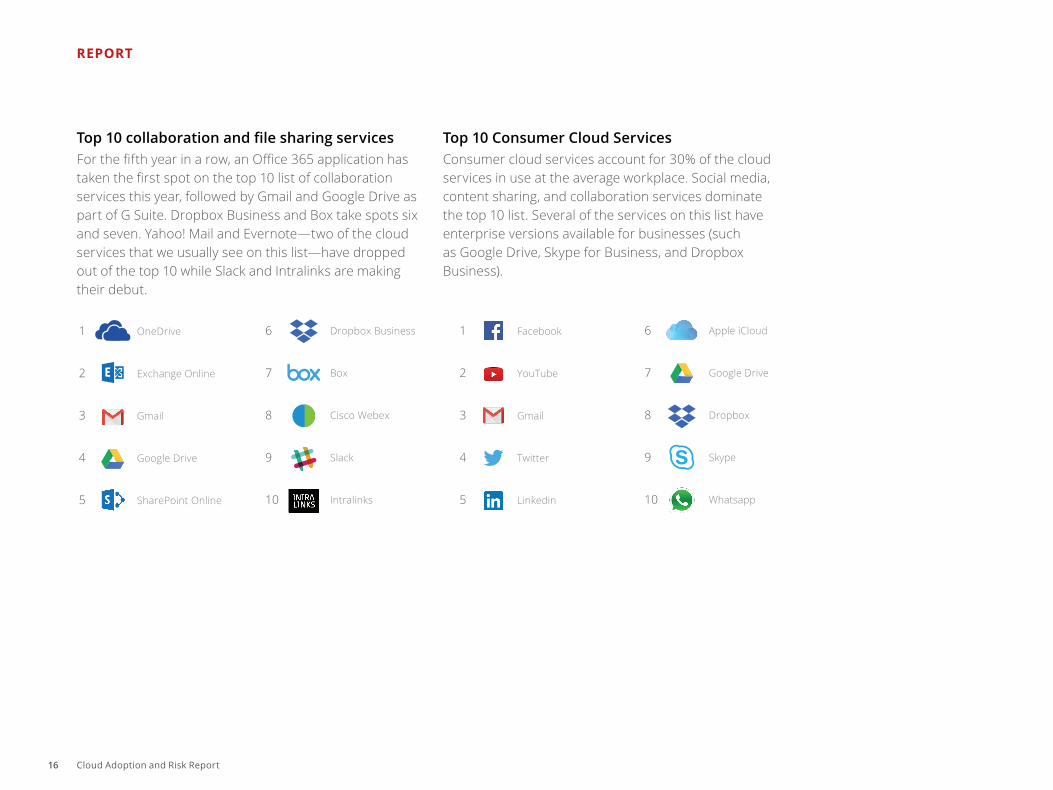
Top 10 collaboration and file sharing servicesFor the fifth year in a row, an Office 365 application has taken the first spot on the top 10 list of collaboration services this year, followed by Gmail and Google Drive as part of G Suite. Dropbox Business and Box take spots six and seven. Yahoo! Mail and Evernote—two of the cloud services that we usually see on this list—have dropped out of the top 10 while Slack and Intralinks are making their debut.
Top 10 Consumer Cloud ServicesConsumer cloud services account for 30% of the cloud services in use at the average workplace. Social media, content sharing, and collaboration services dominate the top 10 list. Several of the services on this list have enterprise versions available for businesses (such as Google Drive, Skype for Business, and Dropbox Business).
1
2
3
4
5
YouTube
Gmail
Apple iCloud
Google Drive
Dropbox
Skype
6
7
8
9
10
1
2
3
4
5
OneDrive
Exchange Online
Gmail
Google Drive
SharePoint Online
Dropbox Business
Box
Cisco Webex
Slack
Intralinks
6
7
8
9
10

17 Cloud Adoption and Risk Report
REPORT
Top 10 social media servicesDespite the recent headwinds blowing against Facebook around data privacy and fake news proliferation, it remains the most common social media app in use at the average organization. In the meantime, Twitter and LinkedIn have further solidified their place as the second and third most commonly used social media applications respectively. And while Google+ has been slated for end-of-life, we still see prominent use at the time of this analysis.
Perception vs Reality—Total Cloud ServicesIn April 2018, we published the report “Navigating a Cloudy Sky: Practical Guidance and the State of Cloud Security” based on a survey of over 1,400 IT professionals across 11 countries, where each respondent was asked over 100 questions about their organization’s cloud use. If we compare the survey answers with the reality of our analysis here we see a number of glaring differences.
First, the respondents were asked to estimate the total number of cloud services they believe are in use in their organization. The average response was 31, with only 2% of respondents believing that they had more than 80—yet the real average is 1,935. The perception gap is shocking, meaning that 98% of cloud services are not known to IT—leading to obvious cloud risk.
Figure 19. Total cloud services—self-reported vs reality.
1
2
3
4
5
YouTube
ShareThis
VK
Twitter for Business
Sina Weibo
Google+
Tumblr
6
7
8
9
10 0
200
400
600
800
1000
2000
SurveyNorth America
SurveyLATAM
SurveyEurope
SurveyAPAC
SurveyJapan
Reality
1200
1400
1600
1800
1,935
37 31 25 3729
18 Cloud Adoption and Risk Report
REPORT
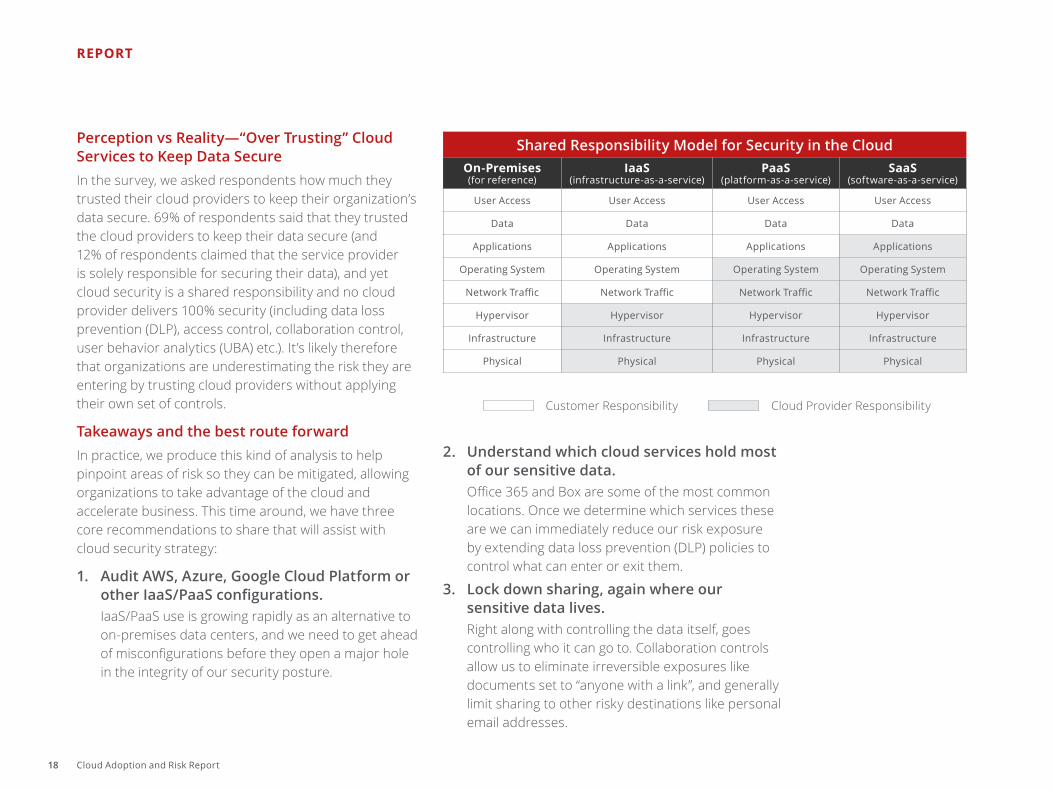
Perception vs Reality—“Over Trusting” Cloud Services to Keep Data SecureIn the survey, we asked respondents how much they trusted their cloud providers to keep their organization’s data secure. 69% of respondents said that they trusted the cloud providers to keep their data secure (and 12% of respondents claimed that the service provider is solely responsible for securing their data), and yet cloud security is a shared responsibility and no cloud provider delivers 100% security (including data loss prevention (DLP), access control, collaboration control, user behavior analytics (UBA) etc.). It’s likely therefore that organizations are underestimating the risk they are entering by trusting cloud providers without applying their own set of controls.
Takeaways and the best route forwardIn practice, we produce this kind of analysis to help pinpoint areas of risk so they can be mitigated, allowing organizations to take advantage of the cloud and accelerate business. This time around, we have three core recommendations to share that will assist with cloud security strategy:
1. Audit AWS, Azure, Google Cloud Platform or other IaaS/PaaS configurations.IaaS/PaaS use is growing rapidly as an alternative to on-premises data centers, and we need to get ahead of misconfigurations before they open a major hole in the integrity of our security posture.
2. Understand which cloud services hold most of our sensitive data.Office 365 and Box are some of the most common locations. Once we determine which services these are we can immediately reduce our risk exposure by extending data loss prevention (DLP) policies to control what can enter or exit them.
3. Lock down sharing, again where our sensitive data lives.Right along with controlling the data itself, goes controlling who it can go to. Collaboration controls allow us to eliminate irreversible exposures like documents set to “anyone with a link”, and generally limit sharing to other risky destinations like personal email addresses.
Shared Responsibility Model for Security in the CloudOn-Premises(for reference)
IaaS(infrastructure-as-a-service)
PaaS(platform-as-a-service)
SaaS(software-as-a-service)
User Access User Access User Access User Access
Data Data Data Data
Applications Applications Applications Applications
Operating System Operating System Operating System Operating System
Network Traffic Network Traffic Network Traffic Network Traffic
Hypervisor Hypervisor Hypervisor Hypervisor
Infrastructure Infrastructure Infrastructure Infrastructure
Physical Physical Physical Physical
Customer Responsibility Cloud Provider Responsibility

19 Cloud Adoption and Risk Report
REPORT
Start there. As cloud services continue to evolve, so will our strategy for risk mitigation. Cloud Access Security Broker (CASB) technology can execute each of the use cases above, tapping into cloud service APIs for deep levels of control. With cloud now an official extension of nearly every IT environment, it’s time to ensure security keeps up with its accelerating pace.
MethodologyTo bring you these findings, we analyzed aggregated, anonymized cloud usage data for over 30 million McAfee MVISION Cloud users worldwide at companies across all major industries including financial services, healthcare, public sector, education, retail, high tech, manufacturing, energy, utilities, legal, real estate, transportation, and business services. Collectively, these users generate billions of unique transactions and policy events in the cloud each day. We compiled their usage in an extensive cloud activity graph, revealing trends in usage against behavioral baselines across time. Our cloud service registry tracks over 50 attributes of enterprise readiness and allows us to analyze behavior using detailed data signatures for over 25,000 cloud services. Additional contextual data was sourced from our 2018 survey of 1,400 security professionals in 11 countries, all using public or private cloud services.
Get a Personalized Audit of Your Cloud Usage TodayWe can analyze your cloud usage with McAfee® MVISION Cloud and deliver a findings report summarizing:
■ Sensitive data stored in the cloud and who has access. ■ Collaboration and sharing with third parties. ■ Potential insider threats and compromised accounts. ■ Anomalous events indicating potential data
exfiltration. ■ Your IaaS configurations and their associated risk.
Request an Audit
http://bit.ly/CloudAudit5
1. McAfee, “Navigating a Cloudy Sky: Practical Guidance and the State of Cloud Security”
About McAfeeMcAfee is the device-to-cloud cybersecurity company. Inspired by the power of working together, McAfee creates business and consumer solutions that make our world a safer place. By building solutions that work with other companies’ products, McAfee helps businesses orchestrate cyber environments that are truly integrated, where protection, detection, and correction of threats happen simultaneously and collaboratively. By protecting consumers across all their devices, McAfee secures their digital lifestyle at home and away. By working with other security players, McAfee is leading the effort to unite against cybercriminals for the benefit of all.
www.mcafee.com.
McAfee and the McAfee logo are trademarks or registered trademarks of McAfee, LLC or its subsidiaries in the US and other countries Other marks and brands may be claimed as the property of others. Copyright © 2018 McAfee, LLC. 4168_1118NOVEMBER 2018
2821 Mission College Blvd.Santa Clara, CA 95054888.847.8766www.mcafee.com
20 Cloud Adoption and Risk Report