closing the question on the continuation of turn-of … the question on the continuation of...
TRANSCRIPT

������������ �����
����������� ���������������� �������� ����������������������������������������������� �! ����������
����������� ���������������������
�� �������� �������������������

��������������� ���������������������������������������������������������������������������������������������������������������� �����������������������������������������������������������������������������������!���� ������ ������������������������ ���������������
"�������������#������������������������� ���$����%��������&�"�����������������&�%���� ������������������&������������'��� ������!���� �&�(������������)�������&�"����������*+,,&�)���������&�-��.������&���%��������/������&�$���� ���&������������������������������&�0,*���������!����&�-�/�&��������&�1������2,2,234502&�*,*36403+45+&����������������7����������
����������������������������������������������������������&�������������������������&�������������������������������� �/���������������899�������������9�������9��:�����9�������� ����������������������������������������&���������������������������������� &���������������"�������������%���� ���&������������������������������&�0,*��������!����&�-�/�&��������&�1������2,2,234502&�*,*36403+,4,�
����������� ���������������� �������� �����������������������������������
������������ �! ����������
$����%�������������%���������/������
�����������������������������/������"����4,,,300
�������4,,,
"#������"�������������� �������������������������������������������������������� ��������������������� ����������������� ����������������������� ����� ����������� ���� ���3��3���3 �����;�<��=��������������������!������;0>>+=&������������� �������������������������������&����������������������������������������������������������������������#���������'�����������&������ ��������!?"�6,,�����������������������������������3��3���3 �������������������������������������������������������������������&�����������������������3���������������� �������������������������������������������������������������������� ������� �����������������������������������������/�������������<��������������!?"�6,,���������������������0>>,&���������������������������������!?"�6,,������ ������/�����@���������������������������������������������������������������� ���� � ��������������� ������������������������������������ �������������������������������������������������<������������� ��������������������'�����������&���������������3��3���3 ����� ����� �������� ��� ����� ����� ���� ������� ������ ��� ���� ��� ���� ������� ��� ���� ��������������������������@�������������������������������������������� ������������������������� ���������3��3�� ���������������� �����������3�� ��������������������
A$B���������������8�10*
C������8����������������3��3���3 �����������&�!?"�6,,�������&� ���������������

Closing the Question on the Continuation of Turn-of-the-Month Effects:Evidence from the S&P 500 Index Futures Contract
“Methods of this kind, which substitute mechanical plays for judgement, must fail. Forthe calculations on which they are based omit one fundamental fact, i.e., that the onlyunchangeable thing about the stock market is its tendency to change. The rigid methodsooner or later will break the operator who blindly follows it.”
Richard Wyckoff (1930)
I. Introduction
Financial economists have documented numerous anomalies over the past two
decades. For example, there are the January effect (small firm’s exhibit high returns in
January), the holiday effect (stock returns are high on pre-holidays), the Monday effect
(stock returns are low on Mondays), and the turn-of-the-month effect (stock returns are
high around the turn of the month). According to Siegel (1998, p. 254), why these
anomalies occur is not well understood, and whether they will continue to be significant
in the future is an open question.
Sullivan, Timmermann and White (1998) (STW) suggest that apparent stock
return anomalies do not necessarily imply a rejection of market efficiency, but instead
these anomalies could be just a result of a large, collective data-snooping exercise.
Shiller (2000) notes that many anomalies disappeared after they were discovered, as is
the case for the January effect, and therefore, their disappearance suggests that there is a
basic truth to efficient markets theory. The evidence supporting systematic abnormal
stock returns has largely been considered without accounting for the intensive search
preceding it. STW (1998) use a new bootstrap procedure that explicitly measures
distortions in statistical inference induced by data snooping, and find that the strength of
the evidence on calendar anomalies looks much weaker.

2
Transaction costs and short-sale constraints in the spot market could account for
the apparent historical success of some mechanical trading rules formulated from
observed calendar anomalies. STW (1999) note that the low transaction costs associated
with S&P 500 index futures and the absence of short-sale restrictions make index futures
an attractive venue for the execution and testing of mechanical trading strategies. An
underlying theme of the anomaly literature (Hensel and Ziemba (1996), Haugen and
Lakonishok (1988), and Clark and Ziemba (1987)) is that seasonal anomalies can be
exploited more readily in the index futures market.
As noted by Siegel (1998), the persistence of turn-of-the-month effects for stock
returns is an open question. Efficient markets theory predicts that this anomaly dissipates
over time, and in an attempt to “close” Siegel’s question, this study examines turn-of-the-
month return patterns for the S&P 500 futures contract over the period 1982/05 through
1999. Prior research documents significant turn-of-the-month effects for stock returns
(Ariel (1987), Lakonishok and Smidt (1988), and Ogden (1990)) over the period 1963
through 1986. In particular, unusually large returns are observed over four consecutive
trading days beginning with the last trading of the month and counting forward three
trading days. Henceforth, these four consecutive trading days are known as turn-of-the-
month trading days (TOTM days, hereafter).1
The objective of this study is to examine the S&P 500 futures contract for
evidence of turn-of-the-month effects, and we document significant turn-of-the-month
effects for S&P 500 futures over the period 1982/05 through 1990. This finding is
expected given results of prior studies that document significant turn-of-the-month effects
for spot returns over a similar time period. In contrast, we find that turn-of-the-month

3
effects for S&P 500 futures disappear after 1990, and this result carries over to the S&P
500 spot market. TOTM days are classified into four groups (e.g., no-Friday, pre-Friday,
Friday and post-Friday) depending on the incidence of Friday trading, and we provide
strong evidence that the return patterns associated with the pre-Friday and post-Friday
categories of TOTM days has changed significantly over the last 29 years. We
conjecture that a change in the preferences of individual investors over time from making
direct to making indirect stock purchases through mutual funds is related to this
phenomenon. This provides us with a partial explanation of why the turn-of-the-month
pattern of S&P 500 spot and futures returns has changed over time. A secondary
objective of this study is to examine the pattern of S&P 500 futures returns for Monday-
TOTM days, and we find that S&P 500 futures returns appear unusually large on
Monday-TOTM days. The results presented in this paper are consistent with STW (1999,
1998) and advocates of efficient markets theory.
The remainder of this paper is structured in the following manner. Section II
contains a literature review of empirical studies documenting turn-of-the-month effects
for stock returns, and a description of our data set follows in Section III. The paper’s
methodology is discussed in Section IV. Section V presents the empirical findings
followed by summary and conclusions in Section VI.
II. Literature Review
Empirical evidence shows that stock returns are unusually high around the turn of
the month and that this pattern is persistent over time. Ariel (1987) examines daily
returns for the Center for Research in Security Prices’ (CRSP) value-weighted and
equally weighted indexes for the 1963 through 1981 period. Daily returns are divided

4
into two subsets, the first half and the last half of the month. The first half of the month
includes nine trading days beginning with the last trading day of the prior month and then
counting forward eight trading days into the current month. The last half of the month
includes nine trading days beginning with the penultimate trading day of the prior month
and then counting backwards eight trading days. Ariel finds that the market’s entire
cumulative advance occurs during the first half of the month. Over the nineteen years
studied, the cumulative return over the last half of the month is close to zero and
contributes nothing to the markets overall performance. Ariel offers various explanations
for this phenomenon, “but nothing sufficed to explain the observed empirical regularity”
(p. 174).
As an extension of Ariel’s (1987) study, Lakonishok and Smidt (1989) examine
daily returns around the turn of the month for the Dow Jones Industrial Average over the
ninety year period 1897 through 1986. They conclude that “Ariel’s evidence of a higher
average rate of return during the first half of the month appears to be partly the result of
idiosyncratic characteristics of the period he studied and partly the result of including the
last trading day of the previous month as part of the first half of a month” (p. 409).
However, Lakonishok and Smidt find that mean daily returns are unusually high over
TOTM days throughout their data set. Ogden (1990) examines stock return data for the
CRSP value-weighted and equally weighted indexes for the eighteen-year period 1969
through 1986 and finds that returns are higher than normal on TOTM days, especially
during periods of easy monetary policy. Ogden’s results support his hypothesis that the
magnitude of cash flows around the turn of the month and hence the strength of the turn-
of-the-month effect appears related to monetary policy. Other studies by Martikainen,

5
Perttunen, and Ziemba (1994), Ziemba (1991) and Jaffe and Westerfield (1989)
generalize turn-of-the-month effects to international markets and report similar results to
the United States (U.S.) evidence.
III. Data Set
A. Data Description
In April 1982, a futures contract based on the S&P 500 index began trading on the
Chicago Mercantile Exchange, and this contract is the most active of all index futures
contracts both in terms of open interest and daily trading volume. This study examines
close-close and time-decomposed (e.g., close-open and open-close) returns for the S&P
500 futures contract over the period May 1982 through December 1999. S&P 500
futures tick data for the period 1991 through 1999 was purchased from the Futures
Industry Institute, and from this data, we calculate returns over 15-minute intervals. The
first 15-minute interval is 9:45 to 10:00 EST with 16:00 to 16:15 EST the last 15-minute
interval. 2
Daily returns are calculated as the logarithm of the price relative for the closest
to maturity contract with the price observation switched to the next most distant contact
on the last trading day of February, May, August, and November. The data set is divided
into two subperiods with the first period from 1982/05 through 1990 and the second
period from 1991 through 1999. Besides dividing the data set into two periods of
approximately equal length, there are other justifications supporting this convention. For
example, based on published research on spot return patterns, turn-of-the-month effects
for index futures are likely present over the period 1982/05 through 1990. Published
research documenting significant turn-of-the-month return patterns for stocks predates

6
1991, and therefore, this information is in the public domain by January 1991. Lastly, the
period 1991 through 1999 is an out of sample test for the continuation of turn-of-the-
month effects.
B. Data Presentation
S&P 500 futures returns are arranged into groups using a number of criteria. In
Table 1, Ariel’s (1987) definition of the first and last half of the month is used to classify
daily returns. Mean daily returns for each of the eighteen days is presented, as is the
mean daily return over the first and last half of the month. Table 2 examines Day –1
returns in more detail. Day –1 returns are divided into two groups, and these two groups
are turn-of-the-quarter (TOTQ) and not TOTQ days. TOTQ days refer to the last trading
day of March, June, September and December, and not TOTQ days refers to the last
trading day of the remaining eight months. 3 In Table 3, the days of the month are
divided into two groups based on Ogden’s (1990) definition of TOTM and regular days
and mean daily returns are reported for both groups.
Previous authors treats TOTM days as a homogeneous group, but this study
considers the possibility that there exist significant return differences across TOTM days
other than that implied by the calendar sequence of TOTM days. For example, Ariel
(1987) finds that returns are the highest on Day –1 and the lowest on Day 2. Each turn-
of-the-month period contains four TOTM days, and this study divides these days into
four distinct groups based on the incidence of Friday trading. The four categories of
TOTM days are as follows: (1) no-Friday, (2) pre-Friday, (3) Friday, and (4) post-
Friday.4

7
If Monday is the last trading day of the month, then the TOTM days are Monday,
Tuesday, Wednesday and Thursday, and these days are placed in the no-Friday category.
The no-Friday category also includes the sequence of TOTM days that do not include a
Friday due to a Friday exchange holiday. Pre-Friday includes all TOTM days preceding
a Friday that is also a TOTM day. For example, if Friday is the third trading day of the
month, then the preceding Thursday, Wednesday and Tuesday are pre-Fridays. Friday
includes those TOTM days that occur on a Friday. Post-Friday includes all TOTM days
following a Friday that is also a TOTM day. For example, if Friday is the first trading
day of the month, then the following Monday and Tuesday are post-Fridays.
IV. Methodology
Ogden (1990) argues that the payment of cash receipts is concentrated at the
turn of the month, and the subsequent investment of these cash receipts is related to the
observed high stock returns around the turn of the month. These receipts include
dividends, interest payments, wages, and payments made to defined contribution plans.
The Investment Company Institute provided annual data on net sales of stock, bond and
hybrid funds for the period 1970 through 1999, and this data shows that net sales of
mutual funds increased significantly after 1990. Over the period 1982 through 1990,
annual mutual-fund flow averaged a positive $50 billion, but this number increased to
$230.7 billion over the period 1991 through 1999. The difference in mean annual
mutual-fund flow between the two periods is significant at the 0.0001 level.
In early 2000, the Vanguard S&P 500 index fund surpassed the Fidelity Magellan
fund as the largest U.S. mutual fund with over $110 billion in assets. In the 1990’s, the
growth of S&P 500 index funds was spectacular, and this phenomenon is related to the

8
concurrent 4-fold increase in the S&P 500 index. Since index funds maintain very low
cash balances at all times, the time lag between inflows and their reinvestment is at most
one trading day. If a disproportionate amount of money flows into S&P 500 index funds
around the turn of the month, then their immediate reinvestment could produce
anomalous return patterns for the S&P 500 index around the turn of the month.
A reasonable assumption is that daily mutual-fund flow is a function both of
calendar time and the day of the week. In such a model where inflows are the norm, a
disproportionate amount of funds are available for investment on Mondays relative to the
other days of the week. In this scenario, more buying pressure by mutual funds,
especially near the end of the day on Monday, biases Monday’s return upwards, and this
phenomenon positively impacts all Mondays. However, due to a concentration of
inflows around the turn of the month, the upward bias in returns is most pronounced for
Monday-TOTM days
Prior research reports that, on average, Monday returns are negative and
anomalous, and for this reason Monday-TOTM days are combined into a separate
category. Lakonishok and Maberly (1990) argue that selling pressure on Monday by
individual investors is related to the Monday effect. Ogden (1990) argues that the
investment of liquid profits around the turn of the month contributes to the high returns
observed on TOTM days. However, the investment of liquid profits on Monday-TOTM
days potentially offsets the Monday selling pressure documented by Lakonishok and
Maberly. Thus, Monday-TOTM day returns are biased upward, and the Monday effect is
predicted to disappear for Monday-TOTM days.

9
An important fact overlooked in past studies is that the last trading day of the
month occurs on Friday with frequency 3/7 excluding the impact of holiday closures.
The last trading day of the month is Friday whenever Friday, Saturday, or Sunday is the
last day of the month. Many U.S. workers are paid on the last trading day of the month,
and therefore, fund flow into defined contribution plans is unusually high on Friday-
TOTM days
Anecdotal evidence suggests that individual investors preferred direct stock
purchase through brokerage firms during the 1970’s versus indirect stock purchases
through mutual funds. If direct equity purchases by individuals are the norm, then we
conjecture that turn-of-the-month buying pressure is either coincident or leads the
payment of cash receipts. An individual who anticipates receiving funds earmarked for
investment say on Friday can make purchases on the preceding Tuesday, Wednesday or
Thursday (the settlement date is currently three days after the purchase). In contrast,
anecdotal evidence suggests that individual investors preferred indirect stock purchases
through mutual funds during the 1990’s, and this includes purchasing mutual funds via
brokerage firms or from the mutual-fund company themselves. In many cases, investors
automatically route funds on a monthly basis to mutual fund companies. If indirect
equity purchases by investors are the norm, then we conjecture that turn-of-the-month
buying pressure is either coincident or lags the payment of cash receipts.
If turn-of-the-month buying pressure is either coincident or leads the payment of
cash receipts, then the resulting buying pressure is projected to have a greater impact on
pre-Friday and Friday TOTM day returns. In contrast, if turn-of-the-month buying
pressure is either coincident or lags the payment of cash receipts, then the resulting

10
buying pressure is projected to have a greater impact on Friday and post-Friday TOTM
days. In summary, we argue that TOTM day mean returns differ across the no-Friday,
pre-Friday, Friday and post-Friday classification. We find that significant differences
exist in mean returns across the four categories of TOTM days and relate these
differences to the investment preferences of individuals for making direct or indirect
stock purchases.
V. Empirical Results
A. First half versus Last half of the Month
Ariel (1987) contends that stock returns are unusually high over the first half of
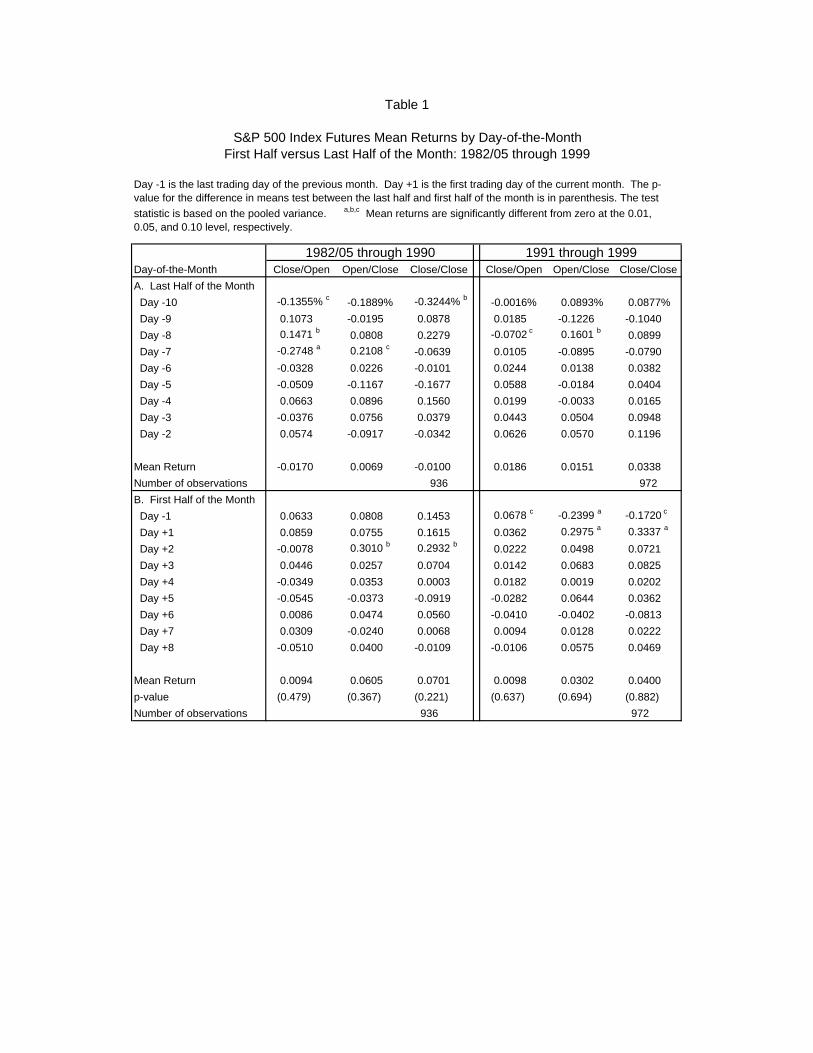
the month and labels this phenomenon the monthly effect. In Table 1, we replicate
Ariel’s study for S&P 500 index futures, and the results are presented for each period
1982/05 through 1990 and 1991 through 1999.
1982/05 through 1990
The Crash of ’87 occurs on Day –10, and if the –22.89 percent return is omitted,
then Day –10 mean returns equal –0.1053 percent and mean returns over the last half of
the month equal 0.0144 percent. Other than Day –10 and the large returns observed for
Day 2, there is nothing unusual about daily mean returns for each of the eighteen trading
days examined. Mean returns between the first and last half of the month are not
statistically different at acceptable levels. For S&P 500 futures, the hypothesis that a
monthly effect exits is rejected.

11
1991 through 1999
There is no evidence of a monthly effect over the period 1991 through 1999. S&P
500 futures returns are indistinguishable between the first and last half of the month for
all three return measures examined. Numerically there is almost no difference between
first (0.0400 percent) and last half (0.0338 percent) of the month mean returns. Ariel
(1987) reports unusually high spot returns on the last trading of the month, and the results
reported for Day –1 in Table 1 are of special interest. Day –1 mean returns are negative
at –0.1720 percent, and of the eighteen days examined, returns are the lowest on Day –1.
B. Turn-of-the-Quarter Trading Days
Ariel (1987) documents large returns on the last trading day of the month, and
therefore, the results for turn-of-the-quarter effects presented in Table 2 are totally
unexpected. Mean returns for TOTQ trading days are negative for both periods 1982/05
through 1990 (-0.1508 percent) and 1991 through 1999 (-0.3201 percent). Over the 18-
year period 1982/05 through 1999, mean TOTQ returns (-0.2366 percent) are statistically
different from not TOTQ mean returns (0.0946 percent) at the 0.05 level. This
phenomenon might be related to selling pressure generated by institutional investors
“window dressing” their portfolio at the end of the quarter, but whatever the cause, the
negative returns observed on TOTQ days occur exclusively during the trading day.
Ariel (1987) finds that Day –1 mean returns are unusually large over the period
1963 through 1981, but observe from Table 2 that both TOTQ (-0.3201 percent) and not
TOTQ (-0.0980 percent) mean returns are negative over the period 1991 through 1999.
This observation is both unexpected and unusual given the meteoric rise in the S&P 500
index and the large annual mutual-fund inflow over the decade of the 1990’s. An

12
obvious question is whether these results carry over to the S&P 500 index, and the
answer is, yes. An analysis of Day –1 returns for the S&P 500 index reveals a return
pattern similar to that observed for S&P 500 futures.5
C. Turn-of-the-Month versus Regular Days
Ogden (1990) documents significant turn-of-the-month effects for spot returns
over the period 1969 through 1986. TOTM day returns are unusually large and
significantly different from regular day returns. In Table 3, we calculate TOTM and
regular day mean returns for S&P 500 futures, and the results are presented for each
period 1982/05 through 1990 and 1991 through 1999.
1982/05 through 1990
For the period 1982/05 through 1990, the mean return for TOTM days is 0.1676
percent, but negative at –0.0015 percent for regular days (the difference in means is
significant at the 0.05 level). Similar results are reported for time-decomposed returns.
The finding of significant turn-of-the-month effects for S&P 500 futures is not
unexpected given prior research over similar time periods documenting turn-of-the-
month effects for spot returns. A mechanical trading rule of being long S&P 500 futures
on TOTM days is profitable, and this rule avoids the Crash of ’87.
1991 through 1999
The period 1991 through 1999 is an out of sample test for the continuation of the
turn-of-the-month effect, and the results are presented in Table 3, panel B. There is no
evidence of a turn-of-the-month effect for S&P 500 futures over the period 1991 through
1999, and this result hold for both close-close and time-decomposed returns. In

13
particular, mean TOTM and regular day returns equal 0.0790 and 0.0486 percent,
respectively. The results reported in Table 3, panel B, are consistent with SWT (1998,
1999) and provide an answer to Siegel’s (1998) question as to the continuation of the
turn-of-the-month effect, that is, at least for index futures. For the S&P 500 futures
contract, the answer to Siegel’s question is, no. Turn-of-the-month effects do not
continue into the future, and in fact, they disappeared shortly after financial economists
published research identifying turn-of-the-month effects. An obvious question is whether
our results carry over to the spot market, and the answer is, yes. After 1990, turn-of-the-
month effects disappear for the S&P 500 index. 6
D. Turn-of-the-Month Days by Type
In Table 3, we report mean S&P 500 futures returns for each of four TOTM day
categories (e.g., no-Friday, pre-Friday, Friday and post-Friday) and for two periods
1982/05 through 1990 and 1991 through 1999. S&P 500 futures commenced trading in
early 1982 so there is no futures data prior to 1982. Our primary focus is the return
pattern for each of the four TOTM day categories over the 29-year period 1970 through
1999.
To extend the analysis over a longer time horizon, we calculate daily S&P 500
spot returns for the period 1970 through 1981. Each TOTM day return is classified as a
no-Friday, pre-Friday, Friday or post-Friday day, and the same procedure is applied to
daily S&P 500 futures returns over each of the two periods 1982/05 through 1990 and
1991 through 1999.7 As indicated in Table 2, panel D, the four categories of TOTM days
are combined in pairs to form four new categories; (1) no-Friday plus post-Friday, (2)
pre-Friday plus Friday, (3) no-Friday plus pre-Friday and (4) Friday plus post-Friday.

14
Mean returns are calculated for each of the four pairs, and these results are summarized in
Table 2, panel D. In general, the evidence presented in Table 2, panel D, supports our
conjecture that TOTM days are not a homogeneous group, and that in particular, there
exists significant differences in return patterns over the 29-year period 1970 through
1999, especially for the pre-Friday and post-Friday categories of TOTM days.
For the no-Friday and Friday category of TOTM days, mean returns are relatively
stable over the entire 29 years examined. On average, no-Friday returns are close to zero
and consistently the lowest of the four categories of TOTM days. In contrast, on average,
Friday returns are positive and consistently the largest of the four categories of TOTM
days, but we are most interested in the return pattern over the period 1970 through 1999
for the pre-Friday and post-Friday categories of TOTM days. Initially, as measured from
1970 through 1981, pre-Friday mean (spot) returns are unusually large at 0.1482 percent
but post-Friday mean (spot) returns are close to zero at -0.0013 percent. However, pre-
Friday returns fall, on average, and post-Friday returns increase, on average, over the 29-
year period examined. For the period 1991 through 1999, there is nothing unusual about
pre-Friday (futures) mean returns at 0.0414 percent but post-Friday (futures) mean
returns appear larger than normal at 0.1215 percent.
Annual data on mutual-fund flow strongly suggest that individuals preferred
making direct equity transactions during the 1970’s. A shift to indirect equity
transactions via mutual funds began in the 1980’s, and the preference for indirect equity
purchases became stronger during the 1990’s. In Section IV, we argued that whenever
individuals prefer making direct equity purchases, that turn-of-the-month buying pressure
is either coincident or leads the payment of cash receipts. This argument is supported by

15
the observation that mean returns (spot) over the period 1970 through 1981 are unusually
large for the combined pair of pre-Friday plus Friday TOTM days at 0.2047 percent, and
these results are reported in Table 2, panel D. In contrast, if individuals prefer making
indirect equity purchases via mutual funds, then turn-of-the-month-buying pressure is
coincident or lags the payment of cash receipts. This argument is supported by the
observation that mean returns (futures) over the period 1991 through 1999 are large for
the combined pair of Friday plus post-Friday TOTM days at 0.1218 percent.
E. Monday-TOTM Days
In Section IV, we argue that the investment of liquid profits on Monday-TOTM
days potentially offsets selling pressure observed for regular Mondays and therefore, the
weekend effect is predicted to disappear for Monday-TOTM days. In Table 3, mean
Monday S&P 500 futures returns are presented for two categories of Mondays, Monday-
TOTM days and regular Mondays. Results are presented for each period 1982/05
through 1990 and 1991 through 1999.
1982/05 through 1990
For large firms as represented by the S&P 500 index, prior studies find that the
Monday effect became a weekend effect circa 1974 (Smirlock and Starks (1987)). The
existence of a weekend effect implies that mean returns are negative from the close on
Friday to the open on Monday. A statistically significant weekend effect is observed for
S&P 500 futures for regular Mondays (Monday’s close-open mean return equals –0.0935
percent), and Monday’s mean close-close return is negative, although not significant, at
–0.0663 percent.

16
This conjecture is confirmed by the observation that close-open mean S&P 500
futures returns are positive at 0.0419 percent for Monday-TOTM days. Of special
interest is the observation that close-close mean futures returns are unusually large at
0.3057 percent for Monday-TOTM days, and mean futures returns on Monday-TOTM
days are the largest over all five categories of TOTM days examined. These results are
consistent with our conjecture that daily mutual-fund flow is a function of calendar time,
and increased mutual-fund flow around the turn-of-the-month has a disproportionate
positive impact on Monday-TOTM day returns.
1991 through 1999
A significant weekend effect for index futures was observed over the period
1982/05 through 1990, but this anomaly is confined to Monday-regular days. The
empirical results presented in Table 3, panel B, show that this anomaly disappears for
more recent S&P 500 futures return data. Of particular interest is the observation that
for regular Monday trading days Monday’s mean close-close futures return is unusually
large at 0.0961 percent. We label this phenomenon facetiously the new Monday effect.
Furthermore, the mean futures return for Monday-TOTM days (0.1508 percent) is larger
than the mean return observed for any of the other four categories of TOTM days listed in
Table 3.8 The unusually high returns observed for Monday-TOTM days is consistent
with the finding by Edelen and Warner (2000) of higher beginning of the month mutual-
fund flow.
F. Intraday Price Changes for S&P 500 Futures: 1991 through 1999
In a recent paper, Edelen and Warner (2000) examine the relation between S&P
500 index returns and aggregate mutual-fund flow into U.S. equity funds, using daily

17
flow data for the period February 1998 through June 1999. They find that mutual-fund
flow is correlated with concurrent S&P 500 index returns. Although no material
difference in flow is observed across the days of the week, they find evidence of higher
beginning of month flows and returns. Edelen and Warner extend their analysis to
intraday returns to study the question of causality between concurrent flow and returns,
and argue that trading in response to day’s flow is projected to be concentrated late in the
afternoon. S&P 500 index returns are decomposed into early and late in the day
components and virtually no association exist between concurrent flow and early market
returns. All of the daily association between concurrent flow and S&P 500 returns is
attributable to afternoon returns.
S&P 500 futures tick data for the period 1991 through 1999 is used to calculate
15-minute interval returns for each TOTM day, and average intraday futures returns are
calculated for each of the four TOTM day categories; no-Friday, pre-Friday, Friday and
post-Friday. This data is used to estimate intraday pricing patterns for each of the four
TOTM day categories, and this information is depicted in Figure 1.
Edelen and Warner (2000) argue that trading in response to mutual-fund flow is
projected to be concentrated late in the afternoon. Therefore, we expect to observe a
steeply upward sloping (S&P 500 futures) price line late in the afternoon on days when
mutual-fund inflow is larger than normal, and this is interpreted as evidence of buying
pressure on these days. From the graph in Figure 1, the intraday pattern of futures prices
is remarkably similar for all four categories of TOTM days until about 14:30 EST.
Thereafter, we observe a steeply upward sloping price line for the post-Friday category of

18
TOTM days, and we interpret this as confirming evidence that mutual-fund inflow is
greater for the post-Friday category of TOTM days over the period 1991 though 1999.
At around 14:30 EST, we observe a steeply downward sloping price line for the
no-Friday category of TOTM days that continues until the futures market closes at 16:15
EST. The late afternoon downward sloping price line is consistent with larger than
normal mutual-fund outflow on these days, and this is interpreted as evidence of selling
pressure on these days. Why this occurs is unknown. From Figure 1, the intraday pricing
pattern of S&P 500 futures for the four categories of TOTM days reinforces the
arguments presented in this paper.
VI. Summary and Conclusions
Financial economists find that returns are unusually large beginning on the last
trading day of the month and continuing forward three trading days, and this phenomenon
is known as the monthly or TOTM effect. Ogden (1990) argues that the payment of cash
receipts in concentrated at the turn of the month, and the investment of these cash receipts
is related to the TOTM effect. Siegel (1998) notes that anomalies are not well understood
and whether they will continue to exist is an open question.
This study examines the S&P 500 futures contract for evidence of TOTM effect
over the period 1982/05 through 1990 and 1991 through 1999), and we document that
TOTM effects disappear after 1990 for the S&P 500 futures contract. These results carry
over to the spot market. TOTM days are classified into four groups depending on the
incidence of Friday trading and we find that a significant change in return patterns occurs
over the last 29 years. Mean returns for the pre-Friday category of TOTM days has
steadily declined over time while mean returns for the post-Friday category of TOTM

19
days had steadily increased over time. We argue that a change in the preference of
individual investors over time from making direct to making indirect stock purchases
through mutual funds is related to this phenomenon.
In addition, we find that mean futures returns on Monday-TOTM days are
unusual large, and relate this to buying pressure associated with large mutual-fund inflow
around the turn of the month. The intraday pricing pattern is estimated for the S&P 500
futures contract over the period 1991 through 1999, and we document a steeply upward
sloping price line late in the afternoon for the post-Friday category of TOTM days. This
is interpreted as evidence of buying pressure on these days. The results presented in this
paper support the efficient markets theory.
This paper’s empirical results suggest that turn-of-the-month return patterns are
dynamic and related to market microstructure. Since market microstructure itself is
dynamic, turn-of-the-month patterns documented in this paper for the S&P 500 futures
contract are subject to change without notice. Financial economists should be careful
when making out-of-sample inferences from observed in sample return regularities. In
closing this paper, we offer the following quote from Wyckoff (1930):
“Many thought that the market could be beaten by mechanical methods; that is, by somemeans other than human judgement. All kinds of individuals came forward with ways ofbeating the stock market; each was certain that his method would make a fortune. Fewhad any money. Always there was some reason why they had not made their fortune,even though they possessed the magic key.”

20
Notes
1. The four consecutive trading days denoted by Day –1, Day 1, Day 2, and Day 3represents TOTM days. In this paper, regular days represent all trading daysexcluding TOTM days.
2. S&P 500 futures trade for fifteen minutes beyond the 16:00 EST close of the spotmarket.
3. Mutual funds are required to report their equity holdings at the end of each quarter,and many fund managers engage in “window dressing” to improve their portfolio’sappearance. Window dressing potentially impacts returns on the last trading day ofMarch, June, September and December. For a discussion of window dressing seeRitter (1989).
4. As justification for these four categories, empirical evidence strongly suggests thatmean returns are not equal across the four categories of TOTM days. This isdiscussed in more detail in Section V, subsection D.
5. For example, over the 1991 through 1999 period, TOTQ and non TOTQ mean returnsfor the S&P 500 index equal –0.3201 and –0.0980 percent, respectively.
6. We examine S&P 500 index returns over the period 1991 through 1999. TOTM andregular day returns average 0.0844 and 0.0600 percent, respectively, but thedifference in mean returns is not significant at a meaningful level. A more detailedanalysis is available from the authors upon request.
7. For the 1970 through 1981 period, S&P 500 index returns are large for TOTM days at0.0845 percent, and this result is significant from regular days (-0.0093 percent) at the0.05 level. Mean S&P 500 spot returns for the no-Friday and post-Friday TOTMcategories equal 0.0321 and –0.0013 percent, respectively. In contrast, mean S&P500 spot returns for the pre-Friday and Friday TOTM category equal 0.1482 and0.2586 percent, respectively. A one-way analysis of variance test for the equality ofmean returns across the four categories of TOTM days yields a F-statistic of 2.563,and this result is significant at the 0.10 level.
8. A similar pattern is observed for S&P 500 index returns over the period 1991 through 1999. Mean S&P 500 spot returns for Monday-TOTM days equal 0.1670 percent,
and the mean return for Monday-TOTM days is the largest over all five categories ofTOTM days examined. Regular-Monday day S&P 500 spot returns are unusuallylarge at 0.0979 percent.

21
References
Ariel, Robert, A., 1987, A monthly effect in stock returns, Journal of FinancialEconomics 18, 161-174.
Brock, William, Josef Lakonishok, and Blake LeBaron, 1992, Simple technical tradingrules and the stochastic properties of stock returns, Journal of Finance 47, 1731-1764.
Clark, Ross and William T. Ziemba, 1987, Playing the turn-of-the-year effect with indexfutures, Operations Research 35, 799-813.
Edelen, Roger and Jerold Warner, 2000, Aggregate price effects of institutional trading: a study of mutual fund flow and market returns, Journal of Financial Economics, forthcoming.
Haugen, Robert A. and Josef Lakonishok, 1988, The Incredible January Effect; TheStock Market’s Unsolved Mystery (Dow-Jones Irwin, Homewood, IL).
Hensel, Chris R. and William T. Ziemba, 1996, Investments results from exploiting turn-of-the-month effects, Journal of Portfolio Management 22, 17-23.
Hensel, Chris R., G. A. Sick, and William T. Ziemba, 1994, The turn-of-the-month effectin the futures markets, 1982-1992, Review of Futures Markets, 8, 827-856.
Jaffe, J., and R. Westerfield, 1989, Is there a monthly effect in stock market returns? Evidence from foreign countries, Journal of Banking and Finance, 13, 237-244.
Lakonishok, Josef and Seymour Smidt, 1988, Are seasonal anomalies real? A ninety-year perspective, Review of Financial Studies 1, 403-425.
Lakonishok, Josef and Edwin D. Maberly, 1990, The weekend effect: trading patterns ofindividual and institutional investors, Journal of Finance 45, 231-244.
Martikainen, T., J. Perttunen, and W. T. Ziemba, 1994, The turn-of-the-month effect in the world’s stock markets, January 1988-January 1990, Financial Markets and Portfolio Management 8, 41-49.
Odgen, Joseph, P., 1990, Turn-of-month evaluations of liquid profits and stock returns: a common explanation for the monthly and January effects, Journal of Finance 45,
1259-1271.
Shiller, Robert, J., 2000, Irrational Exuberance (Princeton University Press, Princeton,NJ).
Siegel, Jeremy, J., 1998, Stocks for the Long Run (McGraw-Hill, NY, NY).

22
Smirlock, Michael and Laura Starks, 1986, Day of the week effects in stock returns,Journal of Finance 17, 197-210.
Sullivan, Ryan, Allan Timmerman, and Halbert White, 1999, Date-snooping, technicaltrading rule performance, and the bootstrap, Journal of Finance 54, 1647-1691.
Sullivan, Ryan, Allan Timmerman, and Halbert White, 1998, Dangers of data-driveninference: the case of calendar effects in stock returns, working paper, Universityof California at San Diego.
Wyckoff, Richard, D, 1930, Wall Street Ventures and Adventures Through Forty Years (Richard D. Wyckoff).
Ziemba, William, T., 1991, Japanese security market regularities: monthly, turn-of-the-month and year, holiday and Golden Week effects, Japan and the World Economy3,119-146.
Day-of-the-Month Close/Open Open/Close Close/Close Close/Open Open/Close Close/Close
A. Last Half of the Month
Day -10 -0.1355% c -0.1889% -0.3244% b -0.0016% 0.0893% 0.0877%
Day -9 0.1073 -0.0195 0.0878 0.0185 -0.1226 -0.1040
Day -8 0.1471 b 0.0808 0.2279 -0.0702 c 0.1601 b 0.0899
Day -7 -0.2748 a 0.2108 c -0.0639 0.0105 -0.0895 -0.0790
Day -6 -0.0328 0.0226 -0.0101 0.0244 0.0138 0.0382
Day -5 -0.0509 -0.1167 -0.1677 0.0588 -0.0184 0.0404
Day -4 0.0663 0.0896 0.1560 0.0199 -0.0033 0.0165
Day -3 -0.0376 0.0756 0.0379 0.0443 0.0504 0.0948
Day -2 0.0574 -0.0917 -0.0342 0.0626 0.0570 0.1196
Mean Return -0.0170 0.0069 -0.0100 0.0186 0.0151 0.0338
Number of observations 936 972
B. First Half of the Month
Day -1 0.0633 0.0808 0.1453 0.0678 c -0.2399 a -0.1720 c
Day +1 0.0859 0.0755 0.1615 0.0362 0.2975 a 0.3337 a
Day +2 -0.0078 0.3010 b 0.2932 b 0.0222 0.0498 0.0721
Day +3 0.0446 0.0257 0.0704 0.0142 0.0683 0.0825
Day +4 -0.0349 0.0353 0.0003 0.0182 0.0019 0.0202
Day +5 -0.0545 -0.0373 -0.0919 -0.0282 0.0644 0.0362
Day +6 0.0086 0.0474 0.0560 -0.0410 -0.0402 -0.0813
Day +7 0.0309 -0.0240 0.0068 0.0094 0.0128 0.0222
Day +8 -0.0510 0.0400 -0.0109 -0.0106 0.0575 0.0469
Mean Return 0.0094 0.0605 0.0701 0.0098 0.0302 0.0400
p-value (0.479) (0.367) (0.221) (0.637) (0.694) (0.882)
Number of observations 936 972
1982/05 through 1990 1991 through 1999
Table 1
S&P 500 Index Futures Mean Returns by Day-of-the-MonthFirst Half versus Last Half of the Month: 1982/05 through 1999
Day -1 is the last trading day of the previous month. Day +1 is the first trading day of the current month. The p-value for the difference in means test between the last half and first half of the month is in parenthesis. The test
statistic is based on the pooled variance. a,b,c Mean returns are significantly different from zero at the 0.01, 0.05, and 0.10 level, respectively.

Close/Open p-value Open/Close p-value Close/Close p-value
Turn-of-the-Quarter (n= 35) 0.0313% -0.1822% -0.1508%
Not Turn-of-the-Quarter (n= 69) 0.0795 (0.614) 0.2161 c (0.062) 0.2956 b (0.058)
Close/Open p-value Open/Close p-value Close/Close p-value
Turn-of-the-Quarter (n= 36) 0.0012 -0.3213 c -0.3201 c
Not Turn-of-the-Quarter (n= 72) 0.1012 b (0.177) -0.1922 (0.594) -0.0980 (0.342)
Close/Open p-value Open/Close p-value Close/Close p-value
Turn-of-the-Quarter (n= 71) 0.0160 -0.2527 b -0.2366 c
Not Turn-of-the-Quarter (n= 141) 0.0906 (0.214) 0.0036 (0.103) 0.0946 (0.047)
See Table 3 for defination of terms
Observations close/close Observations close/close Observations close/close
1. No-Friday + Post-Friday 336 0.0071 244 0.1146 259 0.0761
2. Pre-Friday + Friday 240 0.2047 a 172 0.2427 a 173 0.0835
Difference of means test: p-value 0.008 0.254 0.938
3. No-Friday + Pre-Friday 202 0.0993 151 0.1349 159 0.0057
4. Friday + Post-Friday 374 0.0841 262 0.1868 273 0.1218 b
Difference of means test: p-value 0.844 0.656 0.279
D. Mean TOTM Day Returns by Category
1970 through 1981 1982/05 through 1990 1991 through 1999
S&P 500 index S&P 500 futures S&P 500 futures
B. 1991 through 1999
C. 1982/05 through 1999
Table 2
S&P 500 Index Futures Mean Returns on the Last Trading Day of the Month, Day -1Turn-of-the-Quarter versus Not Turn-of-the-Quarter Days: 1982/05 through1999
A. 1982/05 through 1990
Turn-of-the-Quarter (TOTQ) refers to the months of March, June, September, and December. Reported mean returns are for the last trading day of the month, Day -1. The p-value for the difference in mean returns between Not TOTQ and TOTQ days is in parenthesis. The test statistic is based on the pooled variance. The S&P 500 index futures contract began trading on
the Chicago Mercantile Exchange in early 1982. a,b,c Mean returns are significantly differently from zero at the 0.01, 0.05, and .010 level, respectively.

Close/Open p-value Open/Close p-value Close/Close p-value
Turn-of-the-Month Days (n = 416) 0.0465% 0.1207%c 0.1676%b
Regular Days (n = 1776) -0.0078 (0.217) 0.0063 (0.101) -0.0015 (0.028)
Turn-of-the-Month Days by Type (n = 416) 1. No-Friday (n = 68) 0.0802 (0.378) -0.0749 (0.608) 0.0052 (0.969)
2. Pre-Friday (n = 86) 0.0885 (0.281) 0.1489 (0.314) 0.2375 (0.126)
3. Friday (n = 86) 0.0824 (0.312) 0.1631 (0.266) 0.2480 (0.111)
4. Post-Friday (n = 176) -0.0045 (0.959) 0.1615 (0.126) 0.1569 (0.157)
5. Monday (n = 78) 0.0419 (0.753) 0.2637 c (0.079) 0.3057 c (0.076)
Regular Days & Friday (n = 352) 0.0136 (0.480) -0.1138 c (0.071) -0.1001 (0.041)
Regular Days & Monday (n = 340) -0.0935 b (0.030) 0.0272 (0.739) -0.0663 (0.348)
Close/Open p-value Open/Close p-value Close/Close p-value
Turn-of-the-Month Days (n = 432) 0.0351 c 0.0439 0.0790 c
Regular Days (n = 1843) 0.0183 c (0.443) 0.0303 (0.763) 0.0486 b (0.544)
Turn-of-the-Month Days by Type (n = 432)
1. No-Friday (n = 76) 0.0446 (0.584) -0.0779 (0.274) -0.0332 (0.455)
2. Pre-Friday (n = 83) -0.0366 (0.232) 0.0780 (0.614) 0.0414 (0.945)
3. Friday (n = 90) 0.1278 a (0.013) -0.0054 (0.695) 0.1224 (0.466)
4. Post-Friday (n = 183) 0.0182 (0.997) 0.1033 c (0.265) 0.1215 c (0.316)
5. Monday (n = 82) 0.0711 (0.300) 0.0797 (0.497) 0.1508 (0.286)
Regular Days & Friday (n = 362) 0.0166 (0.021) 0.0072 (0.899) 0.0239 (0.372)
Regular Days & Monday (n = 351) -0.0010 (0.324) 0.0972 b (0.099) 0.0961 c (0.291)
B. 1991 through 1999
Table 3
S&P 500 Index Futures Mean ReturnsTurn-of-the-Month Trading Days versus Regular Trading Days: 1982/05 through 1999
A. 1982/05 through 1990
Turn-of-the-Month (TOTM) days include the last trading day of the previous month and the first three trading days of the current month. Regular days include all trading days except TOTM days. No-Friday includes all TOTM days in a TOTM period that does not contain a Friday. Post-Friday includes all TOTM days followings a Friday that is also a TOTM day. Pre-Friday includes all TOTM days preceding a Friday that is also a TOTM day. Friday includes all Fridays that are TOTM days. The p-value for the difference in means test is in parenthesis. The test statistic is based on the pooled variance. TOTM days by type are compared to regular days. Monday includes Mondays that are TOTM days. Monday is compared to regular days excluding Mondays. Regular days & Friday includes regular days that are Fridays. Regular days & Friday is compared to TOTM Fridays. Regular days & Monday includes regular days that are Mondays. Regular days & Monday is compared to regular days excluding Monday. The S&P 500 index futures contract began trading on the
Chicago Mercantile Exchange in early 1982. a,b,c Mean returns are significantly different from zero at the 0.01, 0.05, and 0.10 level, respectively.

Figure 1Intraday Pattern of S&P 500 Futures Prices
Turn-of-the-Month Day by Category: 1991-1999
99.85
99.90
99.95
100.00
100.05
100.10
100.15
9:45 10:15 10:45 11:15 11:45 12:15 12:45 13:15 13:45 14:15 14:45 15:15 15:45 16:15
Time-of-the-Day (EST)
Rel
ativ
e L
evel
of
S&
P 5
00 F
utu
res
Pri
ces
TOTM and No-Friday
TOTM and Pre-Friday
TOTM and Friday
TOTM and Post-Friday