clny trust 2019-ikpr - s&p global
TRANSCRIPT

Presale:
CLNY Trust 2019-IKPRNovember 19, 2019
Preliminary Ratings
Class Preliminary rating Preliminary amount ($) LTV (%)Market value decline
(%)(i)Debt yield
(%)(ii)
A AAA (sf) 204,725,000 31.7 80.1 32.0
X-CP AAA (sf) 25,412,500 (iii) N/A N/A N/A
X-EXT AAA (sf) 204,725,000(iii) N/A N/A N/A
B AA- (sf) 72,865,000 43.0 73.0 23.6
C A- (sf) 54,150,000 51.4 67.7 19.8
D BBB- (sf) 71,535,000 62.5 60.8 16.3
E NR 100,605,000 N/A N/A N/A
F NR 101,935,000 N/A N/A N/A
G NR 111,435,000 N/A N/A N/A
RR NR 30,200,000 N/A N/A N/A
RR Interest NR 7,550,000 N/A N/A N/A
Note: This presale report is based on information as of Nov. 19, 2019. The ratings shown are preliminary. Subsequent information may result inthe assignment of final ratings that differ from the preliminary ratings. Accordingly, the preliminary ratings should not be construed asevidence of final ratings. This report does not constitute a recommendation to buy, hold, or sell securities. (i)Reflects the approximate declinein the $1.1 billion appraised as-is value that would be necessary to experience a principal loss at the given rating level. (ii)Based on S&P GlobalRatings' net cash flow and the mortgage balance. (iii)Notional balance. The class X-CP and class X-EXT certificates will not have certificatebalances and will not be entitled to distributions of principal. The notional amount of the class X-CP certificates will be equal to the A-2 portionof the class A certificates, and the notional amount of the class X-EXT certificates will be equal to the certificate balance of the class Acertificates. LTV--Loan-to-value ratio, based on S&P Global Ratings' values. NR--Not rated.
Profile
Expected closingdate
Dec. 5, 2019.
Loan One two-year floating-rate commercial mortgage loan maturing Nov. 7, 2021, with five, one-yearextension options totaling $755.0 million. The loan is interest only for its entire term and has an interestrate equal to LIBOR + 2.32%, which increases by 0.25% in the fourth extension period. There is aninterest rate cap equal to 5.53% during the initial loan term and during any extension periods, and nomore than the greater of 5.53% and the rate, when added to the spread, which results in a DSC of noless than 1.10X. The aggregate debt yield must be no less than 9.0% to exercise the fourth and fifthextension options.
Presale:
CLNY Trust 2019-IKPRNovember 19, 2019
PRIMARY CREDIT ANALYST
Natalka H Chevance
New York
(1) 212-438-1236
SECONDARY CONTACT
John V Connorton III
New York
(1) 212-438-3892
www.standardandpoors.com November 19, 2019 1
© S&P Global Ratings. All rights reserved. No reprint or dissemination without S&P Global Ratings' permission. See Terms of Use/Disclaimeron the last page.
2342558

Profile (cont.)
Collateral The mortgage loan is secured by the fee and leasehold interests in 46 hotels: 36 extended-stay, eightlimited-service, and two full-service hotels.
Payment structure Amounts available for distributions to the certificateholders (including the RR class and RR interest)will be allocated between amounts available for distribution to the holders of the RR interest and to allother certificates. The portion of the amount allocable to the RR class and interest will always be theproduct of that amount multiplied by 5%, and all other nonretained certificates will at all times be theproduct of that amount multiplied by 95%. The issuer will make interest payments on the certificates toclasses A, X-CP, and X-EXT, pro rata, based on the interest due, and then sequentially to the class B,then C, then D, then E, then F, and then G certificates. Principal payments will be distributedsequentially to the class A, B, C, D, E, F, and then G certificates until each class is paid in full. Realizedlosses are allocated in reverse sequential order first, to the class G certificates, then to the class Fcertificates, then to the class E certificates, then to the class D certificates, then to the class Ccertificates, then to the class B certificates, and then to the class A certificates, in that order.
Secondary debt Mezzannine debt totaling $100.0 million.
Loan sellers/loanoriginators
Morgan Stanley Mortgage Capital Holdings LLC, Bank of America N.A., and JPMorgan Chase Bank N.A.
Borrowers 46 special-purpose entities, each organized as a Delaware limited liability company (collectively, theborrowers). The borrowers are indirectly majority-owned by Colony Capital Inc. and indirectly managedby Chatham Lodging L.P., the guarantor. The loan's sponsors are Colony Capital and Chatham LodgingTrust.
Servicer KeyBank N.A.
Special servicer CWCapital Asset Management LLC.
Trustee andcertificateadministrator
Wells Fargo Bank N.A.
Rationale
The preliminary ratings assigned to CLNY Trust 2019-IKPR's $755.0 million commercial mortgagepass-through certificates reflect S&P Global Ratings' view of the collateral's historical andprojected performance, the sponsors' and managers' experience, the trustee-provided liquidity,the loan's terms, and the transaction's structure. We determined that the loan has a beginningand ending loan-to-value (LTV) ratio of 111.2%, based on S&P Global Ratings' value.
Transaction Overview
An overview of the transaction's structure, cash flows, and other considerations follows (see chart1).
www.standardandpoors.com November 19, 2019 2
© S&P Global Ratings. All rights reserved. No reprint or dissemination without S&P Global Ratings' permission. See Terms of Use/Disclaimeron the last page.
2342558
Presale: CLNY Trust 2019-IKPR

Chart 1
Strengths
The transaction exhibits the following strengths:
- The portfolio is geographically diverse with 46 hotels located in 16 states. After California, NewJersey, and Washington, which represent 22.1%, 14.5%, and 11.1% of the trust balance byallocated loan amount (ALA), respectively, no other state accounts for more than 10.1% of thetrust balance.
- Each of the hotels benefits from its affiliation with a nationally recognized franchise. The hotelsare operated under eight different brands, each of which is affiliated with either Marriott(78.3% by ALA), Hyatt (13.6%), or Hilton (8.1%). The three largest brands in the portfolio areResidence Inn (30 hotels; 60.0% by ALA), Hyatt House (five hotels; 13.6%), and Hampton Inn(four hotels; 8.1%). In addition to name recognition, the chain affiliation enables the hotels to
www.standardandpoors.com November 19, 2019 3
© S&P Global Ratings. All rights reserved. No reprint or dissemination without S&P Global Ratings' permission. See Terms of Use/Disclaimeron the last page.
2342558
Presale: CLNY Trust 2019-IKPR

benefit from national brand-wide marketing campaigns and frequent stay programs.
- With the exception of three hotels (5.7% of ALA), all of the properties in the portfolio had arevenue per available room (RevPAR) penetration rate--which measures the RevPAR of thehotel relative to its competitors, with 100% indicating parity with competitors--exceeding100% as of the trailing 12-month (TTM) period ended June 2019 based on each hotel's SmithTravel Research (STR) report.
- The transaction benefits from the mortgage pool's granularity. The Residence Inn San JoseSouth (5.7%), Four Points Ft. Walton Beach (5.7%), and Belmont Hyatt House (5.3%), are thethree largest assets by ALA and together make up 16.7% of the mortgage pool by ALA. The 10largest properties comprise 43.0% by ALA.
- Of the 46 properties, 27 (66.5% by ALA) are located in markets that we consider to be primary,and 13 properties (21.1%) are in markets we consider to be secondary. The remaining six hotels(12.3%) are in tertiary markets. Primary markets have historically exhibited lower default andloss rates relative to secondary and tertiary markets. Because of their age, many of theproperties have more accessible locations along major highways and thoroughfares relative tomore recently constructed competitors.
- The transaction has a hard lockbox in place with respect to credit card receipts and tenant rent,and there is a cash flow sweep upon a mortgage or mezzanine event of default, borrowerbankruptcy, or if the debt yield (based on the principal amount of the loan and mezzanineloans) falls below 7.25% during years 1-3, falls below 7.50% in years 4-5, and falls below 7.75%in years 6-7. In addition, there are ongoing reserves for taxes, insurance (unless a blanket policyis in place), ground rent, and furniture, fixtures, and equipment (FF&E). There is also a propertyimprovement plan (PIP) reserve equal to $460,000 per month during each month of theextended loan term. The debt yield is 9.27% based on the total loan balance and the NCF as ofthe TTM ending August 2019.
- Each of the franchise agreements expires after the extended loan maturity date in November2026. While the majority of franchise agreements expire in 2029 (31 properties; 59.9% by ALA)and 2034 (13; 35.6%), two of the franchise agreements expire sooner is 2027 (2.8%) and 2028(1.7%).
- The borrower sponsors are Colony Capital Inc. and Chatham Lodging Trust. Chatham LodgingL.P., a Chatham affiliate, is the nonrecourse guarantor under the mortgage loan. Colony Capitalis a real estate investment and investment management firm, and as of June 30, 2019, it had$43 billion in assets under management. Chatham Lodging Trust is a publicly traded REIT thatinvests in upscale extended-stay hotels and premium-branded limited-service hotels. ChathamLodging has ownership interests in 133 hotels. Chatham Lodging has been part of theownership group since purchasing the portfolio with Cerberus in 2011. In June 2014, ColonyCapital (formerly NorthStar Realty Finance Corp.) contributed $208 million to acquire a majorityinterest in 47 assets from Cerberus Capital Management, with Chatham remaining in the jointventure with a minority interest.
- The current mortgage and mezzanine loans refinance $830.9 million of mortgage debt, andfund $26.0 million of reserves and $18.9 million of closing costs. The borrower contributed$20.8 million in equity towards the refinance.
- The transaction structure provides that the borrowers are responsible for expenses from thespecial servicing or work-out of the loan or enforcing its documents, such as collecting specialservicing, work-out, and liquidation fees. The servicer must make administrative advances(provided the collateral has sufficient value) to cover interest shortfalls that might otherwisearise from these expenses if the borrowers do not pay them on time if these advances are
www.standardandpoors.com November 19, 2019 4
© S&P Global Ratings. All rights reserved. No reprint or dissemination without S&P Global Ratings' permission. See Terms of Use/Disclaimeron the last page.
2342558
Presale: CLNY Trust 2019-IKPR

deemed recoverable from liquidation proceeds, which we believe will help avoid or mitigateshortfalls to the certificateholders.
Risk Considerations
The risks we considered for this transaction include:
- Based on S&P Global Ratings' valuation, the trust loan balance is highly leveraged, with a111.2% LTV ratio, which is higher than the LTV ratio for many single-borrower transactions wehave rated recently. The LTV ratio based on the appraiser's valuation is 69.8%. Our estimate oflong-term sustainable value is 37.3% lower than the appraiser's valuation.
- In addition to the mortgage loan, there is $100.0 million of additional mezzanine debt, whichincreases our LTV ratio to 126.0% from 111.2%. We accounted for the additional debt by usinglower LTV recovery thresholds at each rating category.
- The trust loan balance has a strong debt service coverage (DSC) of 2.20x, calculated using the2.32% spread plus the current 1.78% LIBOR rate and S&P Global Ratings' net cash flow (NCF)for the portfolio, which is 13.1% lower than the issuer's NCF. However, the loan's DSC based onthe interest rate cap of 5.53% plus the spread and S&P Global Ratings' NCF is 1.15x. Further,the DSC including the $100.0 million of mezzanine loans is 0.96x, based on the LIBOR cap plusthe spread and S&P Global Ratings' NCF, or 1.75x based on the current LIBOR plus the spreadand S&P Global Ratings' NCF.
- The mortgage loan is interest only for its entire seven-year extended term, meaning there willbe no scheduled amortization during the loan term. Compared with an amortizing loan, aninterest-only loan bears a higher refinance risk because of the higher loan balance at maturity.We accounted for this lack of amortization by using lower LTV thresholds at each ratingcategory.
- Unlike the U.S. lodging sector overall which has experienced RevPAR growth over the pastseveral years, the portfolio's performance has declined over the past three years. Afterincreasing in 2015 and 2016, RevPAR declined by 1.3% in 2017, increased 0.9% in 2018, anddeclined by 0.4% in the TTM period ended August 2019. NCF declined by 6.0% in 2017, 0.7% in2018, and 1.3% in the TTM ended August 2019. The portfolio's NCF margin has also dropped to31.1% in the TTM ended August 2019 from 34.0% in 2015.
- The average age of the hotels in the portfolio is approximately 29 years. Additionally, 18 (31.1%by ALA) of the 46 hotels are Residence Inns that have exterior corridors, a feature which isgenerally outdated and considered less safe by some travelers relative to interior corridorhotels. However, approximately $154.3 million was spent on capital expenditures across theportfolio between 2014 and July 2019 ($25,940 per guestroom). Furthermore, during the loanterm, the sponsors are planning to spend an additional $84.1 million ($14,134 per guestroom)on renovations and alterations required under franchise-related PIPs, as well as an additional$29.6 million on other capital improvements. There is an upfront PIP reserve for $26.0 millionand an ongoing reserve for $460,000 per month for the entire 84-month loan term equating to$38.6 million. We deducted $28.5 million from our value for a portion of the PIP that was notprovided in an upfront reserve.
- If a franchise agreement expires or is terminated, the borrowers must enter into a replacementfranchise agreement with a replacement franchisor. However, properties representing up to10% of the loan balance can have a replacement brand that is one tier below the current brandcategory based on the STR rating scales, but no lower than the upper midscale category, which
www.standardandpoors.com November 19, 2019 5
© S&P Global Ratings. All rights reserved. No reprint or dissemination without S&P Global Ratings' permission. See Terms of Use/Disclaimeron the last page.
2342558
Presale: CLNY Trust 2019-IKPR

includes brands like Comfort Inn, Wyndham Garden Inn, Hampton Inn, and Holiday Inn. Adowngrade of the franchise to a lower category can result in reduced occupancy, ADR, andRevPAR, and thus NCF levels relative to the performance of hotels in a higher STR chain scalecategory.
- We visited nine of the 46properties representing 32.9% of the ALA. The Westin Governor Morrisin New Jersey was closed at the time of our visit on Nov. 4th, due to a power outage at theproperty that stemmed from a fire on Oct. 25th, according to the property manager. Theproperty reopened on Nov. 12th. The hotel's guestrooms were newly renovated in early 2019and in excellent condition, and the public spaces, including the meeting space and lobby, werealso updated at that time. We also visited the two San Jose Residence Inns, Hyatt HouseBelmont, the two Denver Residence Inns, Residence Inn Atlanta Downtown, CourtyardMontvale, and Residence Inn Saddle River. These properties were in average condition.
- Several of the hotels are in markets where the appraiser or property managers identified newhotels that are planned or under construction that will compete directly or secondarily with thesubject properties. There are recently completed hotels or hotels under construction,particularly near the Chicago, San Jose, Atlanta, and Louisville properties, which will competefully or partially with the subject hotels upon their completion and stabilization. We reduced ourRevPAR and NCF from current levels to account for the potential dip in performance that mayoccur upon the opening and stabilization of additional hotel properties.
- The loan permits individual properties to be released upon a release premium payment thatranges from 105%-115% of the ALA depending on the total debt being prepaid, subject tocertain debt yield tests. These release premiums are below the 125% minimum that wegenerally look for. In addition, six properties (5.5% of ALA) are permitted to be released at par.
- Six properties (Residence Inn Downtown Denver, Residence Inn Denver South, Hampton InnColumbia, Residence Inn Troy, Residence Inn Richmond NW, and Residence Inn AltamonteSprings) totaling 8.5% of the allocated loan balance had scores within the "red zone" on theirrecent franchise inspection reports and are therefore not in compliance with the brandstandards. Furthermore, the Residence Inn Denver South property is in default under its relatedfranchise agreement. We used a 9.75% or 10.0% capitalization rate on these properties toaccount for their condition.
- The 136-guestroom Courtyard Fort Lauderdale hotel is on a ground lease, which expires inAugust 2034, only eight years after the extended loan maturity date. This could substantiallydepress recoveries from that property because of the uncertainty around extending the groundlease. We accounted for this risk by deriving its value using a present value of the expected NCFover the remaining term of the ground lease.
- The transaction exhibits concentration in the lodging sector because the loan is secured by thefee and leasehold interests in 46 hotels. S&P Global Ratings considers lodging properties to beamong the riskiest property types due to the daily nature of their pricing structure, significantoperating component, and higher expense ratio, relative to other property types. Also,compared to full-service properties, limited-service and extended-stay hotels have a shorterdevelopment timeframe, are less expensive to construct, and are easier to finance, potentiallyresulting in fewer supply constraints.
- There is no warm body carve-out guarantor, and the carve-out guaranty is capped at only 15%of the loan amount. In our view, these limitations generally lessens the disincentive provided bya full non-recourse carve-out related to "bad boy" acts or voluntary bankruptcy.
- The transaction documents include provisions for the transaction parties to seek rating agencyconfirmation (RAC) that certain actions will not result in a downgrade or withdrawal of the
www.standardandpoors.com November 19, 2019 6
© S&P Global Ratings. All rights reserved. No reprint or dissemination without S&P Global Ratings' permission. See Terms of Use/Disclaimeron the last page.
2342558
Presale: CLNY Trust 2019-IKPR

then-current ratings on the securities. The definition of RAC in the transaction documentsincludes an option for the transaction parties to deem their RAC request satisfied if, afterhaving delivered a RAC request, the transaction parties have not received a response to therequest within a certain period of time. We believe it is possible for a situation to arise where anaction subject to a RAC request would cause us to downgrade our rating on the securitiesaccording to our ratings methodology even though a RAC request is deemed to be satisfiedpursuant to this option.
Overview Of The U.S. Lodging Sector
U.S. lodging sector
After five consecutive years (2003-2007) of RevPAR growth, performance for the overall U.S. hotelsector started to decline significantly in the second half of 2008 as the effects of therecession--including a rise in unemployment levels, a decline in consumer confidence, andweakened corporate profitability--took hold.
Table 1
U.S. Hotel Sector Historical Performance
2007 2008 2009 2010 2011 2012 2013 2014 2015 2016 2017 2018
Occupancy (%) 63.1 60.3 55.1 57.5 60.1 61.4 62.2 64.4 65.5 65.4 65.9 66.2
ADR ($) 104.04 106.96 97.51 98.06 101.64 106.1 110.3 114.92 120.3 124.13 126.72 129.83
RevPAR ($) 65.61 64.49 53.71 56.43 61.06 65.17 68.58 74.04 78.68 81.15 83.57 85.96
RevPAR change (%) N/A -1.7 -16.7 5.1 8.2 6.7 5.2 8 6.3 3.1 3 2.9
Supply change (%) N/A 2.7 3.2 2 0.6 0.5 0.7 0.9 1.1 1.6 1.8 2
ADR--Average daily rate. RevPAR--Revenue per available room. N/A--Not applicable. Source: Smith Travel Research.
In 2009, the industry experienced unprecedented performance declines, as RevPAR decreased by16.7%, the largest single-year decline for the industry on record. The economic downturn mostseverely strained the luxury and upscale segments, due to a decrease in higher-rate corporatetransient and group travel and a decline in high-end leisure travel as consumers more closelymonitored their discretionary spending. However, all lodging segments experienced double-digitRevPAR declines in 2009 because hotel demand typically correlates closely with overall economicperformance.
Occupancy increases stemming from strengthened demand, particularly in the corporatetransient segment, have led to improved performance in the U.S. hotel sector each year sincemid-2010. As occupancy levels stabilized, average daily rate (ADR) gains followed. RevPARincreased each year between 2011 and 2018 (see table 1). As of year-end 2018, U.S. RevPARexceeded the prior peak RevPAR achieved in 2007 by 31.0%. Year-to-date through September2019, RevPAR increased 1.0% versus the same period in 2018.
While still positive, RevPAR growth rates have slowed in recent years as occupancy reached peaklevels. Furthermore, U.S. supply growth was significantly below historical averages in each yearbetween 2011 and 2014 but has escalated to more typical levels, growing by 1.6% in 2016, 1.8% in2017, and 2.0% in 2018. In addition, while RevPAR has increased annually for the U.S. overall,several of the top 25 lodging markets have experienced declines in recent years, including
www.standardandpoors.com November 19, 2019 7
© S&P Global Ratings. All rights reserved. No reprint or dissemination without S&P Global Ratings' permission. See Terms of Use/Disclaimeron the last page.
2342558
Presale: CLNY Trust 2019-IKPR

Chicago, Philadelphia, New York, and Washington, D.C.
Limited-service market overview
The limited-service segment of the lodging industry caters primarily to price-sensitive corporateand leisure transient demand. These properties offer a limited range of guest services, haveminimal public space, and generally do not have significant food and beverage operations.Guestroom amenities are minimal, and depending on their age, some properties may featureexterior corridor configurations.
Properties in this segment maintain minimum staff levels to provide a lower price point whilemaintaining profitability. The limited amenities offered enable operators to limit expenses,particularly payroll expenses, due to the lower staff levels required. Gross operating profits for theeconomy segment typically range from 25%-30%, which is higher than the margins of full-servicehotels.
Eight of the hotels in the portfolio (19.6% by ALA) are considered limited-service hotels becausethey lack full-service three-meal restaurants or significant meeting space. Based on their ADR,the limited-service hotels in the portfolio fall under the upscale (Courtyard and Four Points) andupper-midscale (Hampton Inn) chain scale segments, according to STR.
Upscale extended-stay market overview
In addition, 36 of the hotels in the portfolio (74.4% by ALA) are considered extended-stay hotels.The extended-stay sector is divided into three segments: upscale, mid-price, and economy. Basedon the level of amenities and services provided, the ADRs and lengths of stay vary among thesesegments. Based on the brands of the extended-stay hotels in the portfolio, Residence Inn andHyatt House are considered upscale, while TownePlace Suites is considered an upper midscaleextended-stay property.
The extended-stay hotel sector caters to guests seeking longer-term hotel stays. These propertiesdiffer from traditional hotels in that the guestrooms are equipped with separate living andsleeping areas and have full kitchens or kitchenettes. In addition, they typically offer fewer guestservices, have limited public space, and generally do not have food and beverage outlets.Guestroom amenities are also limited, and housekeeping may not be provided daily. Becauseguests tend to stay at these hotels for a longer timeframe, the limited guest services typicallyresult in lower operating expenses compared with those of traditional full- and limited-servicehotels.
Table 2
Innkeepers Hotel Portfolio Overview
No. of hotels Allocated loan amount % of allocated loan amount
Extended stay(i) 36 561,349,000 74.4
Limited service(ii) 8 148,151,000 19.6
Full service(iii) 2 45,500,000 6.0
Total 46 755,000,000 100.0
(i)Extended-stay hotels include Hyatt House, Residence Inn, and TownePlace Suites. (ii)Limited-service hotels include Courtyard by Marriott,Four Points by Sheraton, and Hampton Inn. (iii)Full-service hotels include the Sheraton Rockville and the Westin Morristown.
www.standardandpoors.com November 19, 2019 8
© S&P Global Ratings. All rights reserved. No reprint or dissemination without S&P Global Ratings' permission. See Terms of Use/Disclaimeron the last page.
2342558
Presale: CLNY Trust 2019-IKPR

Property Characteristics
Collateral description
The mortgage loan is secured by the fee and leasehold interests in 36 extended-stay, eightlimited-service, and two full-service hotels operating under eight different nationally recognizedbrands. The average room count is 129 guestrooms, and the average age of the properties,constructed from 1963-2006, is 29 years. Due to their age, 18 of the properties have exteriorcorridors.
Demand for limited-service and extended-stay hotels is primarily driven by corporate transientand leisure demand. The hotels generally have very limited meeting space and therefore generateminimal meeting and group demand. The national brand affiliations and related recognition isextremely favorable considering the sector's reliance on transient demand. With their age, many ofthe properties enjoy superior visibility and are near major highways and thoroughfares relative tonewer competitors.
Brand distribution
The 46 hotels operate under eight different national brands, each of which is affiliated with eitherMarriott, Hyatt, or Hilton.
The largest three brands comprise 39 hotels representing 81.7% of the portfolio by ALA (see table3). Thirty hotels are branded Residence Inns (60.0% by ALA), five are Hyatt House hotels (13.6%),and four are Hampton Inn properties (8.1%).
Table 3
Portfolio Brand Affiliations
Franchise Brand family Allocated loan amount (mil. $) Allocated loan amount (%)
Residence Inn Marriott 452.6 60.0
Hyatt House Hyatt 102.7 13.6
Hampton Inn Hilton 61.2 8.1
Courtyard Marriott 43.9 5.8
Four Points Marriott 43.1 5.7
Westin Marriott 38.4 5.1
Sheraton Marriott 7.1 0.9
TownePlace Suites Marriott 6.0 0.8
Total - 755.0 100.0
Geographic distribution
The portfolio is geographically diverse with 46 hotels located in 16 states (see table 4). The threestates with the largest allocation by ALA are California (22.1% by ALA), New Jersey (14.5%), andWashington (11.1%). No other state accounts for more than 10.1% of the trust balance.
www.standardandpoors.com November 19, 2019 9
© S&P Global Ratings. All rights reserved. No reprint or dissemination without S&P Global Ratings' permission. See Terms of Use/Disclaimeron the last page.
2342558
Presale: CLNY Trust 2019-IKPR

Table 4
Concentrations By State
State No. of properties % of allocated loan amount
California 6 22.1
New Jersey 6 14.5
Washington 4 11.1
Florida 4 10.1
Texas 4 7.4
Georgia 2 5.3
Kentucky 3 4.9
Colorado 2 4.8
Maryland 3 3.9
New York 2 2.9
Michigan 2 2.8
Illinois 1 2.6
Pennsylvania 2 2.4
Connecticut 2 2.0
Virginia 2 1.8
Maine 1 1.5
Total 46 100.0
RevPAR penetration
The hotels in the portfolio compete primarily with other limited-service and extended-stay brands.Below we summarize the RevPAR penetration rates for the hotels in the portfolio (see table 5).With the exception of three hotels, each of the remaining 43 hotels in the portfolio had RevPARpenetration rates above 100% as of the TTM ending June 2019. We attribute the generally highRevPAR penetration rates to the fact that all of the hotels within the portfolio are associated withnationally recognized brands. However, in certain cases, the hotels identified as primarycompetitors are of a lower chain scale classification, which may increase the hotel's penetrationrate due to a lower average RevPAR for the competitive set.
Table 5
RevPAR Penetration Rates(i)
RevPAR penetration No. of properties % of allocated loan amount
>140% 7 16.8
130%-140% 3 5.6
120%-130% 12 18.9
110%-120% 15 36.0
100%-110% 6 17.0
<100% 3 5.7
www.standardandpoors.com November 19, 2019 10
© S&P Global Ratings. All rights reserved. No reprint or dissemination without S&P Global Ratings' permission. See Terms of Use/Disclaimeron the last page.
2342558
Presale: CLNY Trust 2019-IKPR

Table 5
RevPAR Penetration Rates(i) (cont.)
RevPAR penetration No. of properties % of allocated loan amount
Total 46 100.0
(i)All figures as of trailing 12 months ended June 2019. RevPAR--Revenue per available room.
Capital expenditures
The hotels were constructed between 1963 and 2006, and the average age of the hotels in theportfolio is approximately 29 years. However, the sponsors and previous owners spentapproximately $325.8 million total between 2007 and July 2019 in capital expenditures. About47.4% of this total, or $154.3 million, was spent in the last five and one-half years (see table 6).
The sponsors are planning to spend an additional $84.1 million ($14,134) per guestroom duringthe seven-year loan term on required PIPs as well as an additional $29.6 million on other capitalimprovements. There is an upfront PIP reserve for $26.0 million and an ongoing reserve for$460,000 per month for the entire loan term equating to $38.6 million. We deducted $28.5 millionfrom our value for a portion of the PIP that was not provided in an upfront reserve.
Table 6
Capital Expenditures
Year 2007 2008 2009 2010 2011 2012 2013 2014 2015 2016 2017 2018 YTD July 2019 Total
Total (mil. $) 70.3 6.5 0.8 35.7 11.3 19.2 27.6 26.9 34.2 8.7 49.6 17.6 17.4 325.8
YTD--Year to date.
The loan is also structured with an ongoing FF&E reserve equal to 4.0% of total revenue. Due tothe age and condition of the individual properties, we utilized a 5.0% FF&E expense in ouranalysis.
Leasehold interests
The Courtyard Fort Lauderdale (1.3% of the loan by ALA) is subject to a ground lease with the cityexpiring on July 31, 2034. Base rent under the ground lease is based on either an appraisalmethod or a consumer price index method. The annual base rent may never be adjusted below$64,886; it is currently payable at $122,176. The ground lease generally affords the lenderstandard notice and cure rights.
Property releases
The borrowers may obtain the release of one or more of the properties subject to a release priceequal to 105% of the ALA for the first 20% of the initial loan balance (not including par releases),110% of the ALA for the next 15% of the loan balance (not including par releases), and 115% of theALA thereafter (not including par releases). Six properties (5.5% of ALA) can be released at par:Residence Inn Harrisburg, TownePlace Suites Horsham, Hyatt House Mt. Laurel, Residence InnBinghamton, and Residence Inn Shelton.
www.standardandpoors.com November 19, 2019 11
© S&P Global Ratings. All rights reserved. No reprint or dissemination without S&P Global Ratings' permission. See Terms of Use/Disclaimeron the last page.
2342558
Presale: CLNY Trust 2019-IKPR

These release premiums are below the 125% minimum that we generally look for. There areadditional restrictions on property releases, including a requirement that releases are subject to adebt yield that is not less than the greater of (i) the lesser of the aggregate debt yield immediatelybefore the release and 12.0%, or (ii) 9.0%. For the first $100.0 million in releases relating tothird-party sales, the aggregate debt yield must exceed 8.5%, and the release amount is the lesserof 100% of net sales proceeds or net sale proceeds that would result in the release debt yield, butnot less than the adjusted release amount for the property.
Management agreements
The properties are managed by Island Hospitality Management, LLC, a national hotel managementcompany with expertise managing extended-stay, limited-service, and full-service hotels acrossmajor brands such as Marriott, Hilton, and Hyatt. Island, headquartered in Palm Beach, Fla.,operates 173 hotels across the U.S.
The management agreements expire on June 9, 2024, and automatically renew for one additionalterm of five years unless the manager or operating lessee gives 90 days' notice that it does notelect to renew the management agreement. Under each of the management agreements, theproperty manager is entitled to a management fee equal to a monthly fee of 3.0% of grossrevenues, an accounting fee of $1,200 per month per property, and a revenue management fee of$750 per month per property.
If the management agreement expires or is terminated, the borrowers must enter into areplacement management agreement with the current manager or another qualified managerwithin 60 days following expiration or termination. Any replacement manager would have to be aqualified manager, which is a reputable and experienced management organization (which may bea borrower affiliate) possessing at least 10 years' experience in managing hotels similar in size,scope, use, and value as the properties and has at least 10 years experience managing at least5,000 hotel rooms (exclusive of the properties) and is subject to rating agency confirmation.
Franchise agreements
Each property is operated under a separate franchise agreement, which grants the franchisee theright to use the franchisor's name in the hotel's operations, as well as the right to use certainreservation and other systems for a fee.
In total, the portfolio hotels are subject to franchise agreements that expire in either 2027, 2028,2029, or 2034, with the majority expiring in 2029 (59.9% of allocated loan balance). No franchiseagreement in the portfolio expires during the fully extended loan term. The two franchiseagreements with the shortest remaining terms--expiring in 2027 (Courtyard Montvale) and 2028(Courtyard Atlantic City)--each have a 10-year extension option.
Table 7
Franchise Agreement Expiration Dates
Expiration year No. of hotels Allocated loan amount ($) Allocated loan amount (%)
2027 1 21,354,000 2.8
2028 1 12,910,000 1.7
2029 31 452,066,000 59.9
2034 13 268,670,000 35.6
www.standardandpoors.com November 19, 2019 12
© S&P Global Ratings. All rights reserved. No reprint or dissemination without S&P Global Ratings' permission. See Terms of Use/Disclaimeron the last page.
2342558
Presale: CLNY Trust 2019-IKPR

Table 7
Franchise Agreement Expiration Dates (cont.)
Expiration year No. of hotels Allocated loan amount ($) Allocated loan amount (%)
Total 46 755,000,000 100.0
If the franchise agreement expires or is terminated, the borrowers must enter into a replacementfranchise agreement with the current franchisor or another qualified franchisor within 120 daysfollowing the franchise agreement's expiration or termination. A qualified franchisor is defined as(1) any current franchisor as long as the replacement brand is in the same or better categorybased on the STR chain scales; (2) a replacement franchisor with a brand that is not more thanone tier below the brand being replaced and no lower than upper midscale for up to 10% of theproperties by ALA, inclusive of the following clause (3); (3) a Wyndham Hotels & Resorts or Choicebrand as long as the replacement brand is not more than one tier below the brand being replacedand no more than 5% of the ALA in aggregate; or (4) a reputable and experienced franchisor (whichmay be a borrower affiliate) possessing experience in flagging hotels similar in size, scope, use,and value as the properties and is subject to rating agency confirmation.
Third-Party Reviews
We reviewed appraisal, environmental, engineering, and seismic reviews prepared within the past12 months for the 46 properties. In our view, none of the properties had notable issues. Phase IIenvironmental reports were not recommended for any property and there were no recognizedenvironmental conditions. Due to the age of the properties, the environmental reports identifiedmaterials that are suspected to contain asbestos in 24 properties, but we understand measureshave been put in place to control this. Of the 10 properties located within seismic zones 3 or 4(those in California and Washington, 34.7% of the ALA), none have a SEL greater than 15%.
The property condition reports identified approximately $1.1 million in immediate repairs needed.The borrowers are required to complete these repairs within the timeframe stated in the loanagreement for each repair item. Should they fail to complete these repairs within the specifiedtime, it would be an event of default under the loan. There is no upfront reserve for thesemandated repairs.
Structural and legal issues
We reviewed legal matters that we believed were relevant to our analysis. This review includedanalysis of the major transaction documents, including the offering circular, trust and servicingagreement, and other relevant documents and opinions, to understand the transaction'smechanics and its consistency with applicable criteria. We also conducted a focused legal reviewof the first-mortgage loan agreement, intercreditor agreement, and the cash managementagreement.
Historical Cash Flow And S&P Global Ratings' Cash Flow Notes
S&P Global Ratings reviewed the historical cash flows and the issuer- and appraiser-reportedcash flows to determine its view of a sustainable cash flow for the portfolio. We summarize thehistorical and S&P Global Ratings' NCF for the property below (see tables 8A and 8B).
www.standardandpoors.com November 19, 2019 13
© S&P Global Ratings. All rights reserved. No reprint or dissemination without S&P Global Ratings' permission. See Terms of Use/Disclaimeron the last page.
2342558
Presale: CLNY Trust 2019-IKPR

The portfolio generates the majority of its revenue from the rooms department, which generatesabout 93% of total revenue, coupled with a small food and beverage component at 4%-5% of totalrevenue. We determined room revenue for the portfolio by assessing the hotels' recent RevPARlevels, new supply in certain markets, and property condition and recent and planned renovations.We assumed a $103.56 RevPAR for the portfolio, which is about 4.3% lower than the RevPAR as ofthe TTM period ending August 2019.
We estimated total marketing and management fees at 13.2% of total revenue for the property,which is slightly above historical performance. We applied the contractual 3.0% management feeand utilized a 5.0% FF&E reserve in our analysis. We applied a 9.66% average capitalization rateto our NCF to derive our value for the property, which is 37.3% lower than the appraiser's value.The portfolio has historically generated a strong NCF margin between 33.6% and 31.1%.
Table 8A
Historical Cash Flow Portfolio
2016 2017 2018TTM August
2019 UW S&P Global Ratings
Occupancy rate (%) 78.6 76.1 76.6 76.5 76.7 74.8
ADR ($) 139.13 141.54 141.87 141.47 141.51 138.40
RevPAR ($)(i) 109.40 107.69 108.69 108.25 108.52 103.56
Total revenue (mil. $) 256.0 251.8 254.8 254.4 255.3 242.6
Total departmental expenses (mil.$)(ii)
66.0 66.7 68.2 69.0 69.4 66.9
Departmental profit (mil. $) 190.0 185.1 186.6 185.4 186.0 175.7
Total undistributed expenses (mil.$)(iii)
81.5 81.9 83.1 82.9 83.2 81.4
Total fixed charges (mil. $)(iv) 12.3 12.3 13.0 13.1 13.1 13.2
Total capital items (mil. $)(v) 10.2 10.1 10.2 10.2 10.2 12.1
NCF (mil. $) 85.9 80.8 80.2 79.2 79.4 69.0
NCF margin (%) 33.6 32.1 31.5 31.1 31.1 28.5
NCF haircut (%) (13.1)
Cap rate (%)(vi) 9.7
Deductions to value ($)(vi) 35,829,509
S&P Global Ratings' value ($) 678,781,545
S&P Global Ratings' value/key ($) 114,119
See table 8B for the cash flow footnotes. UW--Underwriter. ADR--Average daily rate. RevPAR--Revenue per available room. NCF--Net cashflow. Cap rate--Capitalization rate.
Table 8B
Cash Flow Notes
(i) We determined room revenue for the portfolio by assessing historical RevPAR levels, competitive position,property condition, and new supply entering the submarket.
(ii) We generally based departmental expenses on the percentage of departmental revenue in recent years and alsoevaluated the expenses on a per occupied room basis.
www.standardandpoors.com November 19, 2019 14
© S&P Global Ratings. All rights reserved. No reprint or dissemination without S&P Global Ratings' permission. See Terms of Use/Disclaimeron the last page.
2342558
Presale: CLNY Trust 2019-IKPR

Table 8B
Cash Flow Notes (cont.)
(iii) We generally based undistributed expenses on approximately the percentage of total revenue and per availableroom figure during the TTM period. We utilized a 3.0% management fee. Our sales and marketing andmanagement fees totaled to 13.2% of total revenue.
(iv) We based real estate taxes on the approximate August TTM 2019 figure. Insurance was based on the actual policyexpense.
(v) We estimated FF&E expenses at 5.0% of total revenue.
(vi) Deductions to value included $2.3 million for CA Prop 13, $4.9 million for the discounted cash flow valuation ofCourtyard Ft. Lauderdale, and $28.5 million for unreserved PIP required during the loan term.
FF&E--Furniture, fixtures, and equipment. NCF--Net cash flow. RevPAR--Revenue per available room. PIP--Property improvement plan.TTM--Trailing 12 months.
Changes from JPMCC 2014-INN and CLNY 2017-IKPR
The collateral pool was previously securitized in 2014 in JPMCC 2014-INN and in 2017 in CLNY2017-IKPR. Table 9 below shows a comparison of certain metrics between the transactions andCLNY Trust 2019-IKPR.
Table 9
Comparison To JPMCC 2014-INN And CLNY Trust 2017-IKPR
JPMCC 2014-INN CLNY 2017-IKPR CLNY Trust 2019-IKPR
Number of properties 47 47 46
Number of rooms 6,094 6,098 5,948
Most recent RevPAR ($) 94.58 108.13 108.25
Most recent NCF (mil. $) 70.3 85.0 79.2
Appraised value (mil. $) 983.6 1,128.9 1,081.9
Trust mortgage balance (mil. $) 635.0 754.0 755.0
Mezzanine balance (mil. $) 205.0 96.0 100.0
S&P Global Ratings' occupancy (%) 74.8 76.8 74.8
S&P Global Ratings' ADR ($) 124.00 132.36 138.40
S&P Global Ratings' RevPAR ($) 92.69 101.60 103.56
S&P Global Ratings' NCF (mil. $) 65.4 74.8 69.0
S&P Global Ratings' value (mil. $) 687.9 786.9 678.8
S&P Global Ratings' value decline to appraisedvalue (%)
112,876 129,046 114,119
S&P Global Ratings' value decline (%) (30.1) (30.3) (37.3)
S&P Global Ratings' mortgage LTV (%) 92.3 95.8 111.2
S&P Global Ratings' total debt LTV (%) 122.1 108.0 126.02
S&P Global Ratings' total debt yield (%) 10.3 8.8 8.1
ADR--Average daily rate. RevPAR--Revenue per available room. NCF--Net cash flow. LTV--Loan to value.
www.standardandpoors.com November 19, 2019 15
© S&P Global Ratings. All rights reserved. No reprint or dissemination without S&P Global Ratings' permission. See Terms of Use/Disclaimeron the last page.
2342558
Presale: CLNY Trust 2019-IKPR
Property Evaluation Details
During our property evaluation, we performed the following reviews:
- Conducted a site inspection of nine of the subject properties (32.9% by ALA);
- Analyzed and valued the properties, which included reviewing property-level operatingstatements, the borrower's budget, and STR report;
- Reviewed management and sponsorship, which included discussions with propertymanagement;
- Reviewed the third-party appraisal, environmental, and engineering report for the properties;and
- Reviewed the legal matters that we believed were relevant to our analysis, as outlined in ourcriteria. We reviewed the major transaction documents' current drafts--including the loanagreement, offering circular, and trust and servicing agreement--to verify compliance with ourcriteria and to understand the mechanics of the underlying loans and the transaction.
Scenario Analysis
We performed several 'AAA' stress scenario analyses to determine how sensitive the certificateswould be to a downgrade during the loan term.
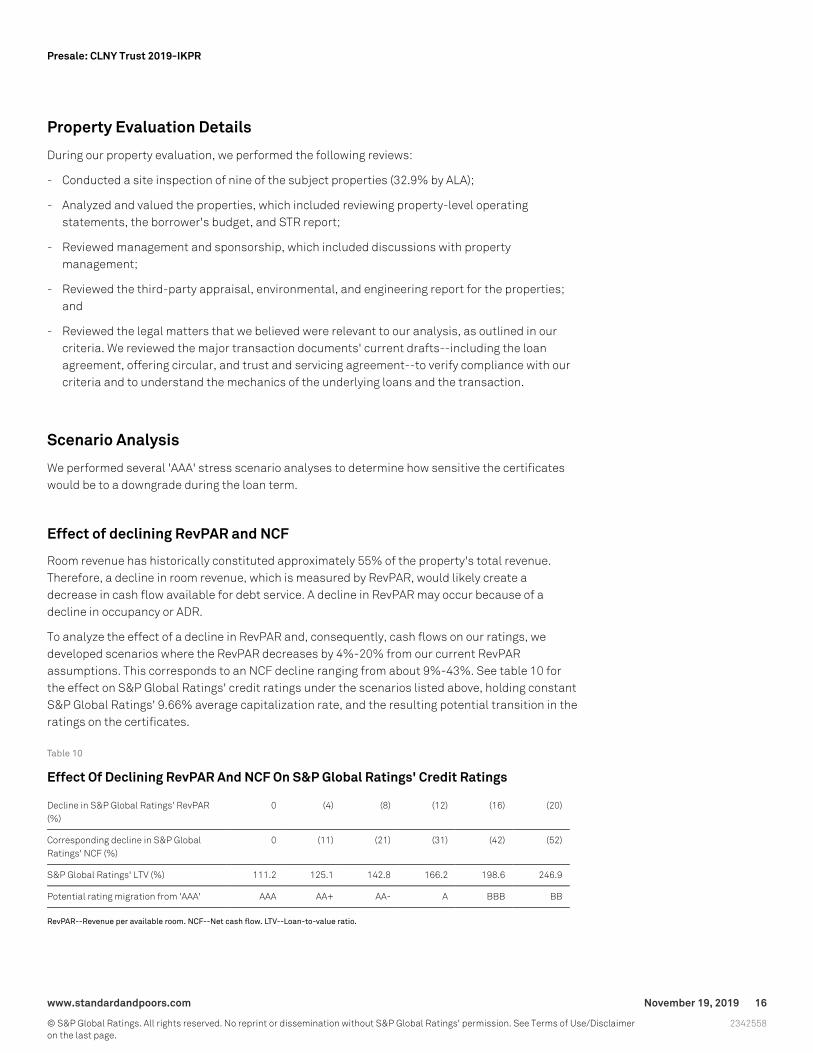
Effect of declining RevPAR and NCF
Room revenue has historically constituted approximately 55% of the property's total revenue.Therefore, a decline in room revenue, which is measured by RevPAR, would likely create adecrease in cash flow available for debt service. A decline in RevPAR may occur because of adecline in occupancy or ADR.
To analyze the effect of a decline in RevPAR and, consequently, cash flows on our ratings, wedeveloped scenarios where the RevPAR decreases by 4%-20% from our current RevPARassumptions. This corresponds to an NCF decline ranging from about 9%-43%. See table 10 forthe effect on S&P Global Ratings' credit ratings under the scenarios listed above, holding constantS&P Global Ratings' 9.66% average capitalization rate, and the resulting potential transition in theratings on the certificates.
Table 10
Effect Of Declining RevPAR And NCF On S&P Global Ratings' Credit Ratings
Decline in S&P Global Ratings' RevPAR(%)
0 (4) (8) (12) (16) (20)
Corresponding decline in S&P GlobalRatings' NCF (%)
0 (11) (21) (31) (42) (52)
S&P Global Ratings' LTV (%) 111.2 125.1 142.8 166.2 198.6 246.9
Potential rating migration from 'AAA' AAA AA+ AA- A BBB BB
RevPAR--Revenue per available room. NCF--Net cash flow. LTV--Loan-to-value ratio.
www.standardandpoors.com November 19, 2019 16
© S&P Global Ratings. All rights reserved. No reprint or dissemination without S&P Global Ratings' permission. See Terms of Use/Disclaimeron the last page.
2342558
Presale: CLNY Trust 2019-IKPR

Transaction-Level Credit Enhancement
To determine a transaction's credit enhancement at each rating level, we use each loan's S&PGlobal Ratings' DSC and LTV to calculate the stand-alone credit enhancement (SCE) anddiversified credit enhancement. However, because this transaction is secured by one loan, its SCErepresents the transaction's credit enhancement at each rating level.
Our analysis of a stand-alone transaction is predominantly a recovery-based approach thatassumes a loan default. We use the loan's stand-alone LTV thresholds at each rating level todetermine the expected principal proceeds that can be recovered at default and are applicable toa loan with a 10-year loan term, a 30-year amortization schedule, and no additional debt (a"benchmark 10/30 loan").
We considered the mortgage loan collateral for this transaction to be interest only for its entireterm and there is additional debt in the form of mezzanine debt. To account for these additionalrisks, we reduced the LTV thresholds by applying negative adjustment factors across all ratingcategories. We also applied a positive LTV adjustment to account for the geographic diversity,brand diversity, and granularity of the properties in the portfolio.
Top Three Brands
1. Residence Inn
Residence Inn is Marriott's upscale, extended-stay all-suite product with full kitchens (classifiedas an upscale product within the STR chain scales). As of 2018, the brand had a total of 789 hotelsin North America. A typical Residence Inn property contains a breakfast/dining area (where acomplimentary breakfast is served and evening social is held), a business center or lobbyworkstation, a market pantry, a guest laundry room, an exercise room, and a swimming pool. In2018, Residence Inn generated a brand-wide 79.3% occupancy, $148.27 ADR, and $117.52RevPAR.
The CLNY Trust 2019-IKPR portfolio includes 30 Residence Inn hotels, representing 60.0% by ALA.The 30 hotels within the portfolio had a RevPAR of $106.84 as of the TTM ended August 2019,which is about 9.1% below the North American brand-wide average. Of the 30 Residence Inns, 18are "generation one" assets (31.1% of the ALA), which are of an older vintage with a design typifiedby exterior corridors. The historical performance of the Residence Inns hotels in the portfolio arereflected in table 11.
Table 11
Residence Inn Hotels Historical Performance
2016 2017 2018 TTM Aug. 2019 S&P Global Ratings
Occupancy (%) 80.2 77.7 78.0 78.0 76.0
ADR ($) 135.29 137.17 137.20 137.04 134.50
RevPAR ($) 108.53 106.57 107.03 106.84 102.22
RevPAR change (%) N/A (1.8) 1.1 (0.2) (4.8)
NCF (mil. $) 54.3 50.9 50.6 49.8 43.7
Change (%) N/A (6.2) (0.7) (1.5) (12.4)
www.standardandpoors.com November 19, 2019 17
© S&P Global Ratings. All rights reserved. No reprint or dissemination without S&P Global Ratings' permission. See Terms of Use/Disclaimeron the last page.
2342558
Presale: CLNY Trust 2019-IKPR

Table 11
Residence Inn Hotels Historical Performance (cont.)
2016 2017 2018 TTM Aug. 2019 S&P Global Ratings
NCF margin (%) 37.2 35.6 34.9 34.4 31.7
ADR--Average daily rate. RevPAR--Revenue per available room. NCF--Net cash flow. TTM--Trailing 12 months. N/A--Not applicable.
2. Hyatt House
Hyatt House is classified as an upscale product within the STR chain scale. In 2007 and 2008,most properties under the AmeriSuites flag were renovated and rebranded as Hyatt House hotels;however, several Hyatt House hotels were newly constructed as well. As of December 2018, HyattHouse had 71 hotels in the U.S. providing guests with a variety of amenities and services includinga complimentary continental breakfast, H Bar, and a kitchen/café that offers food and beverageitems for purchase. Most properties include a pool, exercise room, and a limited amount ofmeeting space. Guestrooms typically feature full kitchens. In 2018, Hyatt House generated abrand-wide 80.6% occupancy, $155.45 ADR, and $125.33 RevPAR.
The CLNY Trust 2019-IKPR portfolio includes five Hyatt House hotels representing 13.6% by ALA.The five hotels within the portfolio had a RevPAR of $124.32 as of the TTM ended August 2019,which is in line with the brand-wide average. The hotels were built between 1984 and 1996, andhave an average age of 28 years. A summary of the Hyatt House hotels historical performance isprovided in table 12.
Table 12
Hyatt House Hotels Historical Performance
2016 2017 2018 TTM Aug. 2019 S&P Global Ratings
Occupancy (%) 84.7 82.6 83.0 83.1 80.5
ADR ($) 151.33 151.14 149.62 149.63 150.25
RevPAR ($) 128.12 124.86 124.16 124.32 120.95
RevPAR change (%) N/A (1.8) 1.1 0.1 (4.6)
NCF (mil. $) 12.3 11.3 10.4 10.7 9.2
Change (%) N/A (8.4) (8.3) 2.9 (13.7)
NCF margin (%) 38.8 36.2 33.3 34.1 31.1
ADR--Average daily rate. RevPAR--Revenue per available room. NCF--Net cash flow. TTM--Trailing 12 months. N/A--Not applicable.
3. Hampton Inn
Hampton Inn is a limited-service brand trademarked by Hilton Worldwide. It is classified as anupper-midscale product per the STR chain scale. As of year-end 2018, the brand had a network ofabout 2,186 hotels in the U.S. Accommodations and amenities throughout the chain are generallyconsistent including a front desk, vending area, breakfast/dining area, guest laundry room, and, inmany cases, a fitness room and a swimming pool. Complimentary hot breakfast and free WiFi areprovided. In 2018, Hampton Inn generated a brandwide 74.2% occupancy, $123.53 ADR, and
www.standardandpoors.com November 19, 2019 18
© S&P Global Ratings. All rights reserved. No reprint or dissemination without S&P Global Ratings' permission. See Terms of Use/Disclaimeron the last page.
2342558
Presale: CLNY Trust 2019-IKPR

$91.63 RevPAR.
The CLNY Trust 2019-IKPR portfolio includes four Hampton Inn hotels representing 8.1% by ALA.The four hotels within the portfolio had a RevPAR of $105.03 as of the TTM ended August 2019,which is 14.6% above the U.S. brand-wide average. The hotels were built between 1984 and 1996,and have an average age of 29 years. A summary of the Hampton Inns historical performance isprovided in table 13.
Table 13
Hampton Inn Hotels Historical Performance
2016 2017 2018 TTM Aug. 2019 S&P Global Ratings
Occupancy (%) 78.5 76.3 77.2 77.0 76.3
ADR ($) 133.45 133.11 134.45 136.37 133.0
RevPAR ($) 104.73 101.62 103.73 105.03 101.41
RevPAR change (%) N/A (1.8) 1.1 1.3 (3.3)
NCF (mil. $) 6.7 6.1 6.0 6.4 5.6
Change (%) N/A (8.9) (2.2) 7.6 (12.5)
NCF margin (%) 35.2 33.1 31.7 33.2 30.6
ADR--Average daily rate. RevPAR--Revenue per available room. NCF--Net cash flow. TTM--Trailing 12 months. N/A--Not applicable.
Related Criteria
- Criteria | Structured Finance | Legal: U.S. Structured Finance Asset Isolation AndSpecial-Purpose Entity Criteria, May 15, 2019
- General Criteria: U.S. Government Support In Structured Finance And Public Finance Ratings,Dec. 7, 2014
- Criteria | Structured Finance | CMBS: Insurance Criteria For U.S. And Canadian CMBSTransactions, June 13, 2013
- General Criteria: Methodology And Assumptions: Assigning Ratings To Bonds In The U.S. BasedOn Escrowed Collateral, Nov. 30, 2012
- Criteria | Structured Finance | CMBS: CMBS Global Property Evaluation Methodology, Sept. 5,2012
- Criteria | Structured Finance | CMBS: Rating Methodology And Assumptions For U.S. AndCanadian CMBS, Sept. 5, 2012
- Criteria - Structured Finance - General: Criteria Methodology Applied To Fees, Expenses, AndIndemnifications, July 12, 2012
- General Criteria: Global Investment Criteria For Temporary Investments In TransactionAccounts, May 31, 2012
- Criteria | Structured Finance | CMBS: Assessing Borrower-Level Special-Purpose Entities InU.S. CMBS Pools: Methodology And Assumptions, Nov. 16, 2010
- Criteria | Structured Finance | General: Global Methodology For Rating Interest-Only Securities,April 15, 2010
www.standardandpoors.com November 19, 2019 19
© S&P Global Ratings. All rights reserved. No reprint or dissemination without S&P Global Ratings' permission. See Terms of Use/Disclaimeron the last page.
2342558
Presale: CLNY Trust 2019-IKPR

- Criteria | Structured Finance | General: Methodology For Servicer Risk Assessment, May 28,2009
Related Research
- Global Structured Finance Outlook 2019: Securitization Continues To Be Energized WithPotential $1 Trillion In Volume Expected Again, Jan. 7, 2019
- Global Structured Finance Scenario And Sensitivity Analysis 2016: The Effects Of The Top FiveMacroeconomic Factors, Dec. 16, 2016
- U.S. And Canadian CMBS Diversity Adjustment Factor Matrices, Sept. 5, 2012
- Application Of CMBS Global Property Evaluation Methodology in U.S. And CanadianTransactions, Sept. 5, 2012
In addition to the criteria specific to this type of security (listed above), the following criteriaarticles, which are generally applicable to all ratings, may have affected this rating action:"Counterparty Risk Framework: Methodology And Assumptions," March 8, 2019; "Post-DefaultRatings Methodology: When Does Standard & Poor's Raise A Rating From 'D' Or 'SD'?," March 23,2015; "Global Framework For Assessing Operational Risk In Structured Finance Transactions,"Oct. 9, 2014; "Methodology: Timeliness of Payments: Grace Periods, Guarantees, And Use of 'D'And 'SD' Ratings," Oct. 24, 2013; "Criteria For Assigning 'CCC+', 'CCC', 'CCC-', And 'CC' Ratings,"Oct. 1, 2012; "Methodology: Credit Stability Criteria," May 3, 2010; and "Use of CreditWatch AndOutlooks," Sept. 14, 2009.
www.standardandpoors.com November 19, 2019 20
© S&P Global Ratings. All rights reserved. No reprint or dissemination without S&P Global Ratings' permission. See Terms of Use/Disclaimeron the last page.
2342558
Presale: CLNY Trust 2019-IKPR

S&P may receive compensation for its ratings and certain credit-related analyses, normally from issuers or underwriters of securities or from obligors.S&P reserves the right to disseminate its opinions and analyses. S&P's public ratings and analyses are made available on its Web sites,www.standardandpoors.com (free of charge), and www.ratingsdirect.com and www.globalcreditportal.com (subscription), and may be distributedthrough other means, including via S&P publications and third-party redistributors. Additional information about our ratings fees is available atwww.standardandpoors.com/usratingsfees.
S&P keeps certain activities of its business units separate from each other in order to preserve the independence and objectivity of their respectiveactivities. As a result, certain business units of S&P may have information that is not available to other S&P business units. S&P has establishedpolicies and procedures to maintain the confidentiality of certain non-public information received in connection with each analytical process.
Credit-related and other analyses, including ratings, and statements in the Content are statements of opinion as of the date they are expressed andnot statements of fact. S&P's opinions, analyses and rating acknowledgment decisions (described below) are not recommendations to purchase,hold, or sell any securities or to make any investment decisions, and do not address the suitability of any security. S&P assumes no obligation toupdate the Content following publication in any form or format. The Content should not be relied on and is not a substitute for the skill, judgment andexperience of the user, its management, employees, advisors and/or clients when making investment and other business decisions. S&P does not actas a fiduciary or an investment advisor except where registered as such. While S&P has obtained information from sources it believes to be reliable,S&P does not perform an audit and undertakes no duty of due diligence or independent verification of any information it receives. Rating-relatedpublications may be published for a variety of reasons that are not necessarily dependent on action by rating committees, including, but not limitedto, the publication of a periodic update on a credit rating and related analyses.
To the extent that regulatory authorities allow a rating agency to acknowledge in one jurisdiction a rating issued in another jurisdiction for certainregulatory purposes, S&P reserves the right to assign, withdraw or suspend such acknowledgment at any time and in its sole discretion. S&P Partiesdisclaim any duty whatsoever arising out of the assignment, withdrawal or suspension of an acknowledgment as well as any liability for any damagealleged to have been suffered on account thereof.
Copyright © 2019 Standard & Poor's Financial Services LLC. All rights reserved.
No content (including ratings, credit-related analyses and data, valuations, model, software or other application or output therefrom) or any partthereof (Content) may be modified, reverse engineered, reproduced or distributed in any form by any means, or stored in a database or retrievalsystem, without the prior written permission of Standard & Poor's Financial Services LLC or its affiliates (collectively, S&P). The Content shall not beused for any unlawful or unauthorized purposes. S&P and any third-party providers, as well as their directors, officers, shareholders, employees oragents (collectively S&P Parties) do not guarantee the accuracy, completeness, timeliness or availability of the Content. S&P Parties are notresponsible for any errors or omissions (negligent or otherwise), regardless of the cause, for the results obtained from the use of the Content, or forthe security or maintenance of any data input by the user. The Content is provided on an “as is” basis. S&P PARTIES DISCLAIM ANY AND ALL EXPRESSOR IMPLIED WARRANTIES, INCLUDING, BUT NOT LIMITED TO, ANY WARRANTIES OF MERCHANTABILITY OR FITNESS FOR A PARTICULAR PURPOSE ORUSE, FREEDOM FROM BUGS, SOFTWARE ERRORS OR DEFECTS, THAT THE CONTENT'S FUNCTIONING WILL BE UNINTERRUPTED OR THAT THECONTENT WILL OPERATE WITH ANY SOFTWARE OR HARDWARE CONFIGURATION. In no event shall S&P Parties be liable to any party for any direct,indirect, incidental, exemplary, compensatory, punitive, special or consequential damages, costs, expenses, legal fees, or losses (including, withoutlimitation, lost income or lost profits and opportunity costs or losses caused by negligence) in connection with any use of the Content even if advisedof the possibility of such damages.
Standard & Poor’s | Research | November 19, 2019 21
2342558
Presale: CLNY Trust 2019-IKPR