clinical pathophysiology of the cardiovascular system
TRANSCRIPT

Clinical Clinical pathophysiology of pathophysiology of the cardiovascular the cardiovascular
system.system.
Blood PressureBlood Pressure
Exhibits a normal distribution within Exhibits a normal distribution within the populationthe population
Increasing blood pressure is Increasing blood pressure is associated with a progressive associated with a progressive increase in the risk of stroke and increase in the risk of stroke and cardiovascular diseasecardiovascular disease
Risk however rises exponentially and Risk however rises exponentially and not linearly with pressurenot linearly with pressure

At what blood pressure is a patient At what blood pressure is a patient hypertensive?hypertensive?
BHSBHS 140/90140/90 JNC-VIJNC-VI 140/90140/90 Opt <120/<80Opt <120/<80
WHO-ISHWHO-ISH 140/90140/90 The current recommendation in the The current recommendation in the
UK is UK is 140/90140/90 However risk is important and in However risk is important and in
diabetesdiabetes 130/80130/80
In 95% of cases no cause can be In 95% of cases no cause can be foundfound
In 5-10% a cause can be foundIn 5-10% a cause can be found– Chronic renal diseaseChronic renal disease– Renal artery stenosisRenal artery stenosis– Endocrine disease, Cushings, Conn’s Endocrine disease, Cushings, Conn’s
Syndrome, Phaeochromocytoma, GRASyndrome, Phaeochromocytoma, GRA
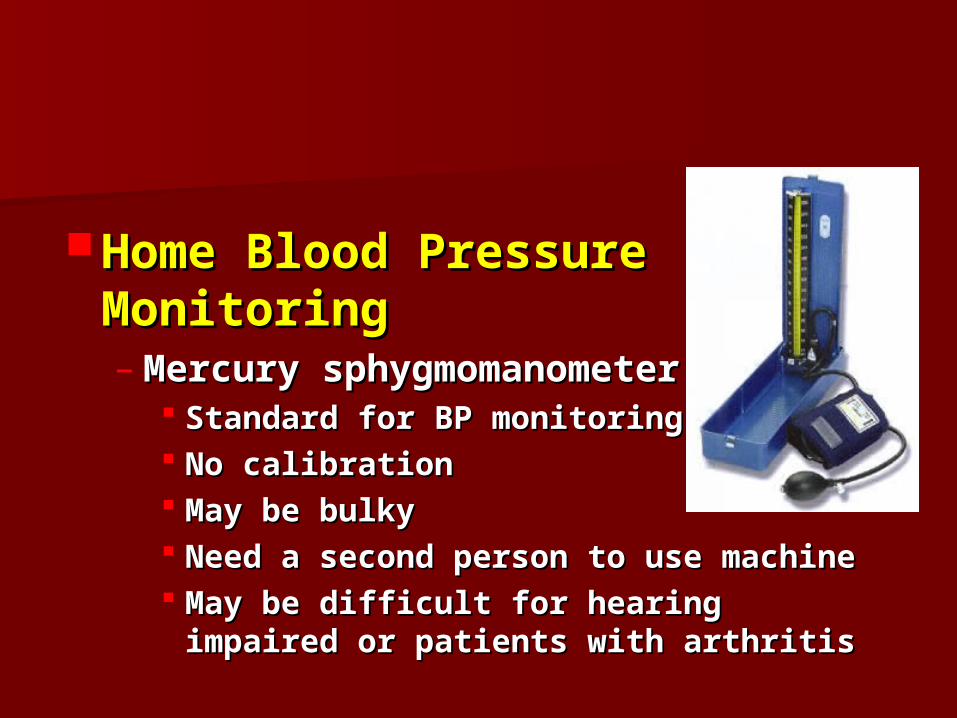
Home Blood Pressure Home Blood Pressure MonitoringMonitoring– Mercury sphygmomanometerMercury sphygmomanometer
Standard for BP monitoringStandard for BP monitoring No calibrationNo calibration May be bulkyMay be bulky Need a second person to use machineNeed a second person to use machine May be difficult for hearing impaired or May be difficult for hearing impaired or
patients with arthritispatients with arthritis
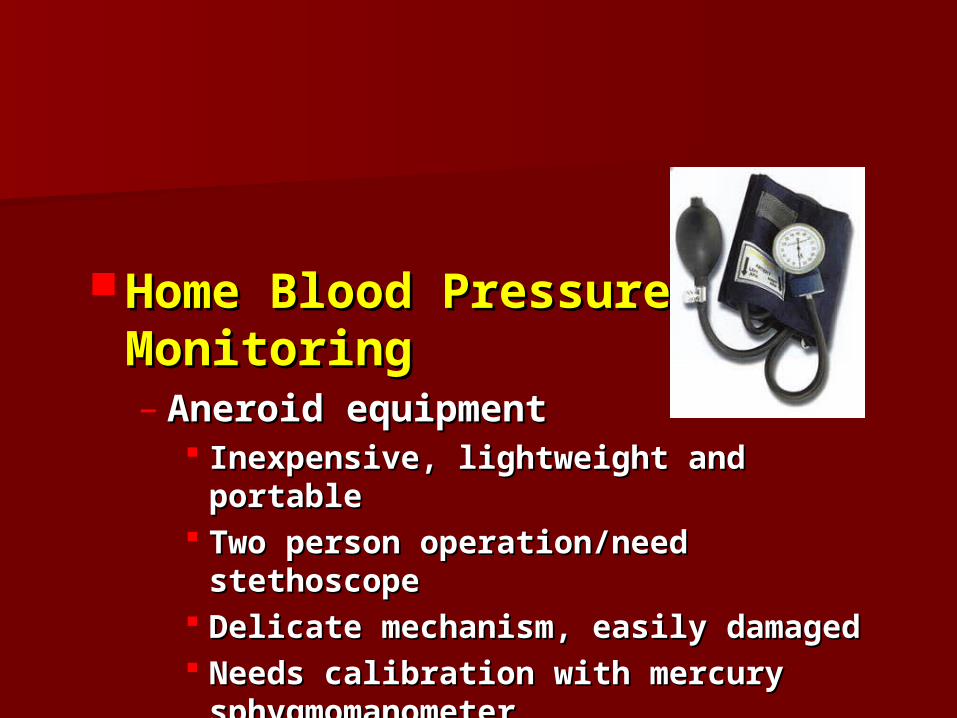
Home Blood Pressure Home Blood Pressure MonitoringMonitoring– Aneroid equipmentAneroid equipment
Inexpensive, lightweight and portableInexpensive, lightweight and portable Two person operation/need stethoscopeTwo person operation/need stethoscope Delicate mechanism, easily damagedDelicate mechanism, easily damaged Needs calibration with mercury Needs calibration with mercury
sphygmomanometersphygmomanometer
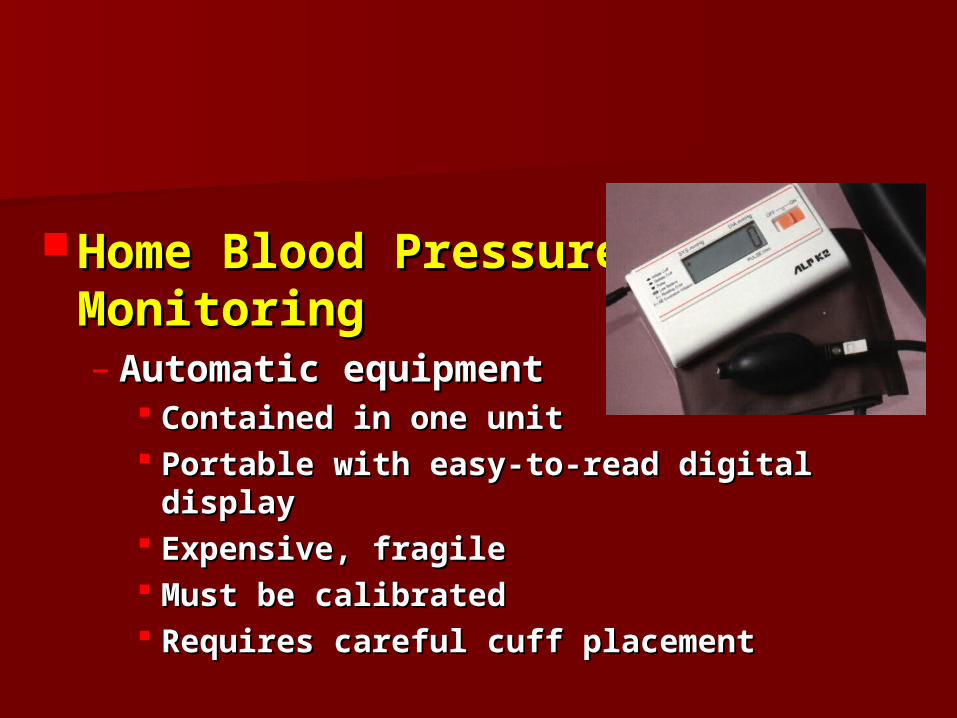
Home Blood Pressure Home Blood Pressure MonitoringMonitoring– Automatic equipmentAutomatic equipment
Contained in one unitContained in one unit Portable with easy-to-read digital displayPortable with easy-to-read digital display Expensive, fragileExpensive, fragile Must be calibratedMust be calibrated Requires careful cuff placementRequires careful cuff placement

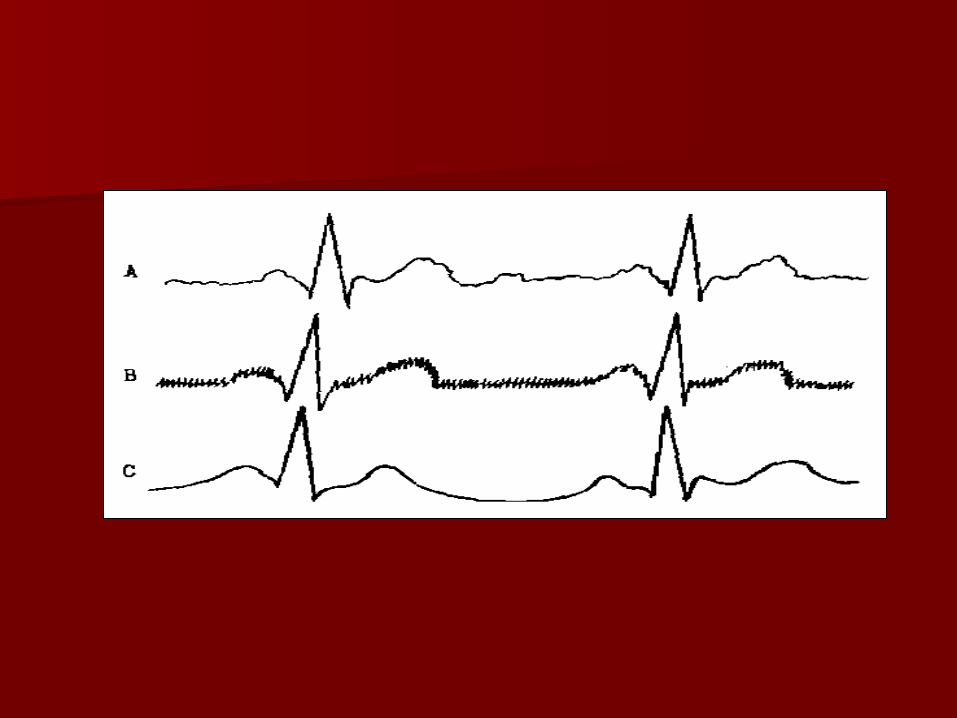
ElectrocardiogramElectrocardiogram
It is the method of registration of It is the method of registration of heart bioelectrical potential from the heart bioelectrical potential from the chest of patientchest of patient

Electro gram of cardiac Electro gram of cardiac musclemuscle
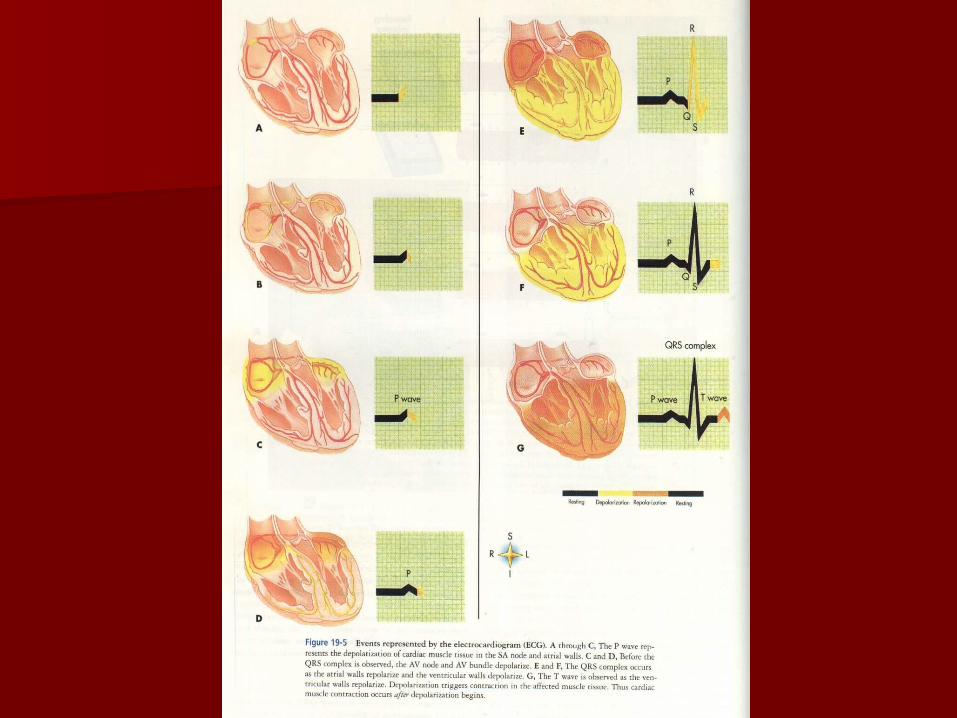

Waves of ECGWaves of ECG
1. P wave – depolarization of atria, 1. P wave – depolarization of atria, precedes atria systoleprecedes atria systole
2. QRS wave is depolarization of 2. QRS wave is depolarization of ventricles, precedes ventricular ventricles, precedes ventricular systolesystole
3. atria repolarization also occurs at 3. atria repolarization also occurs at QRSQRS
4. T wave indicates ventricular 4. T wave indicates ventricular repolarizationrepolarization

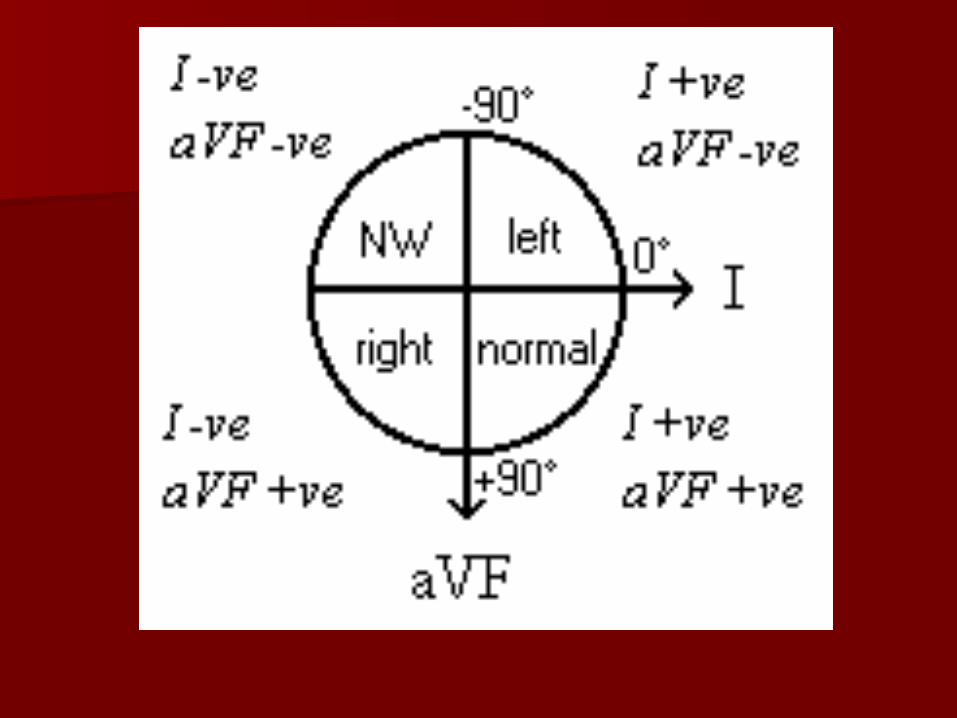
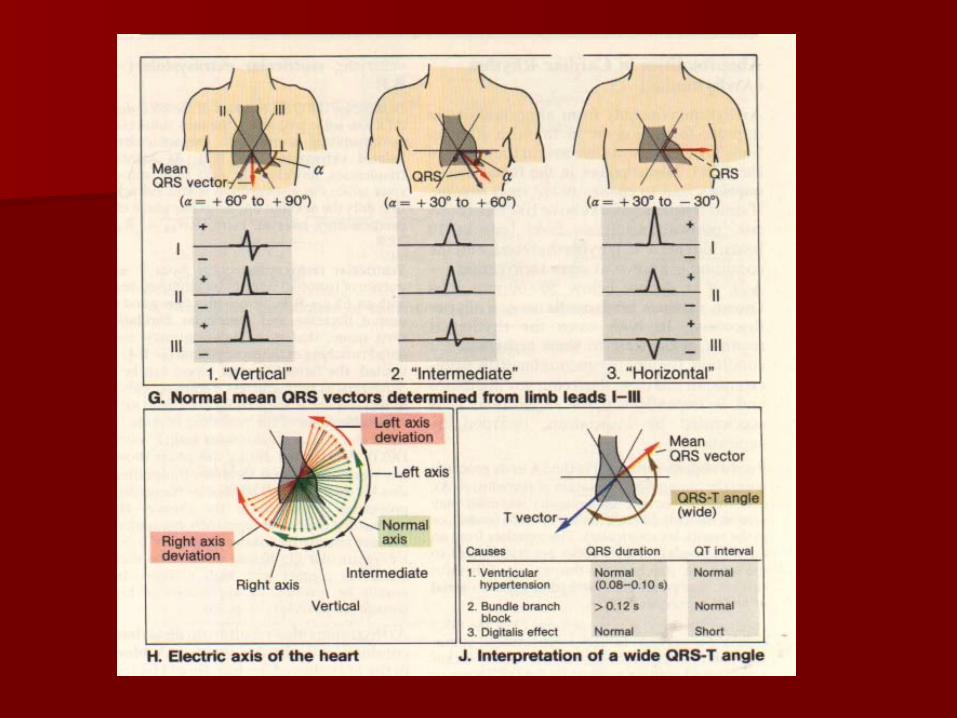
ECG leadsECG leads a) Bipolar limb leads. The bipolar limb leads a) Bipolar limb leads. The bipolar limb leads
record the voltage between electrodes record the voltage between electrodes placed on the wrists and legs. These leads placed on the wrists and legs. These leads were proposed by Einthoven in 1913.were proposed by Einthoven in 1913.
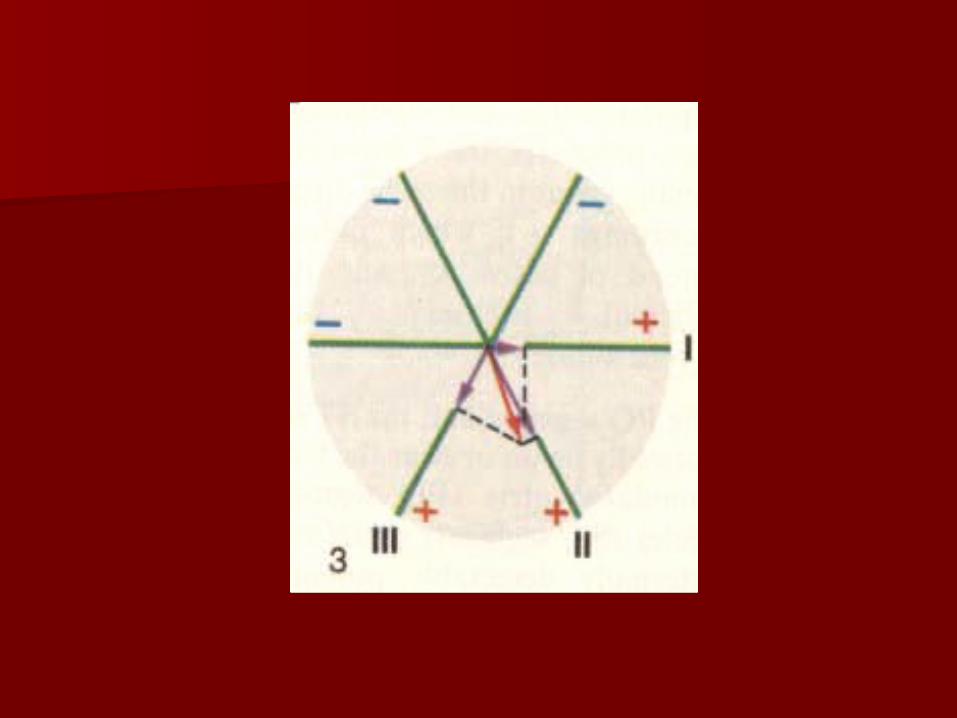
I lead: left arm (+) - right arm (-);I lead: left arm (+) - right arm (-); II lead: left leg (+) - right arm (-);II lead: left leg (+) - right arm (-); III lead: left arm (+) - left leg (-).III lead: left arm (+) - left leg (-). For recording limb leads we put red For recording limb leads we put red
electrode on right arm, yellow - on left arm, electrode on right arm, yellow - on left arm, green - on left leg and black - on right leg. green - on left leg and black - on right leg. Black electrode has zero potential (ground).Black electrode has zero potential (ground).


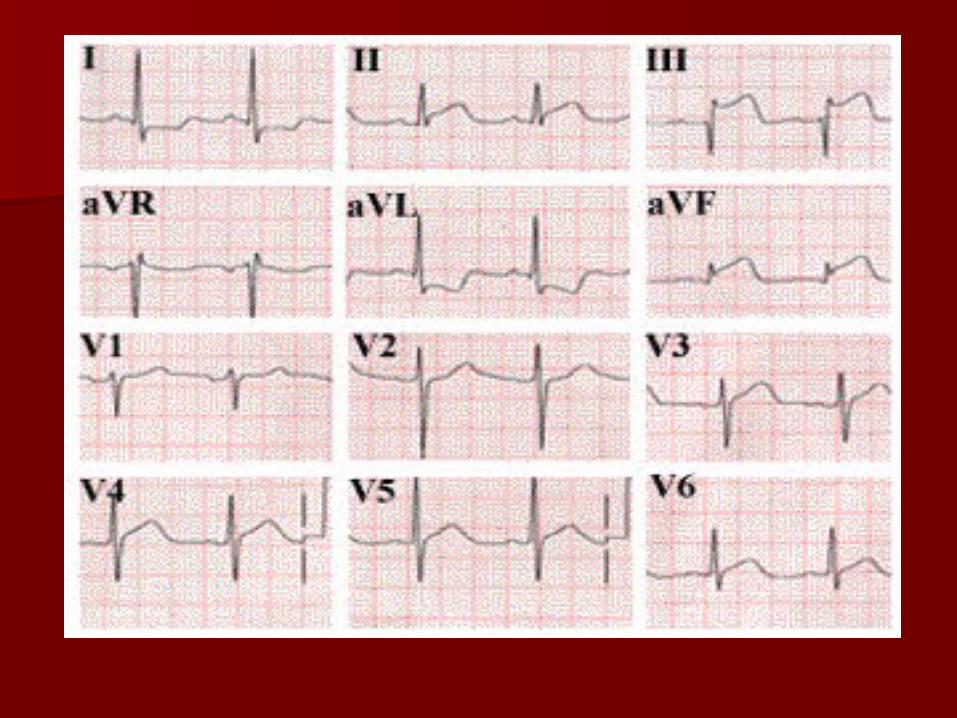
ECG leadsECG leads
The unipolar limb leads were proposed The unipolar limb leads were proposed by Goldberger in 1942. They record by Goldberger in 1942. They record voltage between single “exploratory voltage between single “exploratory electrode” fro one limb and zero joined electrode” fro one limb and zero joined electrode from two other limbs. So electrode from two other limbs. So there are three leads AVR, AVL, AVF. In there are three leads AVR, AVL, AVF. In fact zero electrodes records middle fact zero electrodes records middle voltage of two limbs. Bipolar limb leads voltage of two limbs. Bipolar limb leads and unipolar limb leads record and unipolar limb leads record electrical power in frontal projection.electrical power in frontal projection.


ECG leadsECG leads V1 - in crossing right IV right intercostal V1 - in crossing right IV right intercostal
space and parasternal line;space and parasternal line; V2 - in crossing left IV intercostal space V2 - in crossing left IV intercostal space
and parasternal line;and parasternal line; V3 - between V2 and V4;V3 - between V2 and V4; V4 - in crossing V left intercostal space V4 - in crossing V left intercostal space
and medioclavicular line;and medioclavicular line; V5 - in crossing V left intercostal space V5 - in crossing V left intercostal space
and anterior axilar line;and anterior axilar line; V6 - in crossing V left intercostal space V6 - in crossing V left intercostal space
and middle axilar line.and middle axilar line.


Holter Monitor Holter Monitor

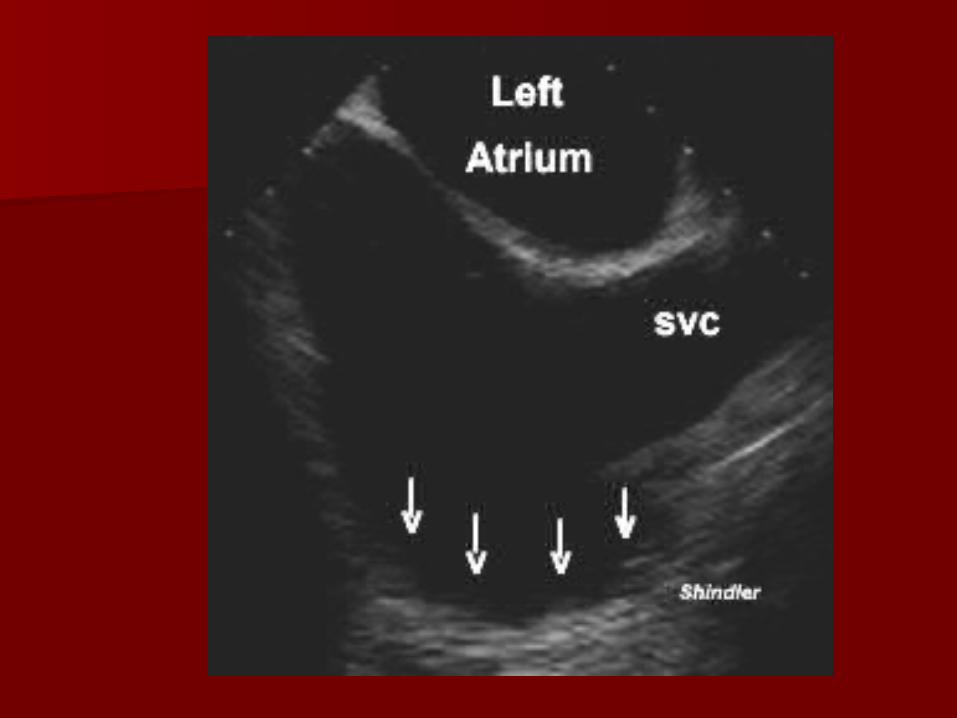
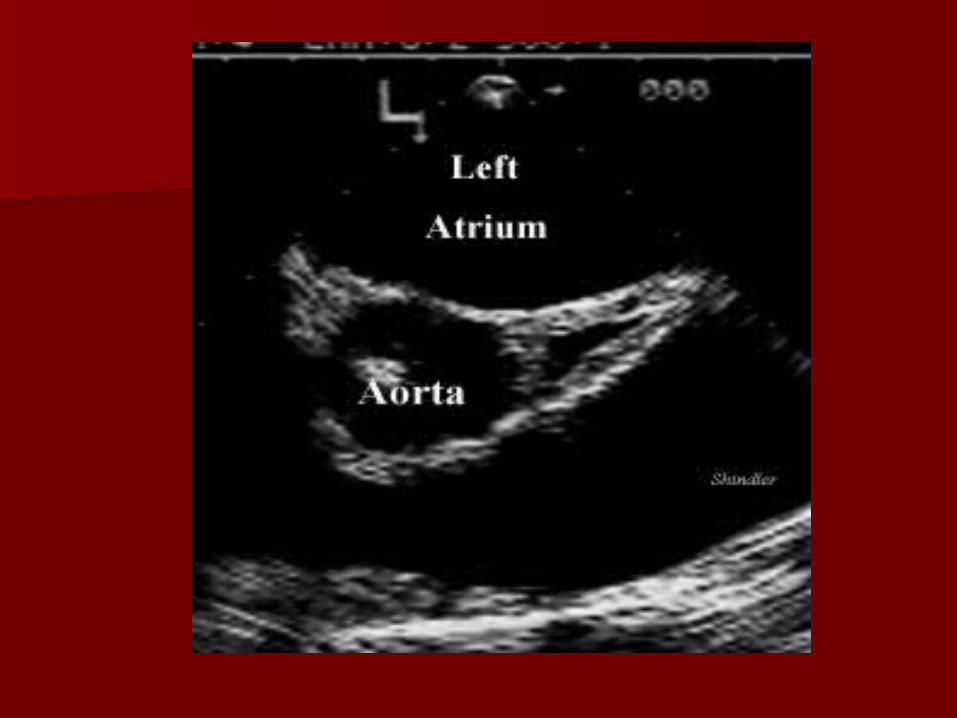
EchocardiographyEchocardiography
1. M-measure1. M-measure 2. D-measure2. D-measure 3. Doppler3. Doppler 4. Contrasting4. Contrasting

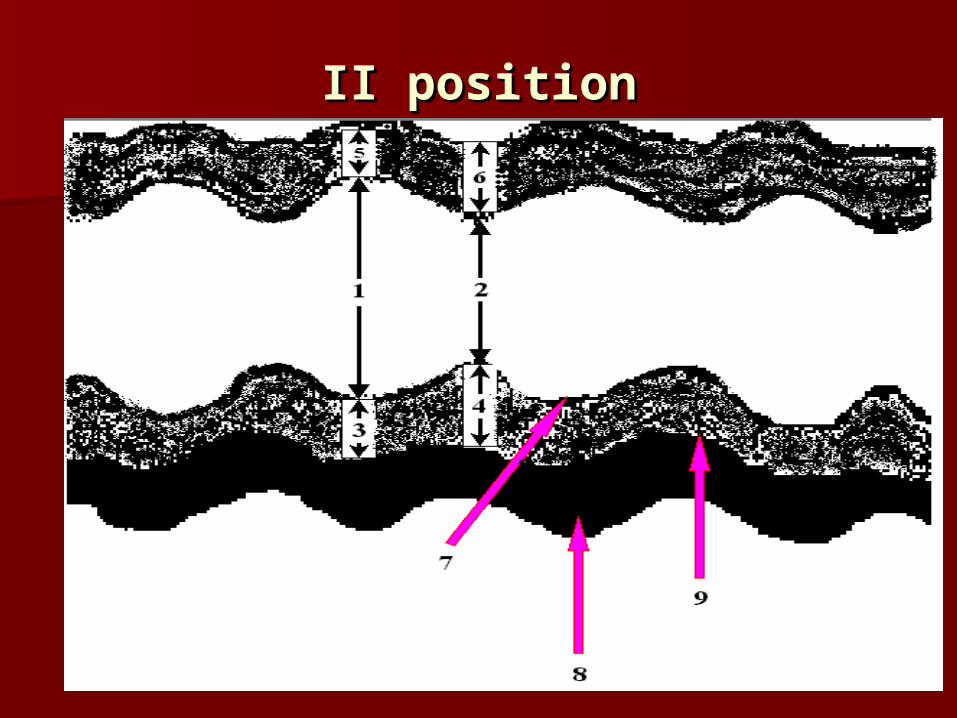
II positionII position

АО


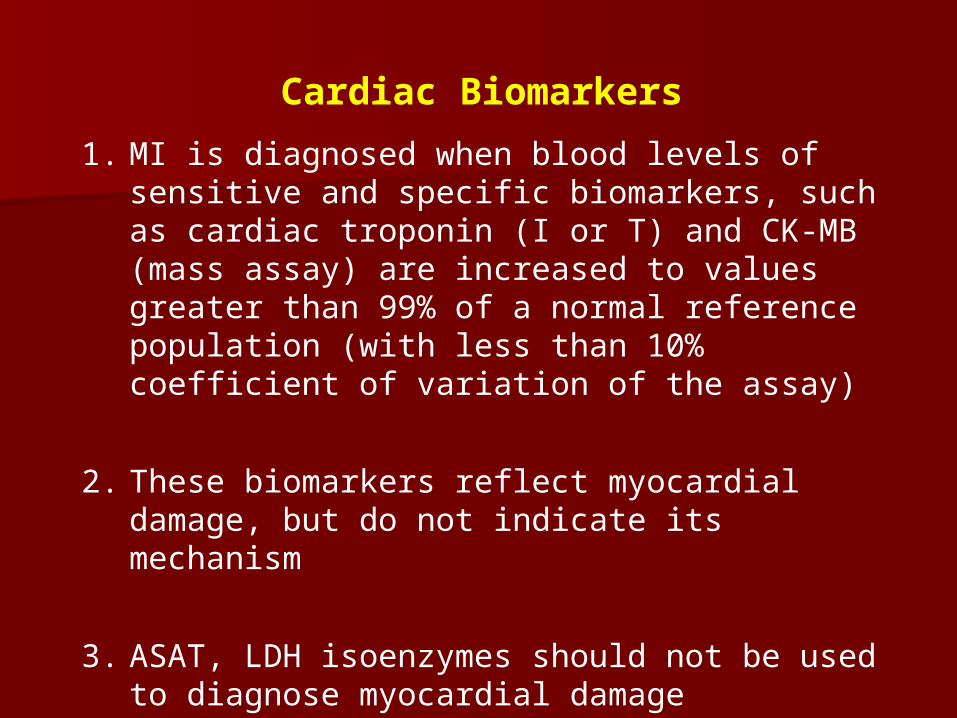
Cardiac Biomarkers
1. MI is diagnosed when blood levels of sensitive and specific biomarkers, such as cardiac troponin (I or T) and CK-MB (mass assay) are increased to values greater than 99% of a normal reference population (with less than 10% coefficient of variation of the assay)
2. These biomarkers reflect myocardial damage, but do not indicate its mechanism
3. ASAT, LDH isoenzymes should not be used to diagnose myocardial damage

c1183higgin05[1]video2.mpeg
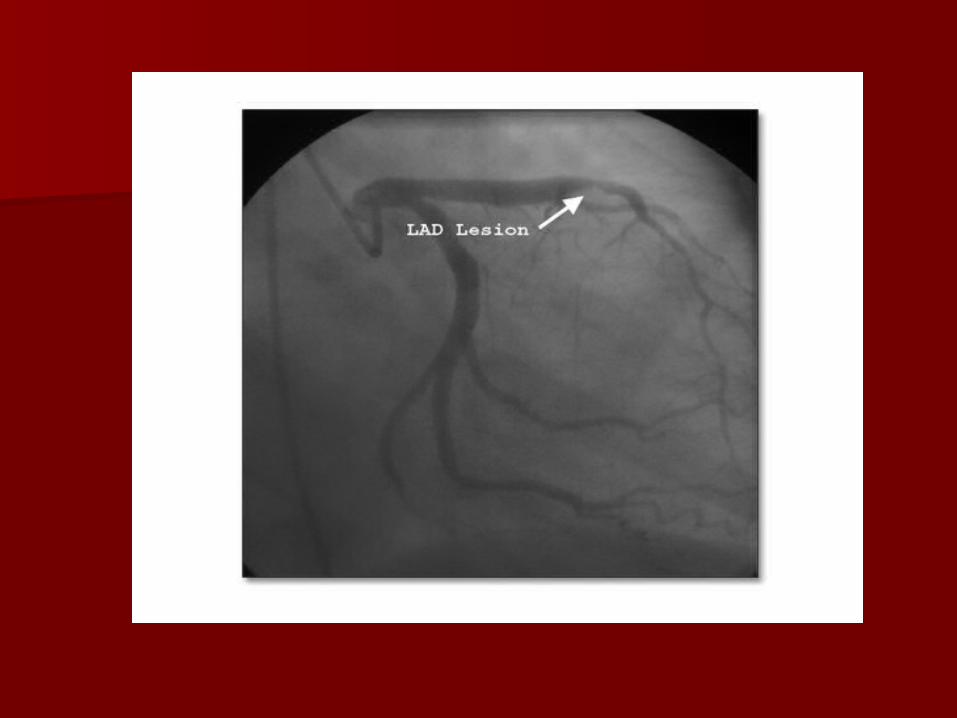


Roentgenogram
NORMAL MITRAL STENOSIS
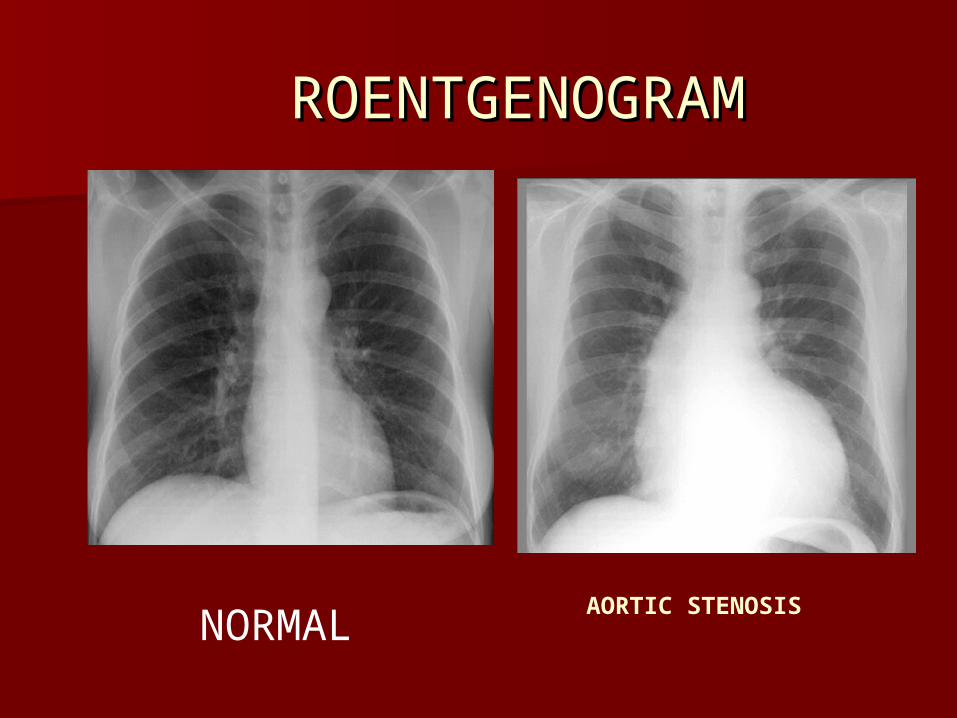
ROENTGENOGRAMROENTGENOGRAM
NORMALAORTIC STENOSIS

Thank you!Thank you!