clinical neurophysiology - cornell universityjdvicto/pdfs/gfvico11.pdf · after they were given the...
TRANSCRIPT
Determination of awareness in patients with severe brain injury using EEGpower spectral analysis
Andrew M. Goldfine a,b,!, Jonathan D. Victor a, Mary M. Conte a, Jonathan C. Bardin a, Nicholas D. Schiff aaDepartment of Neurology and Neuroscience, LC-803, Weill Cornell Medical College, 1300 York Ave., New York, NY 10065, USAbBurke Medical Research Institute, 785 Mamaroneck Ave., White Plains, NY 10605, USA
a r t i c l e i n f o
Article history:Accepted 16 March 2011Available online 21 April 2011
Keywords:ConsciousnessEEG spectral analysisMotor imageryTraumatic brain injuryLocked-in-stateMinimally conscious state
h i g h l i g h t s
! Motor and spatial imagery change EEG power spectra over a wide range of channels and frequencies.! Patterns of spectral change vary between healthy subjects performing the same task.! Brain injured subjects can demonstrate command following through changes in EEG power spectra.
a b s t r a c t
Objective: To determine whether EEG spectral analysis could be used to demonstrate awareness inpatients with severe brain injury.Methods: We recorded EEG from healthy controls and three patients with severe brain injury, rangingfrom minimally conscious state (MCS) to locked-in-state (LIS), while they were asked to imagine motorand spatial navigation tasks. We assessed EEG spectral differences from 4 to 24 Hz with univariate com-parisons (individual frequencies) and multivariate comparisons (patterns across the frequency range).Results: In controls, EEG spectral power differed at multiple frequency bands and channels during perfor-mance of both tasks compared to a resting baseline. As patterns of signal change were inconsistentbetween controls, we defined a positive response in patient subjects as consistent spectral changes acrosstask performances. One patient in MCS and one in LIS showed evidence of motor imagery task perfor-mance, though with patterns of spectral change different from the controls.Conclusions: EEG power spectral analysis demonstrates evidence for performance of mental imagerytasks in healthy controls and patients with severe brain injury.Significance: EEG power spectral analysis can be used as a flexible bedside tool to demonstrate awarenessin brain-injured patients who are otherwise unable to communicate.! 2011 International Federation of Clinical Neurophysiology. Published by Elsevier Ireland Ltd. All rights
reserved.
1. Introduction
Recent studies using functional MRI (fMRI) and event-relatedpotentials (ERP) demonstrate that some severely brain-injured pa-tients retain a range of cognitive capacities despite minimal or nobehavioral evidence of awareness (Kotchoubey et al., 2005; Owenet al., 2006; Perrin et al., 2006; Schnakers et al., 2008; Montiet al., 2010; Bardin et al., 2011). Importantly, Monti et al. (2010)used fMRI detection of motor and spatial navigation imagery to
establish communication with a patient who had no overt behav-ioral ability to communicate.
These results, while compelling, raise an important ethical obli-gation to seek out patients who may retain significant cognitiveabilities not evidenced by behavioral testing as in principle suchpatients may have a desire and capacity to participate in theirown decision-making (Fins and Schiff, 2010). Currently availablemethods are limited in the types of patients they can assess andin the paradigms available for determination of awareness. Forexample, fMRI cannot be used in patients who are unable to betransported to the scanner, have implanted ferromagnetic materialor make frequent head movements. The need to bring patients tothe scanner also makes repeated assessments difficult, and canoverlook evidence of awareness in patients whose arousal levelsfluctuate through the day (Bardin et al., 2011). ERPs, meanwhile,require exact and consistent timing of subject performance. Thislimits the range of applicable behavioral paradigms and risks false
1388-2457/$36.00 ! 2011 International Federation of Clinical Neurophysiology. Published by Elsevier Ireland Ltd. All rights reserved.doi:10.1016/j.clinph.2011.03.022
Abbreviations: FDR, false discovery rate; FLD, Fisher linear discriminant; HC,healthy control; HLM, Hjorth Laplacian montage; PS, patient subject; TGT, Chronuxtwo group test; TBI, traumatic brain injury.! Corresponding author at: Burke Medical Research Institute, 785 Mamaroneck
Ave., White Plains, NY 10605, USA. Tel.: +1 914 269 8454; fax: +1 866 212 1404.E-mail address: [email protected] (A.M. Goldfine).
Clinical Neurophysiology 122 (2011) 2157–2168
Contents lists available at ScienceDirect
Clinical Neurophysiology
journal homepage: www.elsevier .com/locate /c l inph
negative results in patients with delayed or variable responsetimes.
An alternative is a quantitative approach to EEG using powerspectral analysis. Unlike fMRI, EEG can be recorded at the bedside,allowing for multiple testing sessions across different states ofarousal. EEG measurements can be carried out in patients with fer-romagnetic implants, and the EEG signal can be parsed with a pre-cise temporal resolution, allowing for removal of transientmovement artifacts. Unlike ERP-based analysis methods, powerspectral analysis of EEG allows for detection of responses that aredelayed or not tightly synchronized to a stimulus. Finally, EEGpower spectral analysis has already been used as a communicationtool in patients with stroke and motor neuron disease (Bai et al.,2008) and therefore can in principle serve both as a diagnosticmethod and basis for development of a communication device.
With this motivation, we investigated whether spatially- andspectrally-localized changes in EEG power spectra can identifybehaviorally covert responses to commands in healthy subjectsand patients with severe brain injury.
2. Methods
2.1. Subjects
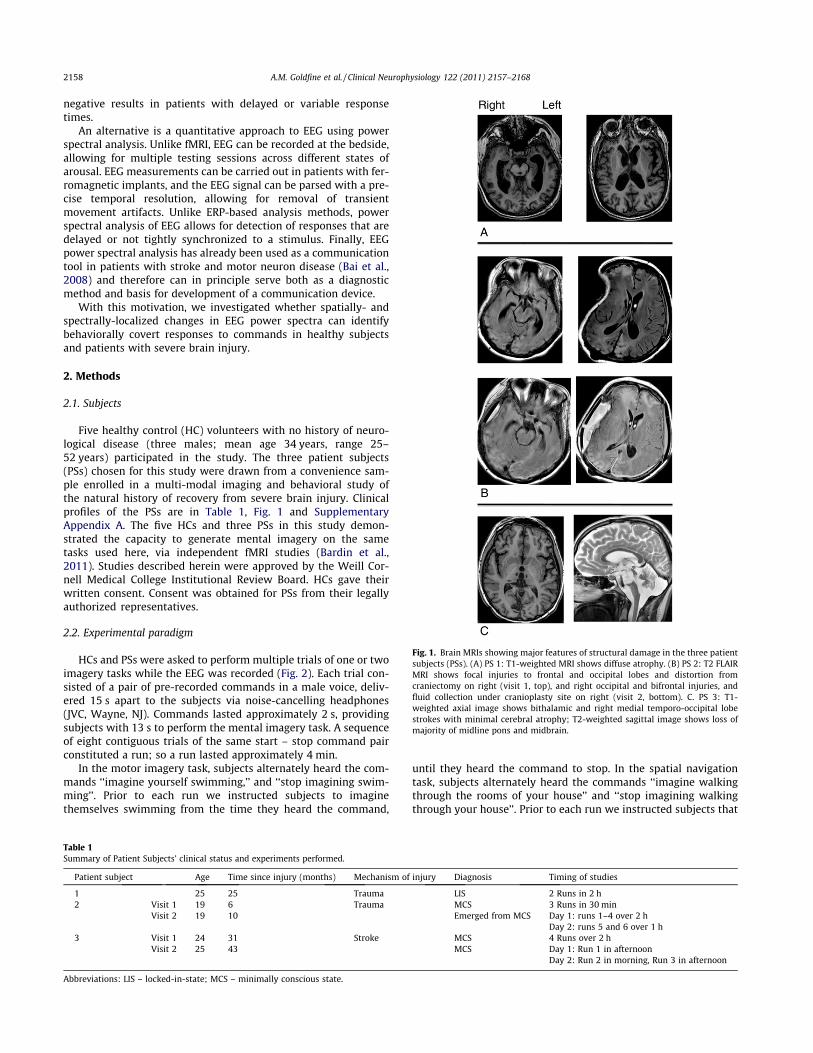
Five healthy control (HC) volunteers with no history of neuro-logical disease (three males; mean age 34 years, range 25–52 years) participated in the study. The three patient subjects(PSs) chosen for this study were drawn from a convenience sam-ple enrolled in a multi-modal imaging and behavioral study ofthe natural history of recovery from severe brain injury. Clinicalprofiles of the PSs are in Table 1, Fig. 1 and SupplementaryAppendix A. The five HCs and three PSs in this study demon-strated the capacity to generate mental imagery on the sametasks used here, via independent fMRI studies (Bardin et al.,2011). Studies described herein were approved by the Weill Cor-nell Medical College Institutional Review Board. HCs gave theirwritten consent. Consent was obtained for PSs from their legallyauthorized representatives.
2.2. Experimental paradigm
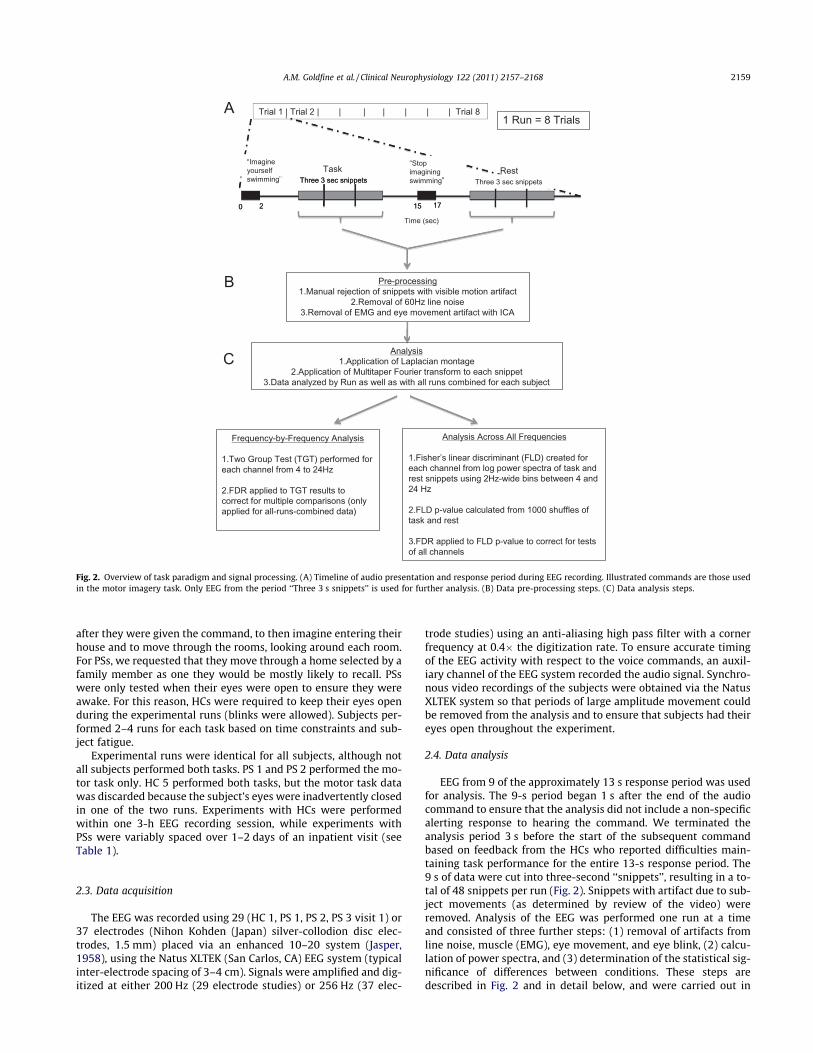
HCs and PSs were asked to perform multiple trials of one or twoimagery tasks while the EEG was recorded (Fig. 2). Each trial con-sisted of a pair of pre-recorded commands in a male voice, deliv-ered 15 s apart to the subjects via noise-cancelling headphones(JVC, Wayne, NJ). Commands lasted approximately 2 s, providingsubjects with 13 s to perform the mental imagery task. A sequenceof eight contiguous trials of the same start – stop command pairconstituted a run; so a run lasted approximately 4 min.
In the motor imagery task, subjects alternately heard the com-mands ‘‘imagine yourself swimming,’’ and ‘‘stop imagining swim-ming’’. Prior to each run we instructed subjects to imaginethemselves swimming from the time they heard the command,
until they heard the command to stop. In the spatial navigationtask, subjects alternately heard the commands ‘‘imagine walkingthrough the rooms of your house’’ and ‘‘stop imagining walkingthrough your house’’. Prior to each run we instructed subjects that
Table 1Summary of Patient Subjects’ clinical status and experiments performed.
Patient subject Age Time since injury (months) Mechanism of injury Diagnosis Timing of studies
1 25 25 Trauma LIS 2 Runs in 2 h2 Visit 1 19 6 Trauma MCS 3 Runs in 30 min
Visit 2 19 10 Emerged from MCS Day 1: runs 1–4 over 2 hDay 2: runs 5 and 6 over 1 h
3 Visit 1 24 31 Stroke MCS 4 Runs over 2 hVisit 2 25 43 MCS Day 1: Run 1 in afternoon
Day 2: Run 2 in morning, Run 3 in afternoon
Abbreviations: LIS – locked-in-state; MCS – minimally conscious state.
Fig. 1. Brain MRIs showing major features of structural damage in the three patientsubjects (PSs). (A) PS 1: T1-weighted MRI shows diffuse atrophy. (B) PS 2: T2 FLAIRMRI shows focal injuries to frontal and occipital lobes and distortion fromcraniectomy on right (visit 1, top), and right occipital and bifrontal injuries, andfluid collection under cranioplasty site on right (visit 2, bottom). C. PS 3: T1-weighted axial image shows bithalamic and right medial temporo-occipital lobestrokes with minimal cerebral atrophy; T2-weighted sagittal image shows loss ofmajority of midline pons and midbrain.
2158 A.M. Goldfine et al. / Clinical Neurophysiology 122 (2011) 2157–2168
after they were given the command, to then imagine entering theirhouse and to move through the rooms, looking around each room.For PSs, we requested that they move through a home selected by afamily member as one they would be mostly likely to recall. PSswere only tested when their eyes were open to ensure they wereawake. For this reason, HCs were required to keep their eyes openduring the experimental runs (blinks were allowed). Subjects per-formed 2–4 runs for each task based on time constraints and sub-ject fatigue.
Experimental runs were identical for all subjects, although notall subjects performed both tasks. PS 1 and PS 2 performed the mo-tor task only. HC 5 performed both tasks, but the motor task datawas discarded because the subject’s eyes were inadvertently closedin one of the two runs. Experiments with HCs were performedwithin one 3-h EEG recording session, while experiments withPSs were variably spaced over 1–2 days of an inpatient visit (seeTable 1).
2.3. Data acquisition
The EEG was recorded using 29 (HC 1, PS 1, PS 2, PS 3 visit 1) or37 electrodes (Nihon Kohden (Japan) silver-collodion disc elec-trodes, 1.5 mm) placed via an enhanced 10–20 system (Jasper,1958), using the Natus XLTEK (San Carlos, CA) EEG system (typicalinter-electrode spacing of 3–4 cm). Signals were amplified and dig-itized at either 200 Hz (29 electrode studies) or 256 Hz (37 elec-
trode studies) using an anti-aliasing high pass filter with a cornerfrequency at 0.4" the digitization rate. To ensure accurate timingof the EEG activity with respect to the voice commands, an auxil-iary channel of the EEG system recorded the audio signal. Synchro-nous video recordings of the subjects were obtained via the NatusXLTEK system so that periods of large amplitude movement couldbe removed from the analysis and to ensure that subjects had theireyes open throughout the experiment.
2.4. Data analysis
EEG from 9 of the approximately 13 s response period was usedfor analysis. The 9-s period began 1 s after the end of the audiocommand to ensure that the analysis did not include a non-specificalerting response to hearing the command. We terminated theanalysis period 3 s before the start of the subsequent commandbased on feedback from the HCs who reported difficulties main-taining task performance for the entire 13-s response period. The9 s of data were cut into three-second ‘‘snippets’’, resulting in a to-tal of 48 snippets per run (Fig. 2). Snippets with artifact due to sub-ject movements (as determined by review of the video) wereremoved. Analysis of the EEG was performed one run at a timeand consisted of three further steps: (1) removal of artifacts fromline noise, muscle (EMG), eye movement, and eye blink, (2) calcu-lation of power spectra, and (3) determination of the statistical sig-nificance of differences between conditions. These steps aredescribed in Fig. 2 and in detail below, and were carried out in
1 Run = 8 TrialsA
Pre-processing1.Manual rejection of snippets with visible motion artifact
2.Removal of 60Hz line noise3.Removal of EMG and eye movement artifact with ICA
B
C
Time (sec)
Analysis1.Application of Laplacian montage
2.Application of Multitaper Fourier transform to each snippet3.Data analyzed by Run as well as with all runs combined for each subject
Frequency-by-Frequency Analysis
1.Two Group Test (TGT) performed for each channel from 4 to 24Hz
2.FDR applied to TGT results to correct for multiple comparisons (only applied for all-runs-combined data)
Analysis Across All Frequencies
1.Fisher’s linear discriminant (FLD) created for each channel from log power spectra of task and rest snippets using 2Hz-wide bins between 4 and 24 Hz
2.FLD p-value calculated from 1000 shuffles of task and rest
3.FDR applied to FLD p-value to correct for tests of all channels
Trial 1 | Trial 2 | | | | | | | Trial 8
RestThree 3 sec snippets
Task
0 2 15 17
Imagine yourself swimming
Stop imagining swimmingThree 3 sec snippets
0 2 15 17
Three 3 sec snippets
Fig. 2. Overview of task paradigm and signal processing. (A) Timeline of audio presentation and response period during EEG recording. Illustrated commands are those usedin the motor imagery task. Only EEG from the period ‘‘Three 3 s snippets’’ is used for further analysis. (B) Data pre-processing steps. (C) Data analysis steps.
A.M. Goldfine et al. / Clinical Neurophysiology 122 (2011) 2157–2168 2159
Matlab (The Mathworks, Natick, MA) using in-house software ex-cept where noted.
2.5. Artifact removal
To remove 60 Hz line noise, we applied a frequency-domainregression based on Thomson’s F-test, (Thomson, 1982; Percivaland Walden, 1993) implemented by the code rmlinesc from theChronux toolbox (Mitra and Bokil, 2007, http://www.chronux.org).To remove muscle, eye movement and eye blink artifact, we usedindependent components analysis (ICA), as implemented by EEG-LAB’s runica tool (Delorme andMakeig, 2004, http://www.sccn.ucsd.edu/eeglab/). To improve ICA performance and eliminate low-frequency artifacts due to movement, sweat, and other sources, weapplied a 1 Hz high pass filter prior to the ICA, as implemented byEEGLAB’s infinite impulse response (IIR) filter plug-in. We used themethods described in McMenamin et al. (2010) to identify and re-move ‘‘myogenic’’ ICA components, as well as those representingblinks and large amplitude eyemovements. Components containingan apparentmixture of ‘‘myogenic’’ and ‘‘neurogenic’’ activity (as de-fined by McMenamin et al. (2010)) were not removed to avoidremoving signal of interest. EMG artifact from microsaccades likelyhadminimal effect on these data, as therewas no requirement for vi-sual fixation, the Laplacianmontage filtered these signals out ofmostchannels, and spectral changes were only analyzed to 24 Hz whilethe power from this artifact type occurs from 20 to 80 Hz (Schwartz-man and Kranczioch, 2011). ICA artifact rejection, across all subjects,led to removal of 20–94% of the variance (see Supplementary TableS1). The fraction of variance removed generally correlated withamount of artifact in the recordings as assessed by visual inspectionof the EEG.
2.6. Laplacian montage
After artifact removal, EEG signals were converted to the HjorthLaplacian montage (HLM) as a step to improve source localization(Hjorth, 1975). To make this conversion, we calculated the differ-ence between the voltages at each individual electrode placementand the weighted average (at the same time point) of the voltagesat the surrounding electrodes (four nearest neighbors for elec-trodes on the interior of the array; three for electrodes on theedge). The weight attributed to each electrode was the reciprocalof the distance to the central electrode, measured as arc lengthon an assumed spherical head (Hjorth, 1980; Thickbroom et al.,1984).
2.7. Power spectral density
We calculated power spectral density for each HLM channelseparately for each three-second snippet, using Thomson’s multi-taper method (Thomson, 1982; Percival and Walden, 1993; Mitraand Pesaran, 1999), as implemented by the code mtspectrumc inthe Chronux toolbox (Mitra and Bokil, 2007, http://www.chron-ux.org). We used five tapers, resulting in a frequency resolutionof 2 Hz and estimates spaced 1/3 Hz apart. Further analysis was re-stricted to the frequency range of 4–24 Hz, to avoid overlap withfrequencies typically contaminated with artifact (eye movementbelow 4 Hz and muscle above 24 Hz) (Shackman et al., 2010).Power spectral changes in the analyzed range are known to corre-late with actual and imagined motor and spatial imagery task per-formance in healthy subjects (Pfurtscheller and Lopes da Silva,1999; Hung et al., 2005; Li et al., 2009) and, when localized, overlapwith cortical areas activated in fMRI (Yuan et al., 2010). Examplespectra averaged across a run can be seen in Fig. 3A.
2.8. Statistical analyses
We used two complementary methods to determine the signif-icance of differences in the frequency content of the EEG signalbetween the task and rest conditions: a univariate (frequency-by-frequency) approach and a multivariate approach. For eachsubject, both analyses were applied on a channel-by-channel basisto each run individually and to all runs combined.
For the univariate approach, we used a z-statistic, the TwoGroupTest (TGT) (Bokil et al., 2007), as implemented by the Chronux tool-box routine, two_group_test_spectrum (http://www.chronux.org), with a cutoff of p 6 0.05 by jackknifemethod. Because spectralestimates within 2 Hz of each other are correlated by the taperfunctions, a difference identified by the TGT was only consideredsignificant if it was present for all frequencies contiguously over arange greater than 2 Hz. This implies significance over at leasttwo neighboring but non-overlapping windows of the multi-taperestimate and is indicated in figures with a rectangle drawn aroundthe results (Fig. 3B). Spectral differences over ranges narrower than2 Hz represent only a trend to significance. To compensate formultiple comparisons (60 frequencies per channel in 29 or 37channels), the False Discovery Rate (FDR) (Benjamini and Hochberg,1995; Benjamini and Yekutieli, 2001) was applied to the TGTp-values determined from analyses of all runs combined.
To look for spectral differences that might only be apparent ifcombinations of frequencies are considered, we employed a multi-variate approach, Fisher’s linear discriminant (FLD) (Fisher, 1936).This approachhas beenused successfully for classification of EEG re-sponses tomotor imagery (Hung et al., 2005; Bai et al., 2007). To lim-it dimensionality, we binned the log spectra from 4 to 24 Hz into2 Hz windows, reducing the spectrum to 10 values. The FLD wasthen defined as the linear combination of these quantities thatmax-imized the ratio of the power variance between the conditions to thepower variancewithin the conditions. To determine the significanceof the FLD, we used a shuffle method: we recomputed the FLD from1000 shuffles of the two conditions, and determined the p-value asthe fraction of shuffled datasets that yielded an equal or larger valueto the actual FLD. To take into account the possibility that neighbor-ing snippets had similar spectra because of a slowly changingunder-lying brain state (rather than the task) (Menzer et al., 2010), theshuffled datasets kept the snippets from the nine-second-responseperiod after each command together during all shuffles. To controlfor multiple comparisons (since the FLD was applied separately toeach channel), the FLD p-value was only considered significant fora channel if it was less than an FDR-corrected rate of 0.05. This isshown as an asterisk on the summary figures (e.g. channel Oz inFig. 3B). For each subject, this analysis was applied to each run indi-vidually, and to all runs combined.
2.9. Overall outcome measures
As our imagery tasks had no observable behavioral measures ofperformance, we used the responses of the HCs to develop out-come measures to apply to the PSs, with the explicit assumptionthat the HCs performed the task. Based on HC results (Section3.1), we chose to use the TGT for the primary outcome measure.Furthermore, we chose within-subject between-run consistencyof spectral changes as our primary outcome measure in PSs, ratherthan a specific ‘‘template’’ of changes, for two reasons. First,although the data showed consistent and statistically significanttask-related changes within each HC, it showed notable variationsin the pattern of these changes between HCs, both in scalp locationand frequency. Second, this strategy allows for the possibility thatPSs’ brain injuries resulted in spectral changes different from HCs.We codified the definition of a positive response in PSs into twooverall outcome measures: an inclusive measure (outcome
2160 A.M. Goldfine et al. / Clinical Neurophysiology 122 (2011) 2157–2168
measure 1) that could detect responses that were only present in asubset of runs; and a strict measure (outcome measure 2) that re-quires consistency across all runs.
Outcome measure 1 – a positive finding required that one runhad a channel with a significant TGT result (contiguous over great-er than a 2 Hz range as described above), and a second run showedat least a trend towards a significant TGT result in the same chan-nel and within the same frequency range. Considered in isolation,outcome measure 1 was subject to false positive results as therewas no correction for multiple comparisons.
Outcome measure 2 – a positive finding required that when allruns were combined, at least one of the individual spectral differ-ences identified by the TGT remained significant after FDR correc-tion (0.05) for all frequencies and channels tested.
Overall results were designated ‘‘positive’’ if outcome measures1 and 2 were met, ‘‘indeterminate’’ when only outcome measure 1was met, and negative otherwise. The reason to retain the ‘‘inde-terminate’’ designation was that PSs may indeed have had fluctu-ating levels of awareness and performance. Thus, if EEG powerchanges were seen on some runs but not others, we simply couldnot determine whether the changes were merely a statistical arti-fact from the multiple comparisons, or in fact reflected thesefluctuations.
3. Results
3.1. Healthy controls
We begin by stepping through the detailed analysis of two HCsperforming the motor imagery task. We then summarize the
findings across all HCs on both the motor and the navigation imag-ery tasks. In all comparisons shown below, we describe increasesor decreases in power of the EEG spectrum as task relative to a rest(stop imagining) condition.
3.2. Motor imagery task (imagination of swimming)
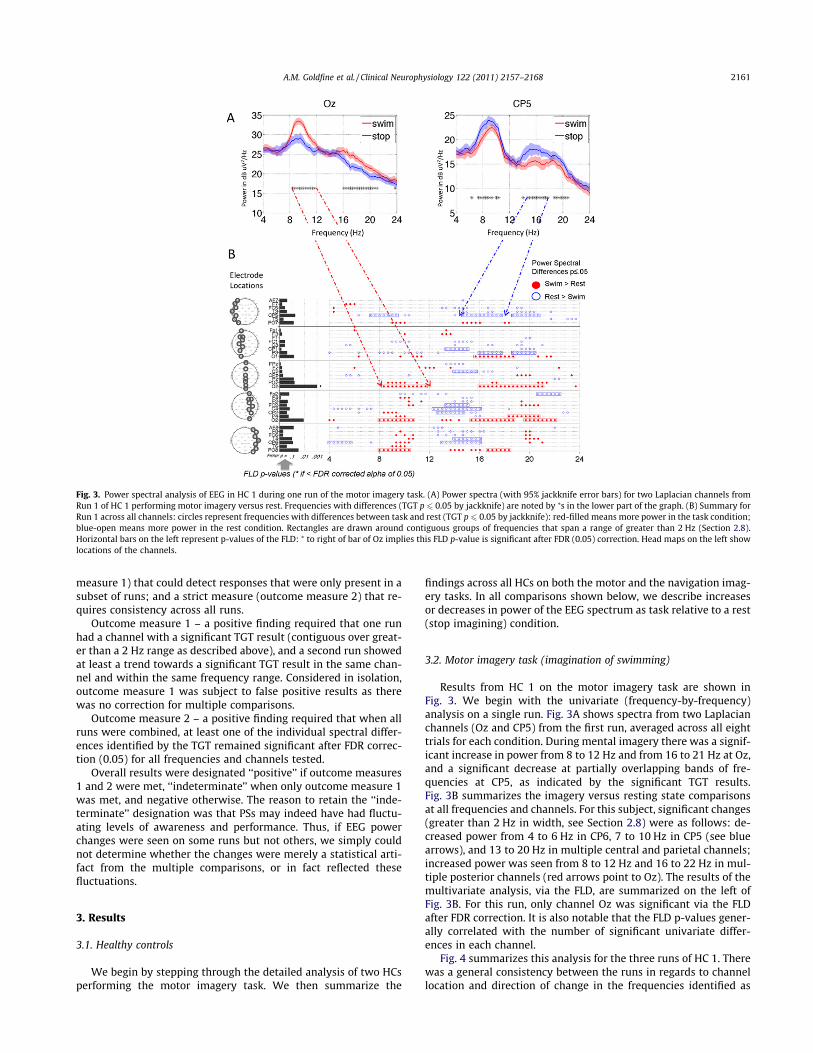
Results from HC 1 on the motor imagery task are shown inFig. 3. We begin with the univariate (frequency-by-frequency)analysis on a single run. Fig. 3A shows spectra from two Laplacianchannels (Oz and CP5) from the first run, averaged across all eighttrials for each condition. During mental imagery there was a signif-icant increase in power from 8 to 12 Hz and from 16 to 21 Hz at Oz,and a significant decrease at partially overlapping bands of fre-quencies at CP5, as indicated by the significant TGT results.Fig. 3B summarizes the imagery versus resting state comparisonsat all frequencies and channels. For this subject, significant changes(greater than 2 Hz in width, see Section 2.8) were as follows: de-creased power from 4 to 6 Hz in CP6, 7 to 10 Hz in CP5 (see bluearrows), and 13 to 20 Hz in multiple central and parietal channels;increased power was seen from 8 to 12 Hz and 16 to 22 Hz in mul-tiple posterior channels (red arrows point to Oz). The results of themultivariate analysis, via the FLD, are summarized on the left ofFig. 3B. For this run, only channel Oz was significant via the FLDafter FDR correction. It is also notable that the FLD p-values gener-ally correlated with the number of significant univariate differ-ences in each channel.
Fig. 4 summarizes this analysis for the three runs of HC 1. Therewas a general consistency between the runs in regards to channellocation and direction of change in the frequencies identified as
Fig. 3. Power spectral analysis of EEG in HC 1 during one run of the motor imagery task. (A) Power spectra (with 95% jackknife error bars) for two Laplacian channels fromRun 1 of HC 1 performing motor imagery versus rest. Frequencies with differences (TGT p 6 0.05 by jackknife) are noted by ⁄s in the lower part of the graph. (B) Summary forRun 1 across all channels: circles represent frequencies with differences between task and rest (TGT p 6 0.05 by jackknife): red-filled means more power in the task condition;blue-open means more power in the rest condition. Rectangles are drawn around contiguous groups of frequencies that span a range of greater than 2 Hz (Section 2.8).Horizontal bars on the left represent p-values of the FLD: ⁄ to right of bar of Oz implies this FLD p-value is significant after FDR (0.05) correction. Head maps on the left showlocations of the channels.
A.M. Goldfine et al. / Clinical Neurophysiology 122 (2011) 2157–2168 2161
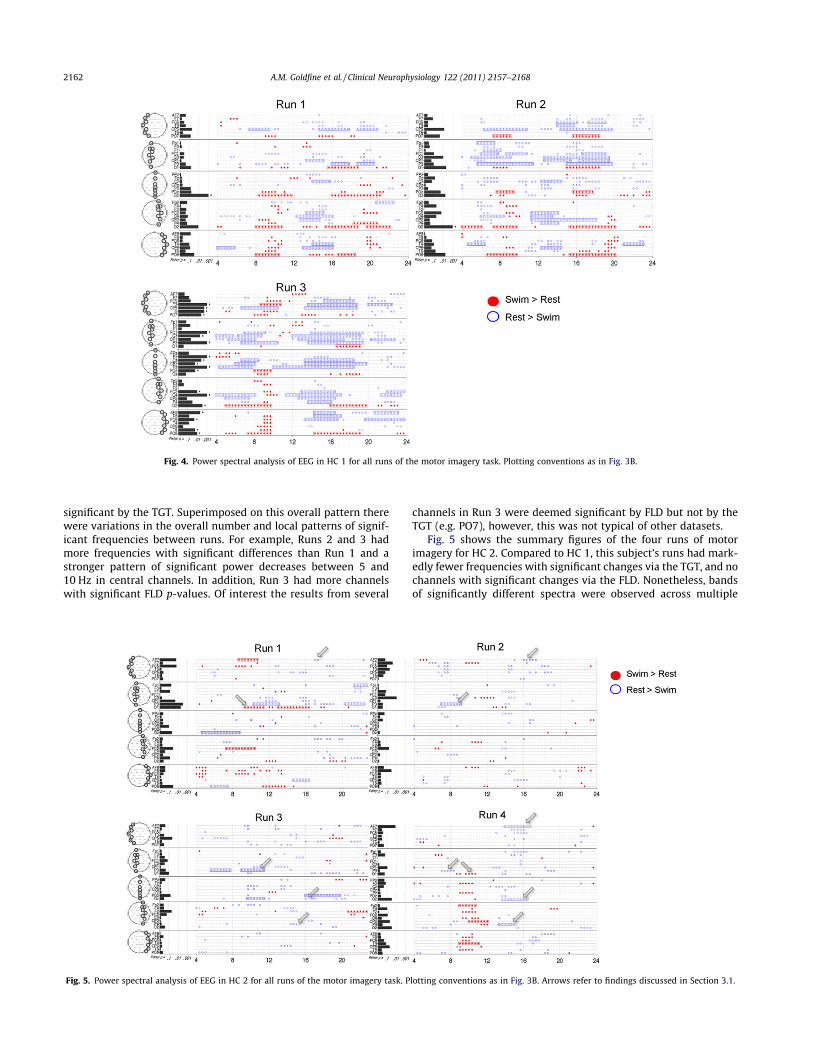
significant by the TGT. Superimposed on this overall pattern therewere variations in the overall number and local patterns of signif-icant frequencies between runs. For example, Runs 2 and 3 hadmore frequencies with significant differences than Run 1 and astronger pattern of significant power decreases between 5 and10 Hz in central channels. In addition, Run 3 had more channelswith significant FLD p-values. Of interest the results from several
channels in Run 3 were deemed significant by FLD but not by theTGT (e.g. PO7), however, this was not typical of other datasets.
Fig. 5 shows the summary figures of the four runs of motorimagery for HC 2. Compared to HC 1, this subject’s runs had mark-edly fewer frequencies with significant changes via the TGT, and nochannels with significant changes via the FLD. Nonetheless, bandsof significantly different spectra were observed across multiple
Fig. 4. Power spectral analysis of EEG in HC 1 for all runs of the motor imagery task. Plotting conventions as in Fig. 3B.
Fig. 5. Power spectral analysis of EEG in HC 2 for all runs of the motor imagery task. Plotting conventions as in Fig. 3B. Arrows refer to findings discussed in Section 3.1.
2162 A.M. Goldfine et al. / Clinical Neurophysiology 122 (2011) 2157–2168

runs in the same channel and frequency range. Increased powerwas seen during imagery from 9 to 11 Hz in O1 (significant inRun 1, trend in Run 4). Decreased power was seen from: 6 to9 Hz in P3 (significant in Runs 2 and 3, trend in Run 4); 14 to17 Hz in AF7 (significant in Run 4, trend in Runs 1 and 2); 13to 15 Hz in P4 (significant in Run 4, trend in Run 3); and 14to 17 Hz in Oz (significant in Run 4, trend in Run 3). For clarity,arrows in Fig. 5 indicate the findings. Of note, compared to HC 1,this subject had significantly more muscle artifact in all runs, withan average of 72% of the variance removed by ICA versus 32% of thevariance removed for HC 1 (Supplementary Table S1).
Results from HCs 3 and 4 (Supplementary Figs. S1 and S2) wereintermediate to HCs 1 and 2, both in terms of number of significantchanges identified by TGT and FLD on each run, as well as consis-tency between runs. In both subjects, the univariate analysis viathe TGT identified significant changes that were consistent acrossall runs, and additional changes that were consistent across sub-sets of runs. Results of the multivariate analysis via the FLD gener-ally agreed with the TGT and only rarely identified significantchanges at a channel at which no change was determined by theTGT. Supporting the finding in HC 2 of artifact impeding visualiza-tion of signal change, HC 4, across runs, demonstrated an inversecorrelation between number of significant changes and percentageof variance removed (variance removed was: 61% Run 1, 48% Run2, and 19% Run 3). This was also observed to a lesser degree inother subjects (variance removed reported in Supplementary TableS1).
To identify the overall patterns of EEG change and compareacross subjects we carried out the above analyses for each HC afteraveraging all runs of the motor imagery task for each subject(Fig. 6). There was a clear pattern of signal change for each HCalong with evidence of both commonalities and individual varia-tions across HCs. In all HCs, we observed a decrease in power inthe 6 to 9 Hz and 13 to 18 Hz ranges, predominantly in the central
and parietal EEG channels. Findings common to subsets of HCswere: increased power from 9 to 11 Hz in HC 1 (posterior chan-nels), HC 2 (temporal channels), and HC 4 (diffusely); increasedpower from 16 to 20 Hz in HCs 1 and 4 in posterior channels;and decreased power from 21 to 24 Hz in HCs 1 and 4 (whereasHC 3 demonstrated increased power in this range). To assess out-come measure 2, we applied FDR correction for multiple compari-sons to all the TGT p-values across all channels, and foundsignificant results in all subjects. Of the results displayed, the per-centage that remained significant after FDR correction were: HC 1– 77%, HC 2 – 3%, HC 3 – 74%, HC 4 – 36%. The all-runs-averageddata from HCs 1, 3 and 4 also demonstrated channels with signif-icant FLD.
3.3. Navigation task (imagination of walking around one’s house)
For the navigation imagery task, we also found that HCs showedsignificant task-related modulation of the EEG, with some findingsat consistent channels and frequency bands across runs. Individualsubject results are presented in Supplementary Figs. S3–S7. In con-trast to the motor imagery task, when data from each HC wereaveraged over all of their runs (Fig. 7), there was no change thatwas consistent across all HCs, although some changes were consis-tent across subsets of HCs. These include: decreased power duringnavigation imagery from 6 to 9 Hz in central and parietal channels(HCs 2, 3, 4 and 5); increased power from 9 to 11 Hz diffusely (HCs1 and 4) and posteriorly in HC 3 (also seen weakly around 12 Hzonly in HC 5); decreased power from 12 to 17 Hz centrally (HCs1, 2 and 3); increased power 16 to 20 Hz in posterior channels(HCs 1, 3 and 4); and decreased power from 18 to 24 Hz centrally(HCs 2 and 5 and one channel in HC 1; HC 3 shows increased powerin this range). For outcome measure 2, the percentages of signifi-cant TGT results that remained significant after FDR correctionfor each subject were: HC 1 – 69%, HC 2 – 21%, HC 3 – 75%, HC 4
Fig. 6. Power spectral analysis of EEG for each HC, for all runs of the motor imagery task combined within each subject. Plotting conventions for the upper section of eachpanel as in Fig. 3B; lower sections indicate differences in log power (task minus baseline) at selected frequencies. Headmaps rendered via EEGLAB’s ‘‘topoplot’’ command(http://www.sccn.ucsd.edu/eeglab).
A.M. Goldfine et al. / Clinical Neurophysiology 122 (2011) 2157–2168 2163
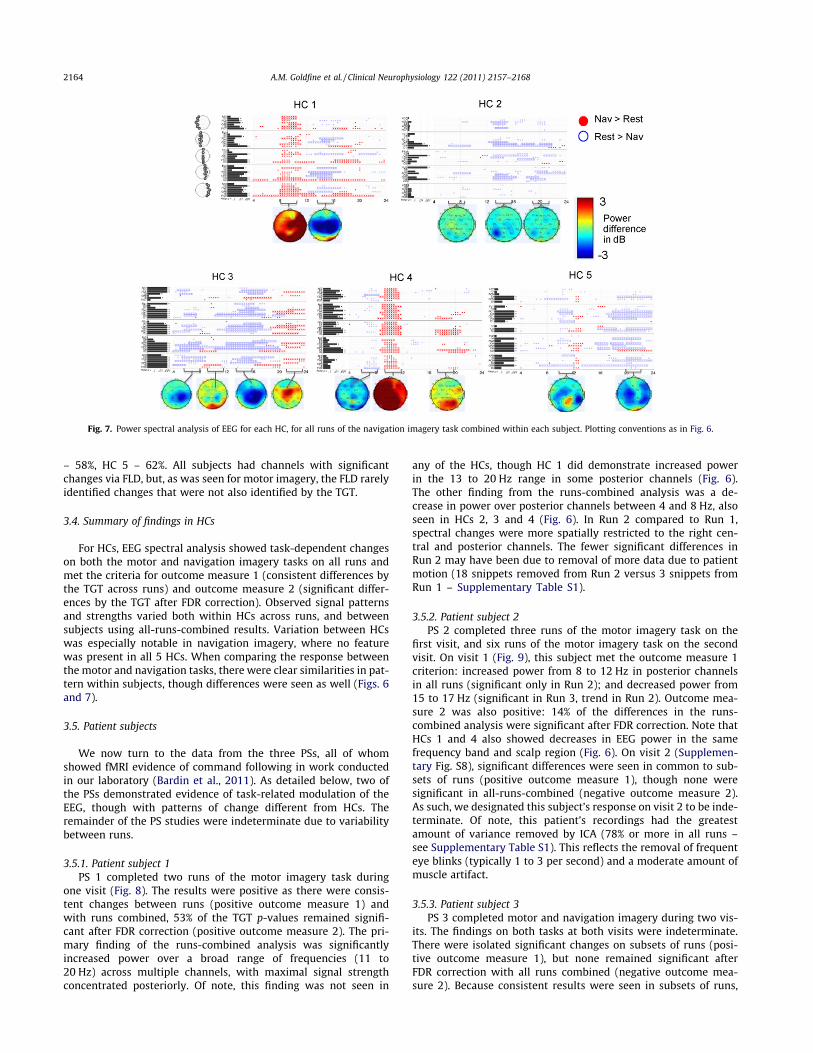
– 58%, HC 5 – 62%. All subjects had channels with significantchanges via FLD, but, as was seen for motor imagery, the FLD rarelyidentified changes that were not also identified by the TGT.
3.4. Summary of findings in HCs
For HCs, EEG spectral analysis showed task-dependent changeson both the motor and navigation imagery tasks on all runs andmet the criteria for outcome measure 1 (consistent differences bythe TGT across runs) and outcome measure 2 (significant differ-ences by the TGT after FDR correction). Observed signal patternsand strengths varied both within HCs across runs, and betweensubjects using all-runs-combined results. Variation between HCswas especially notable in navigation imagery, where no featurewas present in all 5 HCs. When comparing the response betweenthe motor and navigation tasks, there were clear similarities in pat-tern within subjects, though differences were seen as well (Figs. 6and 7).
3.5. Patient subjects
We now turn to the data from the three PSs, all of whomshowed fMRI evidence of command following in work conductedin our laboratory (Bardin et al., 2011). As detailed below, two ofthe PSs demonstrated evidence of task-related modulation of theEEG, though with patterns of change different from HCs. Theremainder of the PS studies were indeterminate due to variabilitybetween runs.
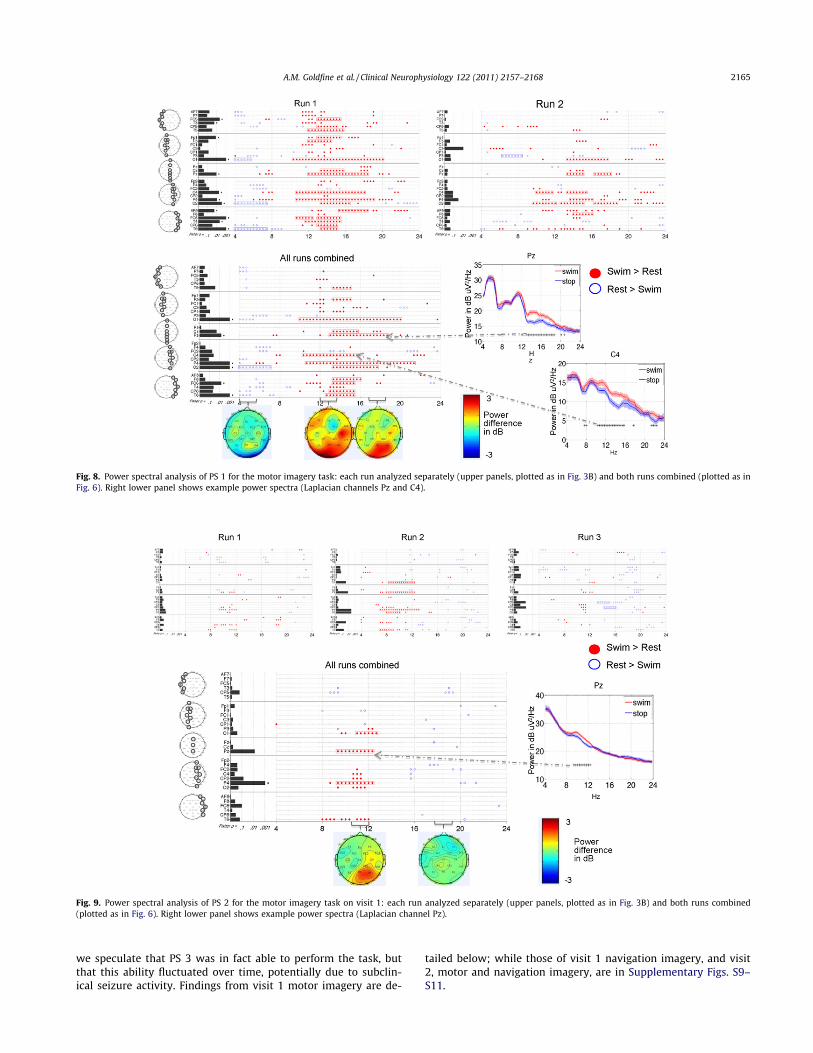
3.5.1. Patient subject 1PS 1 completed two runs of the motor imagery task during
one visit (Fig. 8). The results were positive as there were consis-tent changes between runs (positive outcome measure 1) andwith runs combined, 53% of the TGT p-values remained signifi-cant after FDR correction (positive outcome measure 2). The pri-mary finding of the runs-combined analysis was significantlyincreased power over a broad range of frequencies (11 to20 Hz) across multiple channels, with maximal signal strengthconcentrated posteriorly. Of note, this finding was not seen in
any of the HCs, though HC 1 did demonstrate increased powerin the 13 to 20 Hz range in some posterior channels (Fig. 6).The other finding from the runs-combined analysis was a de-crease in power over posterior channels between 4 and 8 Hz, alsoseen in HCs 2, 3 and 4 (Fig. 6). In Run 2 compared to Run 1,spectral changes were more spatially restricted to the right cen-tral and posterior channels. The fewer significant differences inRun 2 may have been due to removal of more data due to patientmotion (18 snippets removed from Run 2 versus 3 snippets fromRun 1 – Supplementary Table S1).
3.5.2. Patient subject 2PS 2 completed three runs of the motor imagery task on the
first visit, and six runs of the motor imagery task on the secondvisit. On visit 1 (Fig. 9), this subject met the outcome measure 1criterion: increased power from 8 to 12 Hz in posterior channelsin all runs (significant only in Run 2); and decreased power from15 to 17 Hz (significant in Run 3, trend in Run 2). Outcome mea-sure 2 was also positive: 14% of the differences in the runs-combined analysis were significant after FDR correction. Note thatHCs 1 and 4 also showed decreases in EEG power in the samefrequency band and scalp region (Fig. 6). On visit 2 (Supplemen-tary Fig. S8), significant differences were seen in common to sub-sets of runs (positive outcome measure 1), though none weresignificant in all-runs-combined (negative outcome measure 2).As such, we designated this subject’s response on visit 2 to be inde-terminate. Of note, this patient’s recordings had the greatestamount of variance removed by ICA (78% or more in all runs –see Supplementary Table S1). This reflects the removal of frequenteye blinks (typically 1 to 3 per second) and a moderate amount ofmuscle artifact.
3.5.3. Patient subject 3PS 3 completed motor and navigation imagery during two vis-
its. The findings on both tasks at both visits were indeterminate.There were isolated significant changes on subsets of runs (posi-tive outcome measure 1), but none remained significant afterFDR correction with all runs combined (negative outcome mea-sure 2). Because consistent results were seen in subsets of runs,
Fig. 7. Power spectral analysis of EEG for each HC, for all runs of the navigation imagery task combined within each subject. Plotting conventions as in Fig. 6.
2164 A.M. Goldfine et al. / Clinical Neurophysiology 122 (2011) 2157–2168
we speculate that PS 3 was in fact able to perform the task, butthat this ability fluctuated over time, potentially due to subclin-ical seizure activity. Findings from visit 1 motor imagery are de-
tailed below; while those of visit 1 navigation imagery, and visit2, motor and navigation imagery, are in Supplementary Figs. S9–S11.
Fig. 8. Power spectral analysis of PS 1 for the motor imagery task: each run analyzed separately (upper panels, plotted as in Fig. 3B) and both runs combined (plotted as inFig. 6). Right lower panel shows example power spectra (Laplacian channels Pz and C4).
Fig. 9. Power spectral analysis of PS 2 for the motor imagery task on visit 1: each run analyzed separately (upper panels, plotted as in Fig. 3B) and both runs combined(plotted as in Fig. 6). Right lower panel shows example power spectra (Laplacian channel Pz).
A.M. Goldfine et al. / Clinical Neurophysiology 122 (2011) 2157–2168 2165
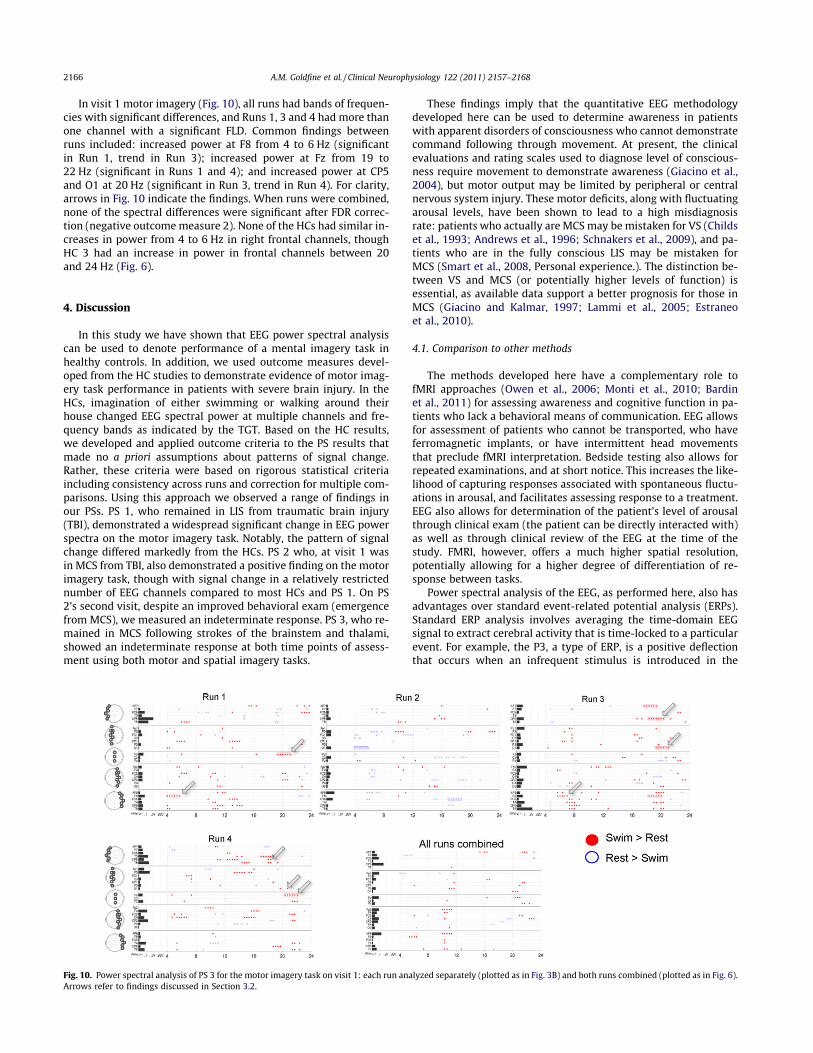
In visit 1 motor imagery (Fig. 10), all runs had bands of frequen-cies with significant differences, and Runs 1, 3 and 4 had more thanone channel with a significant FLD. Common findings betweenruns included: increased power at F8 from 4 to 6 Hz (significantin Run 1, trend in Run 3); increased power at Fz from 19 to22 Hz (significant in Runs 1 and 4); and increased power at CP5and O1 at 20 Hz (significant in Run 3, trend in Run 4). For clarity,arrows in Fig. 10 indicate the findings. When runs were combined,none of the spectral differences were significant after FDR correc-tion (negative outcomemeasure 2). None of the HCs had similar in-creases in power from 4 to 6 Hz in right frontal channels, thoughHC 3 had an increase in power in frontal channels between 20and 24 Hz (Fig. 6).
4. Discussion
In this study we have shown that EEG power spectral analysiscan be used to denote performance of a mental imagery task inhealthy controls. In addition, we used outcome measures devel-oped from the HC studies to demonstrate evidence of motor imag-ery task performance in patients with severe brain injury. In theHCs, imagination of either swimming or walking around theirhouse changed EEG spectral power at multiple channels and fre-quency bands as indicated by the TGT. Based on the HC results,we developed and applied outcome criteria to the PS results thatmade no a priori assumptions about patterns of signal change.Rather, these criteria were based on rigorous statistical criteriaincluding consistency across runs and correction for multiple com-parisons. Using this approach we observed a range of findings inour PSs. PS 1, who remained in LIS from traumatic brain injury(TBI), demonstrated a widespread significant change in EEG powerspectra on the motor imagery task. Notably, the pattern of signalchange differed markedly from the HCs. PS 2 who, at visit 1 wasin MCS from TBI, also demonstrated a positive finding on the motorimagery task, though with signal change in a relatively restrictednumber of EEG channels compared to most HCs and PS 1. On PS2’s second visit, despite an improved behavioral exam (emergencefrom MCS), we measured an indeterminate response. PS 3, who re-mained in MCS following strokes of the brainstem and thalami,showed an indeterminate response at both time points of assess-ment using both motor and spatial imagery tasks.
These findings imply that the quantitative EEG methodologydeveloped here can be used to determine awareness in patientswith apparent disorders of consciousness who cannot demonstratecommand following through movement. At present, the clinicalevaluations and rating scales used to diagnose level of conscious-ness require movement to demonstrate awareness (Giacino et al.,2004), but motor output may be limited by peripheral or centralnervous system injury. These motor deficits, along with fluctuatingarousal levels, have been shown to lead to a high misdiagnosisrate: patients who actually are MCS may be mistaken for VS (Childset al., 1993; Andrews et al., 1996; Schnakers et al., 2009), and pa-tients who are in the fully conscious LIS may be mistaken forMCS (Smart et al., 2008, Personal experience.). The distinction be-tween VS and MCS (or potentially higher levels of function) isessential, as available data support a better prognosis for those inMCS (Giacino and Kalmar, 1997; Lammi et al., 2005; Estraneoet al., 2010).
4.1. Comparison to other methods
The methods developed here have a complementary role tofMRI approaches (Owen et al., 2006; Monti et al., 2010; Bardinet al., 2011) for assessing awareness and cognitive function in pa-tients who lack a behavioral means of communication. EEG allowsfor assessment of patients who cannot be transported, who haveferromagnetic implants, or have intermittent head movementsthat preclude fMRI interpretation. Bedside testing also allows forrepeated examinations, and at short notice. This increases the like-lihood of capturing responses associated with spontaneous fluctu-ations in arousal, and facilitates assessing response to a treatment.EEG also allows for determination of the patient’s level of arousalthrough clinical exam (the patient can be directly interacted with)as well as through clinical review of the EEG at the time of thestudy. FMRI, however, offers a much higher spatial resolution,potentially allowing for a higher degree of differentiation of re-sponse between tasks.
Power spectral analysis of the EEG, as performed here, also hasadvantages over standard event-related potential analysis (ERPs).Standard ERP analysis involves averaging the time-domain EEGsignal to extract cerebral activity that is time-locked to a particularevent. For example, the P3, a type of ERP, is a positive deflectionthat occurs when an infrequent stimulus is introduced in the
Fig. 10. Power spectral analysis of PS 3 for the motor imagery task on visit 1: each run analyzed separately (plotted as in Fig. 3B) and both runs combined (plotted as in Fig. 6).Arrows refer to findings discussed in Section 3.2.
2166 A.M. Goldfine et al. / Clinical Neurophysiology 122 (2011) 2157–2168
setting of a regularly repeating background stimulus. While thepresence of the P3 has been shown to correlate with behavioralevidence of consciousness, (Kotchoubey et al., 2005; Schnakerset al., 2008) and, in small studies, correlate with recovery (Wijnenet al., 2007; Qin et al., 2008), there are some caveats concerningthis approach. ERPs require responses that are time-locked to astimulus, leading to false negatives in patients with delayed re-sponses and precluding paradigms with prolonged response peri-ods. With our methodology, strict time locking is not required,since we are measuring event-related changes in the power spec-trum, i.e., event-related synchronization and desynchronization(Pfurtscheller and Lopes da Silva, 1999). This approach treats thesignal within the analysis window as statistically stationary andcompares it to a reference state; thus the analysis is sensitive torelative changes in signal power at a given frequency arising atany time across the period sampled. Since this analysis is carriedout over several seconds, it is much more likely to identify a sub-stantially delayed response than an ERP technique. A delayed re-sponse, though implying pathology, still provides evidence ofcognitive function and the potential for communication. Addition-ally, since strict time locking is not required, event-related spectralchanges can be used in a wider variety of behavioral paradigms.
4.2. Observed signal characteristics
HC results led to important observations regarding interpreta-tion of PS data in this and future studies. First, significant variabil-ity was seen when comparing findings across HCs on the sametask. On the motor imagery task, while HC subjects had findingsin common (power decreases from 6 to 9 Hz and 13 to 15 Hz incentral channels), there was also a significant amount of variationbetween them (Fig. 6). In the navigation imagery task, there wereno findings in common to all HCs (Fig. 7). We speculate that thisvariability is due to variation in task performance, though cannotconfirm this, as the task has no behavioral output. It is also possiblethat the variability between subjects is due to neuroanatomical dif-ferences that affect the source geometry of the EEG signal.
Due to this variability in HC results, along with the fact thatthose with severe brain injury have differences in neuroanatomyand connectivity due to injury and the recovery process, we de-signed our PS outcome measure without an a priori signal pattern.Of note, this is different than the approach of some fMRI analyses(Owen et al., 2006; Monti et al., 2010), where a standardized regionof interest (ROI) was used to define a positive outcome measure.We allowed for flexibility in the outcome signal by determiningsignificance at individual frequencies instead of pre-defined fre-quency bands, and by making the primary outcome measure beconsistency of signal change across runs. The most notable findingallowed by this approach, is the positive result in PS 1 (Fig. 8) de-spite a marked difference in frequency location and direction of thesignal change compared with HCs (Fig. 6). It is not possible todetermine whether the reason for the difference in this patient’sspectral pattern reflects variation in the way the task was per-formed, or an injury-induced reorganization in cerebral networkssupporting the behavior. This patient’s consistent bedside com-mand following and communication using head movements is astrong reason to believe that he was able to perform the mentalimagery task, though clearly the mental imagery task samples anindependent set of cerebral networks.
A second finding from the HC results was that the TGT wasmore sensitive to determining changes in the spectra than theFLD. This means that no combination of frequency band changesbetter differentiated the conditions than the individual changesalone. As such, the data indicate that for the determination of pa-tient awareness via EEG spectral changes, the univariate approach(the TGT) with correction for multiple comparisons suffices.
Though in principle a multivariate approach may be more sensi-tive, a search for patterns across frequencies entails manymore de-grees of freedom, and there appears to be no net benefit of thatapproach in this application.
A third observation from the HC data was that subjects demon-strated changes in their EEG spectra to two different tasks, motorand spatial imagery. This is important, as patients may be unableto perform one category of task (Monti et al., 2010) due to causessuch as focal injury to a cortical area involved in the task.
One potential limitation to interpretation of PS data is the pos-sibility of changes in the EEG spectra due to non-volitional corticalactivation from the auditory command presentation. Our analysismethods greatly reduce this possibility through ignoring data fromthe first second after command presentation and requiring consis-tency across runs as the primary outcome measure. Furthermore,any non-specific alerting response to sound would not differentiatethe two types of commands, and there is no indication that uncon-scious patients have sustained (over 1 s) cortical activation thatcan differentiate between commands (Owen et al., 2007).
4.3. Interpretation of indeterminate results
PS 2 at visit 2, and PS 3 had indeterminate results, as the signif-icant spectral differences between task and rest on individual runs,were no longer significant when averaged and corrected for multi-ple comparisons. We chose to retain an explicit ‘‘indeterminate’’designation, to recognize the potential for intermittent task perfor-mance and limitations of EEG power spectral analysis. In fact, theclinical and imaging evidence in these two patient subjects indi-cates that it might be misleading to consider these results as ‘‘neg-ative’’. Both PS 2 and PS 3 showed behavioral evidence of followingsimple commands (Supplementary Appendix A), and, notably, PS 2had an improved behavioral exam at visit 2 (emergence fromMCS).Furthermore, both of these subjects showed evidence of perfor-mance of the same mental imagery task via an independent fMRIstudy (Bardin et al., 2011), during visits where their EEG responsewas deemed indeterminate.
One potential cause of indeterminate results is variability intask performance across runs. HCs, who also demonstrated varia-tion in patterns of EEG spectral change across runs, may have per-formed the tasks differently as they started naïve to the tasks.Variable task performance may also be due to differences in overalllevel of arousal. This may have occurred in HCs as the EEG testingsession lasted over 3 h. As for the PSs, it is well known that patientswith severe brain injury have fluctuating arousal throughout a day(Giacino et al., 2002; Hart et al., 2006; Schiff et al., 2007). In fact,behavioral testing of both PS 2 and PS 3 showed variations inresponsiveness to spoken commands over different testing periods.In PS 3 this may have been due to intermittent subclinical seizureactivity. A previous study, using fMRI, also demonstrated variabil-ity in signal strength and location across imaging sessions of onepatient (Bardin et al., 2011). Future work may benefit from re-peated testing of patients over many days to look for repeated pat-terns of signal change, suggestive of intermittent task performance.
There are other more general limitations to EEG analysis thatmay result in indeterminate results. One patient-specific factor iscortical atrophy, which may result in a weaker EEG signal. Anotherissue for both patients and controls is muscle electrical activity(EMG) contamination of the EEG signal. EMG has been shown toappear in the EEG power spectrum well into the frequency rangeinvolved in motor imagery (McMenamin et al., 2010) and thereforecan confound interpretation of spectral power changes in thisrange. ICA is successful in removing this artifact, though is timeconsuming and requires a trained investigator to select compo-nents to remove. In the setting of a significant amount of EMG,such as HC 2 in this study, ICA artifact removal may also remove
A.M. Goldfine et al. / Clinical Neurophysiology 122 (2011) 2157–2168 2167
some of the underlying EEG, limiting the ability to identify changesin EEG spectral power. Thus, the use of EEG power spectral analysisas a clinical diagnostic tool, or potentially a communication device,will be facilitated by further development of algorithms to removemuscle electrical artifact quickly and reliably.
4.4. Conclusions and future directions
Overall, based on our positive results in 5 healthy subjects and 2patients with severe brain injury, we find that EEG power spectralanalysis of response to imagery commands is a promising tool foridentifying awareness in patientswho have no clear behavioral out-put. Determination of patient awareness requires a flexible ap-proach that takes into account variability in the frequency bandsand scalp locations at which EEG spectral changes may be present.EEG power spectral analysis has advantages of being inexpensive,portable, andflexible in termsof taskparadigmsanddetectionof de-layed responses. Before this can be used as a clinically diagnostictool, a larger group of patients will need to be assessed at multipletime points and results correlated with behavioral and other imag-ing measures. Additionally, a larger pool of healthy control subjectdata is required to determine if there is a normal range of patterns,and if these can serve as a marker of recovery in brain injured pa-tients. If futureworkfindspatientswhoare able touse imagery tasksto modulate EEG spectra consistently, this tool could potentially beused as a bedside ‘‘yes/no’’ brain computer interface, complement-ing this application of fMRI (Monti et al., 2010; Bardin et al., 2011).
Acknowledgements
We thank Hemant Bokil for assistance with the use of theChronux toolbox and for many helpful conversations on digital sig-nal processing. We thank Jennifer Hersh for assistance with thedata collection. This work was supported by NIH-NICHD 51912,the James S McDonnell Foundation, and Weill-Cornell CTSC UL1RR02499. The funding sources had no role in study design; inthe collection, analysis and interpretation of data; in the writingof the report; or in the decision to submit the paper for publication.
Appendix A. Supplementary data
Supplementary data associated with this article can be found, inthe online version, at doi:10.1016/j.clinph.2011.03.022.
References
Andrews K, Murphy L, Munday R, Littlewood C. Misdiagnosis of the vegetative state:retrospective study in a rehabilitation unit. BMJ 1996;313:13–6.
Bai O, Lin P, Vorbach S, Floeter MK, Hattori N, Hallett M. A high performancesensorimotor beta rhythm-based brain–computer interface associated withhuman natural motor behavior. J Neural Eng 2008;5:24–35.
Bai O, Lin P, Vorbach S, Li J, Furlani S, Hallett M. Exploration of computationalmethods for classification of movement intention during human voluntarymovement from single trial EEG. Clin Neurophysiol 2007;118:2637–55.
Bardin JC, Fins JJ, Katz DI, Hersh J, Heier LA, Tabelow K, et al. Dissociations betweenbehavioral and functional magnetic resonance imaging-based evaluations ofcognitive function after brain injury. Brain 2011;134:769–82.
Benjamini Y, Hochberg Y. Controlling the false discovery rate: a practical andpowerful approach to multiple testing. J R Statist Soc B 1995;57:289–300.
Benjamini Y, Yekutieli D. The control of the false discovery rate in multiple testingunder dependency. Ann Statist 2001;29:1165–88.
Bokil H, Purpura K, Schoffelen J-M, Thomson D, Mitra P. Comparing spectra andcoherences for groups of unequal size. J Neurosci Methods 2007;159:337–45.
Childs NL, Mercer WN, Childs HW. Accuracy of diagnosis of persistent vegetativestate. Neurology 1993;43:1465–7.
Delorme A, Makeig S. EEGLAB: an open source toolbox for analysis of single-trialEEG dynamics including independent component analysis. J Neurosci Methods2004;134:9–21.
Estraneo A, Moretta P, Loreto V, Lanzillo B, Santoro L, Trojano L. Late recovery aftertraumatic, anoxic, or hemorrhagic long-lasting vegetative state. Neurology2010;75:239–45.
Fins JJ, Schiff ND. In the blink of the mind’s eye. Hastings Cent Rep 2010;40:21–3.
Fisher RA. the use of multiple measurements in taxonomic problems. Ann Eugen1936;7:179–88.
Giacino JT, Ashwal S, Childs N, Cranford R, Jennett B, Katz DI, et al. The minimallyconscious state: definition and diagnostic criteria. Neurology 2002;58:349–53.
Giacino JT, Kalmar K, Whyte J. The JFK coma recovery scale-revised: measurementcharacteristics and diagnostic utility. Arch Phys Med Rehabil 2004;85:2020–9.
Giacino JT, Kalmar K. The vegetative and minimally conscious states: a comparisonof clinical features and functional outcome. J Head Trauma Rehabil1997;12:36–51.
Hart T, Whyte J, Millis S, Bode R, Malec J, Richardson RN, Hammond F. Dimensions ofdisordered attention in traumatic brain injury: further validation of the mossattention rating scale. Arch Phys Med Rehabil 2006;87:647–55.
Hjorth B. An on-line transformation of EEG scalp potentials into orthogonal sourcederivations. Electroencephalogr Clin Neurophysiol 1975;39:526–30.
Hjorth B. Source derivation simplifies topographical EEG interpretation. Am J EEGTechnol 1980;20:121–32.
Hung C-I, Lee P-L, Wu Y-T, Chen L-F, Yeh T-C, Hsieh J-C. Recognition of motorimagery electroencephalography using independent component analysis andmachine classifiers. Ann Biomed Eng 2005;33:1053–70.
Jasper HH. The ten twenty electrode system of the international federation.Electroenceph Clin Neurophysiol 1958;10:371–5.
Kotchoubey B, Lang S, Mezger G, Schmalohr D, Schneck M, Semmler A, et al.Information processing in severe disorders of consciousness: vegetative stateand minimally conscious state. Clin Neurophysiol 2005;116:2441–53.
Lammi MH, Smith VH, Tate RL, Taylor CM. The minimally conscious state andrecovery potential: a follow-up study 2–5 years after traumatic brain injury.Arch Phys Med Rehab 2005;86:746–54.
Li Y, Umeno K, Hori E, Takakura H, Urakawa S, Ono T, et al. Global synchronization inthe theta band during mental imagery of navigation in humans. Neurosci Res2009;65:44–52.
McMenamin BW, Shackman AJ, Maxwell JS, Bachhuber DRW, Koppenhaver AM,Greischar LL, et al. Validation of ICA-based myogenic artifact correction for scalpand source-localized EEG. NeuroImage 2010;49:2416–32.
Menzer DL, Bokil H, Ryou JW, Schiff ND, Purpura KP, Mitra PP. Characterization oftrial-to-trial fluctuations in local field potentials recorded in cerebral cortex ofawake behaving macaque. J Neurosci Methods 2010;186:250–61.
Mitra PP, Pesaran B. Analysis of dynamic brain imaging data. Biophys J1999;76:691–708.
Mitra P, Bokil H. Observed brain dynamics. 1st ed. USA:Oxford University Press;2007.
Monti MM, Vanhaudenhuyse A, Coleman MR, Boly M, Pickard JD, Tshibanda L, et al.Willful modulation of brain activity in disorders of consciousness. N Engl J Med2010;362:579–89.
Owen AM, Coleman MR, Boly M, Davis MH, Laureys S, Jolles D, et al. Response tocomments on detecting awareness in the vegetative state. Science2007;315:1221.
Owen AM, Coleman MR, Boly M, Davis MH, Laureys S, Pickard JD. Detectingawareness in the vegetative state. Science 2006;313:1402.
Percival DB, Walden AT. Spectral analysis for physical applications multitaper andconventional univariate techniques. Cambridge University Press; 1993.
Perrin F, Schnakers C, Schabus M, Degueldre C, Goldman S, Bredart S, et al. Brainresponse to one’s own name in vegetative state, minimally conscious state, andlocked-in syndrome. Arch Neurol 2006;63:562–9.
Pfurtscheller G, Lopes da Silva FH. Event-related EEG/MEG synchronization anddesynchronization: basic principles. Clin Neurophysiol 1999;110:1842–57.
Qin P, Di H, Yan X, Yu S, Yu D, Laureys S, et al. Mismatch negativity to the patient’sown name in chronic disorders of consciousness. Neurosci Lett 2008;448:24–8.
Schiff ND, Giacino JT, Kalmar K, Victor JD, Baker K, Gerber M, et al. Behaviouralimprovements with thalamic stimulation after severe traumatic brain injury.Nature 2007;448:600–3.
Schnakers C, Perrin F, Schabus M, Majerus S, Ledoux D, Damas P, et al. Voluntarybrain processing in disorders of consciousness. Neurology 2008;71:1614–20.
Schnakers C, Vanhaudenhuyse A, Giacino J, Ventura M, Boly M, Majerus S, et al.Diagnostic accuracy of the vegetative and minimally conscious state: Clinicalconsensus versus standardized neurobehavioral assessment. BMC Neurol2009;9:35.
Schwartzman DJ, Kranczioch C. In the blink of an eye: the contribution ofmicrosaccadic activity to the induced gamma band response. Int JPsychophysiol 2011;79:73–82.
Shackman AJ, McMenamin BW, Maxwell JS, Greischar LL, Davidson RJ. Identifyingrobust and sensitive frequency bands for interrogating neural oscillations.NeuroImage 2010;51:1319–33.
Smart CM, Giacino JT, Cullen T, Moreno DR, Hirsch J, Schiff ND, et al. A case oflocked-in syndrome complicated by central deafness. Nat Clin Pract Neurol2008;4:448–53.
Thickbroom GW, Mastaglia FL, Carroll WM, Davies HD. Source derivation:application to topographic mapping of visual evoked potentials.Electroencephalogr Clin Neurophysiol 1984;59:279–85.
Thomson DJ. Spectrum estimation and harmonic analysis. Proc IEEE1982;70:1055–96.
Wijnen VJM, van Boxtel GJM, Eilander HJ, de Gelder B. Mismatch negativity predictsrecovery from the vegetative state. Clin Neurophysiol 2007;118:597–605.
Yuan H, Liu T, Szarkowski R, Rios C, Ashe J, He B. Negative covariation between task-related responses in alpha/beta-band activity and BOLD in human sensorimotorcortex: an EEG and fMRI study of motor imagery and movements. NeuroImage2010;49:2596–606.
2168 A.M. Goldfine et al. / Clinical Neurophysiology 122 (2011) 2157–2168