clinical investigations - school of mathematical sciences outcomes paper_ccm... · ensure...
TRANSCRIPT

Clinical Investigations
Mortality and length-of-stay outcomes, 1993–2003, in the binationalAustralian and New Zealand intensive care adult patient database*
John L. Moran, MBBS, FRACP, FJFICM, MD; Peter Bristow, MBBS, FRACP, FJFICM, GCM;Patricia J. Solomon, BSc, PhD; Carol George, BSc, Grad Dip EpidBiostat, MBusIT;Graeme K. Hart, MBBS, FANZCA, FJFICM; for the Australian and New Zealand Intensive Care SocietyDatabase Management Committee (ADMC)
I ntensive care unit (ICU) out-comes, such as mortality andlength of stay, have been a subjectof interest and controversy (1–4)
as well as a focus of critical care profes-sional organizations (5–7) and commer-cial organizations interested in purchas-
ing health care (8, 9). By far, the majorityof articles looking at such outcomes havenot unreasonably used the individual ICUas the prime descriptor. A national data-base, such as that maintained by the Da-tabase Management Committee of theAustralian and New Zealand Intensive
Care Society (ANZICS) (10), permitsanalysis of aggregate outcome measuresover time.
Raw mortality rates are influenced bydifferences in severity of illness, case mix,discharge practices, geographical loca-tion, and the allocation of human andmaterial resources (11–14). The majorityof studies addressing mortality outcomefrom ICUs have situated analysis withinestablished prediction algorithms (15–17), using a relatively small set of predic-tor variables. ICU length of stay has alsobeen the subject of detailed analysis (18–20), but few studies have evaluatedchange over a prolonged time period(21), the majority presenting cross-sectional analyses over a relatively short
Objective: Intensive care unit (ICU) outcomes have been thesubject of controversy. The objective was to model hospital mor-tality and ICU length-of-stay time-change of patients recorded inthe Australian and New Zealand Intensive Care Society adultpatient database.
Design: Retrospective, cohort study of prospectively collecteddata on index patient admissions.
Setting: Australian and New Zealand ICUs, 1993–2003.Patients: The Australian and New Zealand Intensive Care So-
ciety adult patient database, which contains data for 223,129patients.
Interventions: None.Measurements and Main Results: Hospital mortality and ICU
length of stay were modeled using logistic and linear regression,respectively, with determination (80%) and validation (20%) datasets. Model adequacy was assessed by discrimination (receiveroperating characteristic curve area, AZ) and calibration (Hosmer-Lemeshow C) for mortality and R2 for length of stay. Predictorvariables included patient demographics, severity score, surgicaland ventilation status, ICU categories, and geographical locality.The data set comprised 223,129 patients: Their mean (SD) age was59.2 (18.9) yrs, 41.7% were female, their mean (SD) Acute Physi-ology and Chronic Health Evaluation (APACHE) III score was 53(31), they had 16.1% overall mortality rate, and 45.7% were
mechanically ventilated. ICU length of stay was 3.6 (5.6) days. AZ,C statistic, and R2 for developmental and validation model datasets were 0.88, 17.64 (p � .02), and 0.18; and 0.88, 12.32(p � .26), and 0.18, respectively. Variables with mortality impact(p < .001) were age (odds ratio [OR] 1.023), gender (OR 1.16;males vs. females), APACHE III score (OR 1.06), mechanical ven-tilation (OR 1.66), and surgical status (elective, OR 0.17; emer-gency, OR 0.47; compared with nonsurgical). ICU level and localityhad significant mortality-time effects. Similar variables werefound to predict length of stay. Risk-adjusted mortality declined,during 1993–2003, from 0.19 (95% confidence interval 0.17–0.21)to 0.15 (0.13–0.16) and similarly for ventilated patients: 0.26(0.24–0.29) to 0.23 (0.21–0.25). Predicted mean ICU length of stay(days) demonstrated minimal overall time-change: 3.4 (2.2) in1993 to 3.5 (2.7) in 2003, peaking at 3.7 (2.4) in 2000.
Conclusions: Overall hospital mortality rate in patients admit-ted to Australian and New Zealand ICUs decreased 4% over 11 yrs.A similar trend occurred for mechanically ventilated patients.Length of stay changed minimally over this period. (Crit Care Med2008; 36:46–61)
KEY WORDS: intensive care; database; hospital mortality; lengthof stay; longitudinal study; generalized linear model; randomeffects
*See also p. 336.From the Department of Intensive Care Medicine,
The Queen Elizabeth Hospital, Woodville, SA, Australia(JLM); Intensive Care Unit, Toowoomba Hospital,Toowoomba QLD, Australia (PB); School of Mathemat-ical Sciences, University of Adelaide, Adelaide SA,Australia (PJS); ANZICS Adult Patient Database, CarltonVIC, Australia (CG); Department of Intensive Care, Aus-tin Hospital, Heidelberg, Victoria, Australia (GKH); andthe Australian and New Zealand Intensive Care Society,Carlton, Victoria 3053, Australia.
Supported by local ICU funds and the AustralianHealth Ministers Advisory Council.
The authors have not disclosed any potential con-flicts of interest.
For information regarding this article, E-mail:[email protected]
Copyright © 2007 by the Society of Critical CareMedicine and Lippincott Williams & Wilkins
DOI: 10.1097/01.CCM.0000295313.08084.58
46 Crit Care Med 2008 Vol. 36, No. 1

periods of months (22) to 1–2 yrs (23).Studies of ICU length of stay have focusedmainly on responsible patient factors (2,20) rather than on organizational/geo-graphical factors (18, 23–25).
We wanted to expand this paradigm byextending the potential predictors (26) tomore fully account for those multiple fac-tors, as just described, which may haveinfluenced the time course of both mor-tality and ICU length of stay of patientsrecorded in the ANZICS Adult Patient Da-tabase Management Committee databaseover the period 1993–2003. Thus, a focusof interest was the influence of availableICU descriptors, for example, ICU leveland geographical location, although suchchanges may have been specific to thenational database. As the objective of thecurrent study was to explain variation asfully as possible (27), we were less con-cerned with principles such as transport-ability and overfitting (28), which are ap-posite predictive concerns.
METHODS
The ANZICS Adult Patient Database is abinational (Australia and New Zealand) volun-tary data collection of individual ICU admis-sions, commencing in 1990. This database wasinterrogated to define an appropriate patientset, over the time period 1993–2003, the ear-liest comprehensive data being for calendaryear 1993. The data set requirements are spec-ified in a data dictionary (29). Data were col-lected at the individual ICU and uploaded tothe central repository (ANZICS adult patientdatabase) for processing and quality assur-ance, consisting of a cycle of error and excep-tion checks, site feedback, resubmission, andincorporation into a final reporting data set.Physiologic variables collected were the worstin the first 24 hrs after ICU admission. All firstICU admissions to a particular hospital for theperiod 1993–2003 were selected. Access to thedata was granted by the ANZICS DatabaseManagement Committee in accordance withstanding protocols; local hospital (The QueenElizabeth Hospital) Ethics of Research Com-mittee approval was waived.
Exclusions were patients with unknownhospital vital outcome and date of discharge;patients with an ICU length of stay �4 hrs;and patients �16 yrs of age. Specific attentionwas directed to the fidelity of severity of illnessrecords, in particular the scoring of the Glas-gow Coma Scale. Records were used onlywhen all three components of the GlasgowComa Scale were provided. Records for whichall physiologic variables were missing wereexcluded, and for the remaining records, miss-ing variables were replaced with the normalrange and weighted accordingly. ICU and hos-
pital length of stay, initially recorded in hours,was transformed to fractional days. Patientswith an ICU length of stay �60 days andhospital length of stay �365 days were notconsidered in formal analysis. No establishedtrimming methods were employed (30). TheSimplified Acute Physiology (SAPS) II score(17) was back-calculated for the calendar year1993. Descriptors of ICU admission primaryorgan system dysfunction were generated byconsolidating the diagnostic categories of theAcute Physiology and Chronic Health Evalua-tion (APACHE) algorithms to yield the follow-ing descriptors: cardiovascular, gastrointesti-nal, metabolic, neurologic, respiratory,trauma, and renal/genitourinary.
Statistical Methods
Variables were reported using mean (SD),except where otherwise indicated. For sum-marizing raw variable time-change, simplenonparametric trend tests were used, with sta-tistical significance ascribed at p � .05. Cate-gorical variables were analyzed using the chi-square test. Stata (version 9.2 MP, 2006,College Station, TX) statistical software wasused.
Hospital mortality was modeled using lo-gistic regression with standard errors adjustedby 1) clustering on ICU-year units, formed byICU-site � calendar-year interaction, on thebasis that within-cluster observations werenot independent (e.g., subject to serial corre-lation); and 2) using robust variance estimatesto allow for any within-cluster heteroscedas-ticity (nonconstant variance) (31). For theunits created by this site � year interaction,minimum patient number was set at 150, toensure estimation stability. Choice of severity-of-illness score was determined by discrimina-tion of the score, assessed by receiver operat-ing characteristic (ROC) curve area, whenentered into the logistic model as the solecovariate. The continuous variables were age,severity-of-illness scores, and calendar year;candidate categorical predictors were parame-terized as simple indicator variables. Clinicallymeaningful combinations of variables andtheir two-way interactions were assessed foreffect in the logistic model; higher order in-teractions were not entertained in the finalmodel. The potential for multiple colinearitywas tested using the variance inflation factor(VIF) and condition number (CN), where VIF�10 and CN �30 (32) are desirable. Modeladequacy was gauged by the traditional crite-ria of discrimination (ROC area) and calibra-tion, and Hosmer-Lemeshow (H-L) C statisticand model chi-squared were calculated foreach parameter (33) to adjudge its relativeimportance. The final model was developed ona training (80% of data) and determination set(20% of data), the random samples beingstratified by calendar year. Mortality probabil-
ities and 95% confidence intervals (CIs) weregenerated from the final model with continu-ous covariates centered and categorical covari-ates held at the reference category. Predictedprobabilities with 95% CI were collapsed andaveraged over patient categories and calendaryear to yield appropriate graphical display. De-tails of the approach to modeling and graphi-cal display are given in Appendix 2. To furtherinvestigate potential heterogeneity of mortal-ity effect (34), the final model was re-estimated using a two-level, patients withinICU-year units, random effects logistic regres-sion model (the gllamm Stata module) (35).Parameter estimates and performance werecompared with those of the logistic model.
Log ICU length of stay was modeled usingordinary least squares (OLS) regression, withthe same covariate set and standard error ad-justment to allow comparability of variableeffects, and back-transformation to the dayscale using Duan’s smearing estimate (36).The applicability of this covariate set wastested using the split sample technique, aspreviously described. Model performance wasassessed by the coefficient of determination(R2), on the day scale (37), computed as thesquare of the correlation between predictedand observed length of stay (38), and residualanalysis by assessment of residual normalityand heteroscedasticity.
RESULTS
Demographics
The database, exclusive of ICU read-missions for both the same and separatehospital admissions (n � 6,001) and pa-tients having ICU length of stay �4 hrs(n � 5,762, hospital mortality � 50.6%),contained records of 253,163 patients forthe period 1993–2003. Incomplete Glas-gow Coma Scale scores were recorded for14,644 patients, there being no calendar-year time trend of this incompleteness(percent exclusion, 1.3% to 11%; p �.34). Missing hospital mortality outcomethat constituted �10% of monthly ad-mission totals occurred in 587 of 6,084site-month units (9.65%). After exclusionof ICU-year units with n � 150, the finaldata set comprised 223,129 patients from99 ICUs over the 11-yr period. Mean (SD)age was 59.2 (18.9) years, 41.7% werefemale, and the mortality rate was 16.1%.Overall, 45.7% were mechanically venti-lated, and of these 60.6% were male.Mean severity-of-illness scores across thewhole database (n � 223,129) wereAPACHE II 15.4 (8.5), APACHE III 52.7(30.6), and SAPS II 31.6 (17.6). Severityscore discrimination as ROC curve areawith respect to hospital mortality was
47Crit Care Med 2008 Vol. 36, No. 1

APACHE II 0.85 (SE 0.001), APACHE III0.87 (0.001), and SAPS II 0.86 (0.001),suggesting better discrimination for theAPACHE III score, which was selected asthe severity-of-illness score for this study.Demographics, by geographical localityand hospital level and surgical status, areshown in Tables 1 and 2. No time-changeof fraction of first day post-ICU admis-sion mechanically ventilated patientswas evident by nonparametric trend test(p � .18).
We found the following with respect tocategorization of ICU admission physio-logic system derangement by ICU leveland surgical status: For nonsurgicalcases, the primary physiologic system de-rangements were cardiovascular and re-spiratory; for elective surgical, cardiovas-cular and gastrointestinal; and foremergency surgical, gastrointestinal, car-diovascular, and trauma. Within and be-tween each ICU level, there were signifi-cant (p � .0001) distributional differences
of primary physiologic system derange-ment and surgical status. The currentdatabase did not incorporate recordsfrom coronary care units, and the per-centage of cases with an ICU admissiondiagnosis of acute myocardial infarctionwas 1.7%.
ICU length of stay was 3.6 (5.6) (me-dian 1.8, interquartile range 2.9 [0.9–3.8]) days, and hospital length of stay was16.4 (19.5) (median 10.1, interquartilerange 14.6 [5.1–19.7]) days. The overall
Table 1. Patient demographics and Acute Physiology and Chronic Health Evaluation (APACHE) III score by intensive care unit (ICU) geographical locationand mechanical ventilation status
Locality
ICUMortality,
%
HospitalMortality,
% ICU LOS, Days Age, YrsGender,% Males APACHE III Score
NV V NV V NV V NV V NV V NV V
Northern territory (n � 5222) 3.8 24.9 7.7 24.9 2.1 (3.4) 5.8 (7.2) 49.7 (17.0) 47.0 (17.0) 57 64 41.4 (24.7) 73.4 (34.9)New South Wales (n � 72670) 4.2 20.1 9.0 27.3 2.5 (3.5) 5.5 (7.3) 59.7 (19.2) 59.6 (18.9) 55 61 41.4 (23.1) 69.9 (34.2)Australian capital territory (n � 5995) 3.2 17.0 6.4 22.1 2.0 (4.1) 5.3 (7.0) 58.3 (18.4) 56.6 (19.1) 57 59 38.6 (20.3) 54.8 (29.0)South Australia (n � 22480) 6.9 20.6 14.1 29.4 2.4 (3.3) 5.2 (7.7) 62.8 (18.1) 58.7 (19.3) 56 61 48.1 (24.7) 71.0 (34.2)Victoria (n � 63377) 3.4 17.4 7.8 24.8 2.3 (3.3) 5.6 (7.2) 62.2 (17.8) 58.9 (19.0) 58 61 41.7 (21.7) 66.2 (32.4)New Zealand (n � 11393) 5.0 18.9 9.0 25.7 1.9 (3.1) 4.0 (6.0) 56.5 (20.5) 57.4 (19.6) 55 60 41.2 (23.6) 65.2 (31.7)Queensland (n � 39970) 3.2 14.2 7.1 18.2 2.0 (3.1) 4.4 (6.6) 57.5 (19.2) 58.3 (18.6) 55 60 38.8 (21.8) 59.4 (31.1)Tasmania (n � 6130) 5.5 20.9 10.0 27.9 2.4 (3.3) 6.2 (7.3) 58.9 (18.0) 57.7 (18.7) 58 61 39.2 (24.1) 71.1 (32.4)Western Australia (n � 369) 4.4 18.3 6.6 25.0 2.1 (1.7) 4.2 (3.4) 65.4 (16.5) 66.4 (15.5) 56 41 37.3 (18.2) 57.5 (24.2)
NV, not ventilated; V, ventilated; LOS, length of stay.
Table 2. Demographics of intensive care unit (ICU) hospital level, ventilation, and surgical status: mean (SD)
ICU Hospital Level Overall
Not Ventilated Ventilated
Nonsurgical Elective Surgical Emergency Surgical Nonsurgical Elective Surgical Emergency Surgical
RuralICU length of stay, days 3.1 (5.0) 2.4 (3.5) 1.9 (2.4) 2.3 (3.4) 5.7 (8.2) 5.2 (6.4) 6.4 (8.2)APACHE III score 44.8 (29.1) 37.6 (23.5) 34.7 (16.0) 39.5 (20.7) 76.5 (35.5) 58.6 (27.5) 69.3 (32.0)Age, yrs 59.2 (19.1) 56.8 (19.5) 65.6 (15.2) 63.0 (19.5) 55.9 (19.5) 67.0 (14.3) 64.6 (18.3)% males 57 57 59 52 57 67 59ICU mortality, % 8.2 5.0 1.1 3.2 28.8 10.4 15.9Hospital mortality, % 12.2 8.5 3.7 7.3 34.6 16.8 23.6
MetropolitanICU length of stay, days 3.9 (6.7) 2.8 (4.4) 1.9 (3.02) 2.2 (3.1) 6.3 (9.3) 4.9 (7.3) 7.1 (9.5)APACHE III score 54.5 (31.9) 44.5 (25.5) 38.6 (17.1) 43.3 (22.1) 77.9 (35.5) 56.9 (25.5) 70.6 (32.0)Age, yrs 59.4 (19.2) 56.9 (19.8) 66.2 (14.6) 62.0 (19.7) 55.6 (19.6) 67.4 (13.9) 62.9 (19.1)% males 56 53 59 54 57 62 60ICU mortality, % 10.4 5.7 0.7 2.5 25.3 5.8 15.9Hospital mortality, % 15.9 11.1 3.6 7.0 32.6 10.6 23.2
TertiaryICU length of stay, days 4.0 (6.9) 2.9 (5.2) 1.5 (2.2) 2.1 (3.7) 6.1 (8.9) 2.8 (5.1) 5.9 (8.0)APACHE III score 55.7 (31.1) 48.0 (26.2) 36.1 (16.5) 40.8 (21.2) 72.7 (35.3) 47.9 (20.8) 62.9 (29.7)Age, yrs 57.6 (19.1) 55.1 (20.0) 62.3 (16.1) 58.2 (20.3) 55.2 (19.5) 62.8 (15.5) 57.4 (20.3)% males 60 55 60 57 60 63 63ICU mortality (%) 12.2 7.5 0.7 2.5 25.7 3.0 14.6Hospital mortality (%) 18.7 14.5 3.6 8.2 33.7 6.5 22.7
PrivateICU length of stay, days 3.0 (5.2) 2.8 (4.1) 1.6 (2.1) 2.0 (3.0) 6.9 (8.6) 3.2 (4.6) 5.6 (7.4)APACHE III score 46.1 (25.4) 46.2 (23.6) 34.2 (14.8) 41.5 (19.5) 77.8 (34.3) 48.9 (19.7) 64.8 (29.9)Age, yrs 65.5 (16.0) 64.9 (17.9) 65.0 (15.4) 66.7 (16.3) 64.4 (17.4) 67.0 (13.5) 66.8 (16.6)% males 57 52 59 53 55 63 54ICU mortality, % 5.6 5.9 0.4 2.4 28.7 2.2 12.8Hospital mortality, % 9.5 12.0 2.1 6.7 36.1 4.7 21.0
APACHE, Acute Physiology and Chronic Health Evaluation.
48 Crit Care Med 2008 Vol. 36, No. 1

percentage of patients with ICU length ofstay �60 days was 0.16%, varying overcalendar years from 0.09% to 0.25%, withno significant time trend (p � .18). RawICU, but not hospital, length of stay dem-onstrated an increment over time, 1993–2003 (p � .04 and .60, respectively). Theincrease of raw ICU length of stay overcalendar years was significant as a qua-dratic effect (time, p � .05; time2, p �.02), visualized, with hospital length ofstay, in Figure 1, top and middle panels,respectively.
Raw Mortality and Length ofStay
ICU and hospital mortality andAPACHE III scores by calendar year andICU type are shown in Table 3. Over thewhole database, 1993–2003, raw (mean)ICU and hospital mortality showed a de-cline between 1993 and 2003 (nonpara-metric trend, p � .008 and .02, respec-tively). For private and tertiary ICUs,there were significant decreases in rawICU and hospital mortality over time. Notrend was discernible for metropolitanICUs (p � .42 and .79, respectively), andfor rural ICUs there were significant in-creases over time for both ICU and hos-pital mortality. Time-change of raw ICUlength of stay, by outcome and ventila-tion status, stratified by APACHE III ter-tiles, is shown in Figure 2, left. For ICUsurvivors, the length of stay demon-strated an increase across the APACHE IIItertiles, APACHE III scores 0–36, 37–60,and 61–216, respectively, with a mildtime increase in length of stay in venti-lated patients in the uppermost APACHEIII tertile. However, for non-ICU survi-vors, length of stay across the tertiles of
APACHE III was reversed, suggesting asubstantive qualitative interaction. Notime trend of ICU mortality was evidentacross any of the six APACHE III tertile-ventilation strata (p � .34).
Hospital survivors were discharged tohome (83.4%), a rehabilitation facility(5.4%), or another hospital (11.2%). Thepercentage of survivors discharged to arehabilitation facility increased from2.4% (1993) to 6.7% (2003) (p � .01,nonparametric trend); beyond 1994, notime trend was evident (p � .08). Thepercentage of patients discharged to an-other hospital demonstrated no timetrend (p � .43).
Hospital Mortality Model
With such a large database and num-ber of events, 28,641 deaths in the devel-opment set, the potential number of pre-dictors that could properly be incorporatedinto a logistic model was substantial (39),as was the potential for multicollinearity.Calendar year was modeled as a continu-ous centered variable, including a simplequadratic effect, and referenced to 1999–2000, after Milberg et al (40). This alsoreduced the number of parameters occa-sioned by interactions.
The development set (n � 178,506)had an ROC area of 0.88, with p values forWindmeijer’s goodness-of-fit test and H-LC of 0.77 and 0.02, respectively; for thevalidation set (n � 44,623), ROC area was0.88 and H-L C 12.32 (p � .26). Reportedestimates were therefore generated onthe whole data set with an ROC area of0.88, Windmeijer’s goodness-of-fit test(p � .26), and H-L C � 23.59 (p � .003).The parameters of the final model, pointestimates as odds ratios (ORs) with p val-
Figure 1. Top, raw intensive care unit length ofstay in days (vertical axis), with 95% confidenceintervals, plotted against calendar year (horizon-tal axis); middle, raw hospital length of stay indays (vertical axis), with 95% confidence inter-vals, plotted against calendar year. Bottom, meanpredicted intensive care unit length of stay indays (vertical axis), with 95% confidence inter-vals, plotted against calendar year. pred., pre-dicted; connected triangle symbol line, point es-timate; shaded area, 95% confidence intervals.
Table 3. Raw intensive care unit (ICU) and hospital mortality and Acute Physiology and Chronic Health Evaluation (APACHE) III score (mean, SD): ICUtype by calendar year
HospitalAdmission
Year
Overalla
ICUMortality
Overallb
HospitalMortality
Rurala
ICUMortality
Ruralb
HospitalMortality
RuralAPACHE III
MetroICU
Mortality
MetroHospitalMortality
MetroAPACHE III
Tertiaryb
ICUMortality
Tertiaryb
HospitalMortality
TertiaryAPACHE III
Privatea
ICUMortality
Privatea
HospitalMortality
PrivateAPACHE III
1993 0.12 0.183 0.06 0.11 47.8 (32.1) 0.10 0.17 62.4 (34.5) 0.13 0.19 58.4 (40.0) NR NR NR1994 0.12 0.171 0.07 0.09 40.7 (26.0) 0.11 0.19 61.0 (34.0) 0.15 0.2 58.1 (32.7) 0.09 0.14 46.7 (26.7)1995 0.11 0.163 0.07 0.10 42.1 (28.2) 0.09 0.14 48.7 (32.6) 0.14 0.2 58.1 (33.1) 0.09 0.14 49.7 (29.1)1996 0.11 0.164 0.07 0.11 41.8 (28.1) 0.09 0.14 48.9 (31.2) 0.14 0.21 56.3 (31.7) 0.07 0.11 47.5 (26.8)1997 0.11 0.159 0.08 0.12 42.3 (28.8) 0.10 0.14 52.0 (31.4) 0.13 0.19 56.1 (31.8) 0.07 0.11 48.5 (27.0)1998 0.11 0.164 0.07 0.11 43.0 (29.5) 0.11 0.16 57.1 (33.2) 0.11 0.18 53.8 (30.7) 0.08 0.11 50.0 (28.0)1999 0.10 0.158 0.10 0.13 45.0 (31.1) 0.10 0.15 55.4 (31.6) 0.11 0.17 52.2 (30.3) 0.06 0.11 51.5 (29.8)2000 0.11 0.174 0.11 0.15 47.5 (29.0) 0.12 0.18 57.3 (32.3) 0.12 0.19 55.5 (31.2) 0.04 0.09 45.9 (23.8)2001 0.10 0.161 0.11 0.16 49.4 (30.7) 0.11 0.16 56.7 (31.8) 0.11 0.18 54.5 (30.8) 0.04 0.08 45.4 (23.6)2002 0.10 0.156 0.10 0.14 49.1 (29.5) 0.10 0.16 56.1 (31.2) 0.12 0.18 55.7 (30.5) 0.05 0.09 44.4 (24.5)2003 0.09 0.148 0.08 0.12 46.4 (29.0) 0.11 0.17 54.4 (29.9) 0.11 0.18 56.0 (30.0) 0.04 0.07 43.9 (23.3)
Metro, metropolitan; NR, not recorded in the database.ap � .01 for linear trend; bp � .05 for linear trend.
49Crit Care Med 2008 Vol. 36, No. 1

ues and 95% CIs, are displayed in Appen-dix 1, columns 2–5. The VIF and CN forthe final model, with only age andAPACHE III score centered, were 8.53and 68.1, respectively, indicating modestmulticollinearity. With calendar year alsocentered, VIF and CN fell to acceptablevalues of 4.2 and 23.7, respectively.
The most important model variables,indexed by the magnitude of the modelchi-squared (Appendix 1, column 6), werepatient variables: APACHE III score andits quadratic form, age and interactionwith APACHE III score, ICU admissionprimary organ system dysfunction andinteractions with APACHE III score, pa-tient surgical status and interaction withprimary organ system dysfunction, andmechanical ventilation and interactions.ICU hospital level, year-site admission
number, and geographic-demographicvariables, as main effects, had lesser im-pact. Other noteworthy components ofthe model were as follows:
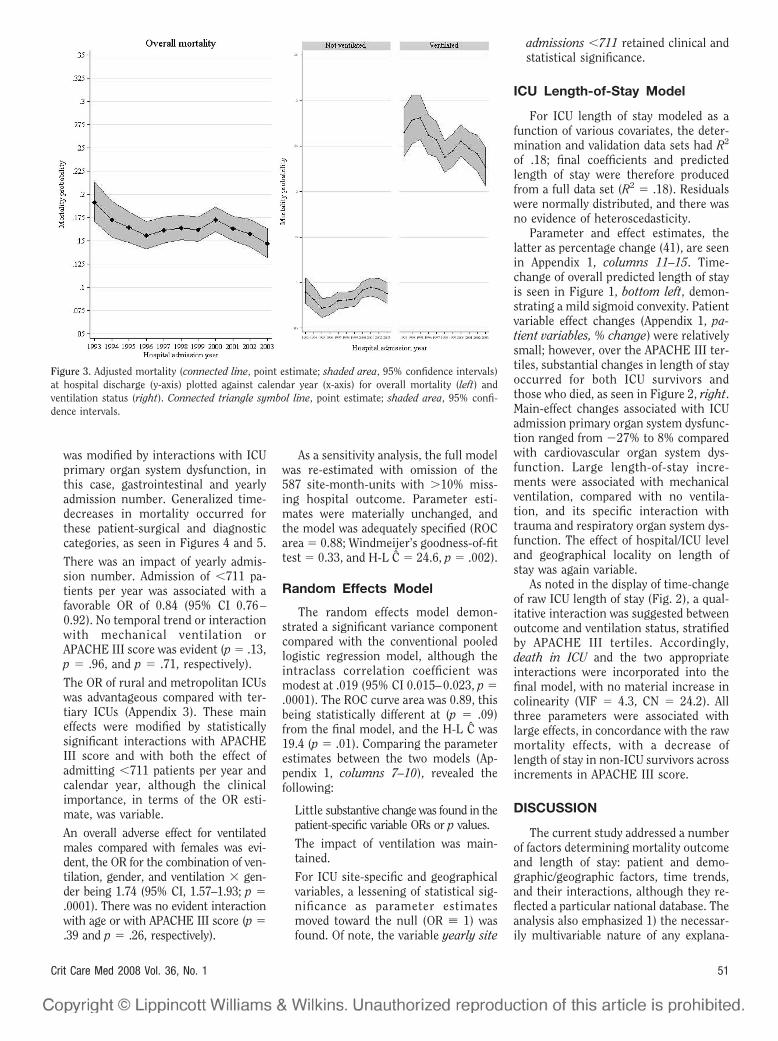
There was decline in overall adjustedmortality from 0.19 (95% CI 0.17–0.21)in 1993 to 0.15 (95% CI 0.13–0.16) in2003, as seen in Figure 3, left, the rate ofdecline decreasing and tending to re-verse between the years 1996 and 2000.With no time interactions, mortalityshowed a significant, albeit modest de-crease over time as a simple quadratic(likelihood ratio test, p � .0001; calendaryear, 0.987 [95% CI 0.982, 0.992]; calen-dar year squared, 0.997 [95% CI 0.995,0.999]). This main-effect estimate wassubsequently modified, by interactionsdeveloped within the final model (Appen-
dix 1, calendar year effects, and time ef-fect of geographical determinants, re-spectively).
Adverse mechanical-ventilation mortal-ity outcomes showed a distinct trend forimprovement, as shown in Figure 3,right: 1993, 0.26 (95% CI 0.24–0.29) to2003, 0.23 (95% CI 0.21–0.25). This wasnot evident for those not initially venti-lated. A similar time-decrease of overallraw mortality occurred in ventilated butnot in nonventilated patients (p � .01and p � .1, respectively).
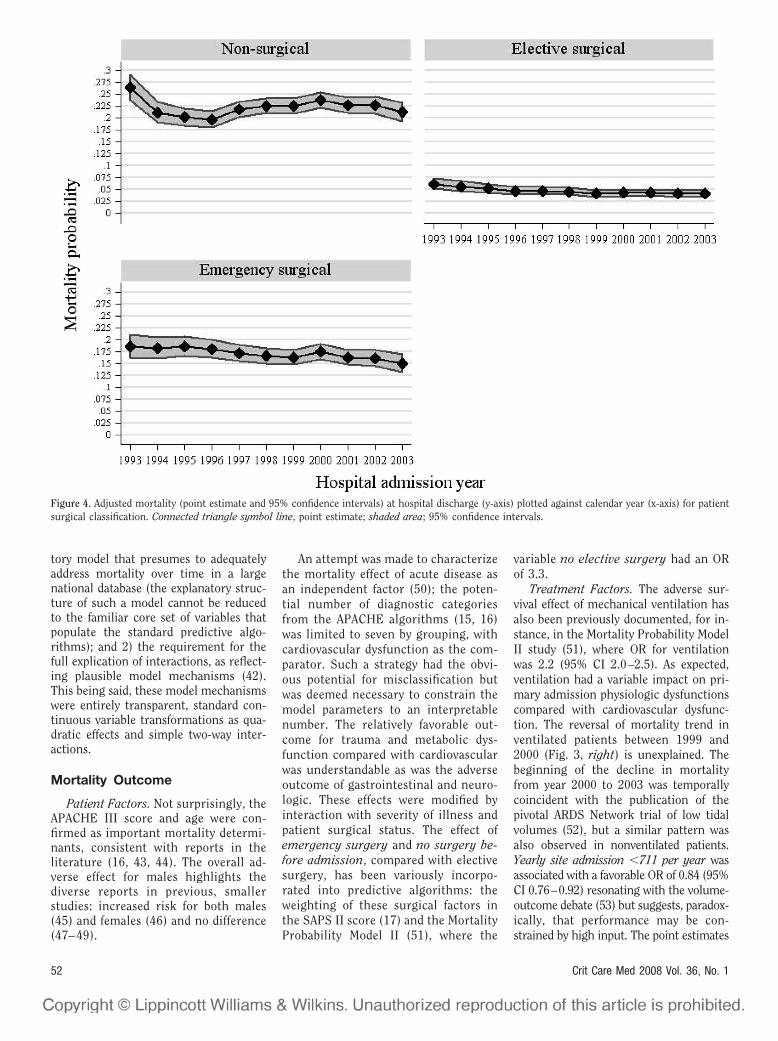
Surgical patients fared better thannonsurgical patients (Fig. 4). Althoughthe main effects, emergency vs. elec-tive surgery (OR 2.86, 95% CI 2.44–3.34, p � .0001), suggested a worseoutcome for emergency surgery, this
Figure 2. Left, mean raw intensive care unit (ICU) length of stay for (intensive care unit) survivors/nonsurvivors, by ventilation status, stratified by AcutePhysiology and Chronic Health Evaluation (APACHE) III tertiles plotted against calendar year (horizontal axis). Squares, APACHE III scores 0–36; triangles,APACHE III scores 37–60; diamonds, APACHE III scores 61–216; pred., predicted; connected line, point estimate; shaded area, 95% confidence intervals.Right, mean predicted intensive care unit length of stay for (intensive care unit) survivors/nonsurvivors, by ventilation status, stratified by APACHE IIItertiles plotted against calendar year (horizontal axis). Squares, APACHE III scores 0–36; triangles, APACHE III scores 37–60; diamonds, APACHE III scores61–216; pred., predicted; connected line, point estimate; shaded area, 95% confidence intervals. No consistent 95% confidence intervals were obtained forcalendar year 1993 for the patient category died in ICU ventilated for APACHE III scores 0–36 (for both mean raw intensive care unit length of stay andmean predicted intensive care unit length of stay); point estimates only are given.
50 Crit Care Med 2008 Vol. 36, No. 1
was modified by interactions with ICUprimary organ system dysfunction, inthis case, gastrointestinal and yearlyadmission number. Generalized time-decreases in mortality occurred forthese patient-surgical and diagnosticcategories, as seen in Figures 4 and 5.
There was an impact of yearly admis-sion number. Admission of �711 pa-tients per year was associated with afavorable OR of 0.84 (95% CI 0.76–0.92). No temporal trend or interactionwith mechanical ventilation orAPACHE III score was evident (p � .13,p � .96, and p � .71, respectively).
The OR of rural and metropolitan ICUswas advantageous compared with ter-tiary ICUs (Appendix 3). These maineffects were modified by statisticallysignificant interactions with APACHEIII score and with both the effect ofadmitting �711 patients per year andcalendar year, although the clinicalimportance, in terms of the OR esti-mate, was variable.
An overall adverse effect for ventilatedmales compared with females was evi-dent, the OR for the combination of ven-tilation, gender, and ventilation � gen-der being 1.74 (95% CI, 1.57–1.93; p �.0001). There was no evident interactionwith age or with APACHE III score (p �.39 and p � .26, respectively).
As a sensitivity analysis, the full modelwas re-estimated with omission of the587 site-month-units with �10% miss-ing hospital outcome. Parameter esti-mates were materially unchanged, andthe model was adequately specified (ROCarea � 0.88; Windmeijer’s goodness-of-fittest � 0.33, and H-L C � 24.6, p � .002).
Random Effects Model
The random effects model demon-strated a significant variance componentcompared with the conventional pooledlogistic regression model, although theintraclass correlation coefficient wasmodest at .019 (95% CI 0.015–0.023, p �.0001). The ROC curve area was 0.89, thisbeing statistically different at (p � .09)from the final model, and the H-L C was19.4 (p � .01). Comparing the parameterestimates between the two models (Ap-pendix 1, columns 7–10), revealed thefollowing:
Little substantive change was found in thepatient-specific variable ORs or p values.
The impact of ventilation was main-tained.
For ICU site-specific and geographicalvariables, a lessening of statistical sig-nificance as parameter estimatesmoved toward the null (OR � 1) wasfound. Of note, the variable yearly site
admissions �711 retained clinical andstatistical significance.
ICU Length-of-Stay Model
For ICU length of stay modeled as afunction of various covariates, the deter-mination and validation data sets had R2
of .18; final coefficients and predictedlength of stay were therefore producedfrom a full data set (R2 � .18). Residualswere normally distributed, and there wasno evidence of heteroscedasticity.
Parameter and effect estimates, thelatter as percentage change (41), are seenin Appendix 1, columns 11–15. Time-change of overall predicted length of stayis seen in Figure 1, bottom left, demon-strating a mild sigmoid convexity. Patientvariable effect changes (Appendix 1, pa-tient variables, % change) were relativelysmall; however, over the APACHE III ter-tiles, substantial changes in length of stayoccurred for both ICU survivors andthose who died, as seen in Figure 2, right.Main-effect changes associated with ICUadmission primary organ system dysfunc-tion ranged from �27% to 8% comparedwith cardiovascular organ system dys-function. Large length-of-stay incre-ments were associated with mechanicalventilation, compared with no ventila-tion, and its specific interaction withtrauma and respiratory organ system dys-function. The effect of hospital/ICU leveland geographical locality on length ofstay was again variable.
As noted in the display of time-changeof raw ICU length of stay (Fig. 2), a qual-itative interaction was suggested betweenoutcome and ventilation status, stratifiedby APACHE III tertiles. Accordingly,death in ICU and the two appropriateinteractions were incorporated into thefinal model, with no material increase incolinearity (VIF � 4.3, CN � 24.2). Allthree parameters were associated withlarge effects, in concordance with the rawmortality effects, with a decrease oflength of stay in non-ICU survivors acrossincrements in APACHE III score.
DISCUSSION
The current study addressed a numberof factors determining mortality outcomeand length of stay: patient and demo-graphic/geographic factors, time trends,and their interactions, although they re-flected a particular national database. Theanalysis also emphasized 1) the necessar-ily multivariable nature of any explana-
Figure 3. Adjusted mortality (connected line, point estimate; shaded area, 95% confidence intervals)at hospital discharge (y-axis) plotted against calendar year (x-axis) for overall mortality (left) andventilation status (right). Connected triangle symbol line, point estimate; shaded area, 95% confi-dence intervals.
51Crit Care Med 2008 Vol. 36, No. 1
tory model that presumes to adequatelyaddress mortality over time in a largenational database (the explanatory struc-ture of such a model cannot be reducedto the familiar core set of variables thatpopulate the standard predictive algo-rithms); and 2) the requirement for thefull explication of interactions, as reflect-ing plausible model mechanisms (42).This being said, these model mechanismswere entirely transparent, standard con-tinuous variable transformations as qua-dratic effects and simple two-way inter-actions.
Mortality Outcome
Patient Factors. Not surprisingly, theAPACHE III score and age were con-firmed as important mortality determi-nants, consistent with reports in theliterature (16, 43, 44). The overall ad-verse effect for males highlights thediverse reports in previous, smallerstudies: increased risk for both males(45) and females (46) and no difference(47– 49).
An attempt was made to characterizethe mortality effect of acute disease asan independent factor (50); the poten-tial number of diagnostic categoriesfrom the APACHE algorithms (15, 16)was limited to seven by grouping, withcardiovascular dysfunction as the com-parator. Such a strategy had the obvi-ous potential for misclassification butwas deemed necessary to constrain themodel parameters to an interpretablenumber. The relatively favorable out-come for trauma and metabolic dys-function compared with cardiovascularwas understandable as was the adverseoutcome of gastrointestinal and neuro-logic. These effects were modified byinteraction with severity of illness andpatient surgical status. The effect ofemergency surgery and no surgery be-fore admission, compared with electivesurgery, has been variously incorpo-rated into predictive algorithms: theweighting of these surgical factors inthe SAPS II score (17) and the MortalityProbability Model II (51), where the
variable no elective surgery had an ORof 3.3.
Treatment Factors. The adverse sur-vival effect of mechanical ventilation hasalso been previously documented, for in-stance, in the Mortality Probability ModelII study (51), where OR for ventilationwas 2.2 (95% CI 2.0–2.5). As expected,ventilation had a variable impact on pri-mary admission physiologic dysfunctionscompared with cardiovascular dysfunc-tion. The reversal of mortality trend inventilated patients between 1999 and2000 (Fig. 3, right) is unexplained. Thebeginning of the decline in mortalityfrom year 2000 to 2003 was temporallycoincident with the publication of thepivotal ARDS Network trial of low tidalvolumes (52), but a similar pattern wasalso observed in nonventilated patients.Yearly site admission �711 per year wasassociated with a favorable OR of 0.84 (95%CI 0.76–0.92) resonating with the volume-outcome debate (53) but suggests, paradox-ically, that performance may be con-strained by high input. The point estimates
Figure 4. Adjusted mortality (point estimate and 95% confidence intervals) at hospital discharge (y-axis) plotted against calendar year (x-axis) for patientsurgical classification. Connected triangle symbol line, point estimate; shaded area; 95% confidence intervals.
52 Crit Care Med 2008 Vol. 36, No. 1

of the interactions of median yearly ICUadmission number with both ICU level andsurgical status, and the model chi-squaredof these interactions (Appendix 1, column6), suggested considerable determinacy(54), although there were no interactionswith age and APACHE III score. Yearly siteadmission �711 per year was presumably asurrogate for factors like the adverse effectsof excessive staff workload (55) or patienttransfer (56).
Geographic Determinants. Mortalityvariations by geographical areas (13,57) and hospital category (12) (Appen-dix 3) have been reported from differentcountries. Again, these geographicalfactor variables are presumably surro-gates for determinants such as alloca-tion of resources, human and nonhu-man factors (11, 58, 59), andsocioeconomic factors (60) that werenot captured in the database.
ICU Length of Stay
The performance of the length-of-staymodel (R2 � .18) was modest but consis-
tent with previously reports, R2 � .13(21) to R2 � .21 (24), although in thelatter study, ICU length of stay was trun-cated to 23 days (99th percentile). Obvi-ously, the degree of explained variation oflength of stay was limited but again con-sistent with the performance of other re-gression models using skewed data, forinstance, costs (61). For linear regressionmodels with log transformation,Rapoport et al. (20) found a “somewhathigher R2 (. . . 0.26 . . .) than the equationusing the untransformed variable,” andRender et al. (24) found similar results.In the current study, estimation with logICU length of stay resulted in substantiveincrements in R2 from .18 to .28, consis-tent with standard precepts (37).
The magnitude of time-variation ofmean predicted ICU length of stay was�0.4 days, with no overall clinically sig-nificant change, 1993 vs. 2003. The re-corded time-changes in ICU length ofstay in the literature have been relativelysmall, less than one calendar day (14, 19,21), and also of questionable clinical sig-
nificance. It was also unclear from thesestudies how length of stay was initiallyrecorded, that is, in whole days or hours(22). Both Rosenberg et al. (21) and Sirioet al. (14), over 4- to 6-yr periods in the1990s, reported fractional day decreasesin ICU length of stay of 0.11 and 0.2,respectively, in the context of significantand varying percentages of coronary careadmissions (6.2% to 20.8%). Both studiesrecorded concomitant decreases in hos-pital length of stay, 3 and 1.9 days, re-spectively, but the increased rate of pa-tient discharge over time to skillednursing facilities confounded the time-decrease of hospital length of stay andstandardized mortality ratio found in theSirio et al. study (14). In contradistinc-tion to these studies, the current data-base recorded only a small percentage ofmyocardial infarction patients (1.7%),and no substantive change in dischargepractice/destination appeared to have oc-curred over the whole study period.
Patient Variables. ICU length of stayhas usually been characterized within a
Figure 5. Adjusted mortality (point estimate and 95% confidence intervals) at hospital discharge (y-axis) plotted against calendar year (x-axis) for intensive careunit admission primary organ system dysfunction. Connected triangle symbol line, point estimate; shaded area; 95% confidence intervals
53Crit Care Med 2008 Vol. 36, No. 1

developed algorithm (2, 14, 21, 23), inparticular APACHE III (16), which incor-porated predictive equations for length ofstay (2). The contribution of particularfactors to ICU length of stay, as percent-age of chi-squared, reported by Knaus etal. (2) in 16,622 patients were predomi-nately physiology (48.7%) and disease(34.1%), with relatively little by age(3.4%), chronic health (0.9%), region(3.2%), and hospital bed size (0.8%). Thecurrent model suggested considerable de-terminacy of disease, patient surgical sta-tus, and mechanical ventilation plus in-teractions, although the length-of-stayeffect across APACHE III score decileswas substantive (Fig. 2; Appendix 1, %change). These parameter changes wereconsistent with those studies where therewas independent modeling of length ofstay (18, 20).
Effect of ICU Death on Lengthof Stay
APACHE III score increments in survi-vors were associated with increases in ICUlength of stay, raw and predicted, in venti-lated and nonventilated patients in the ab-sence of significant changes in ICU mortal-ity across the strata. The general effect ofnonsurvival was to increase ICU length ofstay, more so in ventilated patients, butlength of stay was noted to decrease acrossthe APACHE III tertiles (Fig. 2; Appendix 1,ICU mortality status). This trend for sickerpatients to die earlier would appear intu-itively reasonable and finds support in thestudies of 1) Rapaport et al. (20), who de-scribed a � coefficient for Died of 0.68 as amain effect in the context of an interaction:SAPS II (43) mortality probability � Died(� coefficient �2.22); and 2) Woods et al.(23), who, using APACHE III-generatedmortality probabilities, noted severity-of-illness-dependent increases in length ofstay that plateaued at a predicted mortalityof 59% for survivors and for nonsurvivors adecrease in length of stay when predictedmortality was �30%. As ICU length of stayof survivors and nonsurvivors presumablyreflects an interaction, at some level, be-tween patient severity of illness and thetreating health professionals, it was of in-terest to note that the relationship, length-of-stay/survival status, was relatively con-sistent over a decade (Fig. 2), except for amild increase in ICU length of stay in ven-tilated survivors. This may reflect the par-ticular structure of critical care practice inAustralia and New Zealand being that of auniform training scheme of relatively long
history (62) and the almost exclusive pre-dominance of closed ICUs (59).
Time Trends
The unique feature of the currentanalysis was the ability to assess changeof outcomes in a national database over arelatively long period of time (11 yrs),although not every ICU was a contributorfor each calendar year. Analysis using arestricted model with continuously con-tributing ICUs year by year could havebeen performed, but this would have ad-dressed a quite different question and, fornonbiased estimation, would have re-quired the specific modeling of missing-ness or selection for the database as ap-plied to ICU participation. However, thefocus of the current article was to reporta binational experience in terms of theaggregate outcome of all assessable data-base patients.
The problems associated with time-limited cross-sectional league tables werethus avoided, although the focus was noton individual ICU performance (63). Theprecise relationship between the overallmortality decrements and specific thera-peutic innovations, such as noninvasive(64) and low-volume ventilation (52), ac-tivated protein C (65), low-dose cortico-steroids (66), and intensive insulin ther-apy (67), was not evident from thisaggregate analysis. Generalized mildmortality decreases occurred over variousICU categorical descriptors, although amodest overall mortality decrease oc-curred beyond calendar-year 2000, fromwhen it could be surmised that such in-novations may have been introduced(Fig. 3). Temporal improvements in out-comes, over prolonged periods, have beennoted for general medical patients (57,68) and in the critically ill for specificconditions (40, 64, 69), although this wasnot the case in a recent study (49) forventilated patients over the period 1992–2000. It is perhaps more likely that ob-served overall mortality decreases were afunction of general improvements in ICUcare, as been argued (64), rather than theimpact of specific innovations, whichmay not have been widely implementedor fulfilled initial promise (70). Thiswould be consistent with the cautionsregarding “regression artifacts” in causalinference from Campbell’s landmarkstudy on interventions and longitudinaldata (71).
Critique of Methodology
The data used in the study were col-lected over a long period of time, andissues like on-site data collection qualitycontrol could not be optimally addressed.Furthermore, criteria for patient admis-sion were not standardized among thecontributing ICUs over this period. Al-though the mortality model demon-strated excellent calibration and discrim-ination, the random effects analysisdemonstrated, perhaps not surprisingly,residual heterogeneity and was preferredon formal statistical testing. As was ex-pected, random effects parameter esti-mates moved toward the null. The statis-tical and clinical significance of patientvariables was generally preserved; theICU level and geographical variables,which were likely to be surrogates formore specific nonmodeled variables,tended to lose significance. To this ex-tent, the analysis concurred with that ofSilber et al. (26), who, in a large study of73,174 patients in 137 hospitals, ad-dressed “which outcomes vary with hos-pital rather than patient characteristics”and located “most of the predictable vari-ation” in patient characteristics. Morecomplex hierarchical models incorporat-ing patients within ICU-year-units,within ICU levels, and within localitiescould potentially address these issues(34). Similarly, potential inferential prob-lems in the length-of-stay model associ-ated with an outcome measure (death inICU) as an independent variable couldalso be addressed using a treatment-effects approach, in which the effect of anendogenous binary treatment variable(death in ICU) on a continuous variable isestimated (72). This being said, observa-tional studies, however analyzed, are not“natural experiments” (the illusion of sta-tistical control) (73), and the tendency tothink of all regression coefficients ascausal effects cannot be sustained (74).
CONCLUSIONS
Overall risk-adjusted mortality in crit-ically ill patients in a large national data-base declined over an 11-yr period, as didthat for ventilated patients. This time-change of mortality was variably reflectedin patient and organizational factors. Nooverall decline in risk-adjusted ICUlength of stay was demonstrated over thesame period. Although the analytic mod-els that were employed demonstratedgood performance, the relationship of the
54 Crit Care Med 2008 Vol. 36, No. 1

observed changes in outcomes over timeto therapeutic innovations was uncertain.
REFERENCES
1. Afessa B, Keegan MT, Hubmayr RD, et al:Evaluating the performance of an institutionusing an intensive care unit benchmark.Mayo Clin Proc 2005; 80:174–180
2. Knaus WA, Wagner DP, Zimmerman JE,et al: Variations in mortality and length ofstay in intensive care units. Ann Intern Med1993; 118:753–761
3. Moran JL, Solomon PJ: Mortality and otherevent rates: What do they tell us about per-formance? Crit Care Resusc 2003; 5:292–303
4. Thomas JW, Guire KE, Horvat GG: Is patientlength of stay related to quality of care? HospHealth Serv Adm 1997; 42:489–507
5. The Australian and New Zealand IntensiveCare Society. http://www.anzics.com.au/. Ac-cessed November 1, 2005
6. Project IMPACT CCM I. Project IMPACTCCM, Inc. http://www.cerner.com/piccm/about.html. Accessed November 1, 2006
7. Intensive Care National Audit & ResearchCentre. http://www.icnarc.org.htm. AccessedNovember 1, 2005
8. Clough JD, Engler D, Canuto PE: ClevelandHealth Quality Choice was a failure, not amartyr. Qual Saf Health Care 2002; 11:391
9. The Leapfrog Group. http://www.leapfrog-group.org/. Accessed November 1, 2005
10. Stow PJ, Hart GK, Higlett T, et al: Develop-ment and implementation of a high-qualityclinical database: The Australian and NewZealand Intensive Care Society Adult PatientDatabase. J Crit Care 2006; 21:133–141
11. Bastos PG, Knaus WA, Zimmerman JE, et al:The importance of technology for achievingsuperior outcomes from intensive care. Bra-zil APACHE III Study Group. Intensive CareMed 1996; 22:664–669
12. Gordon HS, Aron DC, Fuehrer SM, et al:Using severity-adjusted mortality to compareperformance in a Veterans Affairs hospitaland in private-sector hospitals. Am J MedQual 2000; 15:207–211
13. Manheim LM, Feinglass J, Shortell SM, et al:Regional variation in Medicare hospital mor-tality. Inquiry 1992; 29:55–66
14. Sirio CA, Shepardson LB, Rotondi AJ, et al:Community-wide assessment of intensivecare outcomes using a physiologically basedprognostic measure: Implications for criticalcare delivery from Cleveland Health QualityChoice. Chest 1999; 115:793–801
15. Knaus WA, Draper EA, Wagner DP, et al:APACHE II: A severity of disease classifica-tion system. Crit Care Med 1985; 13:818–829
16. Knaus WA, Wagner DP, Draper EA, et al: TheAPACHE III prognostic system: Risk predic-tion of hospital mortality for critically illhospitalized adults. Chest 1991; 100:1619–1636
17. Le Gall JR, Lemeshow S, Saulnier F: A newSimplified Acute Physiology Score (SAPS II)
based on a European/North American multi-center study. JAMA 1993; 270:2957–2963
18. Angus DC, Linde-Zwirble WT, Sirio CA, et al:The effect of managed care on ICU length ofstay: Implications for Medicare. JAMA 1996;276:1075–1082
19. Eagle KA, Mulley AG, Skates SJ, et al: Lengthof stay in the intensive care unit: Effects ofpractice guidelines and feedback. JAMA 1990;264:992–997
20. Rapoport J, Teres D, Zhao Y, et al: Length ofstay data as a guide to hospital economicperformance for ICU patients. Med Care2003; 41:386–397
21. Rosenberg AL, Zimmerman JE, Alzola C,et al: Intensive care unit length of stay: re-cent changes and future challenges. CritCare Med 2000; 28:3465–3473
22. Marik PE, Hedman L: What’s in a day? De-termining intensive care unit length of stay.Crit Care Med 2000; 28:2090–2093
23. Woods AW, MacKirdy FN, Livingston BM, etal: Evaluation of predicted and actual lengthof stay in 22 Scottish intensive care unitsusing the APACHE III system. Acute Physi-ology and Chronic Health Evaluation. Anaes-thesia 2000; 55:1058–1065
24. Render ML, Kim HM, Deddens J, et al: Vari-ation in outcomes in Veterans Affairs inten-sive care units with a computerized severitymeasure. Crit Care Med 2005; 33:930–939
25. Sirio CAM, Tajimi KM, Taenaka NM, et al: Across-cultural comparison of critical care de-livery: Japan and the United States. Chest2002; 121:539–548
26. Silber JH, Rosenbaum PR, Ross R: Compar-ing the contributions of groups of predictors:Which outcomes vary with hospital ratherthan patient characteristics. J Am Stat Assoc1995; 90:7–18
27. DiGiuseppe DL, Aron DC, Payne SM, et al:Risk adjusting cesarean delivery rates: Acomparison of hospital profiles based onmedical record and birth certificate data.Health Serv Res 2001; 36:959–977
28. Justice AC, Covinsky KE, Berlin JA: Assessingthe generalizability of prognostic informa-tion. Ann Intern Med 1999; 130:515–524
29. ANZICS Adult Data Base. Data DictionaryVersion 1.5. http://www.anzics.com.au/uploads/ANZICS_APD_Data_Dictionary_Version2.1_sept07.pdf. Accessed September1, 2007
30. Lee AH, Xiao J, Vemuri SR, et al: A discor-dancy test approach to identify outliers oflength of hospital stay. Stat Med 1998; 17:2199–2206
31. Gutierrez R, Drukker DM: Citing referencesfor Stata’s cluster-correlated robust varianceestimates. http://www.stata.com/support/faqs/stat/robust_ref.html. Accessed Novem-ber 2006
32. Belsley DA: Conditioning Diagnostics, Col-linearity and Weak Data in Regression. NewYork, Wiley, 1991
33. Hilbe J. sqv5: unilogit. Univariate log-likelihood tests for model identification.
Stata Technical Bulletin Reprints 1993;2:172–174
34. Cox DR, Solomon PJ: Components of Vari-ance. Boca Raton, FL, Chapman & Hall/CRCPress, 2003
35. Rabe-Hesketh S, Pickles A, Taylor C: sg129:Generalized linear latent and mixed models.Stata Technical Bulletin Reprints 2000;9:293–306
36. Duan N: Smearing estimate: A nonparamet-ric retransformation method. J Am Stat As-soc 1983; 78:605–610
37. Scott A, Wild C: Transformations and R2. AmStat 1991; 45:127–129
38. Thomas JW, Ashcraft ML: Measuring severityof illness: Six severity systems and their abil-ity to explain cost variations. Inquiry 1991;28:39–55
39. Harrell FE Jr: Regression Modelling Strate-gies: With Applications to Linear Models, Lo-gistic Regression, and Survival Analysis. NewYork, Springer-Verlag, 2001
40. Milberg JA, Davis DR, Steinberg KP, et al:Improved survival of patients with acute re-spiratory distress syndrome (ARDS):1983–1993. JAMA 1995; 273:306–309
41. Goldstein R. srd8: logdummy. Stata Techni-cal Bulletin Reprints 1992; 1:183–184
42. Greenland S: Basic problems in interactionassessment. Environ Health Perspect 1993;101(Suppl 4):59–66
43. Chelluri L, Grenvik A, Silverman M: Inten-sive care for critically ill elderly: Mortality,costs, and quality of life. Review of the liter-ature. Arch Intern Med 1995; 155:1013–1022
44. Chernow B: Variables affecting outcome incritically ill patients. Chest 1999; 115:71S–76S
45. Reinikainen M, Niskanen M, Uusaro A, et al:Impact of gender on treatment and outcomeof ICU patients. Acta Anaesthesiol Scand2005; 49:984–990
46. Kollef MH, O’Brien JD, Silver P: The impactof gender on outcome from mechanical ven-tilation. Chest 1997; 111:434–441
47. Epstein SK, Vuong V: Lack of influence ofgender on outcomes of mechanically venti-lated medical ICU patients. Chest 1999; 116:732–739
48. Esteban A, Anzueto A, Frutos F, et al: Char-acteristics and outcomes in adult patientsreceiving mechanical ventilation: A 28-dayinternational study. JAMA 2002; 287:345–355
49. Needham DM, Bronskill SE, Sibbald WJ,et al: Mechanical ventilation in Ontario,1992–2000: Incidence, survival, and hospitalbed utilization of noncardiac surgery adultpatients. Crit Care Med 2004; 32:1504–1509
50. Wagner DP, Knaus WA, Draper EA: Physio-logic abnormalities and outcome from acutedisease: Evidence for a predictable relation-ship. Arch Intern Med 1986; 146:1389–1396
51. Lemeshow S, Teres D, Klar J, et al: MortalityProbability Models (MPM II) based on aninternational cohort of intensive care unitpatients. JAMA 1993; 270:2478–2486
52. Authors for the ARDS Network: Ventilation
55Crit Care Med 2008 Vol. 36, No. 1

with lower tidal volumes as compared withtraditional tidal volumes for acute lung in-jury and the acute respiratory distress syn-drome. The Acute Respiratory Distress Syn-drome Network. N Engl J Med 2000; 342:1301–1318
53. Halm EA, Lee C, Chassin MR: Is volumerelated to outcome in health care? A system-atic review and methodologic critique of theliterature. Ann Intern Med 2002; 137:511–520
54. Farley DE, Ozminkowski RJ: Volume-outcome relationships and in-hospital mor-tality: The effect of changes in volume overtime. Med Care 1992; 30:77–94
55. Tarnow-Mordi WO, Hau C, Warden A, et al:Hospital mortality in relation to staff work-load: A 4-year study in an adult intensive-care unit. Lancet 2000; 356:185–189
56. Rosenberg AL, Hofer TP, Strachan C, et al:Accepting critically ill transfer patients: Ad-verse effect on a referral center’s outcomeand benchmark measures. Ann Intern Med2003; 138:882–890
57. Jarman B, Gault S, Alves B, et al: Explainingdifferences in English hospital death ratesusing routinely collected data. BMJ 1999;318:1515–1520
58. Aiken LHP, Clarke SPP, Sloane DMP, et al:Hospital nurse staffing and patient mortality,nurse burnout, and job dissatisfaction. JAMA2002; 288:1987–1993
59. Pronovost PJ, Angus DC, Dorman T, et al:Physician staffing patterns and clinical out-comes in critically ill patients: A systematicreview. JAMA 2002; 288:2151–2162
60. Hutchings A, Raine R, Brady A, et al: Socio-economic status and outcome from intensivecare in England and Wales. Med Care 2004;42:943–951
61. Diehr P, Yanez D, Ash A, et al: Methods foranalyzing health care utilization and costs.Annu Rev Public Health 1999; 20:125–144
62. Joint Faculty of Intensive Care Medicine.
Joint Faculty of Intensive Care Medicine:History. http://www.jficm.anzca.edu.au/about/history/index.htm. Accessed May 16,2006
63. Luft HS, Romano PS: Chance, continuity,and change in hospital mortality rates: Cor-onary artery bypass graft patients in Califor-nia hospitals, 1983 to 1989. JAMA 1993; 270:331–337
64. Azoulay E, Alberti C, Bornstain C, et al: Im-proved survival in cancer patients requiringmechanical ventilatory support: Impact ofnoninvasive mechanical ventilatory support.Crit Care Med 2001; 29:519–525
65. Bernard GR, Vincent JL, Laterre PF, et al:Efficacy and safety of recombinant humanactivated protein C for severe sepsis. N EnglJ Med 2001; 344:699–709
66. Minneci PC, Deans KJ, Banks SM, et al: Cor-ticosteroids for septic shock. Ann Intern Med2004; 141:742–743
67. van den Berghe G, Wouters P, Weekers F,et al: Intensive insulin therapy in the criti-cally ill patients. N Engl J Med 2001; 345:1359–1367
68. Jencks SF, Huff ED, Cuerdon T: Change inthe quality of care delivered to Medicare ben-eficiaries, 1998–1999 to 2000–2001. JAMA2003; 289:305–312
69. Friedman G, Silva E, Vincent JL: Has themortality of septic shock changed with time.Crit Care Med 1998; 26:2078–2086
70. Webb SA: Sepsis outcomes have improved,but why? Crit Care Resusc 2007; 9:5–7
71. Campbell DT: Regression artifacts in time-series and longitudinal data. Eval ProgramPlann 1996; 19:377–389
72. Stukel TA, Fisher ES, Wennberg DE, et al:Analysis of observational studies in the pres-ence of treatment selection bias: Effects ofinvasive cardiac management on ami sur-vival using propensity score and instrumen-tal variable methods. JAMA 2007; 297:278–285
73. Christenfeld NJ, Sloan RP, Carroll D, et al:Risk factors, confounding, and the illusion ofstatistical control. Psychosom Med 2004; 66:868–875
74. Schafer JL: Marginal modeling of intensivelongitudinal data by generalized estimatingequations. In: Models for Intensive Longitu-dinal Data. Walls TA, Schafer JL (Eds). Ox-ford University Press, New York, 2006, pp38–62
75. Kuha J: AIC and BIC: Comparisons of as-sumptions and performance. Sociol MethodsRes 2005; 33:188–229
76. Hanley JA, McNeil BJ: The meaning and useof the area under a receiver operating char-acteristic (ROC) curve. Radiology 1982; 143:29–36
77. Weesie J: sg87: Windmeijer’s goodness-of-fittest for logistic regression. Stata TechnicalBulletin Reprints 1999; 8:153–160
78. Hosmer DW, Lemeshow S: Applied LogisticRegression. Second Edition. New York:Wiley, 2000
79. Rowan KM, Kerr JH, Major E, et al: IntensiveCare Society’s APACHE II study in Britainand Ireland—I: Variations in case mix ofadult admissions to general intensive careunits and impact on outcome. BMJ 1993;307:972–977
80. Halvorsen R, Palmquist R: The interpretationof dummy variables in semilogarithmicequations. Am Econ Rev 1980; 70:474–475
81. Nieto FJ, Coresh J: Adjusting survival curvesfor confounders: A review and a new method.Am J Epidemiol 1996; 143:1059–1068
82. Ai C, Norton EC: Interaction terms in logitand probit models. Econ Lett 2003; 80:123–129
83. Rabe-Hesketh S, Everitt B: Summary mea-sure analysis of longitudinal data. In: AHandbook of Statistical Analyses using Stata.Rabe-Hesketh S, Everitt B (Eds). Boca Raton,FL, Chapman & Hall/CRC Press, 2007, pp.157–172
56 Crit Care Med 2008 Vol. 36, No. 1

APPENDIX 1
Models for hospital mortality and intensive care unit (ICU) length of stay
Variable LR p95%CIL
95%CIU
Model�2 gllamm p
95%CIL
95%CIU
OLSLog p
95%CIL
95%CIU
%Change
Patient variables
Age 1.0226 .000 1.0207 1.0245 6527.1 1.0227 .000 1.0209 1.0246 �0.0047 0.0000 �0.0052 �0.0042 �0.47
Age squared 1.0001 .002 1.0000 1.0001 543.5 1.0001 .001 1.0000 1.0001 �0.0002 0.0000 �0.0002 �0.0002 �0.019
APACHE III score 1.0585 .000 1.0555 1.0614 59688.2 1.0590 .000 1.0561 1.0620 0.0136 0.0000 0.0126 0.0145 1.37
APACHE III scoresquared
0.9999 .000 0.9999 0.9999 29299.6 0.9999 .000 0.9999 0.9999 �0.0001 0.0000 �0.0001 0.0000 �0.005
Age � APACHE IIIscore
0.9998 .000 0.9997 0.9998 1385.4 0.9998 .000 0.9998 0.9998 0.0000 0.4840 0.0000 0.0000 �0.001
Gender 1.1623 .000 1.1095 1.2176 2.8 1.1575 .000 1.1060 1.2113 0.0141 0.0070 0.0038 0.0243 1.41
ICU admission primaryorgan systemdysfunction
Gastrointestinal 1.1439 .003 1.0480 1.2487 2.3 1.1224 .009 1.0294 1.2238 0.0663 0.0010 0.0271 0.1054 6.832
Metabolic 0.2300 .000 0.1901 0.2781 2618 0.2248 .000 0.1860 0.2717 �0.3241 0.0000 �0.3608 �0.2874 �27.69
Neurologic 1.4505 .000 1.2935 1.6264 390.5 1.4427 .000 1.2875 1.6166 �0.1639 0.0000 �0.2075 �0.1202 �15.1
Respiratory 1.3104 .000 1.2177 1.4102 31.5 1.3051 .000 1.2131 1.4042 0.0811 0.0000 0.0480 0.1143 8.44
Trauma 0.6553 .000 0.5657 0.7592 726.5 0.6474 .000 0.5577 0.7515 0.0401 0.1060 �0.0085 0.0887 4.06
Renal/genitourinary 0.7461 .000 0.6469 0.8605 280.3 0.7350 .000 0.6367 0.8485 �0.0497 0.0460 �0.0985 �0.0009 �4.88
Gastrointestinal �APACHE III score
0.9932 .000 0.9914 0.9951 6976 0.9934 .000 0.9916 0.9952 0.0010 0.0120 0.0002 0.0017 0.096
Neurologic � APACHEIII score
0.9959 .001 0.9934 0.9983 7839.8 0.9962 .002 0.9938 0.9986 �0.0065 0.0000 �0.0075 �0.0056 �0.65
Respiratory � APACHEIII score
0.9905 .000 0.9888 0.9922 8293.5 0.9908 .000 0.9891 0.9925 0.0008 0.0190 0.0001 0.0015 0.08
Metabolic � APACHEIII score
1.0017 .373 0.9980 1.0053 1636.5 1.0015 .419 0.9979 1.0051 0.0005 0.2200 �0.0003 0.0014 0.05
Trauma � APACHE IIIscore
1.0003 .802 0.9976 1.0031 4235.4 1.0006 .648 0.9980 1.0033 �0.0030 0.0000 �0.0041 �0.0019 �0.3
Renal/genitourinary �APACHE III score
0.9919 .000 0.9882 0.9956 1039.1 0.9918 .000 0.9881 0.9955 0.0032 0.0000 0.0022 0.0043 0.32
Patient surgical status
Elective surgery 0.1649 .000 0.1433 0.1897 10886.3 0.1829 .000 0.1603 0.2087 �0.3542 0.0000 �0.4078 �0.3006 �29.85
Emergency surgery 0.4709 .000 0.4244 0.5226 12.6 0.4704 .000 0.4236 0.5224 0.0151 0.6230 �0.0453 0.0756 1.476
Elective surgery �APACHE III score
1.0018 .135 0.9994 1.0042 6710.7 1.0018 .140 0.9994 1.0042 0.0009 0.0140 0.0002 0.0016 0.089
Emergency surgery �APACHE III score
1.0017 .039 1.0001 1.0034 7062.4 1.0016 .052 1.0000 1.0033 0.0028 0.0000 0.0022 0.0034 0.28
Gastrointestinal �elective surgery
2.6700 .000 2.3180 3.0754 1029.5 2.5755 .000 2.2400 2.9612 0.0430 0.1120 �0.0101 0.0961 4.35
Respiratory � electivesurgery
2.3458 .000 1.9965 2.7563 1356 2.1932 .000 1.8660 2.5778 �0.0897 0.0010 �0.1428 �0.0365 �8.58
Neurologic � electivesurgery
1.9203 .000 1.5942 2.3130 1099.1 1.8142 .000 1.5135 2.1747 0.0821 0.0030 0.0274 0.1367 8.51
Trauma � electivesurgery
2.2282 .000 1.7173 2.8913 525.4 2.1550 .000 1.6607 2.7965 �0.2664 0.0000 �0.3294 �0.2035 �23.43
Renal/genitourinary �elective surgery
2.0418 .000 1.5541 2.6825 750.3 1.9501 .000 1.4856 2.5598 0.0077 0.8380 �0.0664 0.0819 0.704
Gastrointestinal �emergency surgery
1.4079 .000 1.2500 1.5858 101.8 1.4123 .000 1.2528 1.5921 �0.2035 0.0000 �0.2597 �0.1474 �18.45
Respiratory �emergency surgery
1.2511 .009 1.0587 1.4784 127 1.2330 .014 1.0427 1.4581 �0.3712 0.0000 �0.4276 �0.3148 �31.04
Neurologic �emergency surgery
1.9549 .000 1.6868 2.2657 219.5 1.9244 .000 1.6620 2.2283 0.1202 0.0000 0.0610 0.1793 12.74
Trauma � emergencysurgery
1.6820 .000 1.4571 1.9417 127 1.6602 .000 1.4370 1.9181 �0.0029 0.9270 �0.0646 0.0588 �0.337
Renal/genitourinary �emergency surgery
1.4759 .006 1.1174 1.9494 121.9 1.4607 .008 1.1045 1.9318 �0.2170 0.0000 �0.2886 �0.1453 �19.55
Mechanical ventilationimpact
Ventilation 1.6585 .000 1.4990 1.8349 11326.7 1.5825 .000 1.4341 1.7464 0.4277 0.0000 0.3969 0.4585 53.36
Ventilation � APACHEIII score
0.9916 .000 0.9897 0.9934 42157.9 0.9920 .000 0.9902 0.9939 0.0017 0.0000 0.0010 0.0024 0.17
57Crit Care Med 2008 Vol. 36, No. 1

Continued
Variable LR p95%CIL
95%CIU
Model�2 gllamm p
95%CIL
95%CIU
OLSLog p
95%CIL
95%CIU
%Change
Ventilation � age 0.9959 .000 0.9937 0.9982 4887.5 0.9958 .000 0.9936 0.9980 0.0000 0.9190 �0.0006 0.0007 0.003
Ventilation � calendaryear
0.9718 .000 0.9570 0.9868 189.1 0.9774 .004 0.9625 0.9925 0.0043 0.2080 �0.0024 0.0109 0.428
Ventilation � malegender
0.9010 .000 0.8520 0.9529 4243 0.9015 .000 0.8525 0.9534 �0.0104 0.2290 �0.0274 0.0066 �1.04
Ventilation �gastrointestinal
0.8961 .033 0.8100 0.9913 926.1 0.8943 .026 0.8103 0.9870 0.0700 0.0000 0.0316 0.1083 7.23
Ventilation � metabolic 0.8189 .056 0.6672 1.0052 592.5 0.8352 .088 0.6793 1.0268 �0.2215 0.0000 �0.2651 �0.1779 �19.88
Ventilation �neurological
1.2186 .002 1.0755 1.3807 2479.7 1.2102 .002 1.0702 1.3685 0.1137 0.0000 0.0639 0.1636 12.01
Ventilation �respiratory
0.7872 .000 0.7148 0.8670 1127.7 0.7804 .000 0.7095 0.8585 0.2610 0.0000 0.2256 0.2964 29.81
Ventilation � trauma 1.0786 .390 0.9078 1.2816 0.5 1.0613 .495 0.8946 1.2590 0.3977 0.0000 0.3417 0.4536 48.78
Ventilation � renal/genitourinary
0.8301 .086 0.6712 1.0265 1.2 0.8404 .108 0.6800 1.0387 �0.1218 0.0000 �0.1809 �0.0627 �11.51
Impact of yearly admissionnumber
Yearly site admissions�711
0.8367 .000 0.7595 0.9217 1.8 0.8780 .000 0.8184 0.9420 0.0119 0.6050 �0.0332 0.0570 1.17
Rural year � siteadmissions �711
1.4858 .000 1.2345 1.7884 273.7 1.4411 .000 1.2275 1.6919 �0.0634 0.3430 �0.1944 0.0677 �6.35
Metropolitan � year-site admissions�711
0.8051 .026 0.6649 0.9749 17.6 0.7916 .011 0.6609 0.9481 �0.0294 0.5980 �0.1389 0.0802 �3.05
Private year-site �admissions �711
0.6371 .000 0.4977 0.8155 1204 0.5782 .000 0.4807 0.6955 �0.0209 0.8060 �0.1875 0.1457 �2.42
Elective surgical �year-site admissions�711
1.2262 .003 1.0731 1.4012 6354.6 1.1517 .029 1.0146 1.3073 0.1212 0.0000 0.0663 0.1761 12.84
Emergency surgical �year-site admissions�711
0.9723 .502 0.8957 1.0554 1.7 0.9859 .722 0.9116 1.0662 �0.0195 0.4750 �0.0732 0.0342 �1.97
Calendar year effects
Calendar year 1.0171 .141 0.9944 1.0402 40.2 1.0099 .453 0.9842 1.0364 0.0280 0.0000 0.0169 0.0390 2.84
Calendar year squared 0.9973 .154 0.9935 1.0010 0 0.9981 .308 0.9943 1.0018 �0.0010 0.3300 �0.0029 0.0010 �0.1
Geographical determinants
Rural 0.6027 .000 0.5143 0.7064 389 0.6140 .000 0.5364 0.7029 0.2240 0.0000 0.1038 0.3443 24.88
Metropolitan 1.0038 .965 0.8510 1.1840 0.5 0.9864 .867 0.8401 1.1582 0.1689 0.0010 0.0708 0.2669 18.25
Private 1.1427 .245 0.9128 1.4307 1216 1.1717 .034 1.0119 1.3568 0.1430 0.0820 �0.0183 0.3043 14.98
Rural � APACHE IIIscore
1.0055 .000 1.0026 1.0084 7010 1.0053 .000 1.0024 1.0081 �0.0021 0.0000 �0.0028 �0.0013 �0.21
Metropolitan �APACHE III score
1.0013 .184 0.9994 1.0033 10611.8 1.0014 .141 0.9995 1.0034 �0.0010 0.0030 �0.0016 �0.0003 �0.1
Private � APACHE IIIscore
1.0046 .004 1.0015 1.0078 4985 1.0047 .001 1.0019 1.0075 �0.0002 0.6310 �0.0012 0.0007 �0.02
Northern territory 1.0719 .444 0.8974 1.2802 7.5 1.0746 .428 0.8993 1.2842 �0.3023 0.0000 �0.3786 �0.2260 �26.15
Australian capitalterritory
1.1445 .035 1.0096 1.2973 29.3 1.1128 .173 0.9543 1.2975 �0.0403 0.1610 �0.0967 0.0161 �3.99
South Australia 1.0619 .383 0.9279 1.2154 983.2 1.0436 .408 0.9433 1.1545 �0.1531 0.0000 �0.2115 �0.0947 �14.24
Victoria 0.9728 .463 0.9038 1.0471 73.4 0.9770 .470 0.9174 1.0406 �0.0636 0.0010 �0.1013 �0.0260 �6.18
New Zealand 1.1949 .005 1.0546 1.3537 2.2 1.1514 .031 1.0128 1.3090 �0.3009 0.0000 �0.3997 �0.2020 �26.08
Queensland 0.9499 .228 0.8738 1.0327 536.1 0.9704 .438 0.8993 1.0470 �0.1454 0.0000 �0.1826 �0.1083 �13.55
Tasmania 1.2011 .038 1.0100 1.1428 0.3 1.2063 .016 1.0361 1.4046 �0.0165 0.7590 �0.1218 0.0889 �1.78
Western Australia 0.3410 .000 0.2985 0.3896 19.2 0.3519 .000 0.3107 0.3985 0.2247 0.0000 0.1662 0.2832 20.88
Time effect ofgeographicaldeterminants
Northern territory �calendar year
0.8963 .000 0.8469 0.9485 20.5 0.9125 .003 0.8599 0.9685 �0.0332593 0.0190 �0.061125 �0.0053936 �3.28
Australian capitalterritory � calendaryear
0.9311 .001 0.8936 0.9702 0.7 0.9367 .006 0.8937 0.9818 �0.0859797 0.0000 �0.1011271 �0.0708324 �8.24
South Australia �calendar year
1.0051 .819 0.9620 1.0502 0.8 1.0082 .676 0.9703 1.0477 �0.0252163 0.0050 �0.0428152 �0.0076174 �2.49
Victoria � calendar year 0.9666 .008 0.9424 0.9913 30 0.9798 .118 0.9550 1.0052 �0.0263602 0.0000 �0.040344 �0.0123763 �2.6
New Zealand �calendar year
0.9895 .503 0.9592 1.0206 0.1 0.9998 .993 0.9661 1.0348 �0.0125932 0.3190 �0.0373879 0.0122015 �1.26
58 Crit Care Med 2008 Vol. 36, No. 1

APPENDIX 2
Statistical Analysis
Modeling Mortality by Logistic Re-gression. The continuous variables usedwere age, severity-of-illness scores, andcalendar year; the predictive effect ofthese variables was entered initially asboth linear and simple quadratic; morecomplex nonlinear forms were not for-mally developed. Candidate categoricalpredictors were parameterized as simpleindicator variables with the referencelevel (�0) indicated in parentheses in thefollowing list:
Gender (female)Mechanical ventilation (not venti-lated)ICU level, as defined in the ANZICSdatabase, as rural, metropolitan, ter-tiary and private (tertiary)State of origin, that is, New Zealandand the States of the Commonwealthof Australia (New South Wales[NSW], the largest contributor)Patient surgical status as postelectivesurgery, postemergency surgery, andnonsurgical (nonsurgical)Descriptors of ICU admission primaryorgan system dysfunction, these beinga consolidation of the “diagnostic cat-
egories” of the APACHE algorithms:cardiovascular, gastrointestinal, meta-bolic, neurologic, respiratory, trauma,renal/genitourinary (cardiovascular)Calendar year, also considered as a cate-gorical variable using indicator variables(1993 as the reference), and forward adja-cent differences: each level vs. the previ-ous level (2003 as reference year)Annual patient admission number (n),created by the ICU site � calendar-year interaction, was empiricallytested by categorizing total n intoquartiles, tertiles, and median, the ref-erence category being that denotingthe highest number of yearly admis-sions (e.g., for the median difference,as a binary variable, the variables de-noted �711 and �711 yearly admis-sions, scored 1 and 0, respectively, with�711 being the reference category).
Model adequacy was gauged by thefollowing:
a. Progressive reduction in Akaike informa-tion criterion and Bayesian informationcriterion (75), both of which are penalized(with respect to number of observationsand model parameters) likelihood meth-ods for model determination.
b. The traditional criteria of discrimina-tion (ROC area) (76) and calibration:
Windmeijer’s goodness-of-fit test (77)and the Hosmer-Lemeshow (H-L) Cstatistic (78). The latter test was inter-preted with some caution, given thesize of the database (�200,000 pa-tients), as the p value will invariably besignificant (p � 0.1; H-L statistic �15.99) under these conditions (3, 79).
c. The model chi-squared was calculatedfor each parameter (33) to adjudge therelative importance of the parameter,after Knaus et al. (2), although thefinal model, using cluster/robust vari-ance adjustments, did not strictly sup-port such likelihood ratio tests. Atbest, these chi-square values are to beinterpreted heuristically.
Modeling ICU Length of Stay by Ordi-nary Least Squares. For logarithmictransformation of the dependent variable(i.e., log-ICU-length of stay), the interpre-tation of the independent (predictor)variables was 1) for continuous variables,that they demonstrate the percentagechange in the untransformed dependentvariable per one-unit change of predictor;and 2) for categorical (dummy) variables,such an interpretation is biased (it pro-vides the estimated median of the distri-bution rather than the mean). Consistentestimates of dummy variable (fixed) ef-fects were therefore computed after Hal-
Continued
Variable LR p95%CIL
95%CIU
Model�2 gllamm p
95%CIL
95%CIU
OLSLog p
95%CIL
95%CIU
%Change
Queensland � calendaryear
0.9876 .436 0.9571 1.0191 241.1 0.9999 .997 0.9686 1.0323 �0.0257742 0.0000 �0.0392762 �0.0122723 �2.55
Tasmania � calendaryear
0.9365 .017 0.8875 0.9881 30.7 0.9396 .036 0.8863 0.9960 �0.0565279 0.0010 �0.0907262 �0.0223296 �5.51
Western Australia �calendar year
0.6414 .000 0.6109 0.6734 17 0.6451 .000 0.6128 0.6792 0.044592 0.0000 0.0240113 0.0651727 4.55
Rural � calendar year 1.0193 .139 0.9938 1.0456 98.3 1.0167 .177 0.9926 1.0414 �0.0038837 0.6090 �0.0187907 0.0110233 �0.39
Metropolitan �calendar year
1.0319 .010 1.0077 1.0568 11 1.0286 .020 1.0045 1.0533 �0.0062275 0.3820 �0.0202213 0.0077663 �0.62
Private � calendar year 0.9742 .193 0.9366 1.0133 270.6 0.9696 .090 0.9356 1.0048 �0.0017852 0.8370 �0.0188474 0.0152769 �0.18
SD of random effect(year � site)
N/A N/A 0.2570 N/A N/A
ICU mortality status
Death in ICU N/A N/A 0.4563 0.0000 0.3800 0.5325 57.7
Death � ventilation N/A N/A �0.1995 0.0000 �0.2750 �0.1241 �18.15
Death � APACHE IIIscore
N/A N/A �0.0218 0.0000 �0.0229 �0.0207 �2.155
LR, logistic regression model for hospital mortality; 95% CIL, lower limit of 95% confidence interval of parameter; 95% CIU, upper limit of 95%confidence interval of parameter; model �2, comparison of the log-likelihood of the model containing only the intercept with that of the model having thesingle predictor; gllamm, random intercept logistic regression as estimated by Stata module CCgllamm”(35); OLS log, ordinary least squares regression withlog (ICU days) as the dependent variable; APACHE, Acute Physiology and Chronic Health Evaluation; N/A, not applicable; % change, percentage change inthe untransformed dependent variable (ICU length of stay, in days) as calculated by the Stata module “logdummy”(41); �, interaction.
Comparators are Female for Male and interactions; Cardiovascular for Gastrointestinal, Metabolic, Neurologic, Respiratory, Trauma and Renal/Genitourinary and interactions; Nonsurgical for Elective surgery and Emergency surgery and interactions; Tertiary for Rural, Metropolitan and Private ICUsand interactions; Yearly site admissions �711 for Yearly site admissions �711 and interactions. New South Wales for geographical areas (NorthernTerritory, Australian Capital Territory, South Australia, Victoria, New Zealand and Western Australia).
59Crit Care Med 2008 Vol. 36, No. 1

vorsen and Palmquist (80) using theStata module logdummy (41).
Presentation and Interpretation ofGraphic Display of Predicted Mortalities.Given the potential number of covariatesand interactions, the appropriate graphicdisplay of predicted mortalities for vari-ous patient categories was a nontrivialmatter: 1) predicted probabilities with95% CI were collapsed and averaged overpatient categories and calendar year toyield appropriate graphic display, al-though the “average” covariate method
may be problematic (81); 2) the inter-pretation or a simple summary measureof the interaction effect (�12x1x2, where�12 is the regression coefficient of theinteraction of two predictor variables,x1 and x2) in nonlinear models (such aslogistic and Cox regression) is also notfacile. As demonstrated by Ai and Nor-ton (82), the interaction effect is con-ditional on all the independent vari-ables (unlike the interaction effect inlinear models); the sign of the regres-sion coefficient (�12) does not necessar-
ily indicate the sign of the interactioneffect across all the variables, and theeffect could be nonzero, even if �12 � 0(exponentiated, as OR � 1). Thus, un-derstanding the transformation of pa-rameter estimates and their multipleinteractions onto the probability scalemust take into account these implicitconstraints. For predicted ICU length ofstay, mean values and 95% CI werecomputed and displayed graphically us-ing the methods of Rabe-Hesketh andEveritt (83).
APPENDIX 3
Adjusted mortality (point estimate and 95% confidence intervals) at hospital discharge (y-axis) plottedagainst calendar year (x-axis) for intensive care unit classification. Connected triangle symbol line,point estimate; shaded area, 95% confidence intervals.
60 Crit Care Med 2008 Vol. 36, No. 1

Adjusted mortality (point estimate and 95% confidence intervals) at hospital discharge (y-axis) plotted against calendar year (x-axis) for geographic location.Connected triangle symbol line, point estimate; shaded area, 95% confidence intervals.
61Crit Care Med 2008 Vol. 36, No. 1