clinical gait analysis - stanford universityweb.stanford.edu/class/engr110/2009/rose-08a.pdf ·...
TRANSCRIPT
1
Clinical Gait Analysis Clinical Gait Analysis Biomechanics & Etiology of Common Biomechanics & Etiology of Common
Walking DisordersWalking Disorders
Jessica Rose, Ph.D.
Assistant Professor, Department of Orthopaedic SurgeryStanford University School of Medicine
Motion & Gait Analysis LabLucile Packard Children’s Hospital
Teaching Points
• Phases of the Gait Cycle
• Primary Muscle Actions during Gait
• Common Gait Disorders
2
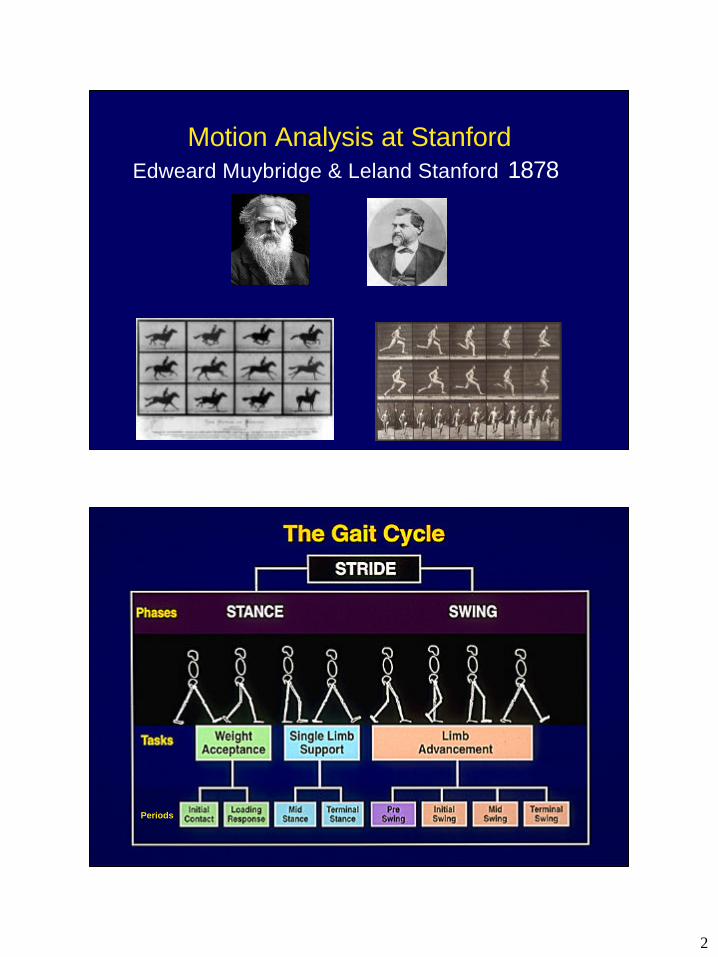
Motion Analysis at Stanford Edweard Muybridge & Leland Stanford 1878
Periods
3
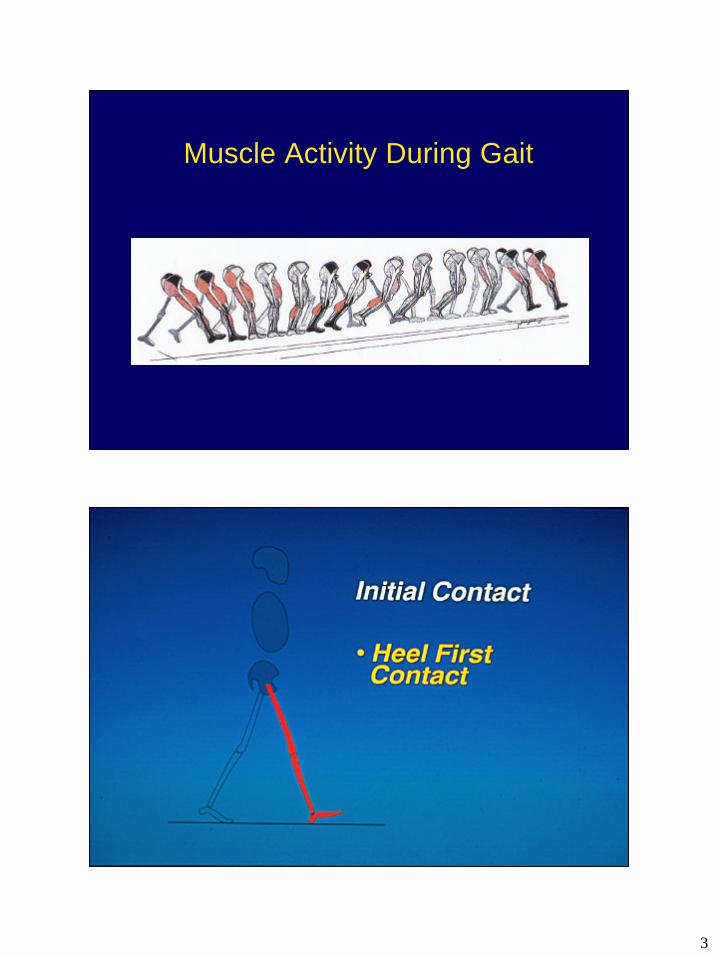
Muscle Activity During Gait
4
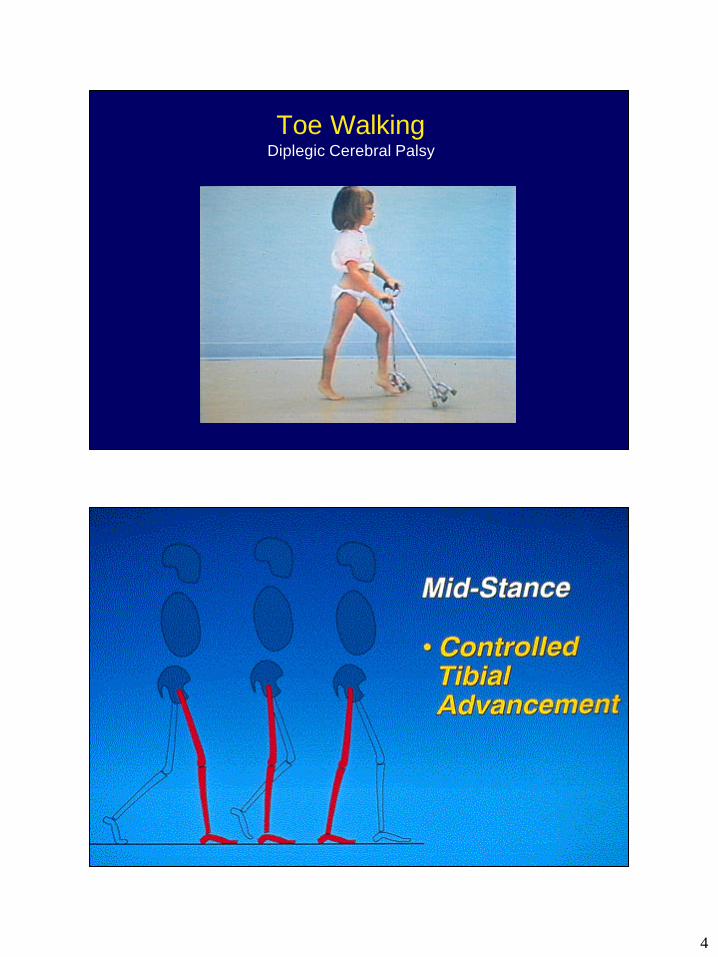
Toe WalkingDiplegic Cerebral Palsy
5
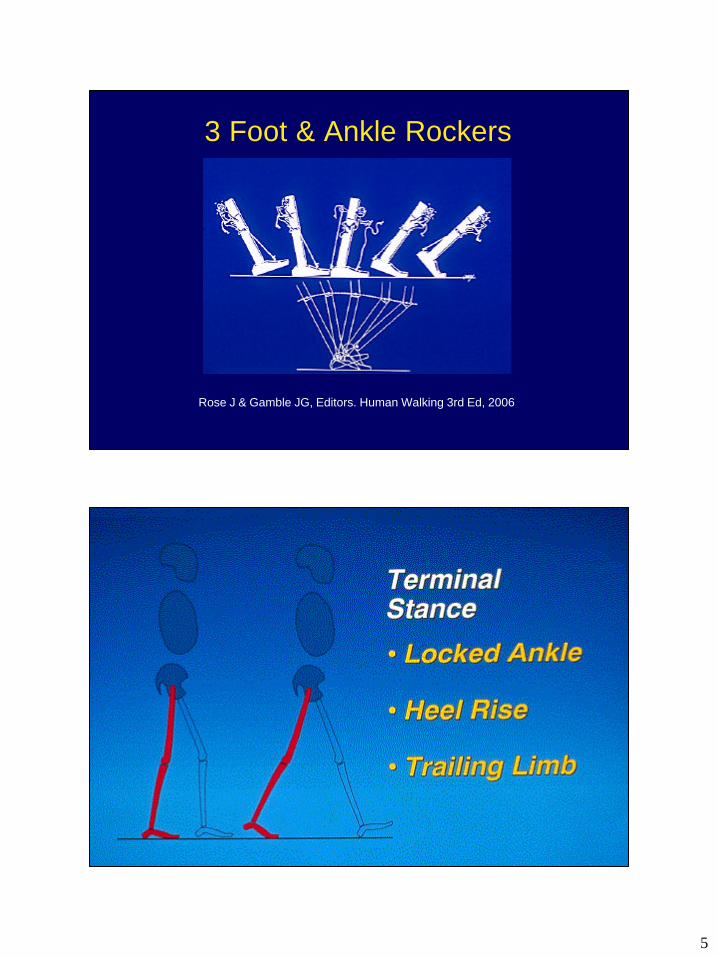
Rose J & Gamble JG, Editors. Human Walking 3rd Ed, 2006
3 Foot & Ankle Rockers
6
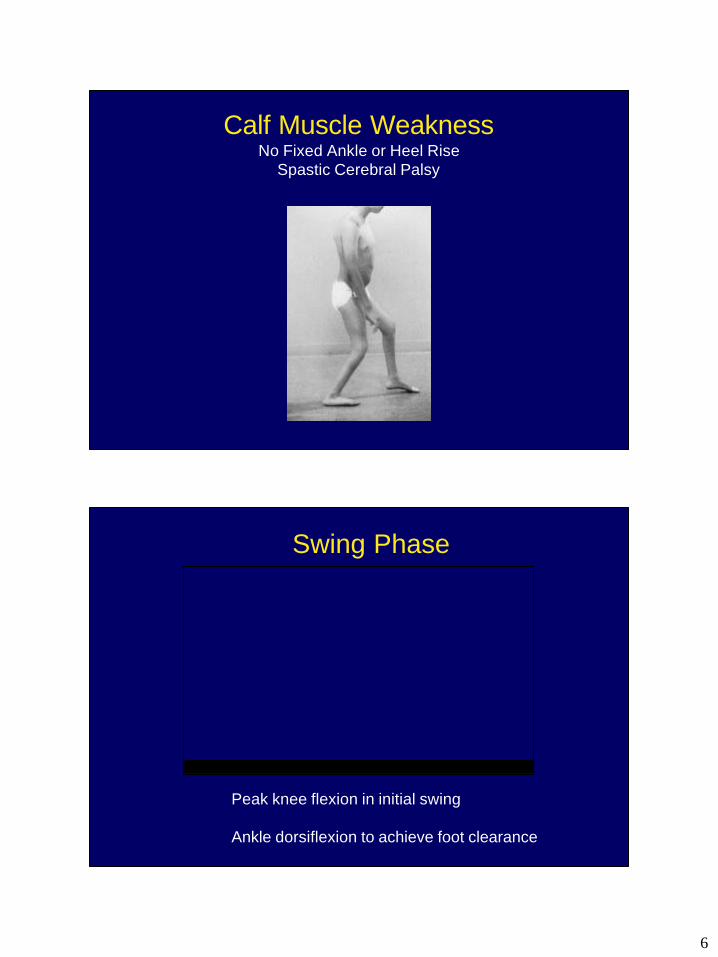
Calf Muscle WeaknessNo Fixed Ankle or Heel Rise
Spastic Cerebral Palsy
Swing Phase
� Peak knee flexion in initial swing
� Ankle dorsiflexion to achieve foot clearance
7
Gait Analysis
•Video
•Kinematics and Kinetics
•Dynamic EMG
•Postural Balance
•Energy Expenditure
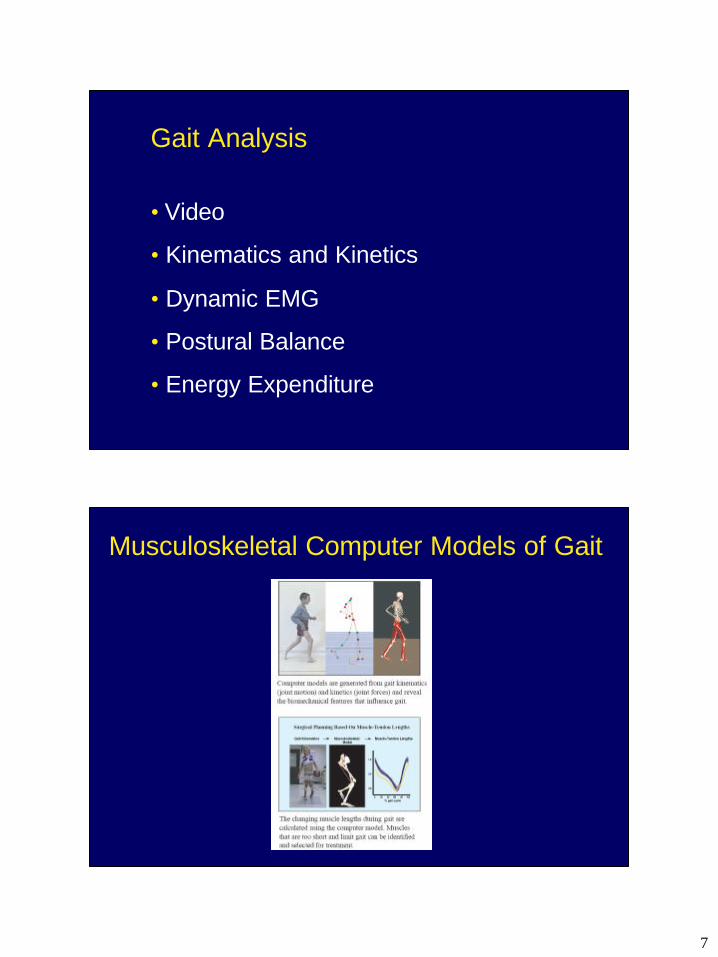
Musculoskeletal Computer Models of Gait
8
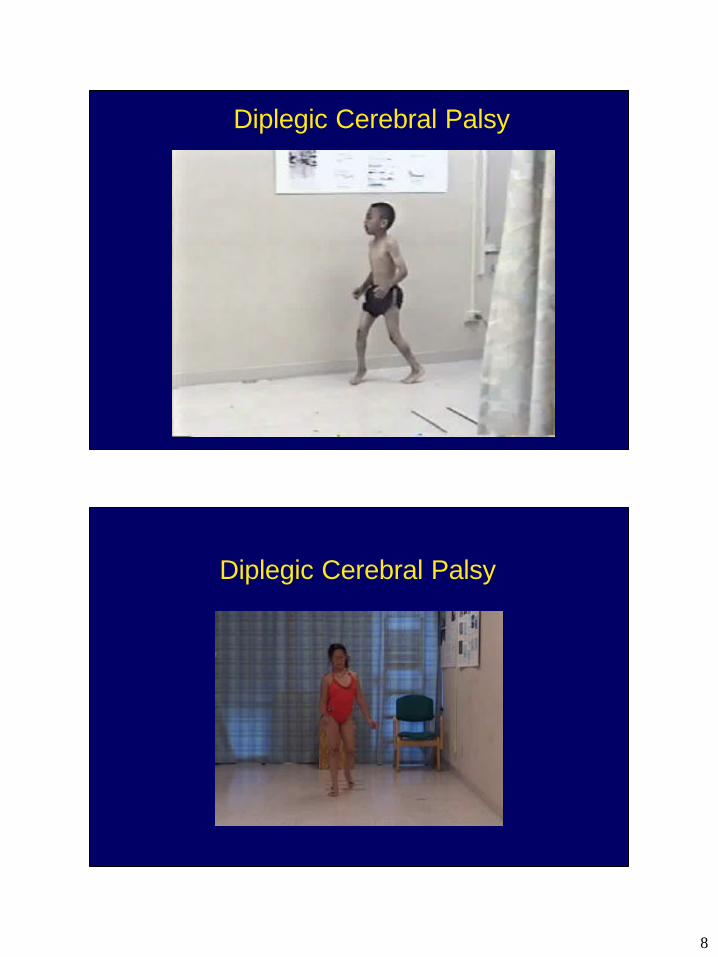
Diplegic Cerebral Palsy
Diplegic Cerebral Palsy
9
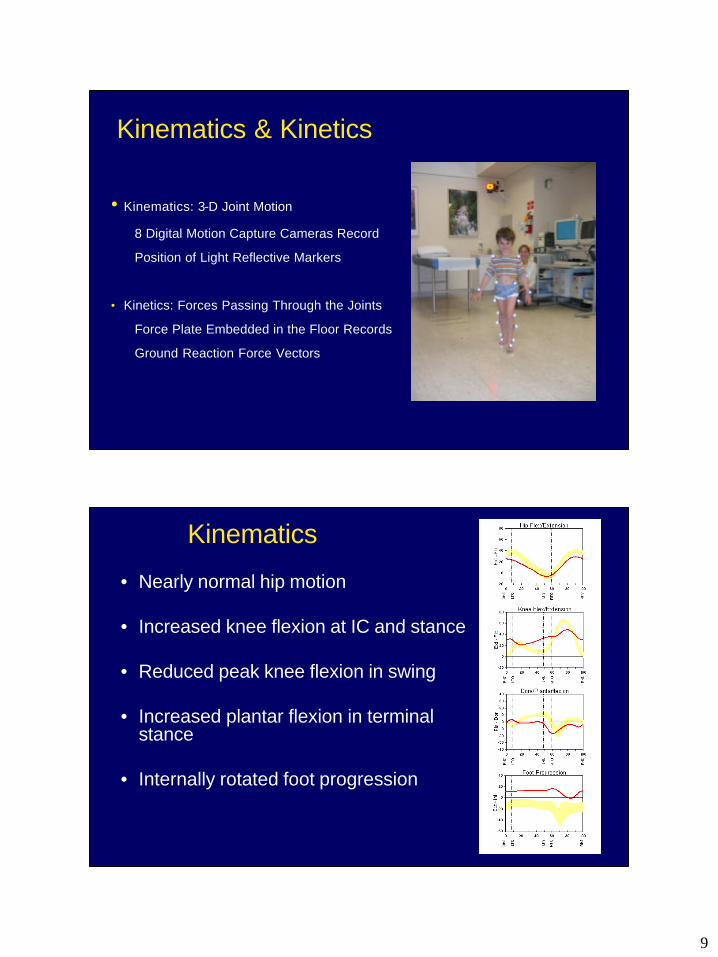
Kinematics & Kinetics
•Kinematics: 3-D Joint Motion
8 Digital Motion Capture Cameras Record
Position of Light Reflective Markers
• Kinetics: Forces Passing Through the Joints
Force Plate Embedded in the Floor Records
Ground Reaction Force Vectors
Kinematics
• Nearly normal hip motion
• Increased knee flexion at IC and stance
• Reduced peak knee flexion in swing
• Increased plantar flexion in terminal stance
• Internally rotated foot progression
10
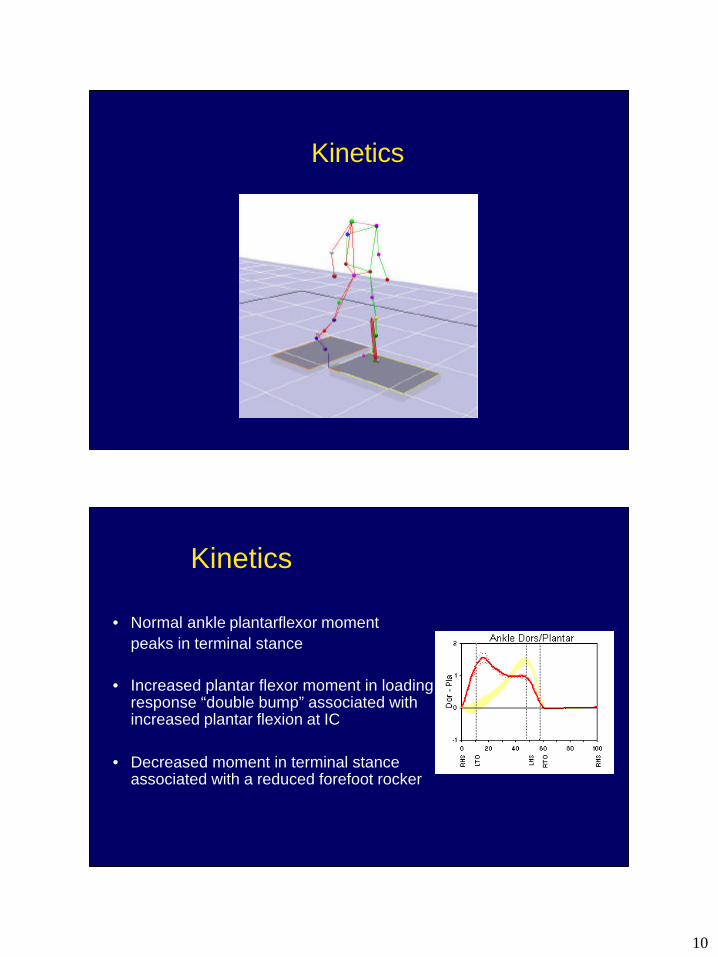
Kinetics
Kinetics
• Normal ankle plantarflexor momentpeaks in terminal stance
• Increased plantar flexor moment in loading response “double bump” associated with increased plantar flexion at IC
• Decreased moment in terminal stance associated with a reduced forefoot rocker
11
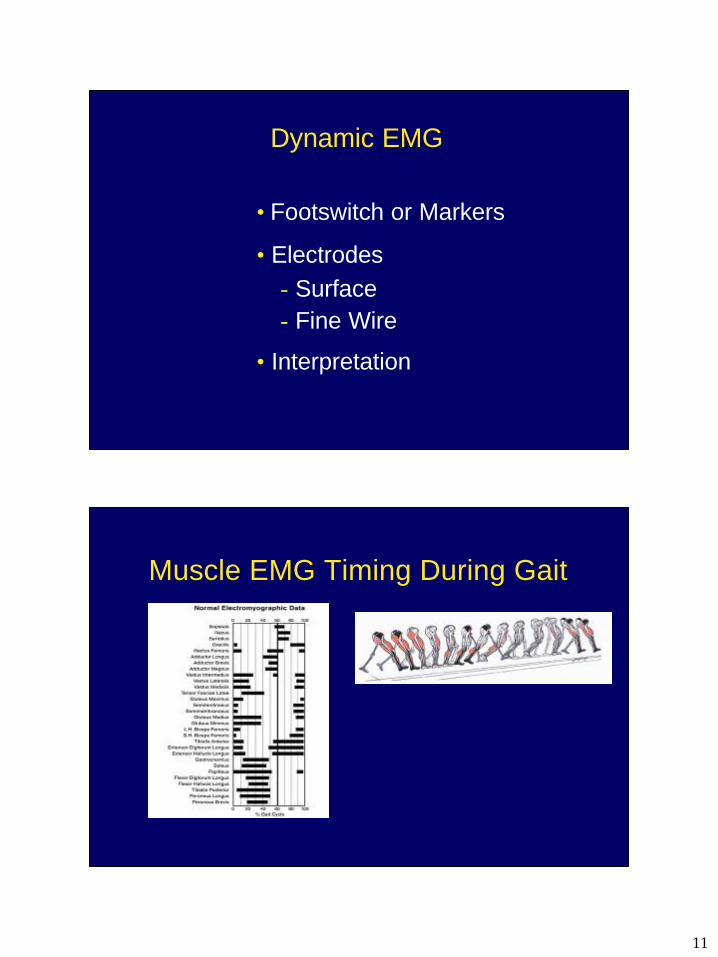
Dynamic EMG
•Footswitch or Markers
•Electrodes-Surface-Fine Wire
•Interpretation
Muscle EMG Timing During Gait
12
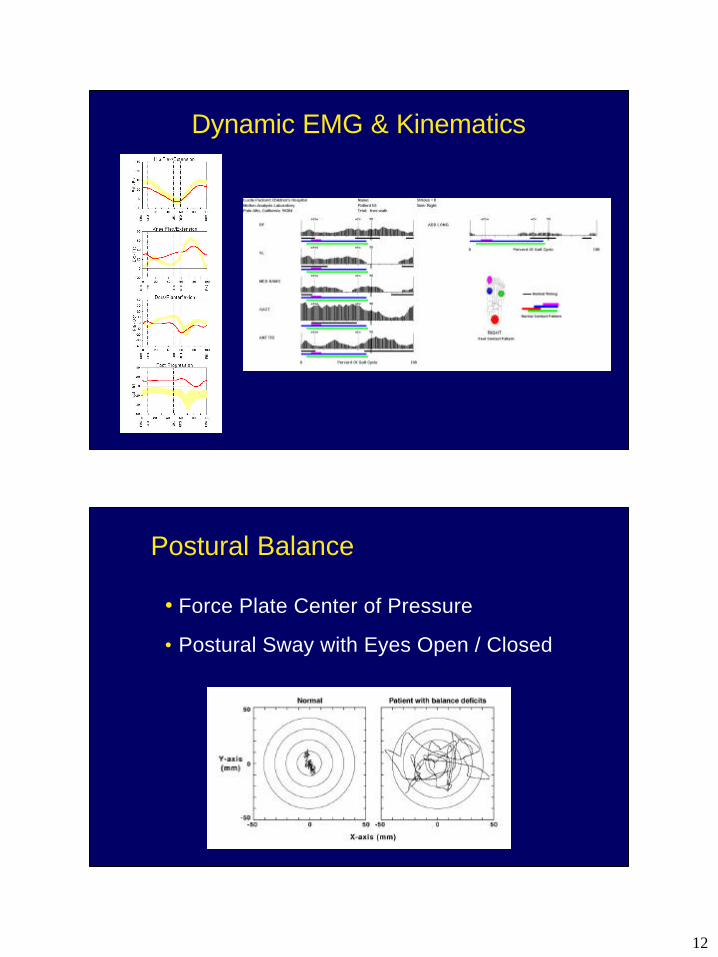
Dynamic EMG & Kinematics
Postural Balance
•Force Plate Center of Pressure
•Postural Sway with Eyes Open / Closed
13
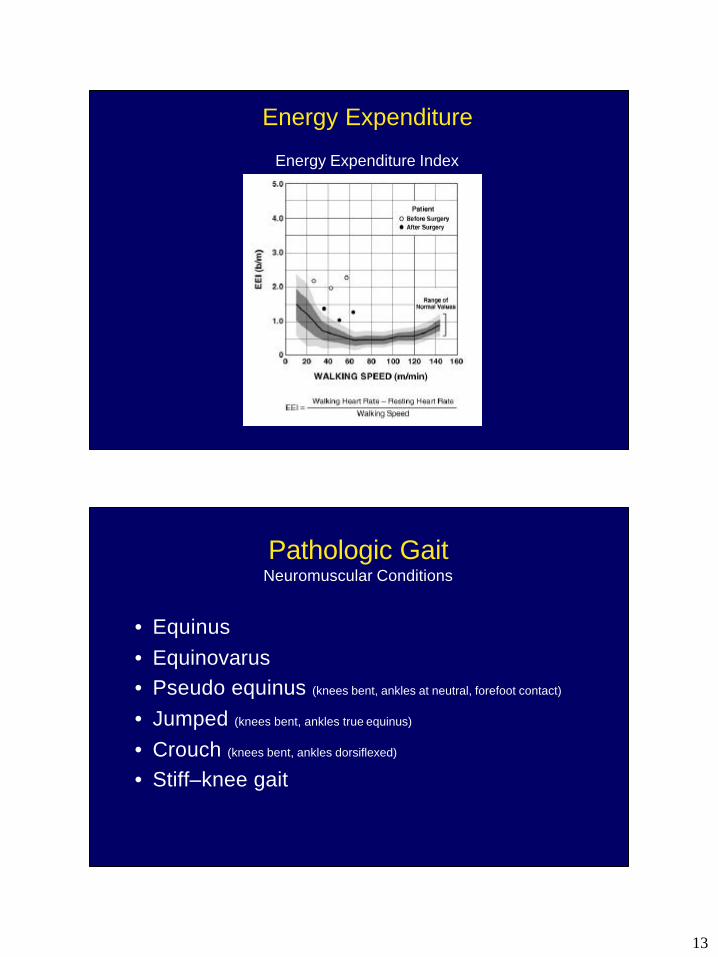
Energy Expenditure
Energy Expenditure Index
Pathologic Gait Neuromuscular Conditions
• Equinus • Equinovarus• Pseudo equinus (knees bent, ankles at neutral, forefoot contact)
• Jumped (knees bent, ankles true equinus)
• Crouch (knees bent, ankles dorsiflexed)
• Stiff–knee gait
14
Pathologic GaitMusculoskeletal Conditions
Polio, Dislocation, Arthritis, Muscular Dystrophy
• Pain• Muscle weakness• Structural abnormalities (joint instability, short limb)• Loss of motion• Combinations of above
Antalgic GaitPain
• Any gait that reduces loading on an affected extremity by decreasing stance phase time or joint forces
• Examples– “stone in your shoe”– Painful hip, knee, foot, etc
15
Pathologic Hip GaitPainful due to Arthritis
• Coxalgic gait – Intact hip abductors; structural stability– Lateral shift, � hip compression, � abductor load– Contralateral pelvic elevation
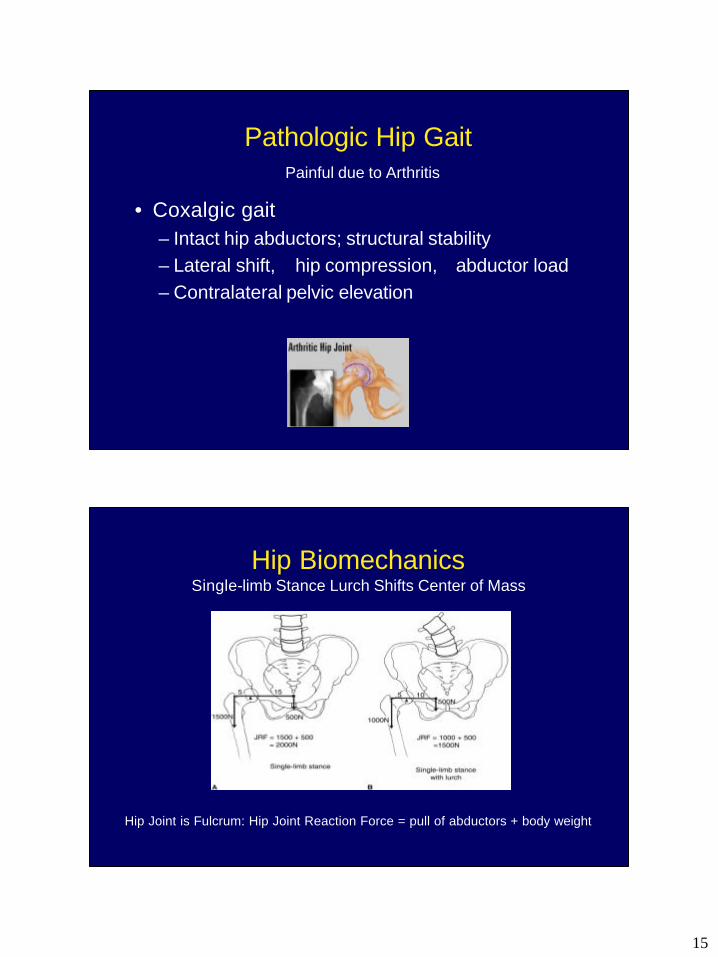
Hip Biomechanics Single-limb Stance Lurch Shifts Center of Mass
Hip Joint is Fulcrum: Hip Joint Reaction Force = pull of abductors + body weight
16
Antalgic Gait
Painful Side:
• Shorten stance phase time• Lengthen swing phase time• Lengthen step length
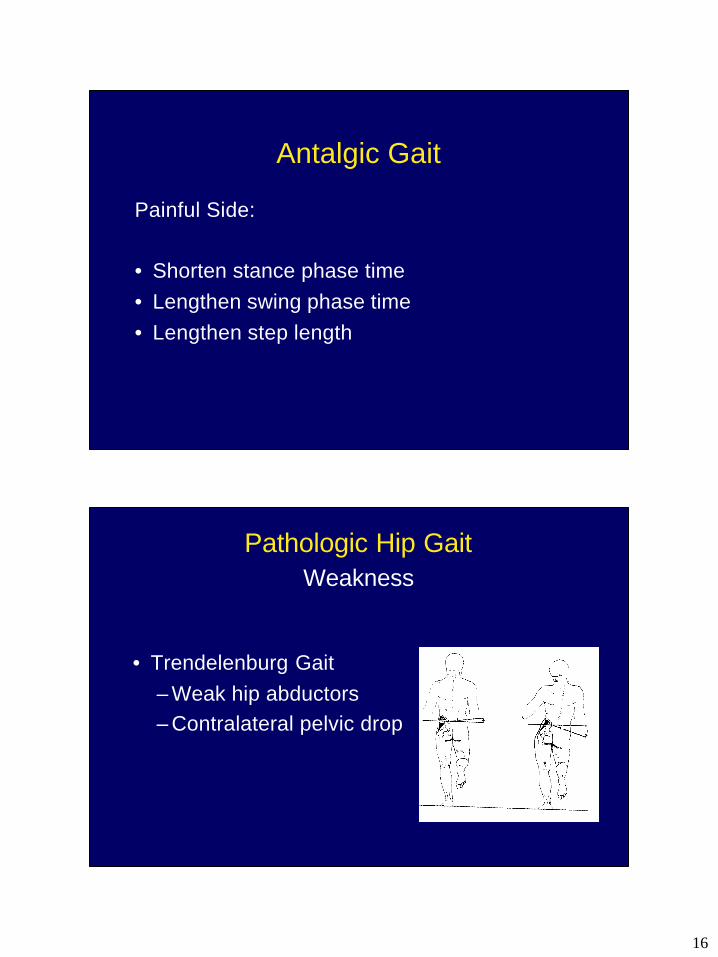
Pathologic Hip GaitWeakness
• Trendelenburg Gait– Weak hip abductors– Contralateral pelvic drop
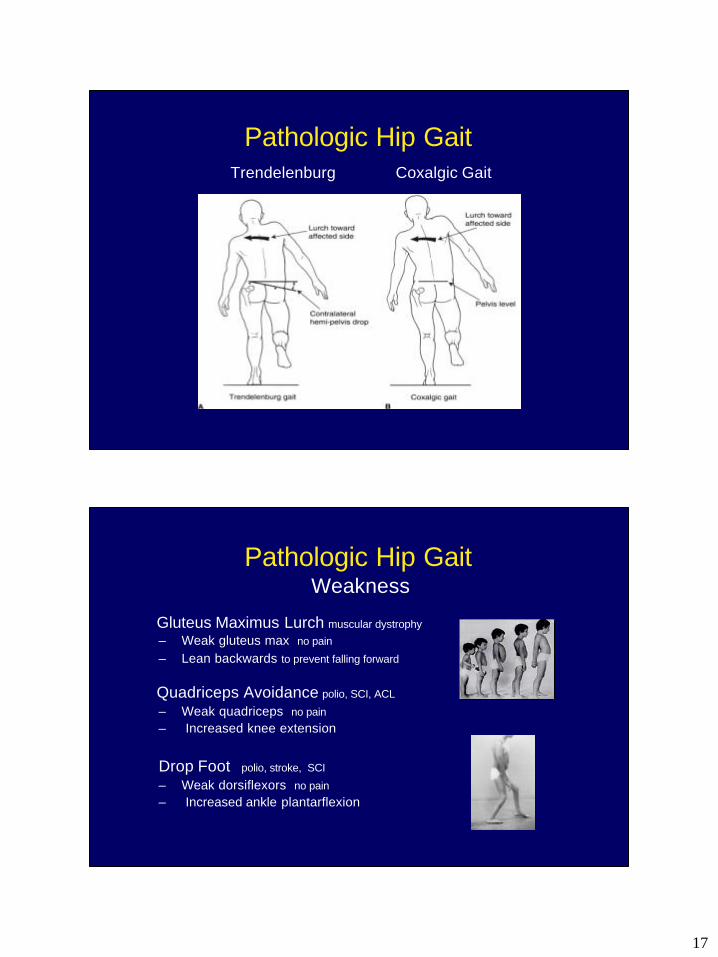
17
Pathologic Hip GaitTrendelenburg Coxalgic Gait
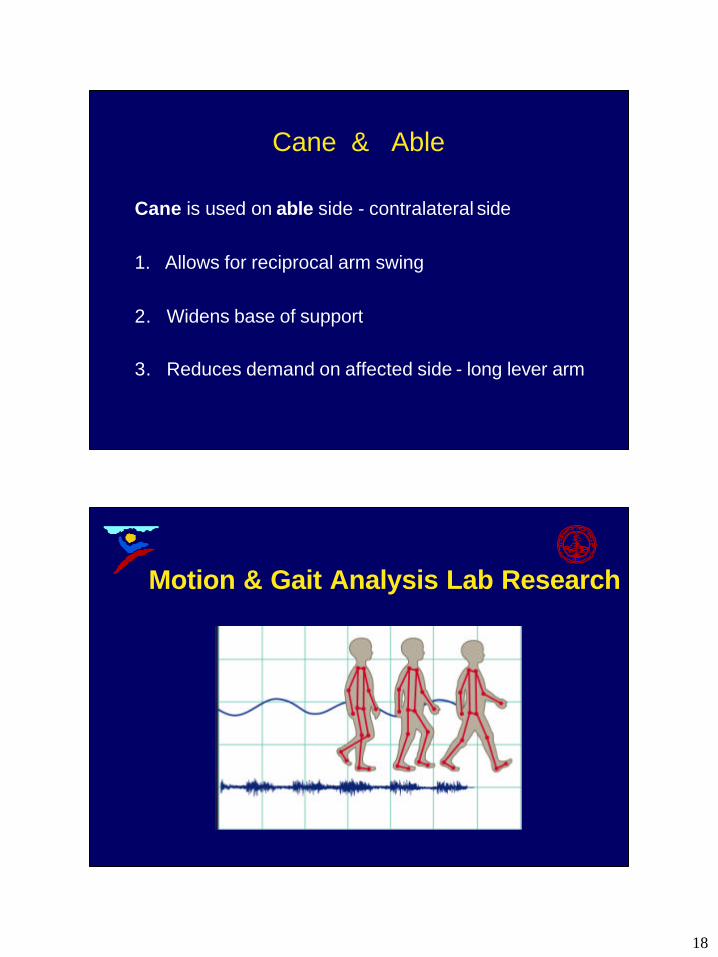
Pathologic Hip GaitWeakness
Gluteus Maximus Lurch muscular dystrophy– Weak gluteus max no pain
– Lean backwards to prevent falling forward
Quadriceps Avoidance polio, SCI, ACL
– Weak quadriceps no pain– Increased knee extension
Drop Foot polio, stroke, SCI
– Weak dorsiflexors no pain– Increased ankle plantarflexion
18
Cane & Able
Cane is used on able side - contralateral side
1. Allows for reciprocal arm swing
2. Widens base of support
3. Reduces demand on affected side - long lever arm
Motion & Gait Analysis Lab Research
19
Spastic Cerebral Palsy
• Loss of Selective Motor Control• Short Muscle-tendon Length & Joint Contracture• Muscle Weakness• Muscle Spasticity
• Mixed CP: Ataxia, Dystonia, Chorea, Athetosis
Neuromuscular Mechanisms underlying Motor Deficits in Spastic Cerebral Palsy
• EMG Test of Obligatory Muscle Co-activation in Spastic CP
• Muscle Pathology in Spastic CP
• Neuromuscular Activation & Motor-unit Firing Characteristics in CP
• Neonatal Brain Abnormalities & Gait Deficits in Preterm Children
20
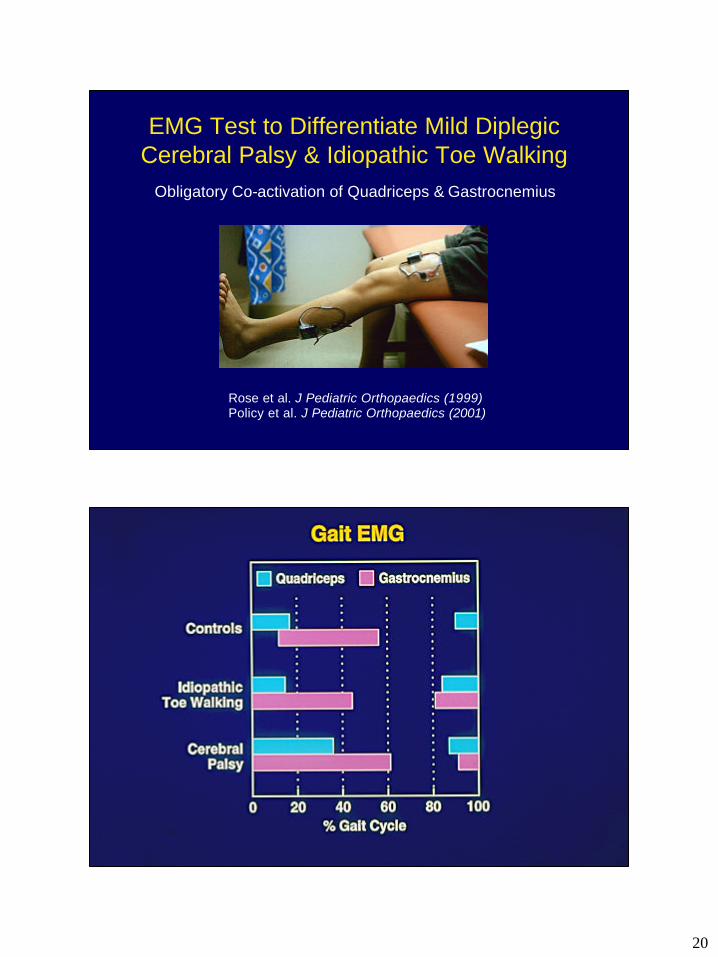
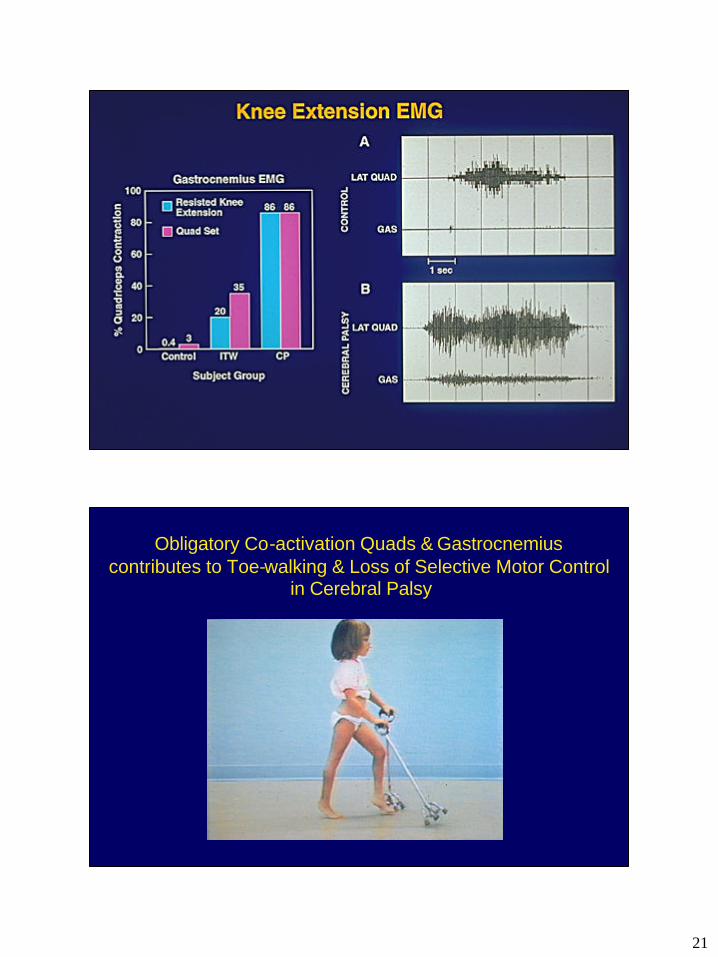
EMG Test to Differentiate Mild Diplegic Cerebral Palsy & Idiopathic Toe Walking
Obligatory Co-activation of Quadriceps & Gastrocnemius
Rose et al. J Pediatric Orthopaedics (1999)Policy et al. J Pediatric Orthopaedics (2001)
21
Obligatory Co-activation Quads & Gastrocnemius contributes to Toe-walking & Loss of Selective Motor Control
in Cerebral Palsy
22
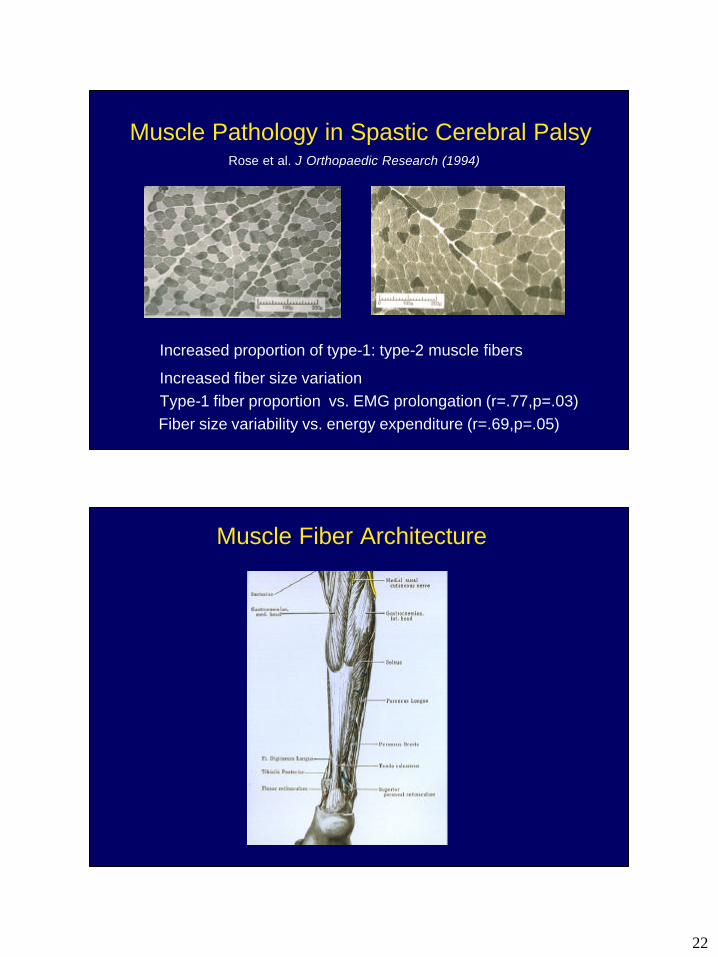
Muscle Pathology in Spastic Cerebral Palsy
� Increased proportion of type-1: type-2 muscle fibers
� Increased fiber size variation� Type-1 fiber proportion vs. EMG prolongation (r=.77,p=.03)�Fiber size variability vs. energy expenditure (r=.69,p=.05)
Rose et al. J Orthopaedic Research (1994)
Muscle Fiber Architecture
23
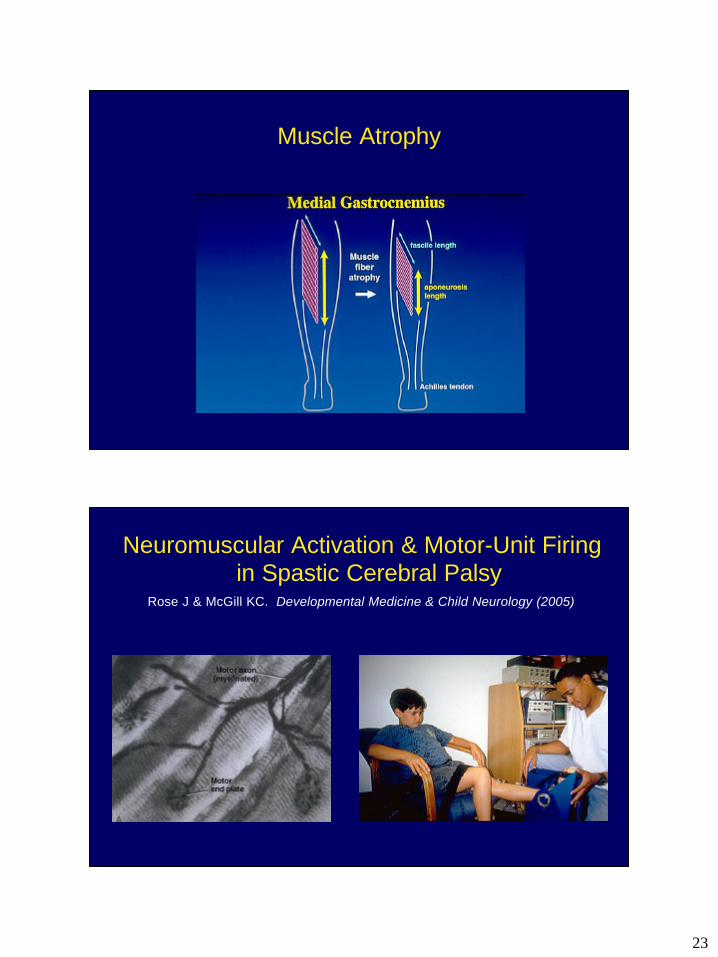
Muscle Atrophy
Neuromuscular Activation & Motor-Unit Firingin Spastic Cerebral Palsy
Rose J & McGill KC. Developmental Medicine & Child Neurology (2005)
24
10 N-m
2 mV
2 mV
2 s
2 s
10 ms
% M-wave
MVC:
Torque
EMG
MaximumM-wave:
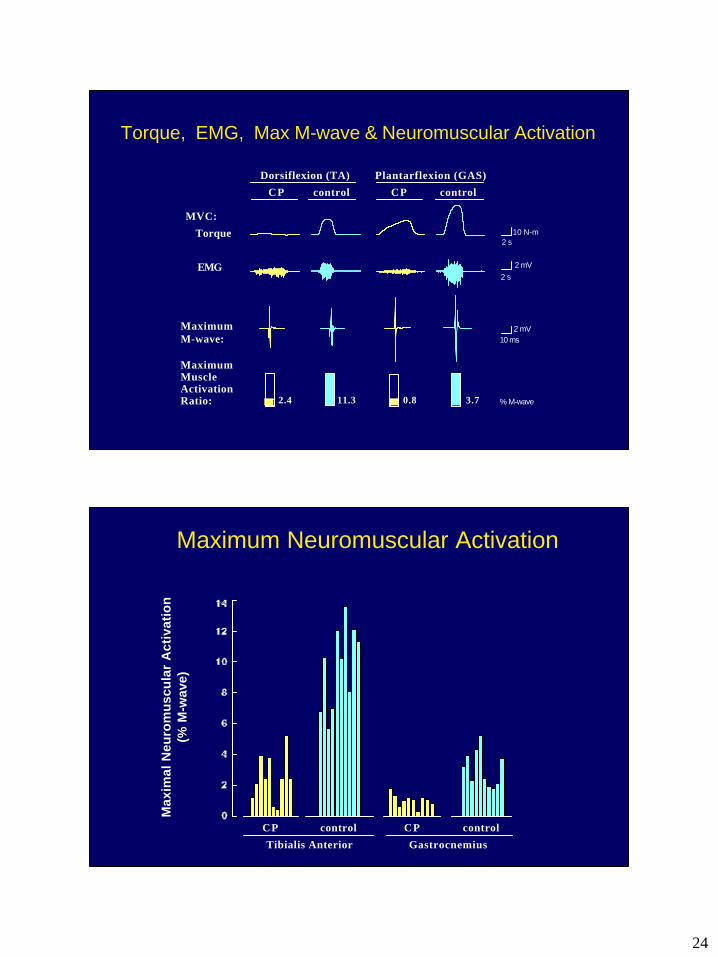
MaximumMuscleActivationRatio: 2.4 11.3 0.8 3.7
CP control CP control
Dorsiflexion (TA) Plantarflexion (GAS)
Torque, EMG, Max M-wave & Neuromuscular Activation
Max
imal
Neu
rom
usc
ula
r A
ctiv
atio
n(%
M-w
ave)
CP control CP control
Tibialis Anterior Gastrocnemius
Maximum Neuromuscular Activation
25
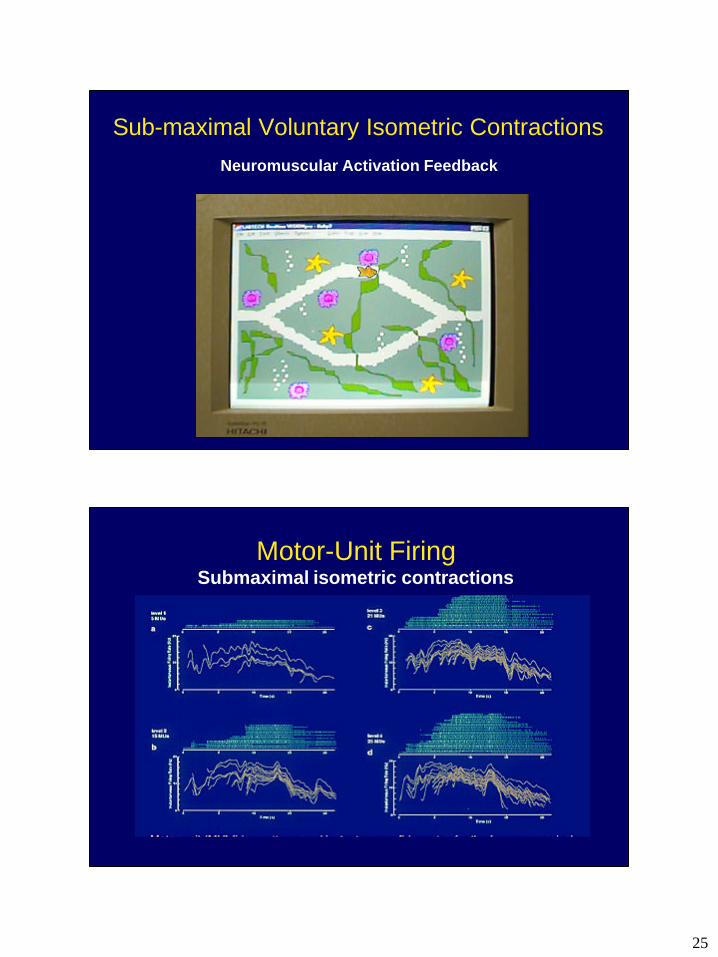
Sub-maximal Voluntary Isometric ContractionsNeuromuscular Activation Feedback
Motor-Unit FiringSubmaximal isometric contractions
26
00
5
10
15
20
25
0.5 0.750.25
00
5
10
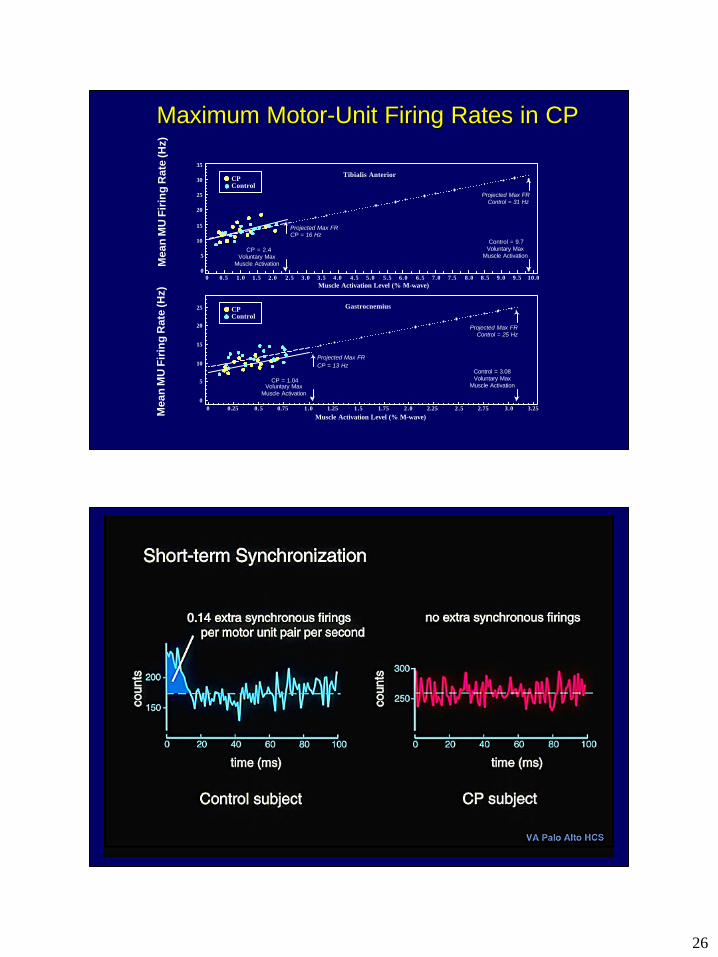
15 Projected Max FRCP = 16 Hz
Projected Max FRControl = 31 Hz
Projected Max FRControl = 25 Hz
20
25
30
35
0.5 1.0 1.5 2.0 2.5 3.0 3.5 4.0 4.5 5.0 5.5 6.0 6.5 7.0 7.5 8.0 8.5 9.0 9.5 10.0
CP = 2.4Voluntary Max
Muscle Activation
1.0 1.5 1.751.25 2.0 2.5 2.752.25 3.0 3.25
Gastrocnemius
Muscle Activation Level (% M-wave)
Tibialis Anterior
Muscle Activation Level (% M-wave)
Projected Max FRCP = 13 Hz
CP = 1.04Voluntary Max
Muscle Activation
Control = 3.08Voluntary Max
Muscle Activation
Control = 9.7Voluntary Max
Muscle Activation
CPControl
CPControl
Mea
n M
U F
irin
g R
ate
(Hz)
Mea
n M
U F
irin
g R
ate
(Hz)
Maximum MotorMaximum Motor--Unit Firing Rates in CPUnit Firing Rates in CP
27
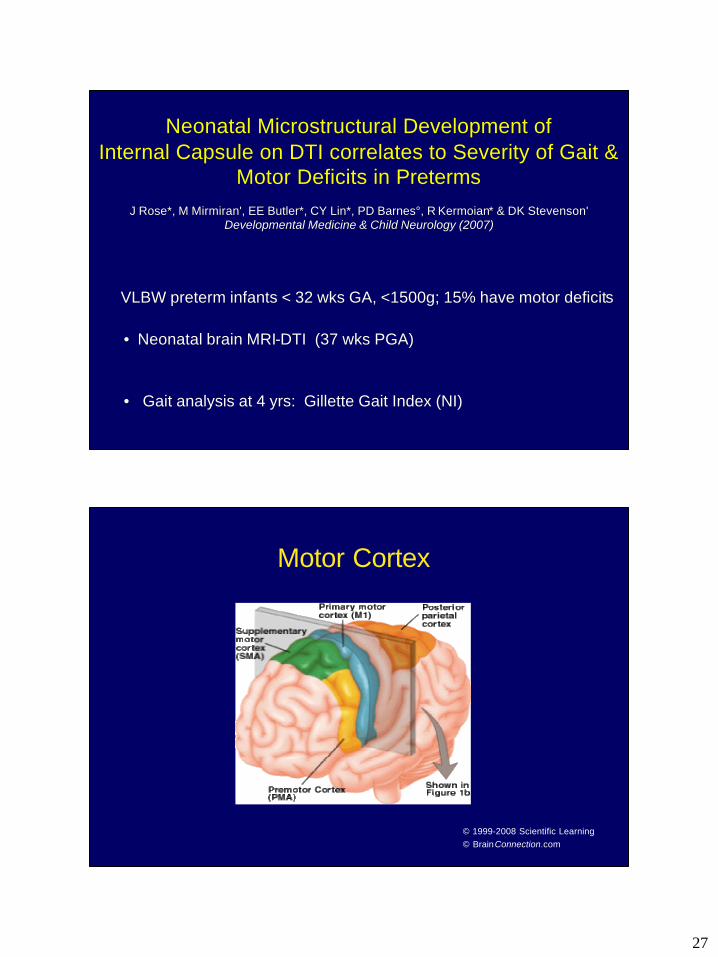
VLBW preterm infants < 32 wks GA, <1500g; 15% have motor deficitVLBW preterm infants < 32 wks GA, <1500g; 15% have motor deficitss
•• Neonatal brain MRINeonatal brain MRI--DTI (37 wks PGA)DTI (37 wks PGA)
•• Gait analysis at 4 yrs: Gillette Gait Index (NI) Gait analysis at 4 yrs: Gillette Gait Index (NI)
Neonatal Neonatal MicrostructuralMicrostructural Development of Development of Internal Capsule on DTI correlates to Severity of Gait & Internal Capsule on DTI correlates to Severity of Gait &
Motor Deficits in Motor Deficits in PretermsPretermsJ Rose*, M J Rose*, M MirmiranMirmiran', EE Butler*, CY Lin*, PD Barnes°, R ', EE Butler*, CY Lin*, PD Barnes°, R KermoianKermoian* & DK Stevenson'* & DK Stevenson'
Developmental Medicine & Child Neurology (2007)Developmental Medicine & Child Neurology (2007)
Motor Cortex
© 1999-2008 Scientific Learning© BrainConnection.com

28
Sagittal Views of the Brain
Internal Capsule
Axial View of the Brain
1. Genu of corpus callosum 2. Forceps minor 3. Internal capsule, anterior limb4. Septum pellucidum 5. Caudate nucleus 6. Putamen 7. Globus pallidus 8. Internal capsule, posterior limb 9. Thalamus
10. Splenium of corpus callosum 11. Forceps major
Anterior
Posterior
29
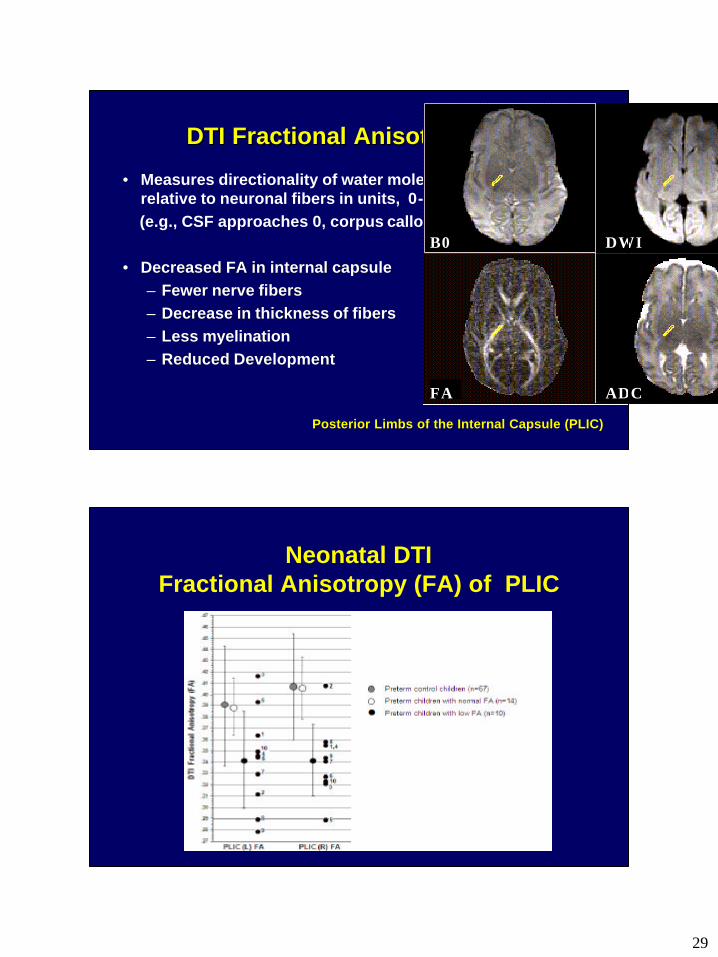
DTI Fractional Anisotropy (FA)DTI Fractional Anisotropy (FA)
• Measures directionality of water molecule movement relative to neuronal fibers in units, 0-1 (e.g., CSF approaches 0, corpus callosum = .83)
•• Decreased FA in internal capsule Decreased FA in internal capsule –– Fewer nerve fibersFewer nerve fibers–– Decrease in thickness of fibersDecrease in thickness of fibers–– Less Less myelinationmyelination–– Reduced DevelopmentReduced Development
(a) Region of Interest ADC values (x10-3 m 2/ms) byclinical subgroup
B0 DWI
FA ADC
Posterior Limbs of the Internal Capsule (PLIC)Posterior Limbs of the Internal Capsule (PLIC)
Neonatal DTI Fractional Anisotropy (FA) of PLIC
30
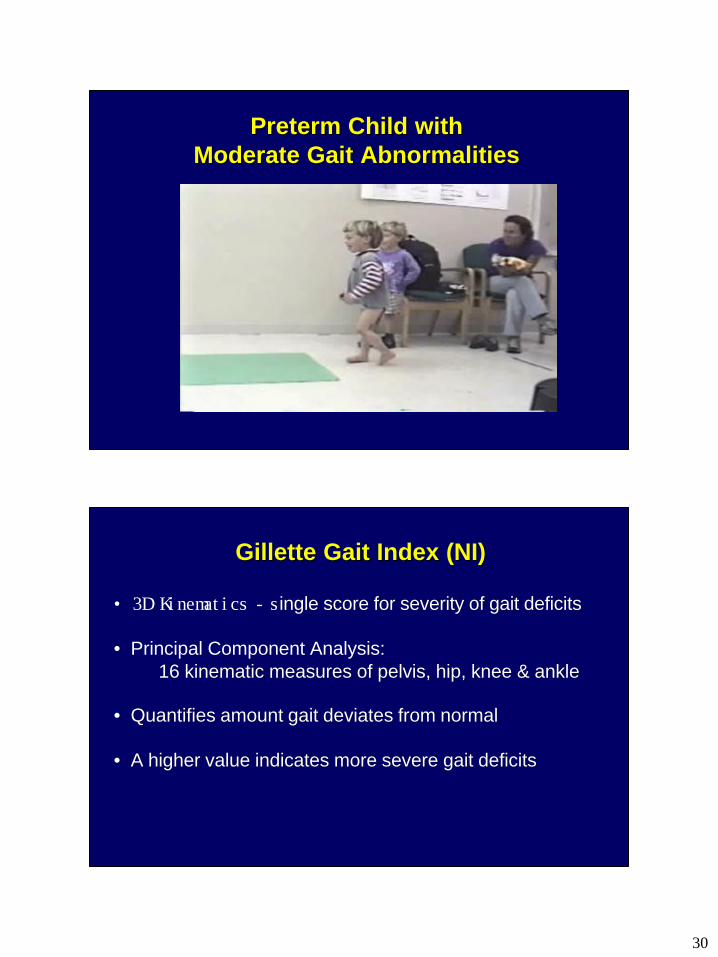
Preterm Child with Preterm Child with Moderate Gait AbnormalitiesModerate Gait Abnormalities
QuickTime™ and aYUV420 codec decompressor
are needed to see this picture.
•• 3D Kinematics 3D Kinematics --ssingle score for severity of gait deficitsingle score for severity of gait deficits
•• Principal Component Analysis: 16 kinematic measures of pelvis, hip, knee & ankle 16 kinematic measures of pelvis, hip, knee & ankle
•• Quantifies amount gait deviates from normal Quantifies amount gait deviates from normal
•• A higher value indicates more severe gait deficitsA higher value indicates more severe gait deficits
Gillette Gait Index (NI) Gillette Gait Index (NI)
31
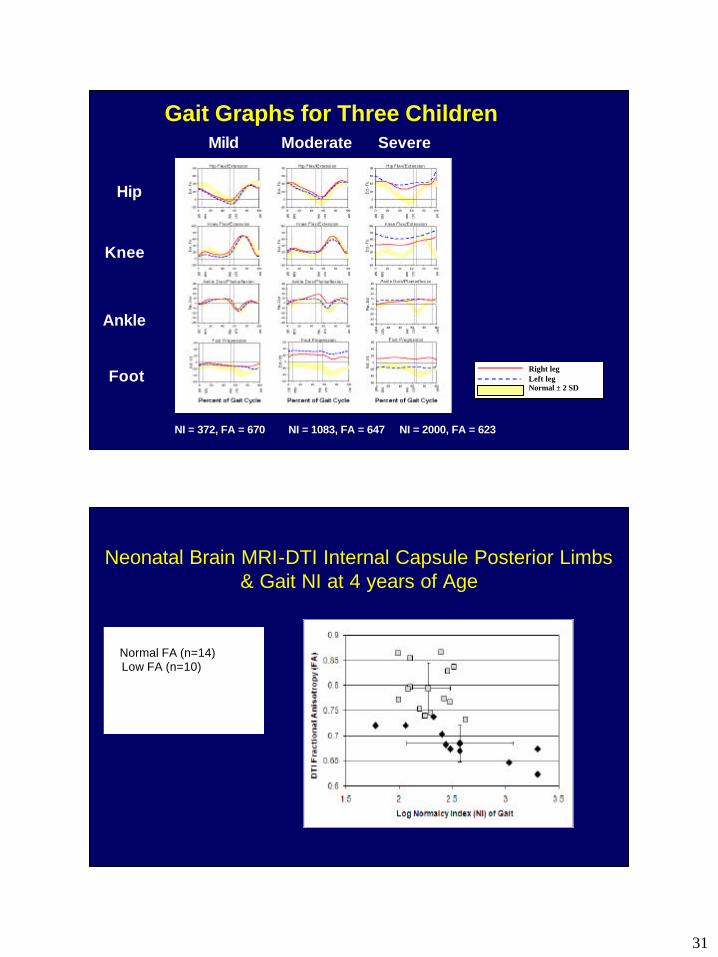
Gait Graphs for Three Children
Right legLeft legNormal ± 2 SD
NI = 372, FA = 670 NI = 1083, FA = 647 NI = 2000, FA = 623
Hip
Knee
Ankle
Foot
Mild Moderate Severe
Neonatal Brain MRI-DTI Internal Capsule Posterior Limbs & Gait NI at 4 years of Age
� Normal FA (n=14) � Low FA (n=10)
Spearman correlation: rho= -.89, p<.01
32
Acknowledgments
• This work was supported by NICHD R03 HD36705, Packard Child Health Grant, NIH Grant to the General Clinical Research Center, NINDS R2 NS40374 & the Harman Pediatric Clinical Neuroscience Award.
Thank YouThank You