clinical fluorescence spectroscopy and imaging for … · 3 "the whole life is nothing more...
TRANSCRIPT

POUR L'OBTENTION DU GRADE DE DOCTEUR ÈS SCIENCES
PAR
Diplom-Physikerin, Universität Bielefeld, Allemagneet de nationalité allemande
acceptée sur proposition du jury:
Lausanne, EPFL2006
Prof. A. Mermoud, président du juryDr G. Wagnières, directeur de thèse
Prof. G. Bourg-Heckly, rapporteurProf. C. Depeursinge, rapporteur
Dr B.-C. Weber, rapporteur
clinical fluorescence spectroscopy and imaging for the detection of early carcinoma
by autofluorescence bronchoscopy and the study of the protoporphyrin ix
pharmacokinetics in the endometrium
Tanja GABRECHT
THÈSE NO 3537 (2006)
ÉCOLE POLYTECHNIQUE FÉDÉRALE DE LAUSANNE
PRÉSENTÉE LE 16 jUIN 2006
à LA FACULTÉ ENVIRONNEMENT NATUREL, ARCHITECTURAL ET CONSTRUIT
Laboratoire de pollution atmosphérique et du sol
SECTION DES SCIENCES ET INGÉNIERIE DE L'ENVIRONNEMENT

3
"The whole life is nothing more than questions that have taken unto themselves shape, and bear within themselves the sum of their own answer: and answers that are pregnant with questions. Only fools see it otherwise."
Gustav Meyrink, The Golem
To my family for their care and support.
To André .


I
ABBREVIATIONS List of abbreviations used throughout the text in alphabetic order: AF Autofluorescence
AFB Autofluorescence bronchoscopy
ALA Aminolaevulinic acid
AMD Age-related Macula Degeneration
CCD Charge-Coupled Device
CIS Carcinoma in situ
CT Computed Tomography
CXR Chest X-ray
DAFE Diagnostic AutoFluorescence Endoscopy
DV Digital Video
ENT Ear-nose-throat
FAD Flavin Adenine Dinucleotide (oxidised form)
FD Fluorescence detection
FWHM Full width half-maximum
GI Gastro-intestinal (tract)
h-ALA 5- hexylester-aminolaevulinic acid
HPD Haematoporphyrin Derivative
MRI Magnetic resonance imaging
NADH Nicotinamide adenine dinucleotide (reduced form)
NADPH Nicotinamide adenine dinucleotide phosphate (reduced form)
NPV Negative Predictive Value
NSCLC Non-small cell lung carcinoma
PDT Photodynamic therapy
PEA Photodynamic endometrial ablation
PET Positron emission tomography
PpIX Protoporphyrin IX
PAL Phase Altenating Line (video norm)
PPV Positive Predictive Value
PS Photosensitiser
RGB Red/Green/Blue (video signal)
SCC Squamous cell carcinoma
SCLC Small-cell lung carcinoma


III
ABSTRACT The aim of this thesis is to optimise and gain fundamental information on two applications of photomedicine using fluorescence imaging and spectrofluorometry: (1) the detection of early bronchial cancer by autofluorescence imaging and (2) the endometrial ablation by photodynamic therapy (PDT) based on the use of Protoporphyrin IX (PpIX).
Fluorescence imaging and spectroscopy require a fluorochrome localised within the tissue. The fluorochrome can either be endogenous (naturally synthesised in the body), endogenously induced (synthesised in the body from an administered drug), or exogenous (synthesised outside the body). This thesis concentrates on the clinical applications of the endogenous and an exogenously induced fluorochrome (PpIX). Therefore, this work has been divided into two parts according to the type of fluorochromes.
The numerous endogenous fluorochromes occur naturally. They are collectively responsible for the fluorescence properties of biological tissues. This tissue’s intrinsic fluorescence is also referred to as autofluorescence (AF). The AF of bronchial tissues, change when they become dysplastic or neoplastic. Early neoplastic or dysplastic lesions show an overall decrease in the AF intensity as well as a distorsion of the spectral shape. Endoscopic imaging devices rely on this principle to detect early neoplastic lesions in the tracheo-bronchial tree.
The first part of this thesis describes our efforts to improve the performance of AFB and to gather insight into the mechanisms at the origin of the AF contrast in the bronchi. For this purpose, we conducted a number of clinical and ex vivo studies using imaging and spectrofluorometry. Our initial clinical imaging study revealed that the detection of a red background image instead of the red AF image increased the lesion-to-healthy tissue contrast by a factor of 2. This improvement has been implemented in an AFB device that is currently commercialised by the Richard Wolf Endoskope GmbH. In a seperate clinical imaging study we investigated the influence of the excitation wavelength on the AF contrast. Using a narrowband (6 nm FWHM) excitation around 410 nm resulted in a 1.5 times higher lesion-to-healthy tissue intensity contrast than observed with a comparable broadband (80 nm FWHM) excitation. A supplemental study showed that short wavelength blue backscattered light around 430 nm has the potential to discriminate true positive lesions (i.e. early neoplastic lesions detected positive with the AFB system) from false positive lesions (i.e. benign tissue changes detected positive with the AFB system).
A spectrofluorometric ex vivo study was performed to gain insight on the mechanisms at the origin of these contrasts. Five principal mechanisms are discussed, namely changes of: (1) the fluorochrome's concentration, (2) the fluorochrome's metabolic status, (3) the fluorochrome's physico-chemical microenvironment, (4) the tissue architecture such as thickening of the epithelium, and (5) the concentration of light absorbing chromophores such as haemoglobin. We measured formalin fixed human bronchial tissue samples with an optical fibre based spectrofluorometer. The formalin fixed bronchial tissue samples showed a general decrease of the AF of early lesions compared to the healthy tissues. However, no distortion of the lesions' AF spectra with respect to that of the healthy tissues was observed. These results were confirmed by imaging of the tissue samples with our AFB system.
The observations from these ex vivo studies together with results obtained in clinics with our imaging system lead us to conclude that the AF contrast can be attributed to a combined effect induced by: (1) changes in the architecture of superficial tissues and (2) the concentration and spatial distribution of haemoglobin in the submucosa.
IV
Furthermore, we investigated inter-patient variations of the bronchial AF to estimate their impact on the spectral/photonic design of AFB systems. An endoscopic reference with tissue-like optical and spectral properties was designed for this purpose. Surprisingly, the AF intensities in spectroscopy of the human bronchi showed only minor (< 30 %) variations from one individual to another.
The exogenously induced fluorochrome Protoporphyrin IX (PpIX) is synthesised from 5-aminolaevulinic acid (5-ALA) in the haeme biosynthetic pathway. PpIX is widely used in PDT and fluoresence detection for both malignant and benign, lesions. The second part of this thesis deals with the pharmacokinetics of 5-ALA induced PpIX in the endometrium. The final goal of this study was the optimisation of the treatment protocol for photodynamic endometrial ablation to treat menorrhagia and hypermenorrhea. The PpIX build-up in the human endometrium was measured in vivo by spectrofluorometry following intra-uterine instillation of 5-ALA. An intra-uterine optical-fibre based probe was designed for this purpose. The PpIX pharmacokinetics showed important inter-patient and intra-patient variations regarding the time interval between the drug instillation and the maximal PpIX fluorescence. Indeed, we have found that this time interval ranges between 0.5 and 5 hours. The maximal measured PpIX fluorescence intensities varied by one order of magnitude from one patient to another. Finally, no correlation was found between the characteristics of the PpIX build-up and the patient's hormonal status.
Keywords: aminolevulinic acid, autofluorescence bronchoscopy, backscattered blue-violet light, backscattered red light, bronchial cancer, cancer, Carcinoma in situ, clinical study, contrast mechanism, DAFE, diagnostic autofluorescence endoscopy, dysplasia, endoscopy, imaging, in vivo, inter-patient variations, intra-patient variations, intra-uterine optical probe, PDT, pharmacokinetics, photodetection, photodynamic endometrial ablation, photodynamic therapy, photomedicine, Protoporphyrin IX; spectrofluorometry, tissue fluorescence, tissue optics

V
RÉSUMÉ L’objectif de cette thèse est d’optimiser et d’approfondir deux applications de photomédecine faisant usage de l’imagerie et de la spectroscopie de fluorescence : (1) la détection précoce du cancer bronchique par imagerie d’autofluorescence et (2) l’ablation de l’endomètre par thérapie photodynamique (PDT) avec l’usage de la protoporphyrine IX (PpIX).
L’imagerie et la spectroscopie de fluorescence requièrent un fluorochrome contenu dans le tissu. Le fluorochrome est dit endogène (synthétisé naturellement par le corps), induit de façon endogène (synthétisé par le corps découlant d’une drogue administrée), ou exogène (synthétisé hors du corps). Le sujet de cette thèse est consacré aux applications cliniques des fluorochromes endogènes et induit de façon endogène (PpIX). Dès lors, ce rapport de thèse est divisé en deux parties distinctes selon le type de fluorochrome.
De nombreux fluorochromes endogènes sont présents naturellement. Collectivement, ils contribuent aux propriétés de fluorescence des tissus biologiques. Cette fluorescence intrinsèque des tissus est souvent appelée autofluorescence (AF). L’AF du tissu bronchique change lorsqu’il devient néoplasique ou dysplasique. On observe sur toutes les lésions néoplasiques et dysplasiques une forte décroissance de l’intensité d’AF, ainsi qu’une distorsion de la forme spectrale. Ce principe est utilisé dans les appareils d’imagerie endoscopique pour détecter des lésions néoplasiques dans l’arbre trachéo-bronchique.
L’objectif de la première partie de cette thèse était d’améliorer la performance de la bronchoscopie en autofluorescence (AFB) et de découvrir les mécanismes prévalant à l’avènement de ces contrastes dans les bronches. Pour cela, nous avons conduit plusieurs études cliniques et ex vivo, faisant usage de l’imagerie et de la spectrofluorométrie. Plusieurs études cliniques utilisant l’imagerie font partie intégrante de ce travail de thèse. Dans la première, nous avons établi que la détection d’une image formé par le rouge rétro-diffusé, en lieu et place d’une image rouge d’AF, permet d’améliorer le contraste d’un facteur 2. Ce dispositif a été implémenté dans l’appareil d’AFB, actuellement commercialisé par Richard Wolf Endoskope GmbH. Dans la deuxième, nous avons étudié l’influence de la lumière excitatrice sur le contraste d’AF. Pour cela, nous avons utilisé une excitation à bande étroite centrée à 410nm et obtenu un contraste lésion-tissu sain 1.5 fois supérieur à celui obtenu avec une excitation à bande large. La troisième étude montra que le bleu à courtes longueurs d’onde (430nm) rétro-diffusé pouvait différencier les lésions vraies-positives (càd. lésions néoplasiques précoces détectées avec l’AFB) des lésions fausses-positives (càd. changements bénins des tissus détectés avec l’AFB).
Une étude spectrofluorométrique ex vivo fut réalisée pour comprendre les mécanismes à l’origine des contrastes. Cinq mécanismes principaux seront discutés : (1) la concentration des fluorochromes (2) l’état métabolique des fluorochromes (3) le micro-environnement physico-chimique des fluorochromes (4) la structure du tissu (par ex. l’épaississement de l’épithélium) et (5) la concentration des chromophores absorbants, comme l’hémoglobine. Nous avons mesuré des échantillons de tissus bronchiques fixés en formaline avec un spectrofluoromètre à fibre optique. Ces échantillons ont généralement montré une décroissance de l’AF des lésions précoces en comparaison avec le tissu sain. Pourtant, aucune distorsion ne fut observée entre le spectre d’AF sur les lésions et celui des tissus sains. Ces résultats furent confirmés par l’imagerie des ces échantillons tissulaires avec notre appareil AFB.
Les observations de ces études ex vivo, combinées aux résultats obtenus en clinique avec notre système d’imagerie, nous amènent à conclure que le contraste d’autofluorescence peut

VI
être attribué à un effet combiné induit par (1) la structure architecturale des tissus superficiels, ainsi que (2) la distribution spatiale et la concentration de l’hémoglobine dans la sous-muqueuse.
En outre, nous avons étudié les variations inter-patients de l’AF bronchique pour estimer leur impact sur le design du système AFB. Une référence endoscopique dont les propriétés optiques et spectrales étaient proches de celles du tissu fut construite dans ce but. A notre étonnement, l’intensité et la spectroscopie d’AF a montré uniquement de faibles variations (<30%) d’un individu à l’autre.
La protoporphyrine IX (PpIX), fluorochrome induit de façon endogène, est synthétisée à partir de l’acide 5-aminolévulinique (5-ALA) dans la chaîne de biosynthèse de l’hème. PpIX est largement utilisé pour la PDT et la détection de fluorescence des lésions malignes et bénignes. La deuxième partie de cette thèse traite de l’étude pharmacocinétique de la PpIX dérivée de 5-ALA dans l’endomètre. L’objectif de cette étude était l’optimisation du protocole de traitement pour l’ablation photodynamique de l’endomètre pour le traitement de la ménorragie et de l’hyperménorrhée. La hausse de la concentration de PpIX dans l’endomètre humain après l’instillation intra-utérine de 5-ALA fut mesurée in vivo par spectrofluorométrie. Une sonde optique intra-utérine à fibre optique fut construite spécialement pour cette étude. La pharmacocinétique de la PpIX montra d’importantes variations intra- et inter-patients quant aux différences dans la durée entre l’instillation et le maximum de fluorescence dû à la PpIX. En effet, nous avons trouvé que cette durée pouvait varier entre 0.5 et 5 heures. L’intensité maximale de la fluorescence due à la PpIX variait d’un ordre de grandeur d’une patiente à l’autre. En définitive, aucune corrélation n’a été trouvée entre les facteurs de croissance de la PpIX et le statut hormonal des patientes.
Mots-clés: Acide aminolévulinic, bronchoscopie en autofluorescence, lumière bleu-violet rétrodiffusée, lulmière rouge rétrodiffusée, cancer bronchique, cancer, carcinome in situ, étude clinique, mécanisme du contraste, DAFE, endoscopie diagnostique en autofluorescence, dysplasie, endoscopie, imagerie, in vivo, variations inter-patients, variations intra-patients, sonde optique intra-uterine, PDT, pharmacocinétique, photodétection, ablation photodynamique de l'endomètre, thérapie photodynamique, photo-médecine, Protoporphyrine IX, spectrofluorométrie, fluorescence de tissu, optique du tissu
TABLE OF CONTENTS Abbreviations ..................................................................................................... I
Abstract ............................................................................................................. III
Résumé.................................................................................................................V
Chapter 1 Introduction to Photomedicine ..........................................................1 1.1 Physical Aspects of Fluorescence................................................................................ 2
1.1.1 The non-radiative decays and internal conversion (IC) ........................................ 3 1.1.2 The radiative decay ............................................................................................... 3 1.1.3 The intersystem crossing....................................................................................... 3
1.2 Tissue Optics................................................................................................................ 5 1.3 Introduction to tissue characterisation by Fluorescence .............................................. 7
1.3.1 Historical aspects of fluorescence detection ......................................................... 8 1.3.2 Autofluorescence .................................................................................................. 8 1.3.3 Endogenously induced fluorescence................................................................... 11 1.3.4 Exogenous fluorochromes .................................................................................. 13
1.4 Photodynamic Therapy .............................................................................................. 13 1.4.1 Basic principles ................................................................................................... 14 1.4.2 Historical aspects ................................................................................................ 15 1.4.3 Properties and major applications of photosensitisers ........................................ 16
1.5 References.................................................................................................................. 18
Part I Autofluorescence for the Diagnosis of Early (Pre-)Neoplastic Lesions in the Tracheo-Bronchial Tree ............................................................23
Chapter 2 Cancer basics ...................................................................................25 2.1 Facts about Cancer ..................................................................................................... 25 2.2 Cancer Detection and Diagnosis ................................................................................ 29
2.2.1 Cancer treatments................................................................................................ 32 2.3 References.................................................................................................................. 33
Chapter 3 Introduction to Bronchology ...........................................................35 3.1 Bronchial Anatomy and Histology ............................................................................ 35
3.1.1 The trachea.......................................................................................................... 37 3.1.2 The bronchi ......................................................................................................... 37
3.2 Bronchial Cancer ....................................................................................................... 38 3.2.1 Carcinogenesis and staging of bronchial cancer ................................................. 40
3.3 Detection, Diagnosis and Treatment of bronchial Cancer: An overview .................. 43 3.3.1 Detection of bronchial cancer ............................................................................. 44 3.3.2 Treatment of bronchial cancer ............................................................................ 45
3.4 References.................................................................................................................. 46
Chapter 4 Autofluorescence Bronchoscopy.....................................................51 4.1 State of the Art of Autofluorescence Bronchoscopy ................................................. 52

4.2 Principle of Autofluorescence Bronchoscopy ........................................................... 52 4.2.1 Spectroscopy of the bronchial autofluorescence................................................. 52 4.2.2 Origin of the bronchial autofluorescence contrast .............................................. 53 4.2.3 Optical properties of normal bronchial tissue ..................................................... 56
4.3 Autofluorescence Bronchoscopy Instrumentation..................................................... 58 4.4 References.................................................................................................................. 60
Chapter 5 Comprehensive and Optimisation Studies of the Autofluorescence Bronchoscopy.............................................................................63
5.1 Optimised autofluorescence bronchoscopy using additional backscattered red light 71 5.2 The Richard Wolf’s DAFE system............................................................................ 87
5.2.1 The light source................................................................................................... 87 5.2.2 The camera system.............................................................................................. 88 5.2.3 Image Analysis.................................................................................................... 88 5.2.4 Specific features of the DAFE system ................................................................ 89 5.2.5 References........................................................................................................... 94
5.3 Influence of the excitation wavelength bandwidth on the healthy-to-lesion contrast in AFB ........................................................................................................................... 95
5.3.1 Materials and Methods........................................................................................ 96 5.3.2 Results................................................................................................................. 97 5.3.3 Discussion ........................................................................................................... 99 5.3.4 References......................................................................................................... 103
5.4 Blue-Violet Excited Autofluorescence Spectroscopy and Imaging of Normal and Cancerous Human Bronchial Tissue after Formalin Fixation................................. 105
5.5 Improvement of the specificity of Cancer Detection by Autofluorescence Imaging in the Tracheo-Bronchial Tree using backscattered Blue-Violet Light....................... 121
5.6 Design of an endosocopic optical reference to be used for autofluorescence bronchoscopy with the DAFE system..................................................................... 135
5.7 Autofluorescence bronchoscopy: Quantification of inter-patient tissue remitted light intensity variations .................................................................................................. 145
Chapter 6 Conclusions and Future Prospects.................................................155 6.1 References................................................................................................................ 159
Part II Clinical Pharmacokinetics of 5-ALA induced PpIX to Optimise the Treatment of Uterine Bleeding Disorders by PhotoDynamic Therapy................................................................................................161
Chapter 7 Uterine bleeding disorders.............................................................163 7.1 Anatomy and Histology of the Uterus ..................................................................... 163 7.2 Abnormal Uterine Bleeding..................................................................................... 165 7.3 Treatment of Menorrhagia and Hypermenorrhea .................................................... 166 7.4 Photodynamic Endometrial Ablation....................................................................... 167 7.5 References................................................................................................................ 169
Chapter 8 The clinical pharmacokinetics study .............................................171 8.1 Materials and Methods............................................................................................. 171
8.1.1 The spectrofluorometer ..................................................................................... 171 8.1.2 Characterisation of the spectrofluorometer....................................................... 173

8.1.3 Configuration for the clinical measurements .................................................... 173 8.1.4 The intrauterine optical probe ........................................................................... 174 8.1.5 Patients.............................................................................................................. 175 8.1.6 Protocol ............................................................................................................. 175 8.1.7 Data Processing................................................................................................. 176
8.2 Results...................................................................................................................... 177 8.3 References................................................................................................................ 178
Chapter 9 Discussion and Future Prospects...................................................179 9.1 Discussion ................................................................................................................ 179 9.2 Conclusions.............................................................................................................. 183 9.3 Future Prospects....................................................................................................... 183 9.4 References................................................................................................................ 185
Acknowledgements ........................................................................................187
Appendix A Clinical cases with the DAFE system .......................................191
Appendix B Camera Basics ...........................................................................197
Appendix C Fluorescence in History .............................................................199
Appendix D Bronchoscopy............................................................................201
Appendix E Glossary .....................................................................................203
Curriculum Vitae............................................................................................211

Chapter 1 Introduction to Photomedicine
hotobiology deals with the effects of light on biological tissues. Its study domain encompasses a diversity of physiological processes from circadian rhythms, plant growth (photosynthesis) and animal vision, to sunburn and cancer. Some interactions of
light with tissue originate from endogenous physico-chemical conditions while others follow administration of photoactive agents. In this report, we will focus on the reactions between light and biological tissues related to the emission of fluorescence and/or the generation of cytotoxic agents in biological tissues. In medicine, fluorescence and fluorescence related photochemical reactions of biological tissues avail for therapeutic and diagnostic purposes. Medical diagnosis using the fluorescence from biological tissue is referred to as fluorescence diagnosis (FD). The treatment of neoplasia and non-neoplastic diseases using the light induced photochemical reactions after application of a photosensitising agent is called photodynamic therapy (PDT).
The first part of this chapter gives an introduction to the physical basics of fluorescence and an overview of the optical properties of biological tissues. The second part concentrates on tissue optics, and the characteristics of endogenous and exogenous fluorescence of biological tissues and its clinical applications. Moreover, the physicochemical basics for PDT are defined. Physical and chemical features of FD will be discussed separately in Chapter 3 of this thesis.
P

Chapter 1 – Introduction to Photomedecine
2
1.1 Physical Aspects of Fluorescence Luminescence is the emission of electromagnetic radiation, especially light, from an electronically excited system. Luminescence could be considered a cold light source, as the emission of light occurs at temperatures far below that required for incandescence. Physically speaking, luminescence occurs during transitions of a physical system, i.e. atoms or molecules, from its electronically excited states to its ground state under emission of light. Depending on the mechanisms leading the system to its excited state, the light emitting phenomenon is named chemoluminescence, bioluminescence, electroluminescence, cathodoluminescence, and photoluminescence. Other forms of luminescence such as radioluminescence, triboluminescence, and thermoluminescence will not be discussed here. Chemoluminescence, found for example in "glow-in-the-dark" plastic tubes, results from excitation by chemical reactions. In bioluminescence, the excitation energy is provided by biochemical, mainly enzymatical, reactions in living organisms. Examples for bioluminescence are the glow of fireflies (lampyridae) and sea plankton (Dinoflagellat noctiluca) observed in summer nights. Electroluminescence is activated by electrical current. It is the origin of the light emission in neon fluorescence tubes, LEDs (light emitting diodes), auroras (polar lights) and lightening. A special form is cathodoluminescence originating from excitation with accelerated electrons, as is the case in television and computer cathod ray tube (CRT) screens. Photoluminescence is the luminescence from systems excited with ultraviolet (UV), visible (VIS) or infrared (IR) light. Examples for photoluminescence are watch hands or (emergency) signs that glow in the dark. Essentially, photoluminescence can be divided into two categories, depending on the nature of the system's excited state: fluorescence and phosphorescence. Fluorescence is the emission resulting from the decay of an excited singlet state, while phosphorescence is the emission resulting from the decay of an excited triplet state. Molecules showing fluorescence and phosphorescence behaviour are also called fluorochromes or fluorophores.
The various molecular processes which can occur in excited states are frequently illustrated in a Jablonski diagram depicted in Figure 1.1. In such diagrams, the energy levels of a molecule are shown as horizontal lines on a vertical, schematic energy scale. Transitions between the energy levels are depicted by vertical arrows. The diagram in Figure 1.1 shows the singlet ground (S0), first (S1) and second (S2) excited electronic singlet states of a molecule, as well as the first excited triplet state (T1). On each of these electronic levels, the molecule can exist in a number of vibrational sublevels, which themselves consist of different rotational sublevels. The latter are not shown in the figure for the sake of readability. The total intrinsic energy of a molecule state is the sum of the electronic, vibrational, and rotational contributions. The ground state, i.e. the most stable energy configuration, is typically a singlet state (S0).
Excitation occurs when an electron in the S0 ground state absorbs energy, typically in the form of light and is transferred to one of its higher energetic states. These transitions occur in about 10-15 s. The excited states are short living and decay rapidly. Three principal decay mechanisms are possible: (1) the non-radiative decay (vibrational relaxation and internal conversion (IC)), (2) the radiative decay, and (3) the intersystem crossing (ISC).
Chapter 1 – Introduction to Photomedecine
3
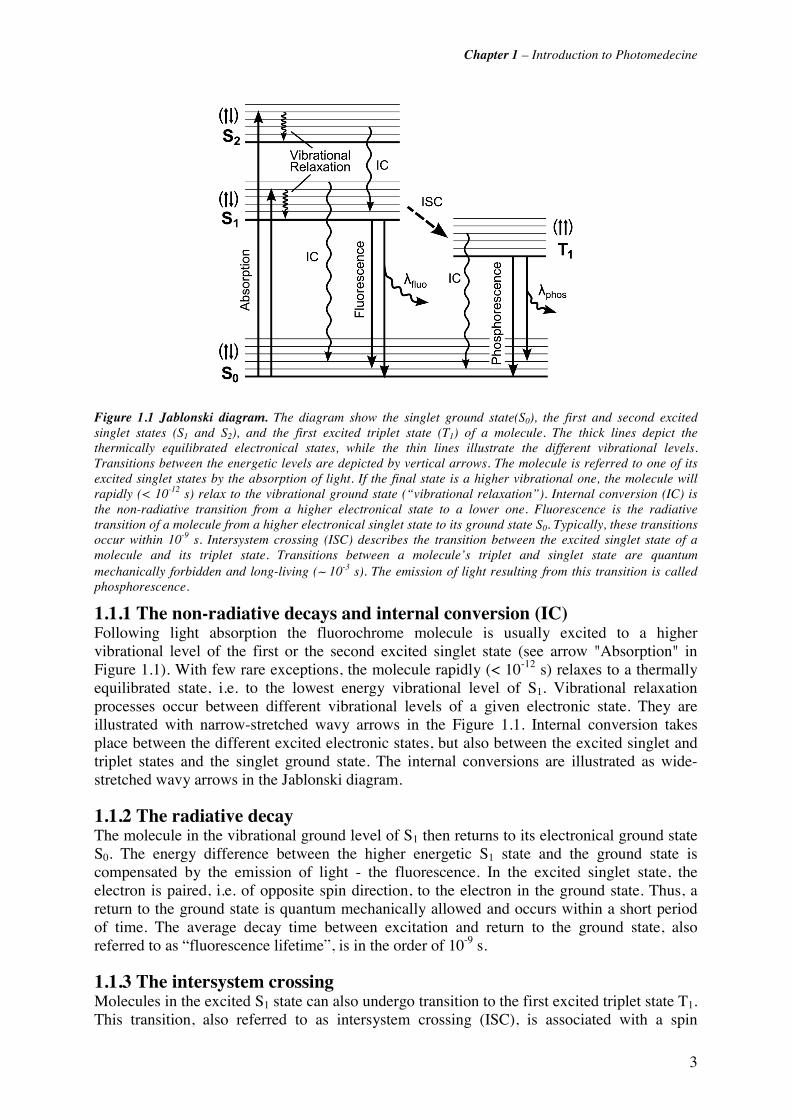
Figure 1.1 Jablonski diagram. The diagram show the singlet ground state(S0), the first and second excited singlet states (S1 and S2), and the first excited triplet state (T1) of a molecule. The thick lines depict the thermically equilibrated electronical states, while the thin lines illustrate the different vibrational levels. Transitions between the energetic levels are depicted by vertical arrows. The molecule is referred to one of its excited singlet states by the absorption of light. If the final state is a higher vibrational one, the molecule will rapidly (< 10-12 s) relax to the vibrational ground state (“vibrational relaxation”). Internal conversion (IC) is the non-radiative transition from a higher electronical state to a lower one. Fluorescence is the radiative transition of a molecule from a higher electronical singlet state to its ground state S0. Typically, these transitions occur within 10-9 s. Intersystem crossing (ISC) describes the transition between the excited singlet state of a molecule and its triplet state. Transitions between a molecule’s triplet and singlet state are quantum mechanically forbidden and long-living (∼ 10-3 s). The emission of light resulting from this transition is called phosphorescence.
1.1.1 The non-radiative decays and internal conversion (IC) Following light absorption the fluorochrome molecule is usually excited to a higher vibrational level of the first or the second excited singlet state (see arrow "Absorption" in Figure 1.1). With few rare exceptions, the molecule rapidly (< 10-12 s) relaxes to a thermally equilibrated state, i.e. to the lowest energy vibrational level of S1. Vibrational relaxation processes occur between different vibrational levels of a given electronic state. They are illustrated with narrow-stretched wavy arrows in the Figure 1.1. Internal conversion takes place between the different excited electronic states, but also between the excited singlet and triplet states and the singlet ground state. The internal conversions are illustrated as wide-stretched wavy arrows in the Jablonski diagram.
1.1.2 The radiative decay The molecule in the vibrational ground level of S1 then returns to its electronical ground state S0. The energy difference between the higher energetic S1 state and the ground state is compensated by the emission of light - the fluorescence. In the excited singlet state, the electron is paired, i.e. of opposite spin direction, to the electron in the ground state. Thus, a return to the ground state is quantum mechanically allowed and occurs within a short period of time. The average decay time between excitation and return to the ground state, also referred to as “fluorescence lifetime”, is in the order of 10-9 s.
1.1.3 The intersystem crossing Molecules in the excited S1 state can also undergo transition to the first excited triplet state T1. This transition, also referred to as intersystem crossing (ISC), is associated with a spin

Chapter 1 – Introduction to Photomedecine
4
conversion, i.e. a "flip" in the spin direction. Consequently, the electron in the excited triplet state is unpaired with the electron in the S0 state. According to the selection rules of quantum mechanics, transition between the T1 and the S0 states are forbidden. Relaxation from the excited T1 state to the S0 ground state with emission of light is named phosphorescence. Typical phosphorescence lifetimes are in the order of 10-3 s, thus much longer than fluorescence lifetimes. Apart from the mechanisms listed above, several other interactions like quenching (see below) and energy transfer can lead to the decay of a molecule's excited state.
A fluorochrome is spectrally characterised by two spectra, namely excitation and emission, defined as follows: The excitation spectrum is the wavelength distribution of the excitation light absorbed by the fluorochrome. An emission spectrum is the wavelength distribution of the emission light measured with a fixed excitation wavelength. It is typically presented as a plot of the emitted fluorescence intensity versus the wavelength [nm] or the wavenumber [cm-1]. The fluorescence emission and absorption spectra in this work will be plotted as a function of the wavelength [nm].
The Jablonski diagram in Figure 1.1 shows that the absorption energy is typically higher than the emission energy. Consequently, a fluorescence emission occurs at longer wavelengths or lower energies than excitation. This phenomenon is referred to as "Stokes’ shift" (Sir George G. Stokes, 1852). This is due to the rapid decay to the lowest vibrational level of the S1 state. Furthermore, fluorochromes generally decay to higher vibrational levels of S0. This results in further loss of excitation energy by thermalisation of the excess vibrational energy. Solvant effects, excited-state reactions, formation of complexes, and energy transfer are also causes of the Stokes’ shift.
One fundamental property of fluorescence is that the shape of the emission spectrum is generally independent of the excitation wavelength. This is known as Vavilov-Kasha's rule. This phenomenon can be understood in the context of the non-radiative decays. Absorption of high energetic photons will excite the fluorochrome to higher electronic and vibrational levels. However, the excess energy is rapidly dissipated by vibrational relaxation and internal conversion to the lowest vibrational level of S1. As internal conversion generally occurs in 10-12 s or less, while fluorescence lifetimes are in the order of 10-9 s. Therefore, dissipation of the higher excited states to the lowest S1 state is generally complete on fluorescence emission. Consequently, the fluorochrome's emission spectrum usually reflects the S1 → S0 transition independent of the initial excitation.
Another important correlation between a fluorochrome's excitation and emission spectra is expressed in the mirror image rule. Indeed, most fluorochromes show mirror image symmetry between their fluorescence emission spectrum and their S0 → S1 absorption spectrum. This is due to the fact that vibrational levels are equally spaced in S0 and S1. Since excitation occurs within about 10-15 s, the position of the nuclei is fixed and the transitions are said to be vertical. This is called the Franck-Condon principle. In other words, if a particular transition probability between vibrational levels (e.g. the 0 and the 2nd) is most likely in absorption, the reciprocal transition is also most probable in emission. The mirror image rule and the Frank Condon principle are illustrated in Figure 1.1. However, it is needless to say that there are numerous exceptions to the rule, too.
One of the most important properties of a fluorochrome is its quantum yield. It describes the number of photons emitted relative to the number of absorbed photons. Consequently, fluorochromes with large quantum yields display the brightest emissions. Rhodamines are an example of fluorochrome with quantum yields approaching unity. The quantum yield and the
Chapter 1 – Introduction to Photomedecine
5
fluorescence lifetime generally determine the intensity of the flurorescence emitted by an "ideal" fluorochrome.
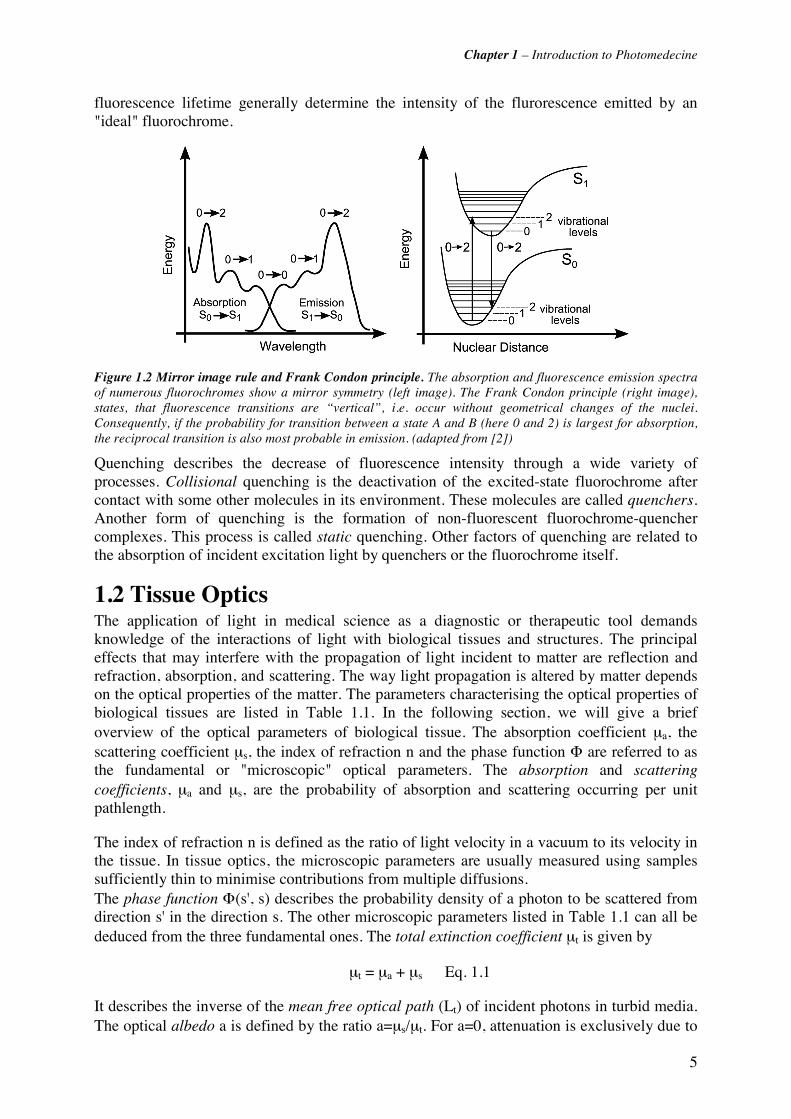
Figure 1.2 Mirror image rule and Frank Condon principle. The absorption and fluorescence emission spectra of numerous fluorochromes show a mirror symmetry (left image). The Frank Condon principle (right image), states, that fluorescence transitions are “vertical”, i.e. occur without geometrical changes of the nuclei. Consequently, if the probability for transition between a state A and B (here 0 and 2) is largest for absorption, the reciprocal transition is also most probable in emission. (adapted from [2])
Quenching describes the decrease of fluorescence intensity through a wide variety of processes. Collisional quenching is the deactivation of the excited-state fluorochrome after contact with some other molecules in its environment. These molecules are called quenchers. Another form of quenching is the formation of non-fluorescent fluorochrome-quencher complexes. This process is called static quenching. Other factors of quenching are related to the absorption of incident excitation light by quenchers or the fluorochrome itself.
1.2 Tissue Optics The application of light in medical science as a diagnostic or therapeutic tool demands knowledge of the interactions of light with biological tissues and structures. The principal effects that may interfere with the propagation of light incident to matter are reflection and refraction, absorption, and scattering. The way light propagation is altered by matter depends on the optical properties of the matter. The parameters characterising the optical properties of biological tissues are listed in Table 1.1. In the following section, we will give a brief overview of the optical parameters of biological tissue. The absorption coefficient μa, the scattering coefficient μs, the index of refraction n and the phase function Φ are referred to as the fundamental or "microscopic" optical parameters. The absorption and scattering coefficients, μa and μs, are the probability of absorption and scattering occurring per unit pathlength.
The index of refraction n is defined as the ratio of light velocity in a vacuum to its velocity in the tissue. In tissue optics, the microscopic parameters are usually measured using samples sufficiently thin to minimise contributions from multiple diffusions. The phase function Φ(s', s) describes the probability density of a photon to be scattered from direction s' in the direction s. The other microscopic parameters listed in Table 1.1 can all be deduced from the three fundamental ones. The total extinction coefficient μt is given by
μt = μa + μs Eq. 1.1
It describes the inverse of the mean free optical path (Lt) of incident photons in turbid media. The optical albedo a is defined by the ratio a=μs/μt. For a=0, attenuation is exclusively due to
Chapter 1 – Introduction to Photomedecine
6
absorption, whereas in the case of a=1 only scattering occurs. The distribution of scattering in turbid media is described by the anisotropy factor g. In terms of the phase function Φ(s’, s), g corresponds to the mean cosinus of the scattering angle. A value of g=1 denotes purely forward scattering, g=-1 purely backward scattering and g=0 isotropic scattering. For most biological tissues g ranges from 0.7 to 0.99 [4], indicating that photons are preferably scattered in the forward direction. The effective scattering coefficient
μs' = μs *(1-g) Eq. 1.2
takes into account this anisotropy of scattering for biological tissue. All optical coefficients, except g, are generally presented in [mm-1]. The anisotropy factor and the albedo are dimensionless.
The macroscopic parameters, μeff, d, R, and T, listed in the lower part of table 1 are generally measured from thick tissue samples. The microscopic parameters can be evaluated from the macroscopic ones using theoretical models for light propagation. The effective attenuation coefficient μeff is the inverse of the effective penetration depth d of light into tissue. The latter is the depth at which the incident spatial irradiance has decreased to by 1/e in the tissue. The relation between μeff and the microscopic parameters μa and μs' can be derived from photon transport theory:
Fundamental microscopic parameters
μa Absorption coefficient [mm-1]
μs Scattering coefficient [mm-1]
n Refraction index
Φ(s, s') Phase function
Dependent microscopic parameters
μ t = μ a + μs Total extinction coefficient [mm-1]
Lt = μt-1 Free optical path length [mm]
a = μs/μ t Albedo
g ∫− ⋅Φ⋅=1
1dss)1,s()a
2
1( Anisotropy factor
μs' =(1-g)* μs Reduced scattering coefficient [mm-1]
Macroscopic parameters
μeff )'(3 saa μ+μ⋅μ= Effective attenuation
coefficient [mm-1]
d =1/μeff Efffective penetration depth [mm]
R Diffuse reflectance
T Diffuse transmittance
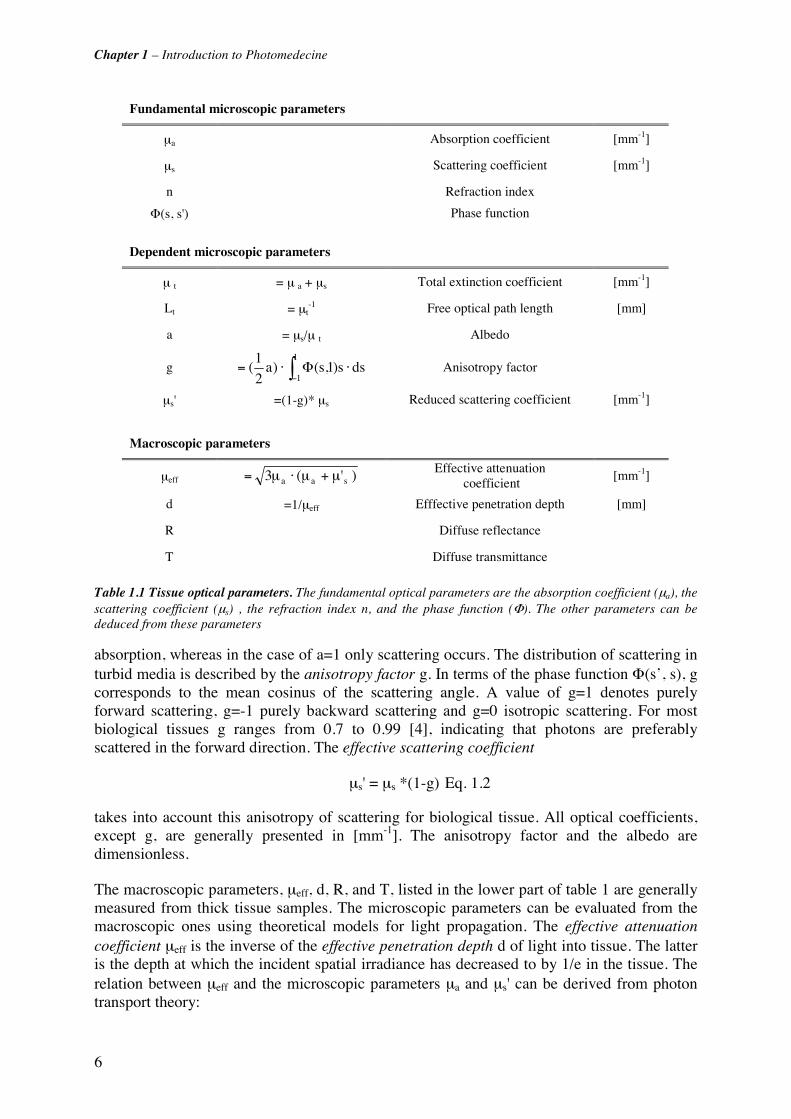
Table 1.1 Tissue optical parameters. The fundamental optical parameters are the absorption coefficient (μa), the scattering coefficient (μs) , the refraction index n, and the phase function (Φ). The other parameters can be deduced from these parameters

Chapter 1 – Introduction to Photomedecine
7
)'(3 saaeff μμμμ +⋅= Eq. 1.3 [4].
The diffuse reflectance R represents the ratio of the relative spatial irradiance reflected by the tissue relative to the spatial irradiance reflected by a white reflectance standard. In the case of diffuse transmission, the transmitted spatial irradiance is computed relative to a 100% transmission standard.
Absorption plays an important role in photomedical applications. The major light absorbing molecules in mammalian tissues are oxy- and deoxyhaemoglobin, melanin, myoglobin and water. The absorption spectra of these molecules are shown in Figure 1.3. We can observe a lower absorption between 600 nm and 1000 nm. This spectral region is called the "therapeutic window". Here, tissue scattering predominates over absorption and the light penetration depth into the tissue is high. Some optical properties of human bronchial tissue are reported in Chapter 3 of this thesis.
Figure 1.3 Principal absorbers in biological tissue. Apart from water, melanin and haemoglobin in its oxygenised (HbO2) and de-oxygenised (Hb, not shown) form are the most important absorbers of light in tissue. Their absorption is lower in the wavelength range between 600 nm and 1000 nm. This region is referred to as the therapeutic window. (adapted from [1])
1.3 Introduction to tissue characterisation by Fluorescence The fundamental principle of tissue characterisation or cancer detection by fluorescence is to exploit the optical contrast, either intrinsic (autofluorescence) or induced (exogenous or exogenously induced), between the lesion and its surrounding healthy tissue. The contrast may be generated from the fluorescence brightness, spectral shape, lifetime or a combination of them. Detection of these differences is generally performed by spectroscopic measurements (space or time-resolved) or by imaging. Excitation of the tissue AF may be done in two distinct ways. In the first, the excitation light delivery fibre or fibre bundle is placed in direct contact with the tissue, while in the second, essentially used for imaging, a larger surface area of the tissue illuminated. Each approach has advantages and limitations. With point contact,

Chapter 1 – Introduction to Photomedecine
8
pressure on the tissue may alter the local blood content and so distort the spectrum. Spectral distorsions may also arise in large area illumination due to inhomogeneities in the tissue optical absorption and/or scattering. With non-contact excitation the detected signal intensity depends on the variable source-tissue surface distance. For spectroscopy the fluorescence emission may be collected via the same fibre as used for light delivery or by one or more separate fibres. Separate delivery and collection optics are required for imaging. Imaging detectors are generally based on intensified charge-coupled device (CCD) cameras. Most point spectroscopy devices detect the fluorescence signal by (intensified) photodiode arrays or CCD based detectors.
1.3.1 Historical aspects of fluorescence detection The diagnostic potential of fluorescence from biological tissue was first described by Stubel in 1911. Stubel investigated the native fluorescence (autofluorescence) of animal tissue under illumination with UV light [5] In 1924 the French Policard observed the red fluorescence from porphyrins when examing tumour lesions with light from a Wood lamp [6]. Indeed, Policard observed the endogenous porphyrins in tumour tissue. Several years later, the Germans Auler and Banzer first described the localisation and fluorescence of exogenously administered porphyrins in malignant tumours [7]. Several studies have been reported on the exogenous application of HpD, porphyrins and porphyrin precursors for the detection of neoplastic and non-neoplatic lesions in different organs. In the 1960's and 1970's fluorescence detection using haeamatoporphyrin derivatives was performed by several groups to detect neoplasia on the cervix [8, 9], oesophagus, rectum, bronchi [10, 11] and the head and neck sphere (mouth, pharynx, larynx)[12].
In the 1980s, Alfano et al. [13] and Yang et al. [14] performed pioneering work in the field of autofluorescence spectroscopy of neoplastic and non-neoplastic tissues in humans and animals. Nowadays spectroscopy and imaging of the tissue autofluorescence is used as a diagnostic tool in several medical specialities including head and neck (ENT), bronchology, urology and gynaecology.
The fluorochromes responsible for the tissue fluorescence can be classified in two categories: (1) the tissue endogenous fluorescence, referred to as autofluorescence (AF), and (2) fluorescence from exogenous or endogenously induced fluorochromes (induced fluorescence). While AF is essentially used for diagnostic purposes, exogenous or endogenously induced fluorochromes are used for both diagnosis and therapy.
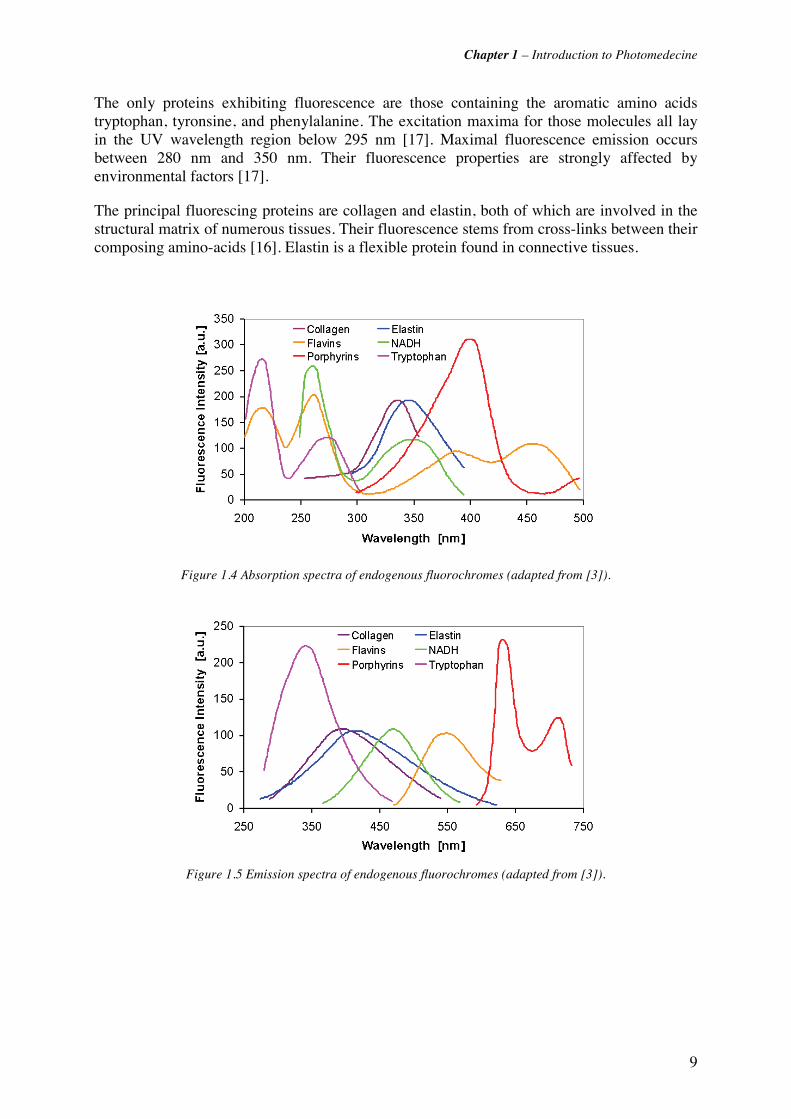
1.3.2 Autofluorescence Autofluorescence of biological tissues results from endogenous fluorescing molecules (fluorochromes). Almost all biological tissues emit fluorescence when excited at appropriate wavelength in the UV or visible spectral range. A biological tissue is made up of a complex matrix of fluorescing and non-fluorescing molecules. The mixture of the different fluorescence emission spectra combined with the tissue optical properties like scattering and absorption makes the AF spectrum of a biological tissue broad and structurless. The main fluorochromes in human tissue are listed in Table 1.2, together with various absorption and emission maxima extracted from literature. The Figure 1.4 and Figure 1.5 show the fluorescence absorption and emission spectra of various tissue fluorochromes (adapted from [15]). It can easily be seen, that the absorption maxima of endogenous fluorochromes predominately lay in the UV and the blue-violet visible wavelength range. Most endogenous fluorochromes are involved in cellular metabolic processes or are associated with the structural matrix of the tissues [16]. They can be classified in four groups, namely the aromatic amino acids and proteins, the pyridine nucleotides, the flavins, and the porphyrins.
Chapter 1 – Introduction to Photomedecine
9
The only proteins exhibiting fluorescence are those containing the aromatic amino acids tryptophan, tyronsine, and phenylalanine. The excitation maxima for those molecules all lay in the UV wavelength region below 295 nm [17]. Maximal fluorescence emission occurs between 280 nm and 350 nm. Their fluorescence properties are strongly affected by environmental factors [17].
The principal fluorescing proteins are collagen and elastin, both of which are involved in the structural matrix of numerous tissues. Their fluorescence stems from cross-links between their composing amino-acids [16]. Elastin is a flexible protein found in connective tissues.
Figure 1.4 Absorption spectra of endogenous fluorochromes (adapted from [3]).
Figure 1.5 Emission spectra of endogenous fluorochromes (adapted from [3]).

Chapter 1 – Introduction to Photomedecine
10
Table 1.2 Fluorescence properties of principal endogenous fluorochromes.

Chapter 1 – Introduction to Photomedecine
11
The absorption and emission maxima of its crosslinked forms are around 325 nm and 400 nm [16]. Powdered elastin has absorption maxima at 350 nm, 410 nm and 450 nm, with corresponding peak fluorescence emissions at 420 nm, 500 nm, and 520 nm [16]. Collagen has an inextensible fibrous structure and is the main protein in connective tissue. Cartilage, ligaments and tendons as well as bones and teeth are mainly composed of collagen. The absorption maximum of collagen fibres is around 325 nm with a maximal fluorescence emission around 400 nm [18]. Measurements of powdered bovine collagen show additional absorption and emission maxima pairs at 280 nm and 310 nm, 265 nm and 385 nm, and 450 nm and 530 nm [16].
Flavins and pyridine nucleotides are strong electron acceptors and play an important role in cellular energy metabolism. Flavin adenine dinucleotide (FAD) is the major flavin-related electron carrier. Its oxidised form (FAD) is fluorescent, while its reduced form (FADH2) is not. The fluorescence excitation maximum of FAD lies around 450 nm and the emission maximum around 530 nm [16, 17]. Other important flavin derivatives in biological tissue include flavin mononucleotide (FMN) and riboflavin (Vitamin B2).
The other main electron acceptors are nicotinamide adenine dinucleotide (NAD) and nicotinamide adenine dinucleotide phosphate (NAD(P)). Both molecules emit fluorescence in their reduced forms, NADH and NAD(P)H. Fluorescence excitation and emission maxima can be found around 340 nm and 450 nm, respectively. Protein-binding drastically changes the fluorescence excitation and emission maxima and can increase the quantum yield by a factor of 4 [16].
Most porphyrins are synthesised in mammals from 5-aminolevulinic acid, as will be described in Section 1.3.3. The main molecule of the porphyrin family is heme, the precursor of haemoglobin, the oxygen-carrying red blood chromophore. Even if heme itself does not fluoresce, most porphyrins do. Their excitation maxima lay around 400 nm and the emission maximum around 635 nm. The fluorescence intensities strongly depend on the pH of the molecule’s environment.
Other molecules being involved in the AF of biological tissues are pyridoxine (Vitamine B6), retinol (Vitamin A) and lipopigments (pigments associated with lipid oxidation products, found in aging and various pathologic processes), among others. The interested reader will refer to the review of [16] and the Handbook of Biomedical Optics [15] for more information.
Autofluorescence spectroscopy and imaging have been widely investigated and are used for diagnosis of lesions in the bronchus [19-22], bladder [23, 24], head and neck [25], oesophagus [26-28], skin [29, 30] and uterine cervix [31-33]. A detailed review of the applications of fluorescence spectroscopy and imaging for oncological applications was published by Wagnières et al. [15].
1.3.3 Endogenously induced fluorescence Exogenous or exogenously induced flurochromes are used for both diagnostic and therapeutic purposes. As most of those fluorochromes also have phototoxic properties, they are referred to as photosensitisers (PS).
Endogenously induced fluorochromes are not directly administered to the patient but endogenously generated from a precurser applied either topically or systemically to the patient. The most widely used endogenously induced fluorochrome in PDT and fluorescence detection is Protoporphyrin IX (PpIX). PpIX belong to the group of phorphyrins which which play an important role in the formation of key biomolecules like haemoglobin, myoglobin,

Chapter 1 – Introduction to Photomedecine
12
and cytochromes. It is synthesised within the biosynthesis cycle of haem, depicted in Figure 1.6. The PpIX precursor is delta- or 5-aminolaevulinic acid (5-ALA) or one of its derivatives. The initial step in this process is the condensation of glycine and succinyl coenzyme A (succinyl CoA) to 5-aminolaevulinic acid (5-ALA) in the mitochondrion. 5-ALA production is regulated by haem in a negative feedback mechanism, i.e. the presence of haem in the cell inhibits the production of 5-ALA. The 5-ALA molecule passes into the cytoplasm where it undergoes several chemical reactions regulated by various enzymes to produce the so-called corproporphyrinogen III. The latter re-enters the mitochondrion and is converted to protoporphyrinogen IX and finally to the phototoxic Pp IX. The last step is the chelation of an iron ion into the porphyrin ring, resulting in the non-fluorescent haem molecule. This chelation is enabled by the ferrochelatase. The haem molecule is then further transformed to haemoglobin.
Figure 1.6 The biosynthesis of haem
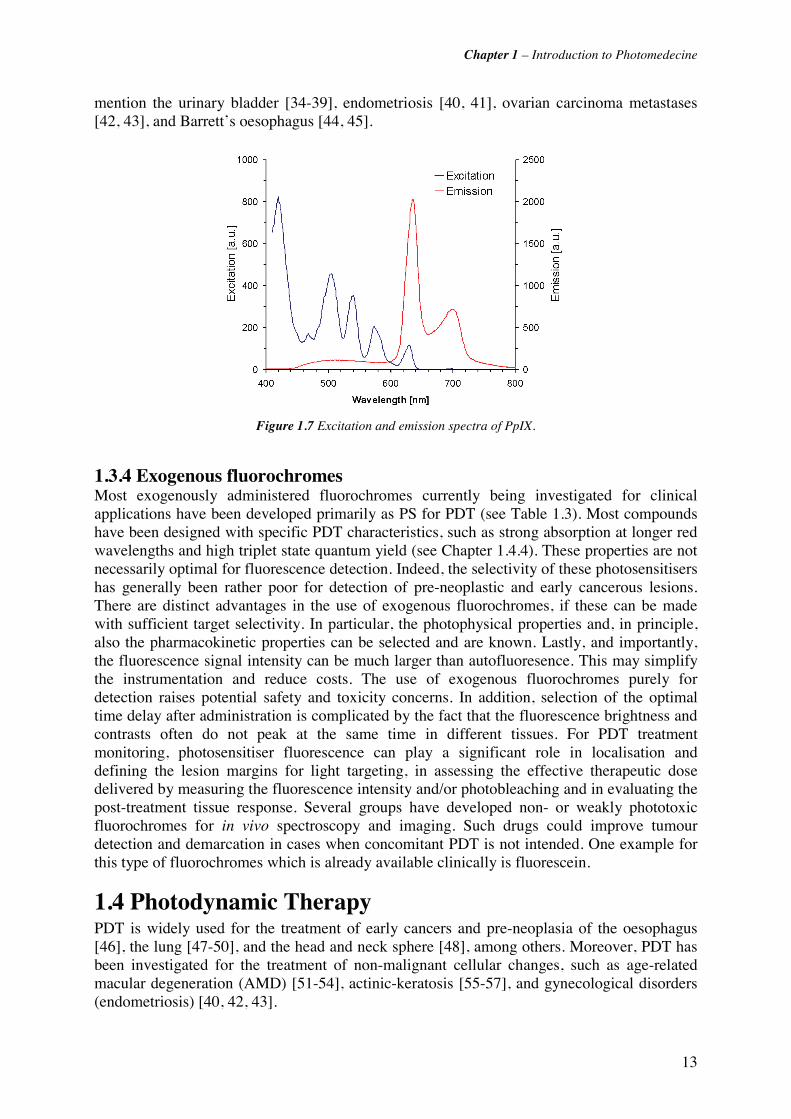
Exogenously administered 5-ALA (or one of its derivatives) fools the negative feedback mechanism of haem production. Thus, the external application of 5-ALA can lead to a temporary accumulation of PpIX. The amount of accumulated PpIX depends on the cell type or pathology. For instance, neoplastic cells show a higher accumulation of PpIX after administration of exogenous 5-ALA than healthy ones. The resulting fluorescence intensity contrast between healthy tissues and lesions is used in ALA-induced PpIX fluorescence detection of dysplasia and early neoplasia. An advantage of ALA-based PDT or fluorescence detection relativ to AF detection is that the spectral properties of PpIX are known (Figure 1.7). PpIX may be excited at several wavelengths between 405 nm and 632 nm, resulting in a typical red emission in the 625nm-725 nm region. It should be noted, that PpIX is an effective photosensitiser and was initially used for this purpose. ALA-induced PpIX fluorescence detection has been used for various cancerous and non-cancerous conditions. We should
Chapter 1 – Introduction to Photomedecine
13
mention the urinary bladder [34-39], endometriosis [40, 41], ovarian carcinoma metastases [42, 43], and Barrett’s oesophagus [44, 45].
Figure 1.7 Excitation and emission spectra of PpIX.
1.3.4 Exogenous fluorochromes Most exogenously administered fluorochromes currently being investigated for clinical applications have been developed primarily as PS for PDT (see Table 1.3). Most compounds have been designed with specific PDT characteristics, such as strong absorption at longer red wavelengths and high triplet state quantum yield (see Chapter 1.4.4). These properties are not necessarily optimal for fluorescence detection. Indeed, the selectivity of these photosensitisers has generally been rather poor for detection of pre-neoplastic and early cancerous lesions. There are distinct advantages in the use of exogenous fluorochromes, if these can be made with sufficient target selectivity. In particular, the photophysical properties and, in principle, also the pharmacokinetic properties can be selected and are known. Lastly, and importantly, the fluorescence signal intensity can be much larger than autofluoresence. This may simplify the instrumentation and reduce costs. The use of exogenous fluorochromes purely for detection raises potential safety and toxicity concerns. In addition, selection of the optimal time delay after administration is complicated by the fact that the fluorescence brightness and contrasts often do not peak at the same time in different tissues. For PDT treatment monitoring, photosensitiser fluorescence can play a significant role in localisation and defining the lesion margins for light targeting, in assessing the effective therapeutic dose delivered by measuring the fluorescence intensity and/or photobleaching and in evaluating the post-treatment tissue response. Several groups have developed non- or weakly phototoxic fluorochromes for in vivo spectroscopy and imaging. Such drugs could improve tumour detection and demarcation in cases when concomitant PDT is not intended. One example for this type of fluorochromes which is already available clinically is fluorescein.
1.4 Photodynamic Therapy PDT is widely used for the treatment of early cancers and pre-neoplasia of the oesophagus [46], the lung [47-50], and the head and neck sphere [48], among others. Moreover, PDT has been investigated for the treatment of non-malignant cellular changes, such as age-related macular degeneration (AMD) [51-54], actinic-keratosis [55-57], and gynecological disorders (endometriosis) [40, 42, 43].
Chapter 1 – Introduction to Photomedecine
14
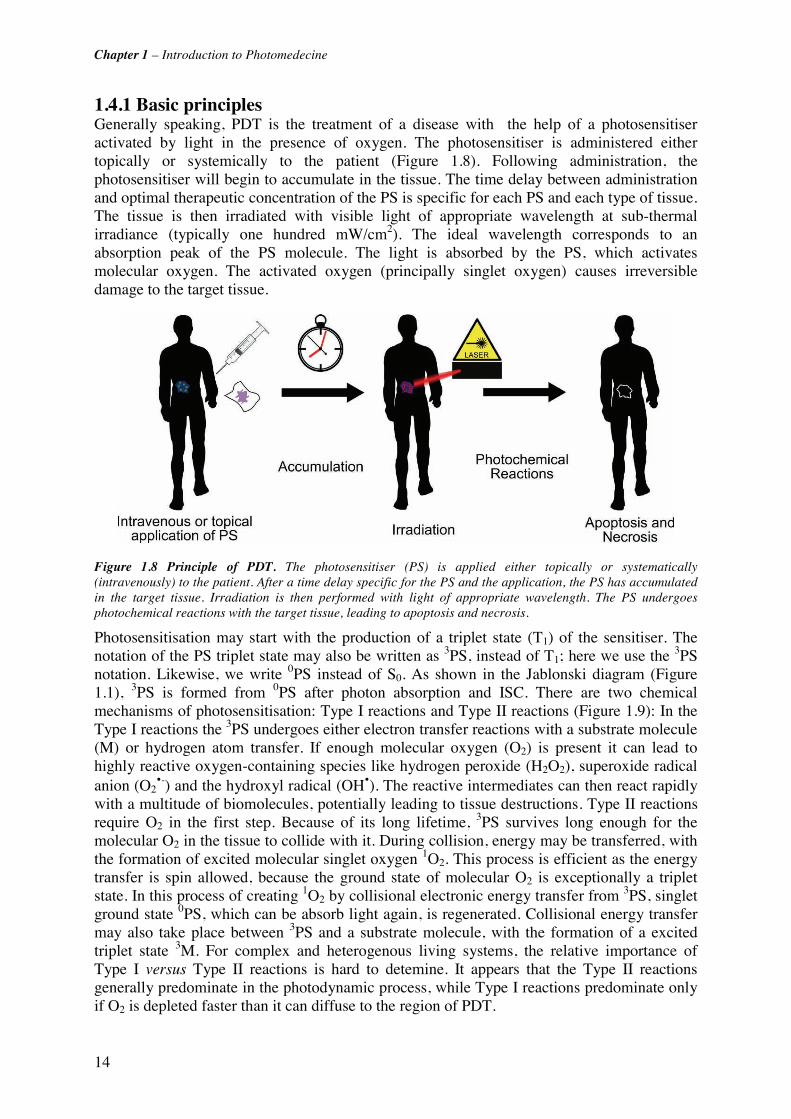
1.4.1 Basic principles Generally speaking, PDT is the treatment of a disease with the help of a photosensitiser activated by light in the presence of oxygen. The photosensitiser is administered either topically or systemically to the patient (Figure 1.8). Following administration, the photosensitiser will begin to accumulate in the tissue. The time delay between administration and optimal therapeutic concentration of the PS is specific for each PS and each type of tissue. The tissue is then irradiated with visible light of appropriate wavelength at sub-thermal irradiance (typically one hundred mW/cm2). The ideal wavelength corresponds to an absorption peak of the PS molecule. The light is absorbed by the PS, which activates molecular oxygen. The activated oxygen (principally singlet oxygen) causes irreversible damage to the target tissue.
Figure 1.8 Principle of PDT. The photosensitiser (PS) is applied either topically or systematically (intravenously) to the patient. After a time delay specific for the PS and the application, the PS has accumulated in the target tissue. Irradiation is then performed with light of appropriate wavelength. The PS undergoes photochemical reactions with the target tissue, leading to apoptosis and necrosis.
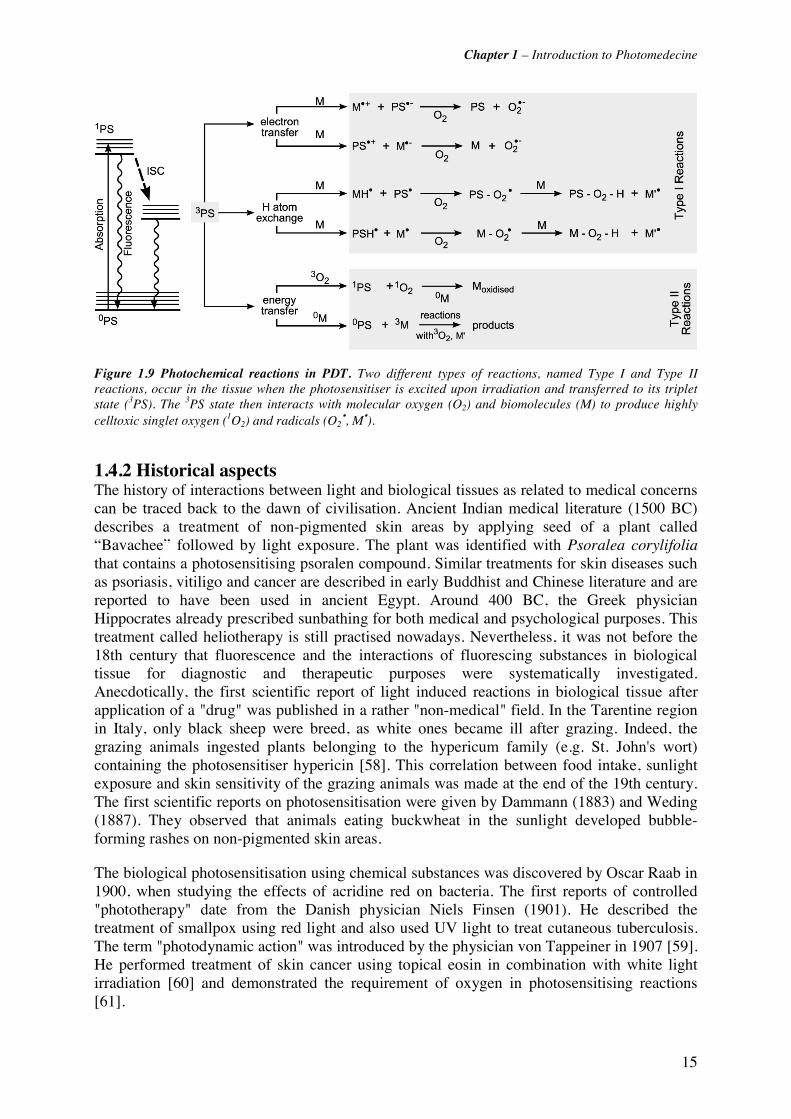
Photosensitisation may start with the production of a triplet state (T1) of the sensitiser. The notation of the PS triplet state may also be written as 3PS, instead of T1; here we use the 3PS notation. Likewise, we write 0PS instead of S0. As shown in the Jablonski diagram (Figure 1.1), 3PS is formed from 0PS after photon absorption and ISC. There are two chemical mechanisms of photosensitisation: Type I reactions and Type II reactions (Figure 1.9): In the Type I reactions the 3PS undergoes either electron transfer reactions with a substrate molecule (M) or hydrogen atom transfer. If enough molecular oxygen (O2) is present it can lead to highly reactive oxygen-containing species like hydrogen peroxide (H2O2), superoxide radical anion (O2
•-) and the hydroxyl radical (OH•). The reactive intermediates can then react rapidly with a multitude of biomolecules, potentially leading to tissue destructions. Type II reactions require O2 in the first step. Because of its long lifetime, 3PS survives long enough for the molecular O2 in the tissue to collide with it. During collision, energy may be transferred, with the formation of excited molecular singlet oxygen 1O2. This process is efficient as the energy transfer is spin allowed, because the ground state of molecular O2 is exceptionally a triplet state. In this process of creating 1O2 by collisional electronic energy transfer from 3PS, singlet ground state 0PS, which can be absorb light again, is regenerated. Collisional energy transfer may also take place between 3PS and a substrate molecule, with the formation of a excited triplet state 3M. For complex and heterogenous living systems, the relative importance of Type I versus Type II reactions is hard to detemine. It appears that the Type II reactions generally predominate in the photodynamic process, while Type I reactions predominate only if O2 is depleted faster than it can diffuse to the region of PDT.
Chapter 1 – Introduction to Photomedecine
15
Figure 1.9 Photochemical reactions in PDT. Two different types of reactions, named Type I and Type II reactions, occur in the tissue when the photosensitiser is excited upon irradiation and transferred to its triplet state (3PS). The 3PS state then interacts with molecular oxygen (O2) and biomolecules (M) to produce highly celltoxic singlet oxygen (1O2) and radicals (O2
•, M•).
1.4.2 Historical aspects The history of interactions between light and biological tissues as related to medical concerns can be traced back to the dawn of civilisation. Ancient Indian medical literature (1500 BC) describes a treatment of non-pigmented skin areas by applying seed of a plant called “Bavachee” followed by light exposure. The plant was identified with Psoralea corylifolia that contains a photosensitising psoralen compound. Similar treatments for skin diseases such as psoriasis, vitiligo and cancer are described in early Buddhist and Chinese literature and are reported to have been used in ancient Egypt. Around 400 BC, the Greek physician Hippocrates already prescribed sunbathing for both medical and psychological purposes. This treatment called heliotherapy is still practised nowadays. Nevertheless, it was not before the 18th century that fluorescence and the interactions of fluorescing substances in biological tissue for diagnostic and therapeutic purposes were systematically investigated. Anecdotically, the first scientific report of light induced reactions in biological tissue after application of a "drug" was published in a rather "non-medical" field. In the Tarentine region in Italy, only black sheep were breed, as white ones became ill after grazing. Indeed, the grazing animals ingested plants belonging to the hypericum family (e.g. St. John's wort) containing the photosensitiser hypericin [58]. This correlation between food intake, sunlight exposure and skin sensitivity of the grazing animals was made at the end of the 19th century. The first scientific reports on photosensitisation were given by Dammann (1883) and Weding (1887). They observed that animals eating buckwheat in the sunlight developed bubble-forming rashes on non-pigmented skin areas.
The biological photosensitisation using chemical substances was discovered by Oscar Raab in 1900, when studying the effects of acridine red on bacteria. The first reports of controlled "phototherapy" date from the Danish physician Niels Finsen (1901). He described the treatment of smallpox using red light and also used UV light to treat cutaneous tuberculosis. The term "photodynamic action" was introduced by the physician von Tappeiner in 1907 [59]. He performed treatment of skin cancer using topical eosin in combination with white light irradiation [60] and demonstrated the requirement of oxygen in photosensitising reactions [61].

Chapter 1 – Introduction to Photomedecine
16
The first report of endogenous porphyrin photosensitisation was given in 1913 by Meyer-Betz. After injecting himself with 200 mg of a haemotoporphyrin derivative (HpD), Meyer-Betz noted severe pain and swelling of body parts exposed to light. In 1911, Haussmann had reported on the effect of HpD and light exposure on cell culture and mice. Since then, haematoporphyrin dervatives and porphyrins have been used for diagnostic purposes over a long time period (see section below). In 1972, Diamond et al. [62] first proposed to use the phototoxic properties of porphyrins for the targeted treatment of neoplasia. Six years later, Dougherty published the first report on a large series of patients treated with PDT using HpD. Since then, several other photosensitising agents have been and are nowadays under investigation for the treatment and diagnosis of neoplastic and pre-neoplastic tissues in humans.
1.4.3 Properties and major applications of photosensitisers Exogenous and exogenously induced fluorochromes for fluorescence diagnostics and/or photodynamic therapy have to fulfil a number of requirements that are often related to their application in photodynamic therapy. The principles of photodynamic therapy will be explained in the next section. The main features of a PS can be summarised as absorption, fluorescence, generation of singlet oxygen, photostability, and selectivity.
Photosensitisers ideally have excitation maxima within the therapeutic window (600 nm - 1200 nm). Biological tissues are most transparent in this wavelength region allowing high penetration depth. The latter is essential for the treatment of invasive tumoural lesions. Fluorescence detection does generally not require high penetration depth. Fluorochromes used for FD might therefore have shorter excitation wavelengths. However, excitation wavelengths below 390 nm are not recommended because potential mutagenic side effects can arise from UV irradiation.
The formation of highly reactive singlet oxygen is fundamental for the cytotoxic effects in PDT (see section PDT below). Thus, effective photosensitisers have long living triplet states and a high quantum yield for singlet oxygen formation.
Nearly all fluorochromes and chromophores undergo photodegeneration after intensive light irradiation, including changes in their molecular structure and fluorescence properties. This phenomenon is called photobleaching. The outcome of PDT and FD strongly depends on the concentration of the photosensitiser in the lesions to be treated/diagnosed. This requires either a high photostability or a high concentration of the fluorochrome or photosensitiser in the tissue. All fluorochromes used for FD or PDT have to be highly selective for the tissue or the lesion to be diagnosed/treated. More precisely, fluorochromes and photosensitisers in oncological applications must accumulate preferably in neoplastic lesions, while showing only low concentrations in healthy tissues.
Additional requirements for photosensitisers and fluorochromes for FD include low dark toxicity and rapid clearance from the body after treatment/diagnosis. Dark toxicity is the cytotoxic potential without any activation of the fluorochrome with light.
Many research groups concentrate their work on the design, synthesis and application of molecules for FD and PDT. Numerous photosensitisers and fluorochromes have already been investigated in pre-clinical and clinical studies. However, up to now, only a few of them have achieved approval by national and international drug authorities.
Table 1.3 presents a short overview of current photosensitisers and precursors that have been approved for clinical PDT. Photofrin® is currently the most widely used photosensitiser for

Chapter 1 – Introduction to Photomedecine
17
PDT nowadays. It has is used for the photodynamic treatment of both, early and advanced, oesophageal [63-66] and bronchial cancers [63, 64], advanced bladder cancer [35, 37], early gastric cancer [67], and cervical dysplasia and early cancers. Visudyne® and Photopoint® are successfully used for the treatment of age-related macular degenenration (AMD) in patients with predominantly classic or small occult subfoveal choroidal neovascularisation [68]. Foscan® is applied for the photodynamic treatment of advanced oral cancers[69, 70]. Among the PpIX precursors, Levulan® and Metvix® have reached clinical approval for dermatologic applications. Both drugs are used for the photodynamic treatment of non-hyperkertotic actinic keratosis of the face and the scalp [71]. Furthermore, Metvix was approved for the treatment of basal cell carcinoma and Bowen’s disease.
Photosensitizer Application Company
Photofrin® Haematoporphyrin derivative (HpD)
Esophageal Cancer (E+A) Lung Cancer (E+A) Bladder Cancer (A) Gastric Cancer (E)
Cervical Cancer/ Dysp. (E)
QLT / Axcan
Visudyne® Benzoderivative monoacid ring A
(BPDMA)
Age-related macular degeneration in patients with predominantly
classic or small occult subfoveal choroidal neovascularization
QLT / Novartis
Photopoint® Rostaporphin (SnET2) Idem Miravant
Exo
gneo
us P
S
Foscan® Tetra(m-hydroxyphenyl)chlorin
(m-THPC)
Oral carcinoma (A) Biolitec
Levulan® 5-ALA Non-hyperkeratotic actinic keratoses of the face and scalp.
DUSA
Pre
curs
ors
Metvix® Methyl-ester ALA (m-ALA
Basal cell carcinoma, actinic keratosis and Bowen's disease.
Photocure
Table 1.3 Frequently used photosensitisers used in clinical PDT nowadays. (A = advanced stage disease, E = early stage disease)
Chapter 1 – Introduction to Photomedecine
18
1.5 References [1] J. L. Boulnois, "Photophysical processes in recent medical laser developments: A review," Lasers in Medical Science 1(1), 47-66 (1986)
[2] J. R. Lakowicz, Principles of fluorescence spectroscopy, Kluwer Academic/Plenum Publishers, New York (1999).
[3] G. Wagnieres, W. Star and B. Wilson, "In vivo fluorescence spectroscopy and imaging for oncological applications.," Photochem Photobiol 68(5), 603-632 (1998)
[4] M. Niemz, Laser-Tissue Interactions, Springer, Berlin (1996).
[5] H. Stübel, "Die Fluoreszenz tierischer Gewebe in ultraviolettem Licht," Pflügers Arch Physiol 142(1), 1-14 (1911)
[6] A. Policard, "Etudes sur les aspects offerts par des tumeurs experimentales examines a la lumiere de Wood " CR Soc Biol 91(1423-1424 (1924)
[7] H. Auler and G. Banzer, "Untersuchungen über die Rolle der Porphyrine bei geschwulstkranken Menschen und Tieren," Z Krebsforschung 53(65-68 (1942)
[8] R. L. Lipson, J. H. Pratt, E. J. Baldes and M. B. Dockerty, "Hematoporphyrine Derivative for Detection of Cervical Cancer," Obstet Gynecol 24(78-84 (1964)
[9] M. J. Gray, R. Lipson, J. V. Maeck, L. Parker and D. Romeyn, "Use of hematoporphyrin derivative in detection and management of cervical cancer," Am J Obstet Gynecol 99(6), 766-771 (1967)
[10] H. B. Gregorie, Jr., E. O. Horger, J. L. Ward, J. F. Green, T. Richards, H. C. Robertson, Jr. and T. B. Stevenson, "Hematoporphyrin-derivative fluorescence in malignant neoplasms," Ann Surg 167(6), 820-828 (1968)
[11] R. L. Lipson, E. J. Baldes and M. J. Gray, "Hematoporphyrin derivative for detection and management of cancer," Cancer 20(12), 2255-2257 (1967)
[12] J. R. Leonard and W. L. Beck, "Hematoporphyrin fluorescence: an aid in diagnosis of malignant neoplasms," Laryngoscope 81(3), 365-372 (1971)
[13] R. Alfano, D. Tata, J. Cordero, P. Tomashefsky, F. Longo and M. Alfano, "Laser induced fluorescence spectroscopy from native cancerous and normal tissue," Quantum Electronics, IEEE Journal of 20(12), 1507-1511 (1984)
[14] Y. L. Yang, Y. M. Ye, F. M. Li, Y. F. Li and P. Z. Ma, "Characteristic autofluorescence for cancer diagnosis and its origin," Lasers Surg Med 7(6), 528-532 (1987)
[15] G. Wagnières, A. McWilliams and S. Lam, "Lung cancer imaging with fluorescence endoscopy," in Handbook of Biomedical Fluorescence, M.-A. Myceck and B. W. Pogue, pp. 361-396, Marcel Dekker, Inc. (2003).
[16] R. Richards-Kortum and E. Sevick-Muraca, "Quantitative optical spectroscopy for tissue diagnosis," Annual Review of Physical Chemistry 47(1), 555-606 (1996)
[17] O. Wolfbeis, "Fluorescence of organic natural products," in Molecular Luminiscence Spectroscopy, S. G. Schulmann, pp. 167-370, John Wiley and Sons, New York (1993).
[18] L. Stryer, Biochemistry, W.H. Freeman and Company, New York (1995).
Chapter 1 – Introduction to Photomedecine
19
[19] D. Goujon, M. Zellweger, A. Radu, G. P., B.-C. Weber, H. van den Bergh, P. Monnier and G. Wagnières, "In vivo autofluorescence imaging of early cancers in the human tracheobronchial tree with a spectrally optimized system," J Biomed Optics 8(1), 17-25 (2003)
[20] S. Lam, T. Kennedy and M. Unger, "Localization of bronchial intraepitheloial neoplastic lesions by fluorescence bronchoscopy," Chest 113(3), 696-702 (1998)
[21] S. Lam, C. MacAulay, J. C. leRiche and B. Palcic, "Detection and localization of early lung cancer by fluorescence bronchoscopy," Cancer Suppl. 89(11), 2468-2473 (2000)
[22] K. Häußinger, F. Stanzel, M. Kohlhäufl, H. Becker, F. Herth, A. Kreuzer, B. Schmidt, J. Strausz, S. Cavaliere, K.-M. Müller, R.-M. Huber, U. Pichlmeier and C. T. Bolliger, "Autofluorescence bronchoscopy with white light bronchoscopy compared with white light bronchoscopy alone for the detection of precancerous lesions: A European randomised controlled multicentre trial," Thorax 60(6), 496-503 (2005)
[23] M. Szygula, B. Wojciechowski, M. Adamek, A. Pietrusa, A. Kawczyk-Krupka, W. Cebula, W. Zieleznik, T. Biniszkiewicz, A. Sieron? and W. Duda, "Fluorescent diagnosis of urinary bladder cancer - A comparison of two diagnostic modalities," Photodiagnosis and Photodynamic Therapy 1(1), 23-26 (2004)
[24] D. Zaak, H. Stepp, R. Baumgartner, P. Schneede, R. Waidelich, D. Frimberger, A. Hartmann, R. Knüchel, A. Hofstetter and A. Hohla, "Ultraviolet-excited (308 nm) autofluorescence for bladder cancer detection," Urology 60(6), 1029-1033 (2002)
[25] R. Paczona, S. Temam, F. Janot, P. Marandas and B. Luboinski, "Autofluorescence videoendoscopy for photodiagnosis of head and neck squamous cell carcinoma," European Archives of Oto-Rhino-Laryngology 260(10), 544-548 (2003)
[26] J. J. G. H. M. Bergman, M. A. Kara, F. P. Peters, F. J. W. Ten Kate, S. J. Van Deventer and P. Fockens, "Endoscopic video autofluorescence imaging may improve the detection of early neoplasia in patients with Barrett's esophagus," Gastrointestinal Endoscopy 61(6), 679-685 (2005)
[27] K. Niepsuj, G. Niepsuj, W. Cebula, W. Zielez?nik, M. Adamek, A. Sielan?czyk, J. Adamczyk, J. Kurek and A. Sieron?, "Autofluorescence endoscopy for detection of high-grade dysplasia in short-segment Barrett's esophagus," Gastrointestinal Endoscopy 58(5), 715-719 (2003)
[28] R. S. DaCosta, B. C. Wilson and N. E. Marcon, "Spectroscopy and fluorescence in esophageal diseases," Best Practice and Research in Clinical Gastroenterology 20(1), 41-57 (2006)
[29] L. Brancaleon, J. H. Tu, N. Kollias, G. Menaker, J. D. Fallon and A. J. Durkin, "In vivo fluorescence spectroscopy of nonmelanoma skin cancer," Photochemistry and Photobiology 73(2), 178-183 (2001)
[30] L. H. Laiho, S. Pelet, T. M. Hancewicz, P. D. Kaplan and P. T. C. So, "Two-photon 3-D mapping of ex vivo human skin endogenous fluorescence species based on fluorescence emission spectra," Journal of Biomedical Optics 10(2), 1-10 (2005)
[31] J. M. Benavides, S. Chang, S. Y. Park, R. Richards-Kortum, N. Mackinnon, C. MacAulay, A. Milbourne, A. Malpica and M. Follen, "Multispectral digital colposcopy for in vivo detection of cervical cancer," Optics Express 11(10), 1223-1236 (2003)
[32] N. Ramanujam, M. F. Mitchell, A. Mehadevan, S. Warren, S. Thomsen, E. Silva and R. Richards-Kortum, "In vivo diagnosis of cervical intraepithelial neoplasia using 337-nm-excited laser-induced fluorescence," Proc. Natl. Acad. Sci USA 91(10193-10197 (1994)
[33] H. Weingandt, H. Stepp, R. Baumgartner, J. Diebold, W. Xiang and P. Hillemanns, "Autofluorescence spectroscopy for the diagnosis of cervical intraepithelial neoplasia," BJOG: An International Journal of Obstetrics and Gynaecology 109(8), 947-951 (2002)
[34] D. Zaak, E. Hungerhuber, P. Schneede, H. Stepp, D. Frimberger, S. Corvin, N. Schmeller, M. Kriegmair, A. Hofstetter and R. Knöchel, "Role of 5-aminolevulinic acid in the detection of urothelial premalignant lesions," Cancer 95(6), 1234-1238 (2002)
Chapter 1 – Introduction to Photomedecine
20
[35] P. Jichlinski, "Photodynamic applications in superficial bladder cancer: Facts and hopes!," Journal of Environmental Pathology, Toxicology and Oncology 25(1-2), 441-451 (2006)
[36] P. Jichlinski and H.-J. Leisinger, "Photodynamic therapy in superficial bladder cancer: Past, present and future," Urological Research 29(6), 396-405 (2001)
[37] D. Jocham and T. Gaertner, "Photodynamic diagnosis and therapy in urology," Aktuelle Urologie 31(SUPPL. 1), 87-91 (2000)
[38] N. Lange, P. Jichlinski, M. Zellweger, M. Forrer, L. Guillou, P. Kucera, G. Wagnières and H. van den Bergh, "Photodetection of early human bladder cancer based on the fluorescence of 5-aminolaevulinic acid hexylester-induced protoporphyrin IX: a pilot study," British Journal of Cancer 80(1/2), 185-193 (1999)
[39] M. Kriegmair, D. Zaak, R. Knuechel, R. Baumgartner and A. Hofstetter, "5-Aminolevulinic acid-induced fluorescence endoscopy for the detection of lower urinary tract tumors," Urologia Internationalis 63(1), 27-31 (1999)
[40] E. Malik, A. Meyhofer-Malik, D. Trutenau, H. Diddens, W. Kupker and K. Diedrich, "Photodynamic diagnosis of endometriosis using 5-aminolevulinic acid - A pilot study[Pilotstudie zur photodynamischen diagnostik der endometriose mittels 5- aminolavulinsaure]," Geburtshilfe und Frauenheilkunde 58(8), 420-425 (1998)
[41] P. Hillemanns, H. Weingandt, H. Stepp, R. Baumgartner, W. Xiang and M. Korell, "Assessment of 5-aminolevulinic acid-induced porphyrin fluorescence in patients with peritoneal endometriosis," American Journal of Obstetrics and Gynecology 183(1), 52-57 (2000)
[42] M. Löning, W. Küpker, K. Diedrich, H. Diddens and G. Hüttmann, "Laparoscopic Fluorescence Detection of Ovarian Carcinoma Metastases Using 5-Aminolevulinic Acid-Induced Protoporphyrin IX," Cancer 100(8), 1650-1656 (2004)
[43] F. Lüdicke, L. Berclaz, T. Gabrecht, N. Lange, G. Wagnières, H. Van Den Bergh and A. L. Major, "Photodynamic diagnosis of ovarian cancer using hexaminolaevulinate: A preclinical study," British Journal of Cancer 88(11), 1780-1784 (2003)
[44] C. Felley, P. Jornod, G. Dorta, T. Stepinac, N. Lange, T. Gabrecht, H. Van Den Bergh, G. Wagnières, C. Fontolliet, P. Grosjean, P. Monnier and G. VanMelle, "Endoscopic fluorescence detection of intraepithelial neoplasia in Barrett's esophagus after oral administration of aminolevulinic acid," Endoscopy 35(8), 663-668 (2003)
[45] S. Brand, T. D. Wang, K. T. Schomacker, J. M. Poneros, G. Y. Lauwers, C. C. Compton, M. C. Pedrosa and N. S. Nishioka, "Detection of high-grade dysplasia in Barrett's esophagus by spectroscopy measurement of 5-aminolevulinic acid-induced protoporphyrin IX fluorescence," Gastrointestinal endoscopy 56(4), 479-487 (2002)
[46] A. Radu, G. Wagnieres, H. van den Bergh and P. Monnier, "Photodynamic therapy of early squamous cell cancers of the esophagus," Gastrointest Endosc Clin N Am 10(3), 439-460 (2000)
[47] P. Monnier, M. Savary, C. Fontolliet, G. A. Wagnieres Chatelain, P. Cornaz, C. Depeursinge and H. Van den Bergh, "Photodetection and photodynamic therapy of 'early' squamous cell carcinomas of the pharynx, oesophagus and tracheo-bronchial tree," Lasers in Medical Science 5(2), 149-168 (1990)
[48] A. Radu, P. Grosjean, P. Monnier, C. Fontolliet, G. Wagnieres, A. Woodtli and H. Van Den Bergh, "Photodynamic therapy for 101 early cancers of the upper aerodigestive tract, the esophagus, and the bronchi: A single-institution experience," Diagnostic and Therapeutic Endoscopy 5(3), 145-154 (1999)
[49] H. Kato, K. Furukawa, M. Sato, T. Okunaka, Y. Kusunoki, M. Kawahara, M. Fukuoka, T. Miyazawa, T. Yana, K. Matsui, T. Shiraishi and H. Horinouchi, "Phase II clinical study of photodynamic therapy using mono-L-aspartyl chlorin e6 and diode laser for early superficial squamous cell carcinoma of the lung.," Lung Cancer 42(1), 103-111 (2003)
Chapter 1 – Introduction to Photomedecine
21
[50] T. G. Sutedja and P. E. Postmus, "Photodynamic therapy in lung cancer. A review," J Photochem Photobiol B 36(2), 199-204 (1996)
[51] J. Wachtlin, A. Wehner, H. Heimann, M. H. Foerster and A. Stroux, "Photodynamic therapy with verteporfin for choroidal neovascularisations in clinical routine outside the TAP study. One- and two-year results including juxtafoveal and extrafoveal CNV," Graefe's Archive for Clinical and Experimental Ophthalmology 243(5), 438-445 (2005)
[52] H. Van den Bergh, "Photodynamic therapy of age-related macular degeneration: History and principles," Seminars in Ophthalmology 16(4), 181-200 (2001)
[53] A. Gabel-Pfisterer, A. Wehner, H. Heimann, M. H. Foerster and J. Wachtlin, "Photodynamic therapy with verteporfin for recurrent choroidal neovascularisation following prior argon laser coagulation[Photodynamische therapie mit verteporfin bei rezidiven choroidaler neovaskularisationen (CNV) nach primärer argonlaserkoagulation]," Ophthalmologe 102(6), 592-596 (2005)
[54] R. F. Spaide, J. Sorenson and L. Maranan, "Photodynamic therapy with verteporfin combined with intravitreal injection of triamcinolone acetonide for choroidal neovascularization," Ophthalmology 112(2), 301-304 (2005)
[55] S. Radakovic-Fijan, H. Hönigsmann and A. Tanew, "Photodynamic therapy for actinic keratoses and Bowen's disease [Photodynamische therapie bei aktinischen keratosen und morbus Bowen]," Aktuelle Dermatologie 31(5), 225-232 (2005)
[56] S. Collaud, N. Lange, A. Juzeniene and J. Moan, "On the selectivity of 5-aminolevulinic acid-induced protoporphyrin IX formation," Current Medicinal Chemistry - Anti-Cancer Agents 4(3), 301-316 (2004)
[57] W. Bäumler, C. Abels and R. M. Szeimies, "Fluorescence diagnosis and photodynamic therapy in dermatology," Medical Laser Application 18(1), 47-56 (2003)
[58] L. I. Grossweiner, The science of phototherapy: an introduction, Springer, Netherlands, Dordrecht (2005).
[59] H. von Tappeiner and A. Jodlbauer, Die sensibilisierende Wirkung fluorescierender Substanzen: gesammelte Untersuchungen über die photodynamische Erscheinung., F.C.W. Vogel, Leipzig (1907).
[60] H. von Tappeiner and A. Jensionek, "Therapeutische Versuche mit fluorescierenden Stoffen," Münch Med Wochenschr 47(2042-2044 (1903)
[61] H. von Tappeiner and A. Jodlbauer, "Über Wirkung der photodynamischen (fluorieszierenden) Stoffe auf Protozoen und Enzyme," Dtsch Arch Klin Med 80(427 (1904)
[62] I. Diamond, A. Mcdonagh, C. Wilson, S. Granelli, S. Nielsen and R. Jaenicke, "Photodynamische therapy of malignant tumours," The Lancet 300(7788), 1175-1177 (1972)
[63] J. S. McCaughan Jr, "Photodynamic therapy of endobronchial and esophageal tumors: An overview," Journal of Clinical Laser Medicine and Surgery 14(5), 223-233 (1996)
[64] P. Grosjean, P. Monnier, G. Wagnieres, H. Van Den Bergh and C. Fontolliet, "Clinical photodynamic therapy for superficial cancer in the oesophagus and the bronchi: 514 nm compared with 630 nm light irradiation after sensitization with Photofrin II," British Journal of Cancer 77(11), 1989-1995 (1998)
[65] S. J. Tang and N. E. Marcon, "Photodynamic therapy in the esophagus," Photodiagnosis and Photodynamic Therapy 1(1), 65-74 (2004)
[66] C. N. Foroulis and J. A. C. Thorpe, "Photodynamic therapy (PDT) in Barrett's esophagus with dysplasia or early cancer," European Journal of Cardio-thoracic Surgery 29(1), 30-34 (2006)
[67] T. Nakamura, K. Shirakawa, T. Fujimori and A. Terano, "Photodynamic therapy in gastric cancer [Thérapie photodynamique dans le cancer gastrique]," Acta Endoscopica 33(4), 521-529 (2003)

Chapter 1 – Introduction to Photomedecine
22
[68] J. I. Lim, "Photodynamic therapy for choroidal neovascular disease: Photosensitizers and clinical trials," Ophthalmology Clinics of North America 15(4), 473-478 (2002)
[69] M. P. Copper, I. B. Tan, H. Oppelaar, M. C. Ruevekamp and F. A. Stewart, "Meta-tetra(hydroxyphenyl)chlorin photodynamic therapy in early-stage squamous cell carcinoma of the head and neck," Archives of Otolaryngology - Head and Neck Surgery 129(7), 709-711 (2003)
[70] C. Hopper, A. Kübler, H. Lewis, I. B. Tan, G. Putnam, T. Patrice, C. Beauvillain, J. Evensen, K. Butow, B. Smit, J. Brown, J. De Carpentier, J. Carruth, M. Dilkes, G. Kenyon, F. Roberts and N. Sudderick, "mTHPC-mediated photodynamic therapy for early oral squamous cell carcinoma," International Journal of Cancer 111(1), 138-146 (2004)
[71] P. Babilas, S. Karrer, M. Landthaler, R. M. Szeimies and A. Sidoroff, "Photodynamic therapy in dermatology - An update," Photodermatology Photoimmunology and Photomedicine 21(3), 142-149 (2005)
PART I AUTOFLUORESCENCE FOR THE DIAGNOSIS OF EARLY (PRE-)NEOPLASTIC LESIONS IN THE TRACHEO-BRONCHIAL TREE

24
25
Chapter 2 Cancer basics
he term “cancer” denominates the wide range of malignant tumours that are characterised by uncontrolled proliferation of cells, their invasion into other tissues and production of other cancerous foci (metastases) at distant sites of the body.
2.1 Facts about Cancer In the western world, cancer is the second major cause of death, with cancer related deaths preceded only by heart disease [1, 2]. It is estimated that about 23% of all deaths in the United States can be attributed to cancer [2] and similar numbers are reported for Europe [1]. The following chapter will point out the principal features of cancer and give insight into why cancer is a disease that is so difficult to cure.
The human body is an astonishing and puzzling system of cells that interact with each other through a complex chemical communication system. Each cell has unique features and occupies a specific place in the body, where it fulfils its obligations on behalf of the whole. In a healthy body the cells stay in the tissue of which they are a part and regulate their neighbours proliferation and apoptosis. Sometimes, some cells suddenly become deaf to the proliferation and apoptosis control mechanisms and start following their own timetable for reproduction: a tumour starts growing in the body. In many cases, the deregulated cells will overproliferate, but not invade healthy neighbouring tissue or spread to other body sites. These cells form the so-called benign tumours. But not all over-proliferating cells behave in a benign fashion. Their invasion of healthy tissue and the formation of metastasis is in fact what make cancer a lethal disease.
T

Chapter 2 – Cancer Basics
26
Figure 2.1 Illustration of the cell cycle clock. The cell clock is composed of an assembly of interacting proteins in the nucleus of a cell and is normally run by stimulatory and inhibitory pathways. The four stages of the cell cycle are depicted as G1, S, G2 and M. In the G1 phase the cell increases in size and prepares to copy the DNA. The copying and duplication of the genetic material occurs in the second stage, the synthesis S. During the following G2 period the cell prepares for mitosis that takes place in the final M stage. A crucial step occurs late in the G1 stage, marked as the restriction point R. Passage of R is only possible when a molecular “switch” is set from “off” to “on”. If the switch remains “off” the cell either enters the G0 rest stage or undergoes apoptosis. In cancer cells, the inhibitory effects of proteins blocking the R passage way are inactivated, allowing “unlimited” reproduction cycles for the cell. (adapted from [3])
All cells of a tumour descend from a common ancestral cell that at one point started running its own proliferation and production program. But what makes a cell become deaf to the general proliferation regulation process? All malignant transformations of a tumour cell arise from the accumulation of genetic mutations in the cell that affect the normal life cycle. A normal cell life cycle is often depicted as a so-called cell cycle clock (Figure 2.1). The clock is composed of four stages. In the first stage (G1) the cell increases in size and prepares to copy the DNA contained in its nucleus. The copying is performed in the synthesis (S) stage. In this phase, all the chromosomes of the cell are replicated and the cell then enters the G2 stage. During this stage, the cell prepares for mitosis (M stage), where the mother cell divides into two daughter cells, each containing a complete set of chromosomes. The two daughter cells immediately enter G1 and will either follow the cell cycle clock or temporarily or permanently stop cycling. At the restriction point (R) which occurs in the late G1 phase, a molecular “switch” determines whether the cell continues the cell cycle, enters the G0 state (senescence), or undergoes apoptosis [3].
Two classes of genes play major roles in triggering cancer. The cycle clock is driven by a variety of stimulating and inhibiting proteins. Proto-oncogenes produce poteins that encourage the growth of the cell by relaying growth-simulating signals from outside the cell to its interior, whereas so called tumour suppressor genes produce protein products that block the signals that flow through the growth-stimulating circuit, therefore inhibiting growth. In normal cells, these proteins interact in a well-determined manner. But sometimes, some oncogenes acquire mutations that serve to activate protein production at the wrong time and force the cells to over-produce growth factors which then affect the surrounding cells.
Normal cells transforming into cancer cells begin by stimulating themselves and ignoring inhibitory signals. Fortunately, the cells in the human body are equipped with a kind of backup protection system to halt runaway proliferation. One of these systems initiates cell
Chapter 2 – Cancer Basics
27
apoptosis, i.e. provokes the cell to commit suicide if some essential components are damaged or deregulated. Unfortunately, cancer cells develop additional genetic mutations which help them to evade apoptosis. Another protection system limits the number of cell reproduction cycles. For a human cell this number is typically limited to 50-60 doublings [3]. After this number of reproductions, the cell stops dividing and enters senescence. This control mechanism is based on a DNA segment at the end of each chromosome, called a telomere. Telomeres protect chromosomal ends from damage and shorten a bit every time chromosomes are replicated. When the telomere length reaches a threshold value, the cell loses its ability to divide. Sometimes cells bypass this step and continue dividing. In this case further shrinkage of the telomere will trigger crisis, i.e. sudden death of cells. Once more, cancer cells evade this mechanism by activation of a gene that codes for telomerase, i.e. the enzyme that systematically replaces telomere segments lost during a cell division and allows the cell to replicate an unlimited number of times. As a result, tumours stemming from such cells not only grow large, but due to their unlimited cell cycling ability, permanently accumulate more and more genetic mutations.
As already mentioned above, overproliferation and cell immortality do not create the lethal character of cancer. The critical point that distinguishes malignant cancer from benign tumours is the formation of metastasis and the invasion of normal tissue. Normal cells remain in the tissue and part of the body they belong to for two reasons. In normal tissue, cells adhere to each other and to the extracellular matrix. This anchoring of the cells to their adjacent structures is controlled by so called area code molecules, located on the surface of every individual cell and the extracellular matrix. Cells in the human body only can survive when their area code where the cell is compatible with the code of the surrounding cells and the extracellular matrix. As a consequence normal cells leaving their cell structure will die within a short time by apoptosis. This property is called “anchorage dependence”. In cancer cells, some proteins produced by oncogenes trick the nucleus by making it seem that the cell is attached while in reality it is not. This makes cancer cells anchorage independent and allows them to migrate freely throughout the human body via the blood circulation system. Invasion of cancer cells to other tissues results from their ability to release metalloproteinases that dissolve extracellular matrices. This mechanism that cancer cells have in common with white blood cells, allows the cancer cell to penetrate from its original location into blood vessels and use the bloodstream to access other locations in the body. Thus far, we have discussed the basic properties of cancer cells that allow overproliferation, tissue invasion and metastasis.
But how does tumourgenesis take place in a tissue? Carcinogenesis, i.e. the formation of a cancer, is normally a long-term process, lasting several years, even decades from the appearance of the first genetic change occurring in a single cell. Carcinomas are epithelial, or squamous cell cancers and are the most common malignancies in humans. Each cancer related detection and therapy method presented in this thesis is targeting carcinoma. Figure 2.2 depicts the creation of a carcinoma emerging from a single mutated cell. Genetic mutation of a single cell within a normal population is at the origin of the growing tumour (1). As the mutated cell starts uncontrolled and permanent proliferation, a hyperplasia, defined as the overproduction of cells, is created (2). The hyperplastic cells still look normal. Nevertheless, after several years, the descendants of the ancestral cell usually undergo further genetic mutations and enter the next step of carcinogenesis, called dysplasia (3). In this state, the shape and orientation of the cells is altered and the cells continue to undergo new mutations, finally leading to a carcinoma in situ (CIS) (4). In this state the abnormalities in shape and orientation have increased, but the lesion has not yet penetrated any boundaries between tissues. In quite a number of cases the tumour remains in this state for several years until further genetic mutations provide the cancer cells with the potential to invade underlying
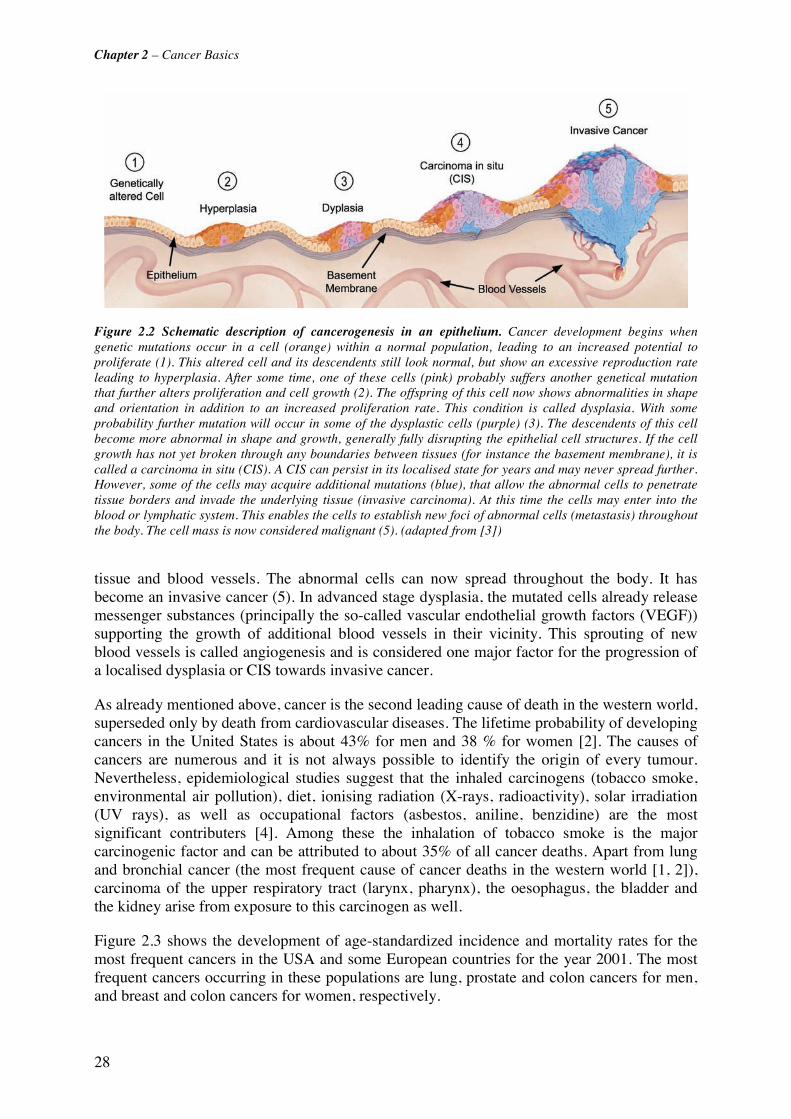
Chapter 2 – Cancer Basics
28
Figure 2.2 Schematic description of cancerogenesis in an epithelium. Cancer development begins when genetic mutations occur in a cell (orange) within a normal population, leading to an increased potential to proliferate (1). This altered cell and its descendents still look normal, but show an excessive reproduction rate leading to hyperplasia. After some time, one of these cells (pink) probably suffers another genetical mutation that further alters proliferation and cell growth (2). The offspring of this cell now shows abnormalities in shape and orientation in addition to an increased proliferation rate. This condition is called dysplasia. With some probability further mutation will occur in some of the dysplastic cells (purple) (3). The descendents of this cell become more abnormal in shape and growth, generally fully disrupting the epithelial cell structures. If the cell growth has not yet broken through any boundaries between tissues (for instance the basement membrane), it is called a carcinoma in situ (CIS). A CIS can persist in its localised state for years and may never spread further. However, some of the cells may acquire additional mutations (blue), that allow the abnormal cells to penetrate tissue borders and invade the underlying tissue (invasive carcinoma). At this time the cells may enter into the blood or lymphatic system. This enables the cells to establish new foci of abnormal cells (metastasis) throughout the body. The cell mass is now considered malignant (5). (adapted from [3])
tissue and blood vessels. The abnormal cells can now spread throughout the body. It has become an invasive cancer (5). In advanced stage dysplasia, the mutated cells already release messenger substances (principally the so-called vascular endothelial growth factors (VEGF)) supporting the growth of additional blood vessels in their vicinity. This sprouting of new blood vessels is called angiogenesis and is considered one major factor for the progression of a localised dysplasia or CIS towards invasive cancer.
As already mentioned above, cancer is the second leading cause of death in the western world, superseded only by death from cardiovascular diseases. The lifetime probability of developing cancers in the United States is about 43% for men and 38 % for women [2]. The causes of cancers are numerous and it is not always possible to identify the origin of every tumour. Nevertheless, epidemiological studies suggest that the inhaled carcinogens (tobacco smoke, environmental air pollution), diet, ionising radiation (X-rays, radioactivity), solar irradiation (UV rays), as well as occupational factors (asbestos, aniline, benzidine) are the most significant contributers [4]. Among these the inhalation of tobacco smoke is the major carcinogenic factor and can be attributed to about 35% of all cancer deaths. Apart from lung and bronchial cancer (the most frequent cause of cancer deaths in the western world [1, 2]), carcinoma of the upper respiratory tract (larynx, pharynx), the oesophagus, the bladder and the kidney arise from exposure to this carcinogen as well.
Figure 2.3 shows the development of age-standardized incidence and mortality rates for the most frequent cancers in the USA and some European countries for the year 2001. The most frequent cancers occurring in these populations are lung, prostate and colon cancers for men, and breast and colon cancers for women, respectively.

Chapter 2 – Cancer Basics
29
The poor prognosis for long-term survival of cancer patients is mainly due late detection of this disease. Most cancers are detected only at a late stage when symptoms appear. By this time, most tumours have already grown large, are invasive and have probably already metastasised. Cancer management is then difficult and the treatment of advanced stage cancers is generally associated with high morbidity and poor outcome. Early cancerous lesions are less likely to metastasise and easier to treat, but remain mostly asymptomatic and therefore not noticed by the patient. Moreover, their small size makes them difficult for a clinician to detect.
Figure 2.3 Age-standardised cancer mortality rates in the USA and some European countries for the year 2001. The data were obtained from the WHO Cancer mortality statistics [5].
Cancer prevention and management should therefore include [2]:
• Limited exposure to carcinogens or carcinogenic factors (tobacco smoke, ionising and UV radiation)
• Changing unhealthy lifestyle patterns that promote cancer (diet, physical activity) / modification of health risk behaviours = preventing the occurrence of cancer (primary prevention)
• Regular cancer screening of high-risk patients • Optimisation of early cancer detection methods = early detection of cancer through
screening (secondary prevention) • Improvement of therapeutic methods
2.2 Cancer Detection and Diagnosis While primary prevention campaigns such as tobacco prevention and cessation programs, dietary education campaigns and physical activity interventions aim to reduce the risk of an individual for developing cancer, secondary prevention focuses on the monitoring of high risk individuals for the presence or absence of cancer. There are three tools for cancer detection:
Chapter 2 – Cancer Basics
30
screening, diagnosis testing and surveillance [2]. Screening depicts the early detection of cancer or pre-malignant disease in mostly asymptomatic high-risk persons. Diagnostic testing is the evaluation of patients with signs and symptoms associated with cancer, and focuses on the localisation and staging of the tumour. Surveillance depicts the follow-up screening for new evidence of cancer in patients who have already been diagnosed with or treated for cancer or pre-malignant disease.
Regular and efficient cancer screening will increase the number of cancers that are found in an early stage. However, efficient screening is only feasible with low cost, rapid and minimally invasive cancer detection methods. This is the reason why the main body of research presented in this thesis focuses on fluorescence detection of early cancers.
An efficient and powerful cancer detection and screening method must ideally fulfil the following criteria:
• Allows for the detection of small tissue and cellular changes • Has a high sensitivity and a good specificity • Allows for the discovery of the presence of a disease as well as its localisation • Is easy and inexpensive to employ • Do, according to the medical precept “primum non nocere”, more good than harm
(i.e. is as non- invasive as possible) At this point, it is be necessary to define some terms that will consistently appear in the context of medical detection and diagnosis. The quality of a detection method is described by its "sensitivity" and its "specificity", generally expressed in percentage [%]. The sensitivity of a detection or diagnostic method describes the probability that an individual having the disease is screened positive. The specificity of a detection or diagnostic method is the probability that an individual without the disease is screened negative. The detection and diagnosis of a disease in an individual having the disease is also referred to as a "true positive (TP)" result. In contrast to this, a positive detection or diagnosis in an individual without the disease is called a "false positive (FP)" result. If a detection method or diagnostic test identifies a healthy individual as not having the disease, this is referred to a "true negative (TN)" result. The failure of a detection method or diagnostic test to detect the disease in an ill individual, is called a "false negative (FN)" result. We can thus identify the sensitivity with the quotient of all TP results and the sum of the TP and FN results. The specificity corresponds to the quotient of the TN results and the sum of the FP and TN results. The sensitivity and specificity of a detection or diagnostic method is generally diametrical, i.e. a high sensitivity is often associated with a low specificity and vice versa. Two other parameters are frequently used to judge the quality of a detection or diagnostic method: the positive predictive value (PPV) and the negative predictive value (NPV). The PPV corresponds to the probability that an individual identified as positive for the disease really has the disease. Accordingly, the NPV is the probability that an individual identified as negative for the disease does not effectively have the disease. All abovementioned terms are summarised in Table 2.1 below. It should be noted that the sensitivity, the specificity and the NPV of a detection of diagnostic method are very difficult to assess since these parameters demand the knowledge of the number of true negative and false negative results. The determination of these parameters would require extensive sampling from putative healthy cell tissues. However, in the case of invasive sampling as with biopsies, such a procedure is often not defendable for medical and ethical reasons.
The decision as to whether an individual is negative or positive for a disease is made by a diagnostic method referred to as “gold standard”. A gold standard in medicine is “a relatively
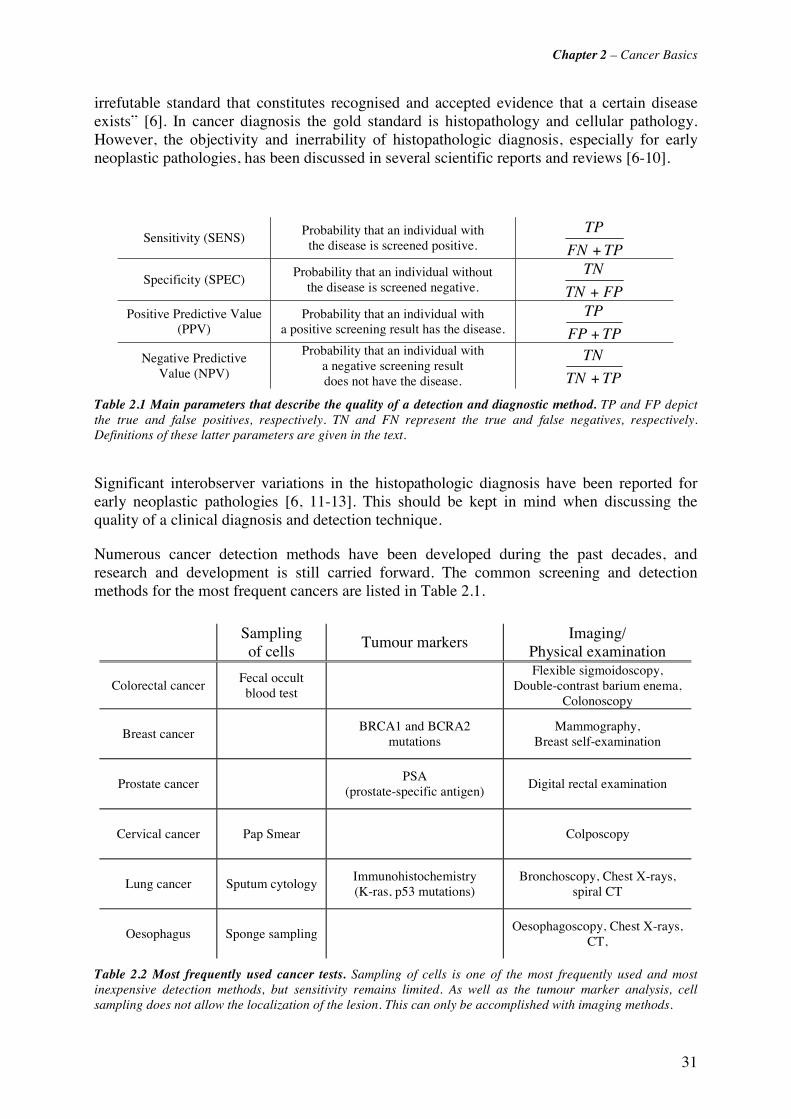
Chapter 2 – Cancer Basics
31
irrefutable standard that constitutes recognised and accepted evidence that a certain disease exists” [6]. In cancer diagnosis the gold standard is histopathology and cellular pathology. However, the objectivity and inerrability of histopathologic diagnosis, especially for early neoplastic pathologies, has been discussed in several scientific reports and reviews [6-10].
Sensitivity (SENS) Probability that an individual with
the disease is screened positive. TPFN
TP
+
Specificity (SPEC) Probability that an individual without
the disease is screened negative. FPTN
TN
+
Positive Predictive Value (PPV)
Probability that an individual with a positive screening result has the disease. TPFP
TP
+
Negative Predictive Value (NPV)
Probability that an individual with a negative screening result does not have the disease. TPTN
TN
+
Table 2.1 Main parameters that describe the quality of a detection and diagnostic method. TP and FP depict the true and false positives, respectively. TN and FN represent the true and false negatives, respectively. Definitions of these latter parameters are given in the text.
Significant interobserver variations in the histopathologic diagnosis have been reported for early neoplastic pathologies [6, 11-13]. This should be kept in mind when discussing the quality of a clinical diagnosis and detection technique.
Numerous cancer detection methods have been developed during the past decades, and research and development is still carried forward. The common screening and detection methods for the most frequent cancers are listed in Table 2.1.
Sampling of cells
Tumour markers Imaging/
Physical examination
Colorectal cancer Fecal occult blood test
Flexible sigmoidoscopy,
Double-contrast barium enema, Colonoscopy
Breast cancer BRCA1 and BCRA2
mutations Mammography,
Breast self-examination
Prostate cancer PSA
(prostate-specific antigen) Digital rectal examination
Cervical cancer Pap Smear Colposcopy
Lung cancer Sputum cytology Immunohistochemistry (K-ras, p53 mutations)
Bronchoscopy, Chest X-rays, spiral CT
Oesophagus Sponge sampling Oesophagoscopy, Chest X-rays,
CT,
Table 2.2 Most frequently used cancer tests. Sampling of cells is one of the most frequently used and most inexpensive detection methods, but sensitivity remains limited. As well as the tumour marker analysis, cell sampling does not allow the localization of the lesion. This can only be accomplished with imaging methods.

Chapter 2 – Cancer Basics
32
The detection methods can be classified into 3 categories: cell sampling (occult blood test, Pap smear, sputum analysis), tumour marker analysis, and imaging techniques. It should be mentioned that the most popular diagnostic tests belong to the first two categories. In the course of recent developments in the field of genomics and proteomics these tests have been widely expanded and improved. Nevertheless, the number of false positives with most of these tests remains high. Moreover, common to all these tests is that they allow diagnosis of a disease, but not its localisation within the body. Among the abovementioned detection categories only the imaging techniques allow simultaneous detection and localisation. The most common imaging methods are endoscopy, ultrasound (US), X-rays, computed tomography (CT), positron-emission tomography (PET), and magnetic resonance imaging (MRI). All these methods have their advantages and drawbacks and no method is ideal for all cancers. More recent characterisation methods, among others under investigation are optical coherence tomography (OCT), high magnification/ resolution video endoscopy, narrow band imaging (NBI) and endoscopic (auto-)fluorescence detection.
2.2.1 Cancer treatments The earliest and most widely used therapy of invasive cancer is surgery [4]. Surgical excision of cancerous lesions accounts for the largest number of cures if the cancerous tissue is completely removed. Surgery is indeed the sole initial treatment modality for over 50% of all patients with a localised cancer and for 40% of the patients with a regionally limited cancer [4]. Major shortcomings of surgery to treat cancer are (1) the need to remove large portions of healthy tissue to ensure the complete resection of the cancerous lesion and (2) the traumatic experience associated with a major operation. Moreover, incomplete resection of the cancerous lesions results in recurrence and metastasis. Recent computer aided imaging technologies have considerably improved image guided surgery [14], thus reducing surgery related morbidity and complications. However, the most crucial limitation is that surgery is not applicable to advanced stage cancers that have already metastasised within the body [15]. Radiation therapy is based on the irradiation of the cancer region with powerful x-rays or gamma rays from external or implanted sources. This radiation destroys biological cells either directly by inflicting genetic damage, or indirectly by inducing apoptosis. As healthy cells recover more easily from radiation than cancer cells, radiation therapy allows selective destruction of the cancerous lesion while the functionality of the surrounding healthy tissue is usually retained [15]. However, like surgery, radiation therapy sometimes fails to eradicate all cancer cells and is not suited for the treatment of metastasised disease.
In the case of non-localised cancer and metastasis, chemotherapy, i.e. the systematic administration of anticancer drugs, are used. Most chemotherapeutic drugs interfere with the DNA replication process, thus preventing cell multiplication. Several malignancies, like leukemias, lymphomas and testicular cancer, show high cure rates with this treatment. However, most common cancers (breast, lung, colorectal, and prostate) can not be cured by chemotherapy alone. However, clinical studies have proven the benefit of chemotherapy in the framework of a cancer treatment program including surgery and/or radiotherapy (adjuvant chemotherapy) [15]. Hormone therapy is another kind of drug therapy that is quite effective for some cancers of breast and prostate [4, 16].
The increasing number of improved detection methods sensitive to microinvasive or low invasive lesions has highlighted the possibilities for less invasive therapies for these early stage cancers. PDT, under investigation for several decades, has proven a good alternative technique to treat endoscopically accessible early stage cancers.

Chapter 2 – Cancer Basics
33
2.3 References [1] F. Levi, F. Lucchini, C. La Vecchia, E. Negri and F. Levi, "Trends in mortality from major cancers in the European Union, including acceding countries, in 2004," Cancer 101(1), 2843-2850 (2004)
[2] S. J. Curry, T. Byers and M. Hewitt, Eds., Fulfilling the protential of cancer prevention and early detection, The National Academies Press, Washington, DC (2003).
[3] R. A. Weinberg, "How cancer arises," Sci Am 275(3), 62-70 (1996)
[4] R. Souhami and J. Tobias, Cancer and its management, Blackwell Science Ltd., Oxford (1998).
[5] World Health Organisation (WHO), "WHO Data base," http://www-dep.iarc.fr, accessed on 23.03.2006
[6] E. Foucar, "Do pathologists play dice? Uncertainty and early histopathological diagnosis of common malignancies," Histopathology 495-502 (1997)
[7] A. D. Ramsay, "Errors in histopathology reporting: Detection and avoidance," Histopathology 481-490 (1999)
[8] D. Jenkins, E. Bentley and K. A. Fleming, "Evidence-based cellular pathology: a systematic framework for pathological diagnosis and clinical decisions," Curr Diag Patho 7(272-280 (2001)
[9] S. S. Cross, "Grading and scoring in histopathology," Histopath 33(99-106 (1998)
[10] E. R. Farmer, R. Gonin and M. P. Hanna, "Discordance in the histopathologic diagnosis of melanoma and melanocytic nevi between expert pathologists," Human Pathology 528-531 (1996)
[11] F. T. Bosman, "Dysplasia classification: pathology in disgrace?," J Pathology 194(143-144 (2001)
[12] P. S. Carter, J. P. Sheffield, N. Shepard, D. H. Melcher, D. Jenkins, P. Ewings, I. Talbot and J. M. A. Northover, "Interobserver variation in the rporting of the histopathological grading of anal intraepithelial neoplasia," J Clin Pathol 47(1032-1034 (1994)
[13] A. G. Nicholson, L. J. Perry, P. M. Cury, P. Jackson, C. M. McCormick, B. Corrin and A. U. Wells, "Reproducibility of the WHO/IASLC grading system for pre-invasive squamous lesions of the bronchus: A study of inter-observer and intra-observer variation," Histopathology 202-208 (2001)
[14] W. E. Grimson, R. Kikinis, F. A. Jolesz and P. M. Black, "Image-guided surgery," Sci Am 280(6), 62-69 (1999)
[15] S. Hellman and E. E. Vokes, "Advancing current treatments for cancer," Sci Am 275(3), 118-123 (1996)
[16] K. M. Rau, H. Y. Kang, T. L. Cha, S. A. Miller and M. C. Hung, "The mechanisms and managements of hormone-therapy resistance in breast and prostate cancers," Endocr Relat Cancer 12(3), 511-532 (2005)

34

35
Chapter 3 Introduction to
Bronchology
3.1 Bronchial Anatomy and Histology The lungs are the site of external respiration, i.e. the junction between air and blood to be oxygenised and sent to the arteries. The blood carbon dioxide (CO2) resulting from the body’s internal respiration is released and replaced by oxygen (O2). The human thorax holds two lungs (right and left) that are subdivided into a total number of 5 lobes. There are three lobes in the right lung, namely the right upper lobe (RUL), the right middle lobe (RML) and the right lower lobe (RLL). The left lung shows a slightly different architecture than the right one due to the volume occupied by the heart in the left part of the thorax. There are only two lobes, namely the left upper lobe (LUL) and the left lower lobe (LLL) (Figure 3.1). The air-conducting parts of the lungs are formed by the tubular system of bronchi, bronchioli, and alveoli (Figure 3.2). This so-called “tracheo-bronchial tree” starts with the trachea.
The trachea divides into the two primary or extra-lobar bronchi. These primary bronchi further divide into the secondary or intra-lobar bronchi which on their part divide by irregular dichotomy into bronchi of decreasing size (segmental bronchi). The small bronchi subdivide into terminal and respiratory bronchioles and form the alveoli. The latter are responsible for the gas exchange between the air-conducting part and the lung blood circulation. The diameter of the trachea is typically 20 mm in adults. This diameter decreases to about 16 mm

Chapter 3 – Introduction to Bronchology
36
for the primary bronchi, 11 mm for the intra-lobar bronchi, and is less than 8 mm for the segmental bronchi. The bronchioli have diameters smaller than 0.6 mm. The terminal alveoli are less than 0.3 mm in diameter [3]. Due to the decreasing size of the bronchial diameter, only the primary and secondary bronchi are accessible with conventional bronchoscope optics. The histology of the tracheo-bronchial tree is not uniform, but undergoes significant changes from the trachea to the alveoli. The principal histologic features of the trachea and the bronchoscopically accessible bronchi are given in the following sections.
Figure 3.1 Lobar structure of the lung. The right lung consists of 3 lobes, namely the right upper lobe (RUL), the middle lobe (RML) and the right lower lobe (RLL). The left lung consists of the left upper lobe (LUL) and the left lower lobe (LLL).
Figure 3.2 The tracheo-bronchial tree viewed from the trachea. The trachea divides into a right and a left main bronchus which further subdivide into the higher generation bronchi and bronchioli. The “B-numbers” give the official nomenclature of the bronchi.
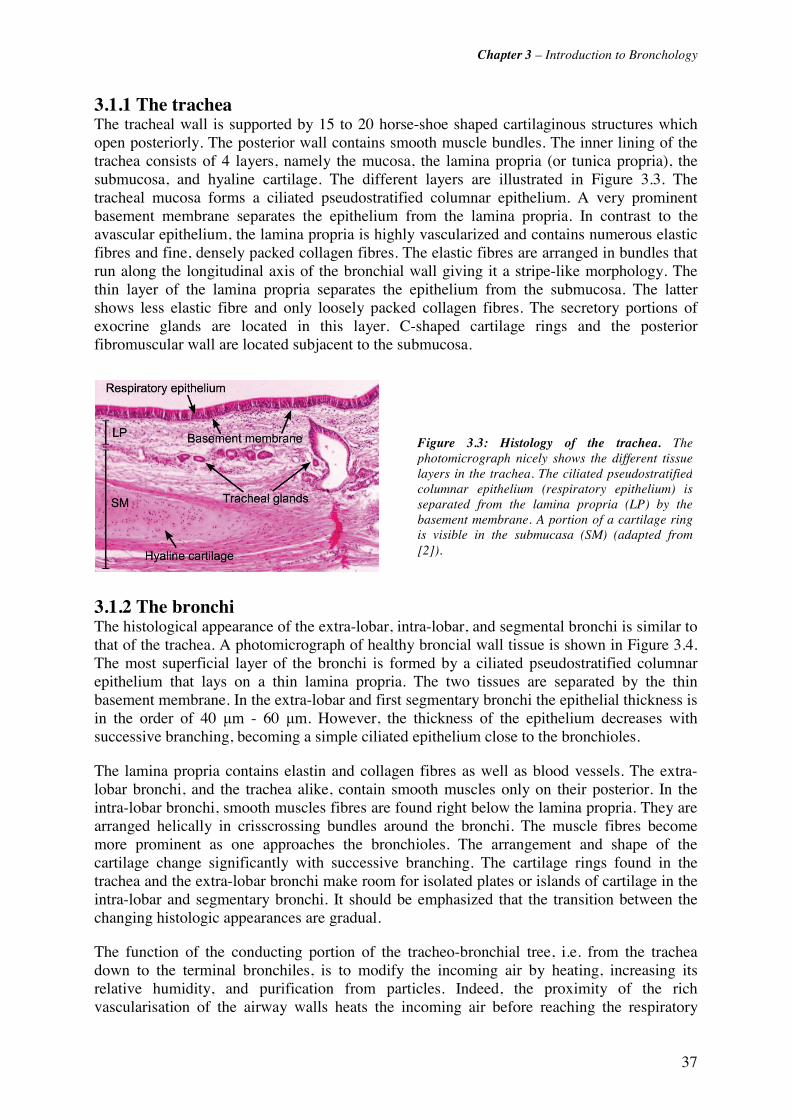
Chapter 3 – Introduction to Bronchology
37
3.1.1 The trachea The tracheal wall is supported by 15 to 20 horse-shoe shaped cartilaginous structures which open posteriorly. The posterior wall contains smooth muscle bundles. The inner lining of the trachea consists of 4 layers, namely the mucosa, the lamina propria (or tunica propria), the submucosa, and hyaline cartilage. The different layers are illustrated in Figure 3.3. The tracheal mucosa forms a ciliated pseudostratified columnar epithelium. A very prominent basement membrane separates the epithelium from the lamina propria. In contrast to the avascular epithelium, the lamina propria is highly vascularized and contains numerous elastic fibres and fine, densely packed collagen fibres. The elastic fibres are arranged in bundles that run along the longitudinal axis of the bronchial wall giving it a stripe-like morphology. The thin layer of the lamina propria separates the epithelium from the submucosa. The latter shows less elastic fibre and only loosely packed collagen fibres. The secretory portions of exocrine glands are located in this layer. C-shaped cartilage rings and the posterior fibromuscular wall are located subjacent to the submucosa.
3.1.2 The bronchi The histological appearance of the extra-lobar, intra-lobar, and segmental bronchi is similar to that of the trachea. A photomicrograph of healthy broncial wall tissue is shown in Figure 3.4. The most superficial layer of the bronchi is formed by a ciliated pseudostratified columnar epithelium that lays on a thin lamina propria. The two tissues are separated by the thin basement membrane. In the extra-lobar and first segmentary bronchi the epithelial thickness is in the order of 40 μm - 60 μm. However, the thickness of the epithelium decreases with successive branching, becoming a simple ciliated epithelium close to the bronchioles.
The lamina propria contains elastin and collagen fibres as well as blood vessels. The extra-lobar bronchi, and the trachea alike, contain smooth muscles only on their posterior. In the intra-lobar bronchi, smooth muscles fibres are found right below the lamina propria. They are arranged helically in crisscrossing bundles around the bronchi. The muscle fibres become more prominent as one approaches the bronchioles. The arrangement and shape of the cartilage change significantly with successive branching. The cartilage rings found in the trachea and the extra-lobar bronchi make room for isolated plates or islands of cartilage in the intra-lobar and segmentary bronchi. It should be emphasized that the transition between the changing histologic appearances are gradual.
The function of the conducting portion of the tracheo-bronchial tree, i.e. from the trachea down to the terminal bronchiles, is to modify the incoming air by heating, increasing its relative humidity, and purification from particles. Indeed, the proximity of the rich vascularisation of the airway walls heats the incoming air before reaching the respiratory
Figure 3.3: Histology of the trachea. Thephotomicrograph nicely shows the different tissuelayers in the trachea. The ciliated pseudostratifiedcolumnar epithelium (respiratory epithelium) isseparated from the lamina propria (LP) by thebasement membrane. A portion of a cartilage ringis visible in the submucasa (SM) (adapted from[2]).
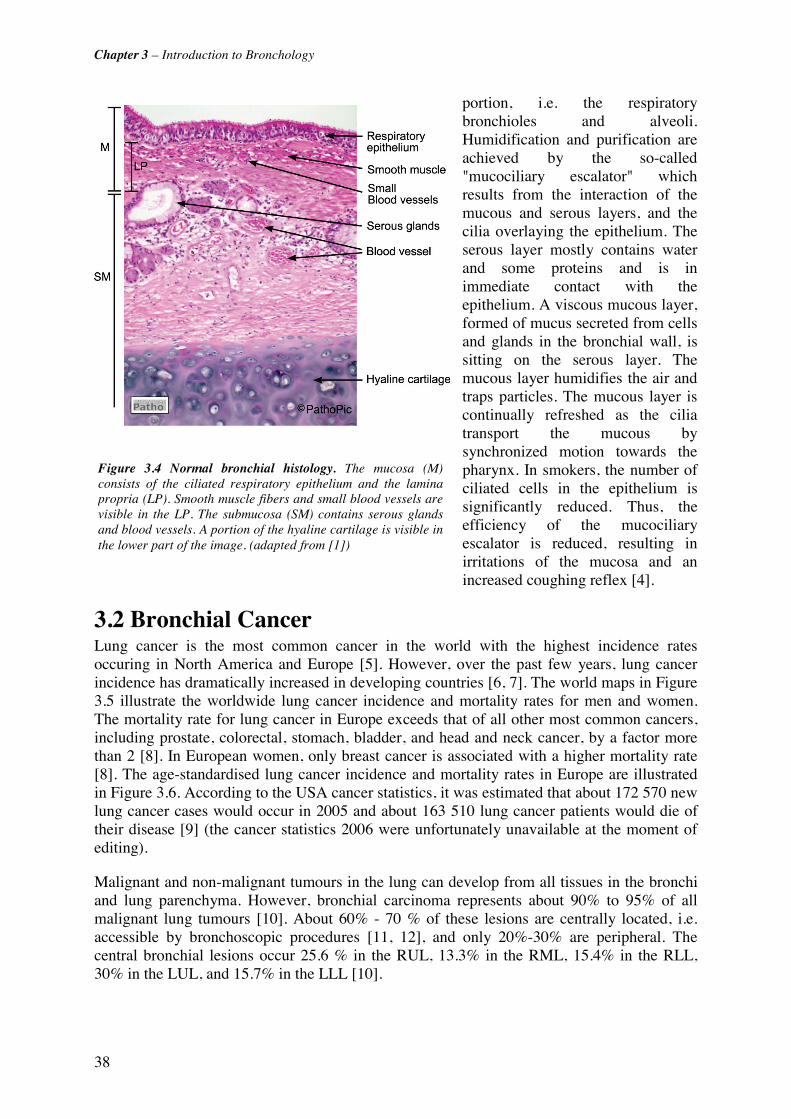
Chapter 3 – Introduction to Bronchology
38
portion, i.e. the respiratory bronchioles and alveoli. Humidification and purification are achieved by the so-called "mucociliary escalator" which results from the interaction of the mucous and serous layers, and the cilia overlaying the epithelium. The serous layer mostly contains water and some proteins and is in immediate contact with the epithelium. A viscous mucous layer, formed of mucus secreted from cells and glands in the bronchial wall, is sitting on the serous layer. The mucous layer humidifies the air and traps particles. The mucous layer is continually refreshed as the cilia transport the mucous by synchronized motion towards the pharynx. In smokers, the number of ciliated cells in the epithelium is significantly reduced. Thus, the efficiency of the mucociliary escalator is reduced, resulting in irritations of the mucosa and an increased coughing reflex [4].
3.2 Bronchial Cancer Lung cancer is the most common cancer in the world with the highest incidence rates occuring in North America and Europe [5]. However, over the past few years, lung cancer incidence has dramatically increased in developing countries [6, 7]. The world maps in Figure 3.5 illustrate the worldwide lung cancer incidence and mortality rates for men and women. The mortality rate for lung cancer in Europe exceeds that of all other most common cancers, including prostate, colorectal, stomach, bladder, and head and neck cancer, by a factor more than 2 [8]. In European women, only breast cancer is associated with a higher mortality rate [8]. The age-standardised lung cancer incidence and mortality rates in Europe are illustrated in Figure 3.6. According to the USA cancer statistics, it was estimated that about 172 570 new lung cancer cases would occur in 2005 and about 163 510 lung cancer patients would die of their disease [9] (the cancer statistics 2006 were unfortunately unavailable at the moment of editing).
Malignant and non-malignant tumours in the lung can develop from all tissues in the bronchi and lung parenchyma. However, bronchial carcinoma represents about 90% to 95% of all malignant lung tumours [10]. About 60% - 70 % of these lesions are centrally located, i.e. accessible by bronchoscopic procedures [11, 12], and only 20%-30% are peripheral. The central bronchial lesions occur 25.6 % in the RUL, 13.3% in the RML, 15.4% in the RLL, 30% in the LUL, and 15.7% in the LLL [10].
Figure 3.4 Normal bronchial histology. The mucosa (M)consists of the ciliated respiratory epithelium and the laminapropria (LP). Smooth muscle fibers and small blood vessels arevisible in the LP. The submucosa (SM) contains serous glandsand blood vessels. A portion of the hyaline cartilage is visible inthe lower part of the image. (adapted from [1])
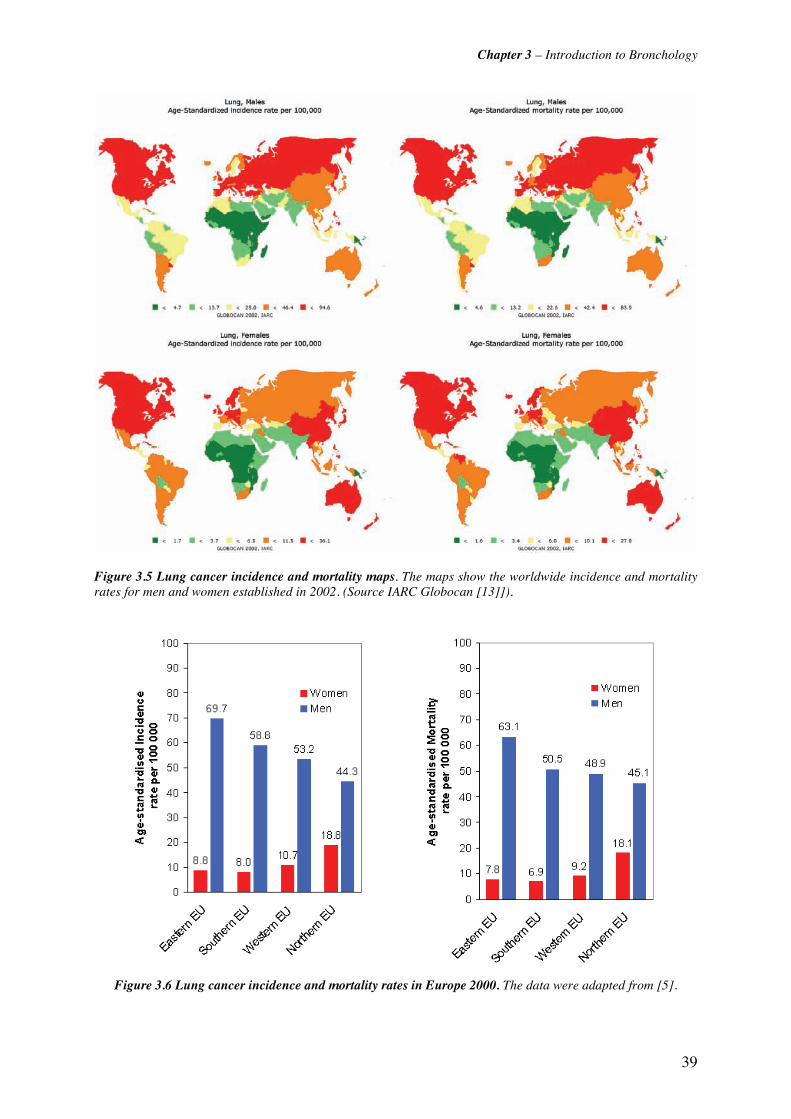
Chapter 3 – Introduction to Bronchology
39
Figure 3.5 Lung cancer incidence and mortality maps. The maps show the worldwide incidence and mortality rates for men and women established in 2002. (Source IARC Globocan [13]]).
Figure 3.6 Lung cancer incidence and mortality rates in Europe 2000. The data were adapted from [5].
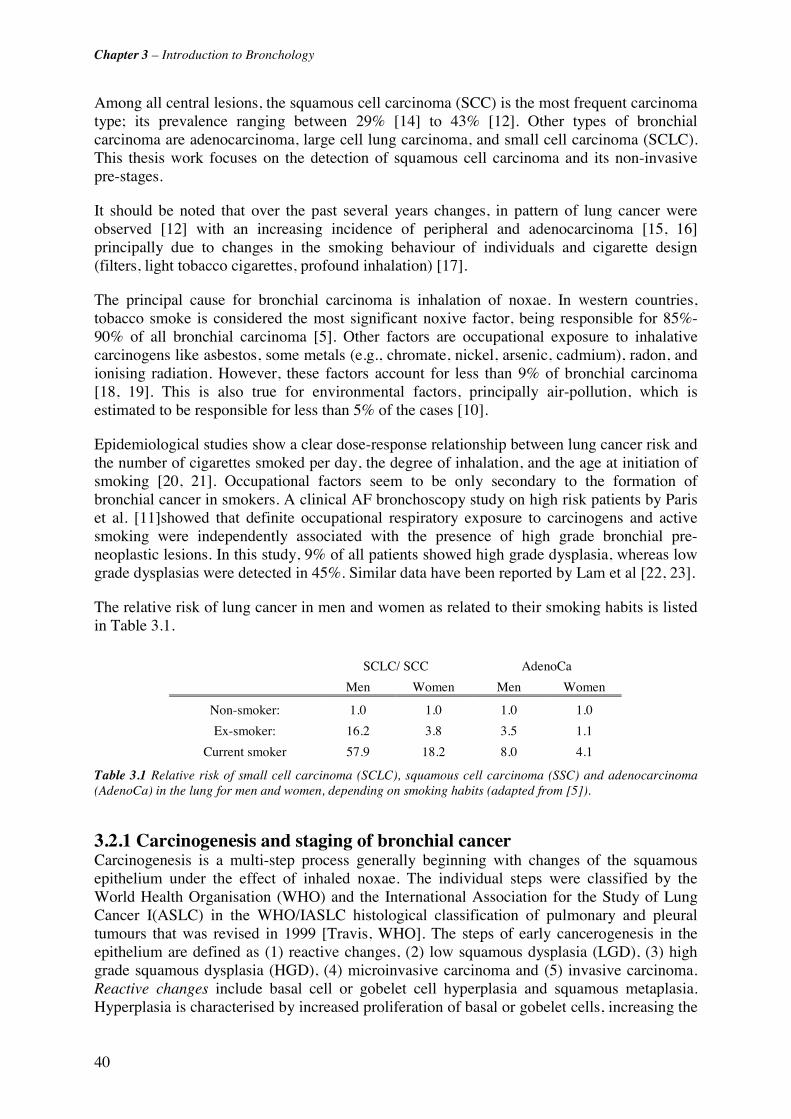
Chapter 3 – Introduction to Bronchology
40
Among all central lesions, the squamous cell carcinoma (SCC) is the most frequent carcinoma type; its prevalence ranging between 29% [14] to 43% [12]. Other types of bronchial carcinoma are adenocarcinoma, large cell lung carcinoma, and small cell carcinoma (SCLC). This thesis work focuses on the detection of squamous cell carcinoma and its non-invasive pre-stages.
It should be noted that over the past several years changes, in pattern of lung cancer were observed [12] with an increasing incidence of peripheral and adenocarcinoma [15, 16] principally due to changes in the smoking behaviour of individuals and cigarette design (filters, light tobacco cigarettes, profound inhalation) [17].
The principal cause for bronchial carcinoma is inhalation of noxae. In western countries, tobacco smoke is considered the most significant noxive factor, being responsible for 85%- 90% of all bronchial carcinoma [5]. Other factors are occupational exposure to inhalative carcinogens like asbestos, some metals (e.g., chromate, nickel, arsenic, cadmium), radon, and ionising radiation. However, these factors account for less than 9% of bronchial carcinoma [18, 19]. This is also true for environmental factors, principally air-pollution, which is estimated to be responsible for less than 5% of the cases [10].
Epidemiological studies show a clear dose-response relationship between lung cancer risk and the number of cigarettes smoked per day, the degree of inhalation, and the age at initiation of smoking [20, 21]. Occupational factors seem to be only secondary to the formation of bronchial cancer in smokers. A clinical AF bronchoscopy study on high risk patients by Paris et al. [11]showed that definite occupational respiratory exposure to carcinogens and active smoking were independently associated with the presence of high grade bronchial pre-neoplastic lesions. In this study, 9% of all patients showed high grade dysplasia, whereas low grade dysplasias were detected in 45%. Similar data have been reported by Lam et al [22, 23].
The relative risk of lung cancer in men and women as related to their smoking habits is listed in Table 3.1.
SCLC/ SCC AdenoCa
Men Women Men Women
Non-smoker: 1.0 1.0 1.0 1.0
Ex-smoker: 16.2 3.8 3.5 1.1
Current smoker 57.9 18.2 8.0 4.1
Table 3.1 Relative risk of small cell carcinoma (SCLC), squamous cell carcinoma (SSC) and adenocarcinoma (AdenoCa) in the lung for men and women, depending on smoking habits (adapted from [5]).
3.2.1 Carcinogenesis and staging of bronchial cancer Carcinogenesis is a multi-step process generally beginning with changes of the squamous epithelium under the effect of inhaled noxae. The individual steps were classified by the World Health Organisation (WHO) and the International Association for the Study of Lung Cancer I(ASLC) in the WHO/IASLC histological classification of pulmonary and pleural tumours that was revised in 1999 [Travis, WHO]. The steps of early cancerogenesis in the epithelium are defined as (1) reactive changes, (2) low squamous dysplasia (LGD), (3) high grade squamous dysplasia (HGD), (4) microinvasive carcinoma and (5) invasive carcinoma. Reactive changes include basal cell or gobelet cell hyperplasia and squamous metaplasia. Hyperplasia is characterised by increased proliferation of basal or gobelet cells, increasing the
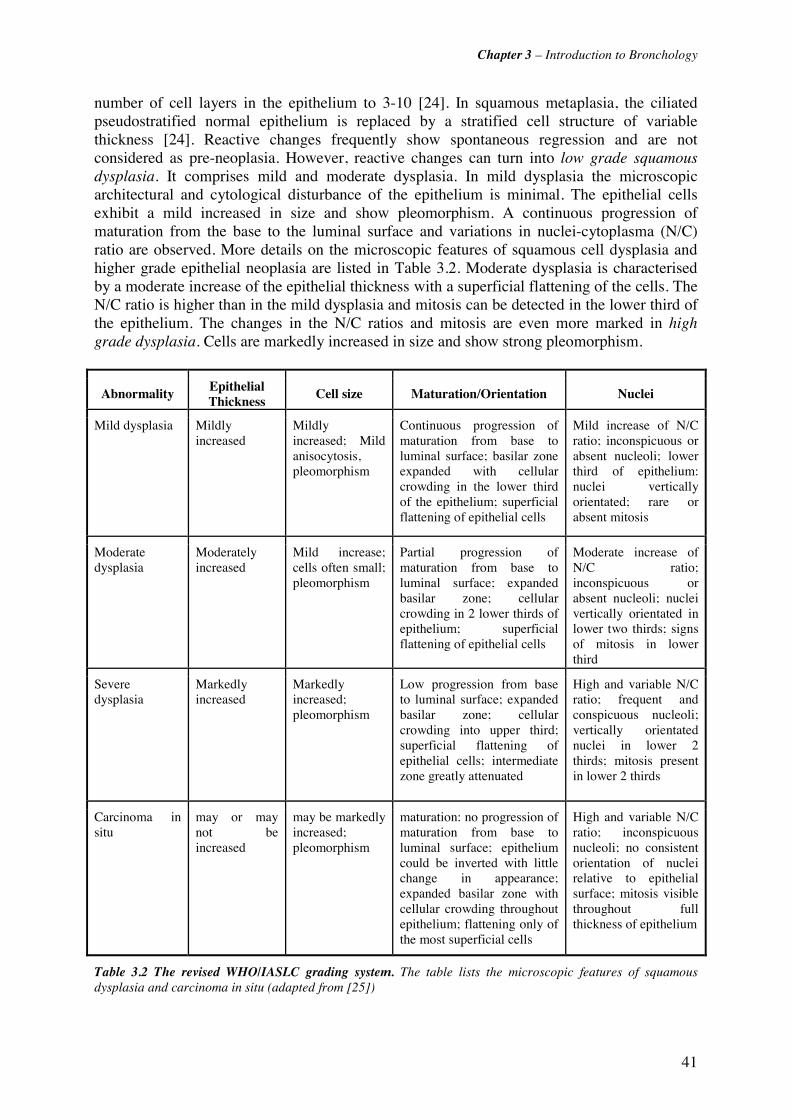
Chapter 3 – Introduction to Bronchology
41
number of cell layers in the epithelium to 3-10 [24]. In squamous metaplasia, the ciliated pseudostratified normal epithelium is replaced by a stratified cell structure of variable thickness [24]. Reactive changes frequently show spontaneous regression and are not considered as pre-neoplasia. However, reactive changes can turn into low grade squamous dysplasia. It comprises mild and moderate dysplasia. In mild dysplasia the microscopic architectural and cytological disturbance of the epithelium is minimal. The epithelial cells exhibit a mild increased in size and show pleomorphism. A continuous progression of maturation from the base to the luminal surface and variations in nuclei-cytoplasma (N/C) ratio are observed. More details on the microscopic features of squamous cell dysplasia and higher grade epithelial neoplasia are listed in Table 3.2. Moderate dysplasia is characterised by a moderate increase of the epithelial thickness with a superficial flattening of the cells. The N/C ratio is higher than in the mild dysplasia and mitosis can be detected in the lower third of the epithelium. The changes in the N/C ratios and mitosis are even more marked in high grade dysplasia. Cells are markedly increased in size and show strong pleomorphism.
Abnormality Epithelial Thickness
Cell size Maturation/Orientation Nuclei
Mild dysplasia Mildly increased
Mildly increased; Mild anisocytosis, pleomorphism
Continuous progression of maturation from base to luminal surface; basilar zone expanded with cellular crowding in the lower third of the epithelium; superficial flattening of epithelial cells
Mild increase of N/C ratio; inconspicuous or absent nucleoli; lower third of epithelium: nuclei vertically orientated; rare or absent mitosis
Moderate dysplasia
Moderately increased
Mild increase; cells often small; pleomorphism
Partial progression of maturation from base to luminal surface; expanded basilar zone; cellular crowding in 2 lower thirds of epithelium; superficial flattening of epithelial cells
Moderate increase of N/C ratio; inconspicuous or absent nucleoli; nuclei vertically orientated in lower two thirds; signs of mitosis in lower third
Severe dysplasia
Markedly increased
Markedly increased; pleomorphism
Low progression from base to luminal surface; expanded basilar zone; cellular crowding into upper third; superficial flattening of epithelial cells; intermediate zone greatly attenuated
High and variable N/C ratio; frequent and conspicuous nucleoli; vertically orientated nuclei in lower 2 thirds; mitosis present in lower 2 thirds
Carcinoma in situ
may or may not be increased
may be markedly increased; pleomorphism
maturation: no progression of maturation from base to luminal surface; epithelium could be inverted with little change in appearance; expanded basilar zone with cellular crowding throughout epithelium; flattening only of the most superficial cells
High and variable N/C ratio; inconspicuous nucleoli; no consistent orientation of nuclei relative to epithelial surface; mitosis visible throughout full thickness of epithelium
Table 3.2 The revised WHO/IASLC grading system. The table lists the microscopic features of squamous dysplasia and carcinoma in situ (adapted from [25])
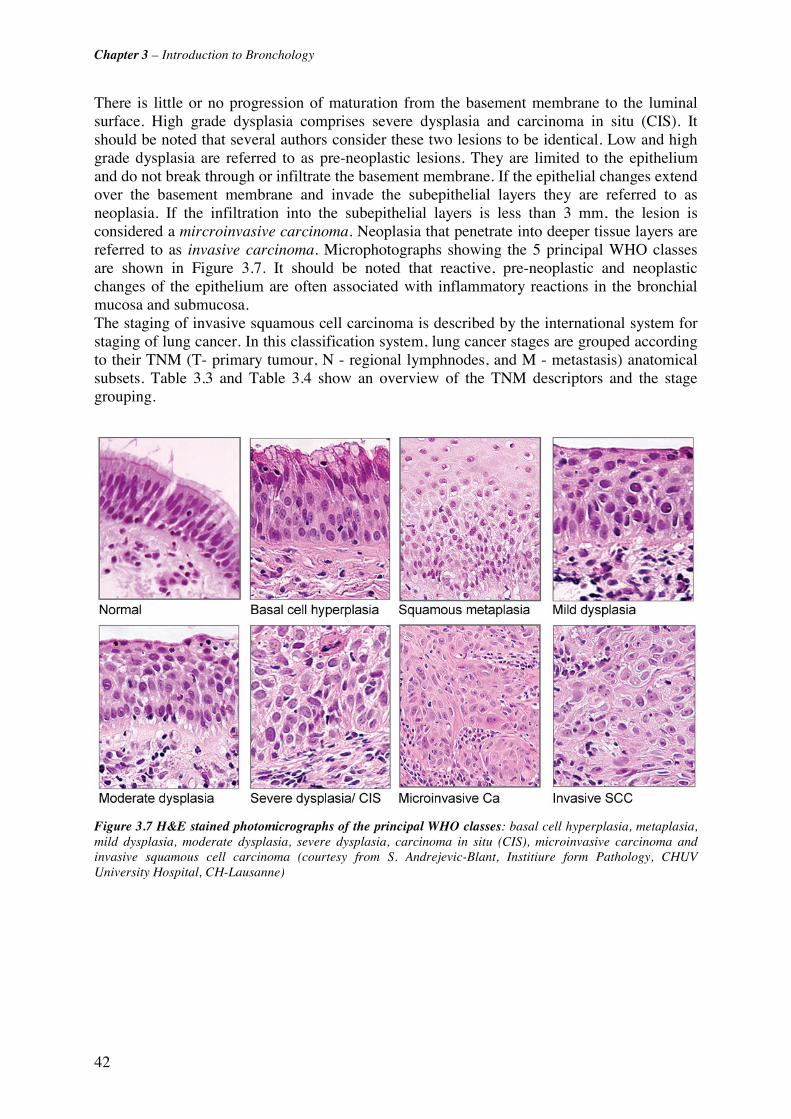
Chapter 3 – Introduction to Bronchology
42
There is little or no progression of maturation from the basement membrane to the luminal surface. High grade dysplasia comprises severe dysplasia and carcinoma in situ (CIS). It should be noted that several authors consider these two lesions to be identical. Low and high grade dysplasia are referred to as pre-neoplastic lesions. They are limited to the epithelium and do not break through or infiltrate the basement membrane. If the epithelial changes extend over the basement membrane and invade the subepithelial layers they are referred to as neoplasia. If the infiltration into the subepithelial layers is less than 3 mm, the lesion is considered a mircroinvasive carcinoma. Neoplasia that penetrate into deeper tissue layers are referred to as invasive carcinoma. Microphotographs showing the 5 principal WHO classes are shown in Figure 3.7. It should be noted that reactive, pre-neoplastic and neoplastic changes of the epithelium are often associated with inflammatory reactions in the bronchial mucosa and submucosa. The staging of invasive squamous cell carcinoma is described by the international system for staging of lung cancer. In this classification system, lung cancer stages are grouped according to their TNM (T- primary tumour, N - regional lymphnodes, and M - metastasis) anatomical subsets. Table 3.3 and Table 3.4 show an overview of the TNM descriptors and the stage grouping.
Figure 3.7 H&E stained photomicrographs of the principal WHO classes: basal cell hyperplasia, metaplasia, mild dysplasia, moderate dysplasia, severe dysplasia, carcinoma in situ (CIS), microinvasive carcinoma and invasive squamous cell carcinoma (courtesy from S. Andrejevic-Blant, Institiure form Pathology, CHUV University Hospital, CH-Lausanne)

Chapter 3 – Introduction to Bronchology
43
Table 3.3 The international TNM (primary tumour (T), regional lymphnodes (N) and distant metastasis (M)) descriptor system for the staging of lung cancer revised from 1997 (adapted from [26]).
Stage TNM subset 0 Carcinoma in situ IA T1 N0 M0 IB T2 N0 M0 IIA T1 N1 M0 IIB T2 N1 M0 T3 N0 M0 IIIA T3 N1 M0 T1-3 N2 M0 IIIB T4 N0-3 M0 T1-3 N3 M0 IV any T any N M1
Table 3.4 Stage Grouping. The table shows the international definition of the TNM subsets for lung cancer staging (adapted from [26]).
3.3 Detection, Diagnosis and Treatment of bronchial Cancer: An overview
Lung cancer curability and survival are functions of the disease stage at presentation [11]. The extremely high mortality rate of lung cancer is strongly related to the general late detection and diagnosis of the disease. Stage I and II lung cancers rarely cause symptoms and consequently, fewer than 25% of all lung cancer patients will present during the early stage of the disease [10]. Unfortunately, the potentially curative therapy for advanced stage lung cancers (stage III - IV) is often beyond the reach of physician's present capabilities [27]. Indeed, the overall 5-year survival rate for lung cancer is only 14%. This rate is about 25% - 1% for stage III and IV lung cancer, but can reach 25% to 67% when the cancer is detected at an early stage (stage I or II) [28].
Thus, efficient detection of early stage bronchial carcinoma is crucial for a successful therapeutic outcome and survival. This is particularly true for the detection of flat, small pre-neoplastic lesions such as dysplasia and CIS, because those lesions have a high probability for growing into invasive lesions within a short period of time [29-31]. Clinical studies have
Primary Tumour T T0 No evidence of primary tumour Tis Carcinoma in situ T1 Tumour ≤ 3 cm in greatest dimension, no invasion more proximal than the lobar bronchus
T2 Tumour with any of the following features: > 3cm in greatest dimension; ≥ 2 cm distal to the carina; invading pleura; associated with atelectasis or local obstructive pneumonitis
T3 Tumour of any size directly invading any of the following: chest wall, diaphragm, midastinal pleura, parietal pericardium; or < 2 cm distal to the carina; or atelectasis or obstructive pneumonitis of entire lung
T4 Tumour of any size with invasion of mediastinal organs (e.g., heart, trachea, oesophagus, mediastinum) or vetebral body
Regional Lymph Nodes (N) No regional lymph node metastasis Ipsilateral peribronchial and/or ipsilateral hilar lymph node meatastasis
N0 N1 N2 Ipsilateral mediastinal and/or subcarinal lymph node metastasis
N3 Metastasis to contralateral mediastinal, contralateral hilar, ipsilateral or contralateral scalene, or supraclavicular lymph nodes
Distant Metastasis (M) M0 No distant metastasis M1 Distant metastasis present
Chapter 3 – Introduction to Bronchology
44
shown that approximately 10% of moderate dysplasia and 19% to 83% of severe dysplasia will progress to invasive lesions [32, 33].
Monitoring the progression of pre-neoplasia to neoplasia is especially important in the context of the management and follow up (interval between control bronchoscopies, chemoprevention) of patients diagnosed with a primary cancer in the bronchi and/or in the ENT sphere. These patients are at high risk for secondary or second primary bronchial neoplasia 2[34-39].
The incidence of second primary bronchial neoplasia for lung cancer patients ranges from 0.5% to 10% [38]. Sixty percent (60%) of all second primary bronchial cancers are metachronous, i.e. occur with a time delayed response to the primary tumour, and 40% are synchronous. The prevalence of second primary bronchial neoplasia in head and neck cancer patients has been reported to be 7%- 32% [40, 41]. In a clinical AF bronchoscopy study, Venmans et al. [32] found pre-neoplastic central bronchial lesions in 25% of patients with a history of head and neck SCC. Long term studies on patients with secondary or second primary lung cancers showed that resection of early metachronous lesions improved the long-term survival rate [38, 42]. However, most patients (68%) are asymptomatic at the time of diagnosis of the second primary cancer [42], which is frequently detected only "by accident" during a follow-up examination. Since secondary and second primary bronchial cancers may occur several years after the first cancer diagnosis [38], patients surviving treatment of a first primary carcinoma in the bronchi or the head and neck sphere require lifelong screening of second primary bronchial lesions [43]. Further high-risk populations that should be considered for screening for bronchial cancer include long-term survivors of small cell lung cancer, occupationally exposed groups, and subgroups of smokers (heavy smoker, family history of lung cancer)[44].
3.3.1 Detection of bronchial cancer The most common detection methods for lung cancer are sputum cytology, chest X-ray (CXR), computed tomography (CT), low-dose spiral CT, positron emission tomography (PET), magnetic resonance imaging (MRI) and white light or AF bronchoscopy.
CXR has only a limited resolution and thus, has only poor sensitivity for the detection of early bronchial lesions.
Low-dose CT is widely used for screening of high-risk patients. Its lung cancer detection rate is about 3-fold higher than with CXR. Several studies have shown that multi-detector spiral CT has a higher sensitivity to early and small sized lung cancer than CXR [27, 45].
Spiral CT can detect lesions as small as 2-3mm in size [14], but at the price of a low specificity [46, 47]. Moreover, CT is not sensitive to superficial, pre- or microinvasive central lung cancers [45].
PET with 18-fluorodeoxyglucose has to be considered as a diagnostic and staging tool, rather than a screening tool [48, 49]. Pastorino et al. demonstrated that the combined use of low-dose spiral CT and PET improves the specificity of early stage lung cancer detection [50].
Another screening tool widely used in high risk populations is the sputum analysis [51]. It has a high specificity especially for bronchial SCC, but only a limited sensitivity of 65% [51, 52]. It should be noted that this percentage is likely to be much smaller for dysplasie and squamous cell carcinoma. DNA analysis, automated quantitative cytometry and methylation
Chapter 3 – Introduction to Bronchology
45
of the sputum samples have shown promising results to improve sensitivity [45]. Sputum analysis is the least encumbering and least costly of the detection methods mentioned so far, and can easily be used in wide range screening programmes. However, it does not allow localisation of the lesion within the tracheo-bronchial tree. Indeed, bronchoscopy is the only established method that allows detection and localisation of central bronchial lesions and parallel tissue sampling for histological diagnosis.
Conventional white light bronchoscopy has a high sensitivity and specificity for early stage, invasive, central bronchial cancer, but is limited in the detection of small pre-neoplastic lesions. In the central airways, less than 40% of high grade dysplasia is detectable by conventional white light bronchoscopy [53, 54]. Autofluorescence bronchoscopy (AFB) has been introduced as a tool for the detection of flat pre-neoplastic central bronchial lesions. Its sensitivity for pre-invasive squamous lesions is about twice that of conventional white light bronchoscopy [22, 31, 55]. AFB will be discussed in Chapter 4 of this thesis in more detail.
3.3.2 Treatment of bronchial cancer Surgery is the preferred curative therapy of localised non-small cell lung cancer (NSCLC) at stage III and below. Depending on the stage and the extent of the lesion, surgery is performed as pneumectomy (surgical removal of a lung), or lobectomy (surgical removal of a lobe). The overall 5-year survival rate for complete surgical resection of stage I and II NSCLC is about 40% [56]. Limited resection such as segmentectomy or wedge resection reduce mortality and morbidity, but are associated with a 3 times higher local recurrence rate and a decrease in 5-year survival [56].
Post-operative radiotherapy and adjuvant or neoadjuvant chemotherapy can improve survival [57, 58]. However, about 30% of all patients with localised NSCLC ever undergo surgery due to presentation at an advanced stage, unresectability of the carcinoma, medical comorbidities, and advanced age [59]. In these cases, radiotherapy applied either alone or in combination with chemotherapy offers the only curative possibility. However, the mean 5-year survival rates for those treatments are below 27% for early stage (stage I and II) lung cancer [60] and around 10% for higher stage disease [61].
For localised pre-neoplasia, i.e. squamous dysplasia and CIS, (micro-)invasive carcinoma, and early stage bronchial carcinoma, minimal-invasive bronchoscopic therapies provide alternative treatment options [33, 62]. Most common therapies include PDT [63], endobronchial brachytherapy (EB) [64, 65], cryotherapy [66], argon plasma coagulation (APC) [67], lasertherapy with Nd:YAG laser and electrocautery [68]. The endoscopic treatment of early-stage bronchial cancer has been reviewed by Sheski [33] and Herth [62].
PDT for the treatment of early stage bronchial cancer and pre-neoplastic endobronchial lesions has been widely investigated. Clinical studies have shown that the response rate of PDT is highest for CIS and microinvasive SCC sized < 1 cm. 5-year survival rates in patients treated with PDT for early stage bronchial carcinoma or bronchial pre-neoplasia vary between 43% and 72% [Maziak, AnnThoracSurg]. The most common photosensitiser used for bronchial PDT is Photofrin® [69, 70], but clinical studies using m-THPC [71] and mono-L-aspartyl chlorin e6 [72] have also been reported. In a 3-year follow up study Monnier et al. [69]and Savary et al. [71] reported a local recurrence rate after PDT for dysplasia and CIS inferior to 15%. However, the use of bronchoscopic therapies for the treatment of bronchial cancer demands accurate delineation and staging of the lesion, especially the determination of the lesion's infiltration into the bronchial mucosal layers and the exclusion of nodal spread [73].
Chapter 3 – Introduction to Bronchology
46
3.4 References [1] Institut für Pathologie der Universität Basel, "Pathopic - Pathologie Datenbank," http://alf3.urz.unibas.ch/pathopic/copyright.htm, accessed on 20.03.2006
[2] Pathology Education Resources Laboratory [PERL] of the Indiana University School of Medicine, "PERLjam 2.01," http://erl.pathology.iupui.edu/, accessed on 20.03.2006
[3] H. C. Yeh and G. M. Schum, "Models of human lung airways and their application to inhaled particle deposition," Bull Math Biol 42(3), 461-480 (1980)
[4] Department of Physiology and Biophysics of the SUNY Stony Brook University, "The respiratory system," http://www.pnb.sunysb.edu/hby531/chap11%20respiratory.pdf, accessed on 24.03.2006
[5] J. E. Tyczynski, F. Bray and D. M. Parkin, "Lung cancer in europe in 2000: epidemiology, prevention, and early detection," Lancet Oncology 4(1), 45-55 (2003)
[6] Y.-P. Liaw, G.-W. Lien and Y.-C. Huang, "Patterns of lung cancer mortality in 23 countries: Application of the Age-Period-Cohort model," BMC Public Health 5((2005)
[7] W. K. Lam, M. M. Chan-Yeung and N. W. White, "Lung cancer epidemiology and risk factors in Asia and Africa," International Journal of Tuberculosis and Lung Disease 8(9), 1045-1057 (2004)
[8] F. Levi, F. Lucchini, C. La Vecchia, E. Negri and F. Levi, "Trends in mortality from major cancers in the European Union, including acceding countries, in 2004," Cancer 101(1), 2843-2850 (2004)
[9] A. Jemal, T. Murray, E. Ward, A. Samuels, A. Ghafoor, M. J. Thun, R. C. Tiwari and E. J. Feuer, "Cancer statistics, 2005," Ca-A Cancer Journal for Clinicians 55(1), 10-30 (2005)
[10] V. Schulz, D. Zeidler, J. Adolph and K. Zum Winkel, "Bronchopulmonare Tumoren," in Pneumologie in Praxis und Klinik, R. Ferlinz, Georg Thieme Verlag, Stuttgart (1994).
[11] C. Paris, F. Saunier, J. Benichou, J. Metayer, P. Brochard, L. Thiberville and G. Nouvet, "Smoking status, occupational asbestos exposure and bronchial location of lung cancer," Lung Cancer 40(1), 17-24 (2003)
[12] O. Auerbach and L. Garfinkel, "The changing pattern of lung carcinoma," Cancer 68(1), 1973-1977 (1991)
[13] Globocan 2002, "Globocan 2002 database," http://www-dep.iarc.fr, accessed on 23.03.2006
[14] T. C. Kennedy, Y. Miller and S. Prindiville, "Screening for lung cancer revisited and the role of sputum cytology and fluorescence bronchoscopy in a high-risk group," Chest 117(Suppl.), 72S-79S (2000)
[15] A. F. Gazdar and J. D. Minna, "Cigarettes, sex, and lung adenocarcinoma.," Journal of the National Cancer Institute 89(21), 1563-1565 (1997)
[16] M. J. Thun, C. A. Lally, E. E. Calle, C. W. Heath Jr., J. T. Flannery, W. D. Flanders and M. J. Thun, "Cigarette smoking and changes in the histopathology of lung cancer," Journal of the National Cancer Institute 89(21), 1580-1586 (1997)
[17] S. Franceschi and E. Bidoli, "The epidemiology of lung cancer," Annals of Oncology 10(0), 3-6 (1999)
[18] T. Driscoll, D. I. Nelson, M. Fingerhut, A. Prüss-U?stu?n, K. Steenland, J. Leigh and M. Concha-Barrientos, "The global burden of disease due to occupational carcinogens," American Journal of Industrial Medicine 48(6), 419-431 (2005)
[19] K. Steenland, D. Loomis, C. Shy and N. Simonsen, "Review of occupational lung carcinogens," American Journal of Industrial Medicine 29(5), 474-490 (1996)

Chapter 3 – Introduction to Bronchology
47
[20] A. Agudo, W. Ahrens, E. Benhamou, S. Benhamou, P. Boffetta, S. C. Darby, F. Forastiere, C. Fortes, V. Gaborieau, C. A. Gonzalez, K.-H. Jockel, M. Kreuzer, F. Merletti, H. Pohlabeln, L. Richiardi, E. Whitley, H.-E. Wichmann, P. Zambon and L. Simonato, "Lung cancer and cigarette smoking in women: A multicenter case-control study in Europe," International Journal of Cancer 88(5), 820-827 (2000)
[21] A. Engeland, T. Haldorsen, A. Andersen and S. Tretli, "The impact of smoking habits on lung cancer risk: 28 years' observation of 26,000 Norwegian men and women," Cancer Causes and Control 7(3), 366-376 (1996)
[22] S. Lam, C. MacAulay, J. Hung, J. LeRiche, A. E. Profio and B. Palcic, "Detection of dysplasia and carcinoma in situ with a lung imaging fluorescence endoscope device," Journal of Thoracic and Cardiovascular Surgery 105(6), 1035-1040 (1993)
[23] E. Hawk, G. Kelloff, A. F. Gazdar, S. Lam, J. C. LeRiche, Y. Zheng, A. Coldman and C. MacAulay, "Sex-related differences in bronchial epithelial changes associated with tobacco smoking," Journal of the National Cancer Institute 91(8), 691-696 (1999)
[24] A. Fisseler-Eckhoff, Stromareaktionen in bronchialen Präneoplasien und Lungentumoren, Springer-Verlag GmbH (1998).
[25] A. G. Nicholson, L. J. Perry, P. M. Cury, P. Jackson, C. M. McCormick, B. Corrin and A. U. Wells, "Reproducibility of the WHO/IASLC grading system for pre-invasive squamous lesions of the bronchus: A study of inter-observer and intra-observer variation," Histopathology 202-208 (2001)
[26] C. F. Mountain, "The international system for staging lung cancer," Semin Surg Oncol 18(2), 106-115 (2000)
[27] G. Bepler, B. Djulbegovic, R. A. Clark and M. Tockman, "A systemic review and lessons learned from early lung cancer detection trial using low-dose computed tomography of the chest," Cancer Control 10(4), 306-324 (2003)
[28] C. F. Mountain, "Revisions in the International System for Staging Lung Cancer," Chest 111(6), 1710-1717 (1997)
[29] S. Bota, A. J-B., C. Paris, J. Métayer, R. Sesboüé, G. Nouvet and L. Thiberville, "Follow-up of bronochial precancerous lesions and carcinoma in situ using fluorescence endoscopy," Am J Respir Crit Care Med 164(1688-1693 (2001)
[30] B. J. Venmans, T. J. van Boxem, E. F. Smit, P. E. Postmus and T. G. Sutedja, "Outcome of bronchial carcinoma in situ," Chest 117(6), 1572-1576 (2000)
[31] S. Lam, T. Kennedy and M. Unger, "Localization of bronchial intraepitheloial neoplastic lesions by fluorescence bronchoscopy," Chest 113(3), 696-702 (1998)
[32] B. J. W. Venmans, T. J. M. Van Boxem, E. F. Smit, P. E. Postmus and T. G. Sutedja, "Bronchial intraepithelial neoplastic lesions in head and neck cancer patients: Results of autofluorescence bronchoscopy," Annals of Otology, Rhinology and Laryngology 110(7 I), 635-638 (2001)
[33] F. Sheski and P. Mathur, "Endoscopic treatment of early stage lung cancer," Cancer Control 7(1), (2000)
[34] S. J. Stoeckli, R. Zimmermann and S. Schmid, "Role of routine panendoscopy in cancer of the upper aerodiaestive tract," Otolaryngology - Head and Neck Surgery 124(2), 208-212 (2001)
[35] N. Martini, M. S. Bains, M. E. Burt, M. F. Zakowski, P. McCormack, V. W. Rusch, R. J. Ginsberg, L. P. Faber, J. R. Benfield and D. L. Morton, "Incidence of local recurrence and second primary tumors in resected stage I lung cancer," Journal of Thoracic and Cardiovascular Surgery 109(1), 120-129 (1995)
[36] B. E. Johnson, "Second lung cancers in patients after treatment for an initial lung cancer," Journal of the National Cancer Institute 90(18), 1335-1445 (1998)

Chapter 3 – Introduction to Bronchology
48
[37] F. Levi, L. Randimbison, V. C. Te and C. La Vecchia, "Second primary cancers in patients with lung carcinoma," Cancer 86(1), 186-190 (1999)
[38] T. Antakli, R. F. Schaefer, J. E. Rutherford and R. C. Read, "Second primary lung cancer," Ann Thorac Surg 59(863-867 (1995)
[39] A. S. Jones, P. Morar, D. E. Phillips, J. K. Field, D. Husband and T. R. Helliwell, "Second primary tumors in patients with head and neck squamous cell carcinoma," Cancer 75(6), 1343-1353 (1995)
[40] F. W.-B. Deleyiannis and D. B. Thomas, "Risk of lung cancer among patients with head and neck cancer," Otolaryngology - Head and Neck Surgery 116(6), 630-636 (1997)
[41] X. León, M. Quer, S. Diez, C. Orús, J. Burgués and A. López-Pousa, "Second neoplasm in patients with head and neck cancer," Head and Neck 21(3), 204-210 (1999)
[42] J. W. Asaph, J. F. Keppel, J. R. Handy, E. C. Douville, A. C. Tsen and G. Y. Ott, "Surgery for second lung cancers," Chest 118(1621-1625 (2000)
[43] C. Doddoli, P. Thomas, O. Ghez, R. Guidicelli and P. Fuentes, "Surgical management of metachronous bronchial carcinoma," European Journal of Cardio-thoracic Surgery 19(899-903 (2001)
[44] J. F. Battey, P. H. Brown, E. R. Gritz, W. K. Hong, B. E. Johnson, D. D. Karp, J. L. Mulshine, G. L. Shaw, D. R. Shopland, M. E. Sunday and E. Szabo, "Primary and Secondary Prevention of Lung Cancer: an International Association for the Study of Lung Cancer workshop," Lung Cancer 12(1-2), 91-103 (1995)
[45] A. McWilliams, J. Mayo, S. MacDonald, J. C. leRiche, B. Palcic, E. Szabo and S. Lam, "Lung cancer screening," Am J Respir Crit Care Med 168(1167-1173 (2003)
[46] C. I. Henschke, D. I. McCauley, D. F. Yankelevitz, D. P. Naidich, G. McGuinness, O. S. Miettinen, D. M. Libby, M. W. Pasmantier, J. Koizumi, N. K. Altorki and J. P. Smith, "Early Lung Cancer Action Project: overall design and findings from baseline screening," The Lancet 354(9173), 99-105 (1999)
[47] C. I. Henschke, J. P. Wisnivesky, D. F. Yankelevitz and O. S. Miettinen, "Small stage I cancers of the lung: genuineness and curability," Lung Cancer 39(327-330 (2003)
[48] N. van Zandwijk, "New methods for early diagnosis of lung cancer," Lung Cancer 38(S9-S11 (2002)
[49] J. Port, M. Kent and N. Altorki, "Early lung cancer detection and treatment strategies.," Surg Oncol 11(4), 191-199 (2002)
[50] U. Pastorino, M. Bellomi, C. Landoni, E. De Fiori, P. Arnaldi, M. Picchio, G. Pelosi, P. Boyle and F. Fazio, "Early lung-cancer detection with spiral CT and positron emission tomography in heavy smokers: 2-year results," The Lancet 362(9384), 593-597 (2003)
[51] F. B. J. M. Thunnissen, "Sputum examination for early detection of lung cancer," J Clin Pathol 56(11), 805-810 (2003)
[52] K.-M. Deppermann, "Lung cancer screening - Where we are in 2004 (take home messages)," Lung Cancer (2004)
[53] S. Lam, C. MacAulay, J. C. leRiche and B. Palcic, "Detection and localization of early lung cancer by fluorescence bronchoscopy," Cancer Suppl. 89(11), 2468-2473 (2000)
[54] G. Wagnières, A. McWilliams and S. Lam, "Lung cancer imaging with fluorescence endoscopy," in Handbook of Biomedical Fluorescence, M.-A. Myceck and B. W. Pogue, pp. 361-396, Marcel Dekker, Inc. (2003).
[55] D. Goujon, M. Zellweger, A. Radu, G. P., B.-C. Weber, H. van den Bergh, P. Monnier and G. Wagnières, "In vivo autofluorescence imaging of early cancers in the human tracheobronchial tree with a spectrally optimized system," J Biomed Optics 8(1), 17-25 (2003)

Chapter 3 – Introduction to Bronchology
49
[56] H. Dienemann, "Principles of surgical treatment in localized non-small cell lung cancer," Lung Cancer 33(Supplement 1), S3-S8 (2001)
[57] PORT Meta-analysis Trialists Group, "Postoperative radiotherapy in non-small-cell lung cancer: systematic review and meta-analysis of individual patient data from nine randomised controlled trials," The Lancet 352(9124), 257-263 (1998)
[58] Non-small Cell Lung Cancer Collaborative Group, "Chemotherapy in non-small cell lung cancer: a meta-analysis using updated data on individual patients from 52 randomised clinical trials. Non-small Cell Lung Cancer Collaborative Group," BMJ 311(7010), 899-909 (1995)
[59] M. Baumann, S. Appold, C. Petersen, D. Zips and T. Herrmann, "Dose and fractionation concepts in the primary radiotherapy of non-small cell lung cancer," Lung Cancer 33(Supplement 1), S35-S45 (2001)
[60] F. B. Zimmermann, M. Bamberg, M. Molls and B. Jeremic, "Radiation therapy alone in early stage non-small cell lung cancer," Semin Surg Oncol 21(2), 91-97 (2003)
[61] R. Souhami and J. Tobias, Cancer and its management, Blackwell Science Ltd., Oxford (1998).
[62] F. J. F. Herth and L. Freitag, "Interventionelle Therapie," Der Onkologe 11(7), 759-767 (2005)
[63] T. G. Sutedja and P. E. Postmus, "Photodynamic therapy in lung cancer. A review," J Photochem Photobiol B 36(2), 199-204 (1996)
[64] H. N. Macha, B. Wahlers, C. Reichle and D. Von Zwehl, "Endobronchial radiation therapy for obstructing malignancies: Ten years' experience with iridium-192 high-dose radiation brachytherapy afterloading technique in 365 patients," Lung 173(5), 271-280 (1995)
[65] S. Nag, J. F. Kelly, J. L. Horton, R. Komaki and D. Nori, "Brachytherapy for carcinoma of the lung," ONCOLOGY 15(3), 371-381 (2001)
[66] N. Deygas, M. Froudarakis, G. Ozenne and J. M. Vergnon, "Cryotherapy in early superficial bronchogenic carcinoma," Chest 120(1), 26-31 (2001)
[67] C. Crosta, L. Spaggiari, A. D. Stefano, G. Fiori, D. Ravizza and U. Pastorino, "Endoscopic argon plasma coagulation for palliative treatment of malignant airway obstructions: early results in 47 cases," Lung Cancer 33(1), 75-80 (2001)
[68] A. van Boxem, J. Westerga, B. Venmans, P. Postmus and G. Sutedja, "Photodynamic therapy, Nd-YAG laser and electrocautery for treating early-stage intraluminal cancer: which to choose?," Lung Cancer 31(1), 31-36 (2001)
[69] P. Monnier, M. Savary, C. Fontolliet, G. A. Wagnieres Chatelain, P. Cornaz, C. Depeursinge and H. Van den Bergh, "Photodetection and photodynamic therapy of 'early' squamous cell carcinomas of the pharynx, oesophagus and tracheo-bronchial tree," Lasers in Medical Science 5(2), 149-168 (1990)
[70] H. Kato, "Photodynamic therapy for lung cancer - A review of 19 years' experience," Journal of Photochemistry and Photobiology B: Biology 42(2), 96-99 (1998)
[71] J.-F. Savary, P. Monnier, C. Fontolliet, G. Wagnières, D. Braichotte, H. Van Den Bergh and J. Mizeret, "Photodynamic therapy for early squamous cell carcinomas of the esophagus, bronchi, and mouth with m-tetra(hydroxyphenyl) chlorin," Archives of Otolaryngology - Head and Neck Surgery 123(2), 162-168 (1997)
[72] H. Kato, K. Furukawa, M. Sato, T. Okunaka, Y. Kusunoki, M. Kawahara, M. Fukuoka, T. Miyazawa, T. Yana, K. Matsui, T. Shiraishi and H. Horinouchi, "Phase II clinical study of photodynamic therapy using mono-L-aspartyl chlorin e6 and diode laser for early superficial squamous cell carcinoma of the lung.," Lung Cancer 42(1), 103-111 (2003)
[73] G. Sutedja and P. Postmus, "The role of photodynamic therapy in the management of stage I/II NSCLC.," Lung Cancer 34 Suppl 3(S35-38 (2001)

50

51
Chapter 4 Autofluorescence
Bronchoscopy
s already mentioned in the preceding chapters, bronchoscopy is the only available clinical detection method that allows for the detection and localisation, as well as treatment of central bronchial pre-neoplasia and invasive carcinoma. Recent advances
in the endoscopic video optical techniques have brought about significant improvements in sensitivity and specificity of white light (WL) bronchoscopy. The bronchoscpic detection of central bronchial lesions relies on the visual judgement of the bronchoscopist. Mucosal thickening, swelling or nodules are quite obvious during WL bronchoscopy, but mostly evident for invasive lesions only. Pre-neoplastic lesions have to be judged by more subtle alterations like redness, paleness, lack of luster, disrupture of mucosal folds or elastic fibre bundles, and vascular engorgement, among others [1]. Thus, correct judgement of small lesions strongly depends on the bronchoscopist’s accuracy and training. This is indeed one major limiting factor for the detection of bronchial pre-neoplasia by WL bronchoscopy. Autofluorescence bronchoscopy using blue-violet excitation light, on the other hand, has a higher sensitivity for flat pre-neoplastic lesions almost “independent” of the bronchoscopist’s experience.
This chapter provides an overview of the historical development of autofluoresence bronchoscopy, the commercially available imaging systems, as well as the imaging system used for the clinical studies reported in this thesis work.
A
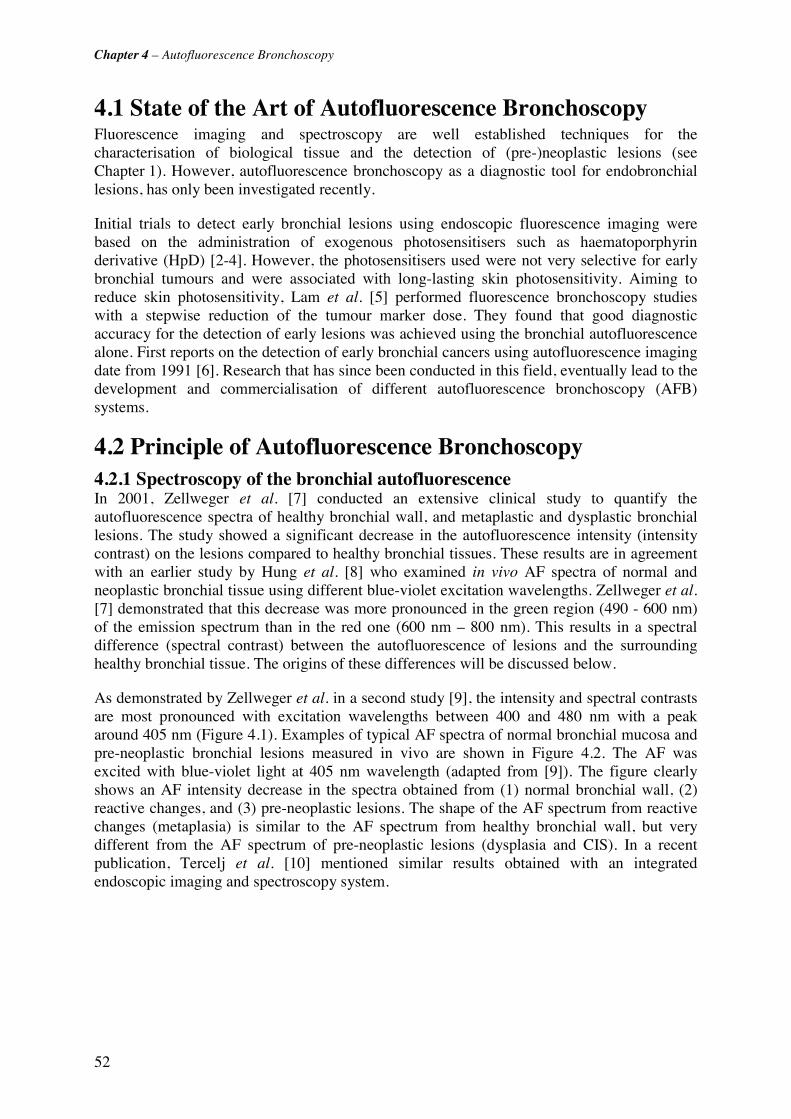
Chapter 4 – Autofluorescence Bronchoscopy
52
4.1 State of the Art of Autofluorescence Bronchoscopy Fluorescence imaging and spectroscopy are well established techniques for the characterisation of biological tissue and the detection of (pre-)neoplastic lesions (see Chapter 1). However, autofluorescence bronchoscopy as a diagnostic tool for endobronchial lesions, has only been investigated recently.
Initial trials to detect early bronchial lesions using endoscopic fluorescence imaging were based on the administration of exogenous photosensitisers such as haematoporphyrin derivative (HpD) [2-4]. However, the photosensitisers used were not very selective for early bronchial tumours and were associated with long-lasting skin photosensitivity. Aiming to reduce skin photosensitivity, Lam et al. [5] performed fluorescence bronchoscopy studies with a stepwise reduction of the tumour marker dose. They found that good diagnostic accuracy for the detection of early lesions was achieved using the bronchial autofluorescence alone. First reports on the detection of early bronchial cancers using autofluorescence imaging date from 1991 [6]. Research that has since been conducted in this field, eventually lead to the development and commercialisation of different autofluorescence bronchoscopy (AFB) systems.
4.2 Principle of Autofluorescence Bronchoscopy 4.2.1 Spectroscopy of the bronchial autofluorescence In 2001, Zellweger et al. [7] conducted an extensive clinical study to quantify the autofluorescence spectra of healthy bronchial wall, and metaplastic and dysplastic bronchial lesions. The study showed a significant decrease in the autofluorescence intensity (intensity contrast) on the lesions compared to healthy bronchial tissues. These results are in agreement with an earlier study by Hung et al. [8] who examined in vivo AF spectra of normal and neoplastic bronchial tissue using different blue-violet excitation wavelengths. Zellweger et al. [7] demonstrated that this decrease was more pronounced in the green region (490 - 600 nm) of the emission spectrum than in the red one (600 nm – 800 nm). This results in a spectral difference (spectral contrast) between the autofluorescence of lesions and the surrounding healthy bronchial tissue. The origins of these differences will be discussed below.
As demonstrated by Zellweger et al. in a second study [9], the intensity and spectral contrasts are most pronounced with excitation wavelengths between 400 and 480 nm with a peak around 405 nm (Figure 4.1). Examples of typical AF spectra of normal bronchial mucosa and pre-neoplastic bronchial lesions measured in vivo are shown in Figure 4.2. The AF was excited with blue-violet light at 405 nm wavelength (adapted from [9]). The figure clearly shows an AF intensity decrease in the spectra obtained from (1) normal bronchial wall, (2) reactive changes, and (3) pre-neoplastic lesions. The shape of the AF spectrum from reactive changes (metaplasia) is similar to the AF spectrum from healthy bronchial wall, but very different from the AF spectrum of pre-neoplastic lesions (dysplasia and CIS). In a recent publication, Tercelj et al. [10] mentioned similar results obtained with an integrated endoscopic imaging and spectroscopy system.
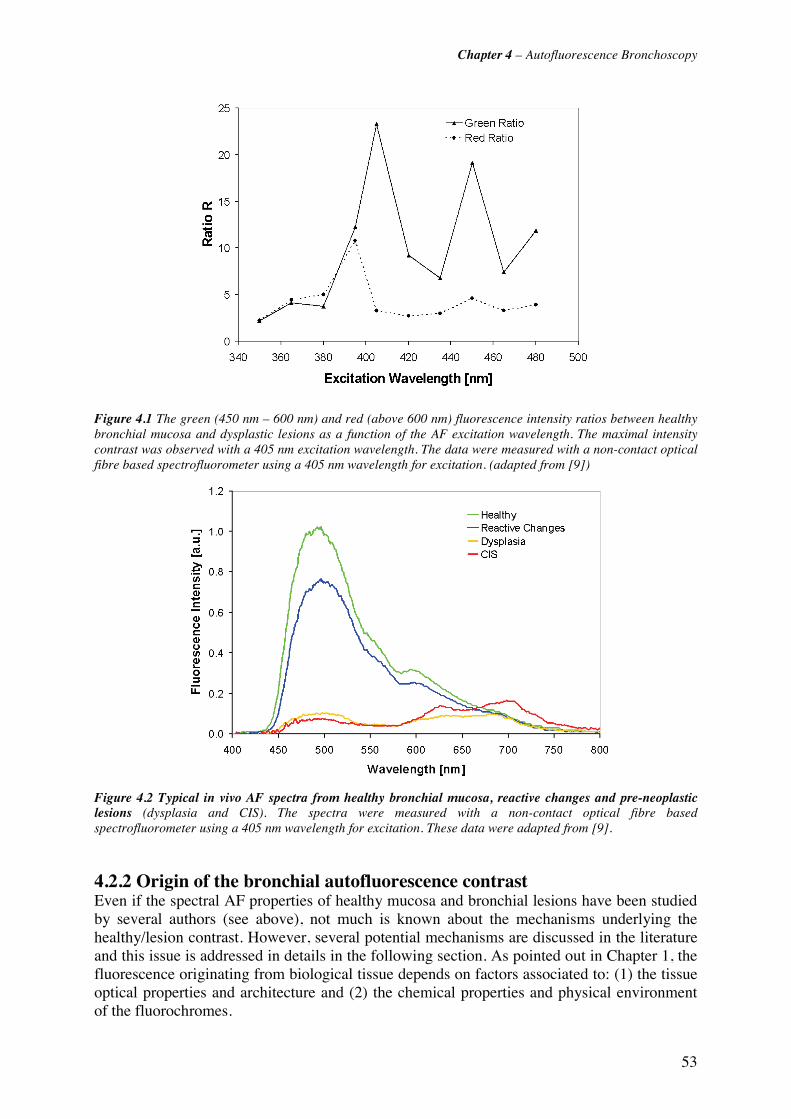
Chapter 4 – Autofluorescence Bronchoscopy
53
Figure 4.1 The green (450 nm – 600 nm) and red (above 600 nm) fluorescence intensity ratios between healthy bronchial mucosa and dysplastic lesions as a function of the AF excitation wavelength. The maximal intensity contrast was observed with a 405 nm excitation wavelength. The data were measured with a non-contact optical fibre based spectrofluorometer using a 405 nm wavelength for excitation. (adapted from [9])
Figure 4.2 Typical in vivo AF spectra from healthy bronchial mucosa, reactive changes and pre-neoplastic lesions (dysplasia and CIS). The spectra were measured with a non-contact optical fibre based spectrofluorometer using a 405 nm wavelength for excitation. These data were adapted from [9].
4.2.2 Origin of the bronchial autofluorescence contrast Even if the spectral AF properties of healthy mucosa and bronchial lesions have been studied by several authors (see above), not much is known about the mechanisms underlying the healthy/lesion contrast. However, several potential mechanisms are discussed in the literature and this issue is addressed in details in the following section. As pointed out in Chapter 1, the fluorescence originating from biological tissue depends on factors associated to: (1) the tissue optical properties and architecture and (2) the chemical properties and physical environment of the fluorochromes.
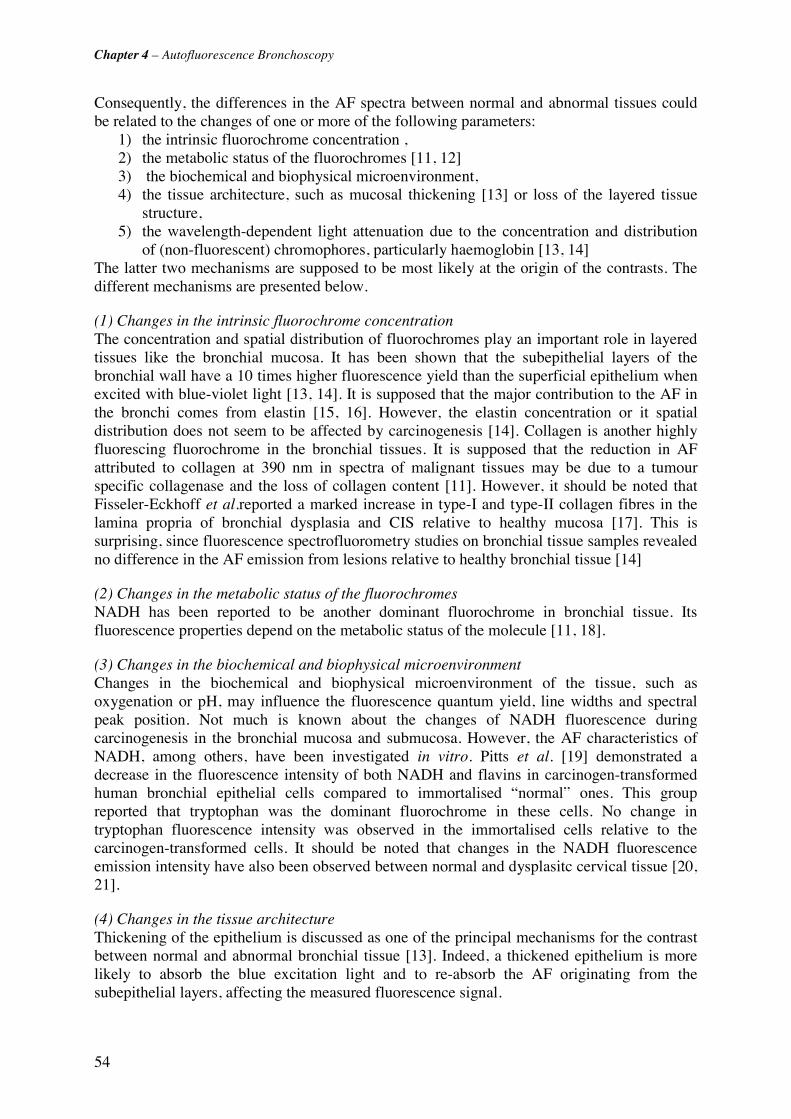
Chapter 4 – Autofluorescence Bronchoscopy
54
Consequently, the differences in the AF spectra between normal and abnormal tissues could be related to the changes of one or more of the following parameters:
1) the intrinsic fluorochrome concentration , 2) the metabolic status of the fluorochromes [11, 12] 3) the biochemical and biophysical microenvironment, 4) the tissue architecture, such as mucosal thickening [13] or loss of the layered tissue
structure, 5) the wavelength-dependent light attenuation due to the concentration and distribution
of (non-fluorescent) chromophores, particularly haemoglobin [13, 14] The latter two mechanisms are supposed to be most likely at the origin of the contrasts. The different mechanisms are presented below.
(1) Changes in the intrinsic fluorochrome concentration The concentration and spatial distribution of fluorochromes play an important role in layered tissues like the bronchial mucosa. It has been shown that the subepithelial layers of the bronchial wall have a 10 times higher fluorescence yield than the superficial epithelium when excited with blue-violet light [13, 14]. It is supposed that the major contribution to the AF in the bronchi comes from elastin [15, 16]. However, the elastin concentration or it spatial distribution does not seem to be affected by carcinogenesis [14]. Collagen is another highly fluorescing fluorochrome in the bronchial tissues. It is supposed that the reduction in AF attributed to collagen at 390 nm in spectra of malignant tissues may be due to a tumour specific collagenase and the loss of collagen content [11]. However, it should be noted that Fisseler-Eckhoff et al.reported a marked increase in type-I and type-II collagen fibres in the lamina propria of bronchial dysplasia and CIS relative to healthy mucosa [17]. This is surprising, since fluorescence spectrofluorometry studies on bronchial tissue samples revealed no difference in the AF emission from lesions relative to healthy bronchial tissue [14]
(2) Changes in the metabolic status of the fluorochromes NADH has been reported to be another dominant fluorochrome in bronchial tissue. Its fluorescence properties depend on the metabolic status of the molecule [11, 18].
(3) Changes in the biochemical and biophysical microenvironment Changes in the biochemical and biophysical microenvironment of the tissue, such as oxygenation or pH, may influence the fluorescence quantum yield, line widths and spectral peak position. Not much is known about the changes of NADH fluorescence during carcinogenesis in the bronchial mucosa and submucosa. However, the AF characteristics of NADH, among others, have been investigated in vitro. Pitts et al. [19] demonstrated a decrease in the fluorescence intensity of both NADH and flavins in carcinogen-transformed human bronchial epithelial cells compared to immortalised “normal” ones. This group reported that tryptophan was the dominant fluorochrome in these cells. No change in tryptophan fluorescence intensity was observed in the immortalised cells relative to the carcinogen-transformed cells. It should be noted that changes in the NADH fluorescence emission intensity have also been observed between normal and dysplasitc cervical tissue [20, 21].
(4) Changes in the tissue architecture Thickening of the epithelium is discussed as one of the principal mechanisms for the contrast between normal and abnormal bronchial tissue [13]. Indeed, a thickened epithelium is more likely to absorb the blue excitation light and to re-absorb the AF originating from the subepithelial layers, affecting the measured fluorescence signal.
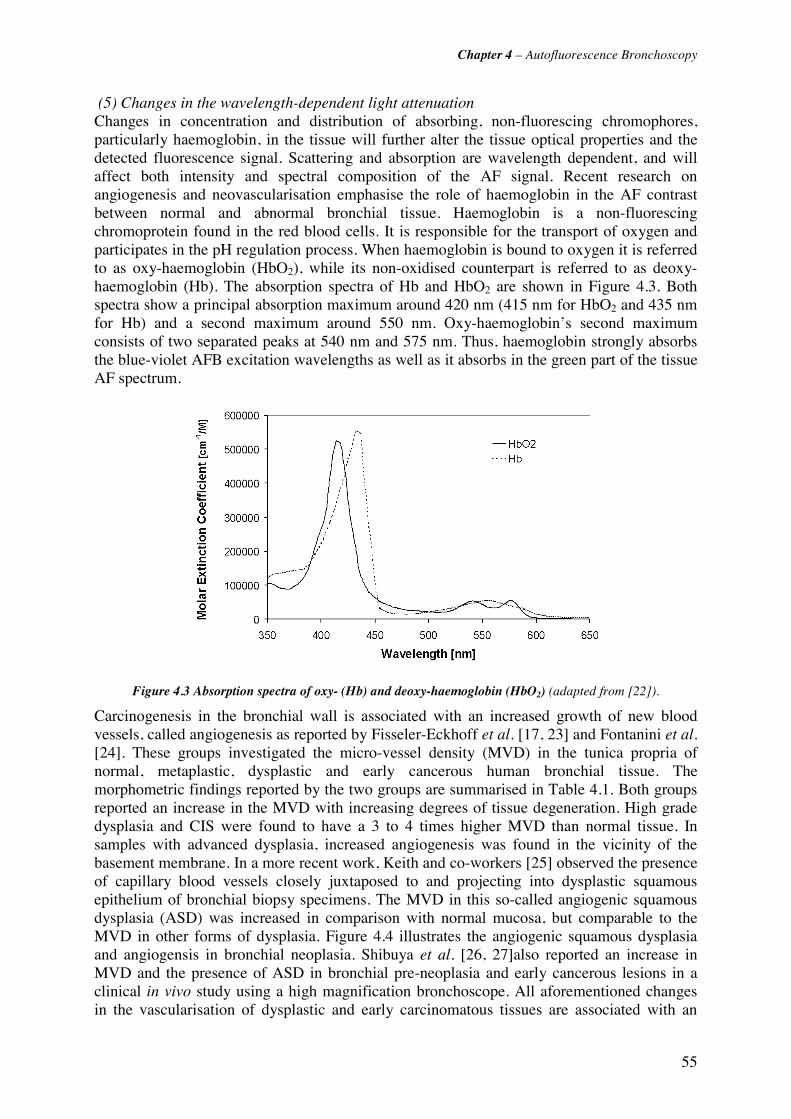
Chapter 4 – Autofluorescence Bronchoscopy
55
(5) Changes in the wavelength-dependent light attenuation Changes in concentration and distribution of absorbing, non-fluorescing chromophores, particularly haemoglobin, in the tissue will further alter the tissue optical properties and the detected fluorescence signal. Scattering and absorption are wavelength dependent, and will affect both intensity and spectral composition of the AF signal. Recent research on angiogenesis and neovascularisation emphasise the role of haemoglobin in the AF contrast between normal and abnormal bronchial tissue. Haemoglobin is a non-fluorescing chromoprotein found in the red blood cells. It is responsible for the transport of oxygen and participates in the pH regulation process. When haemoglobin is bound to oxygen it is referred to as oxy-haemoglobin (HbO2), while its non-oxidised counterpart is referred to as deoxy-haemoglobin (Hb). The absorption spectra of Hb and HbO2 are shown in Figure 4.3. Both spectra show a principal absorption maximum around 420 nm (415 nm for HbO2 and 435 nm for Hb) and a second maximum around 550 nm. Oxy-haemoglobin’s second maximum consists of two separated peaks at 540 nm and 575 nm. Thus, haemoglobin strongly absorbs the blue-violet AFB excitation wavelengths as well as it absorbs in the green part of the tissue AF spectrum.
Figure 4.3 Absorption spectra of oxy- (Hb) and deoxy-haemoglobin (HbO2) (adapted from [22]).
Carcinogenesis in the bronchial wall is associated with an increased growth of new blood vessels, called angiogenesis as reported by Fisseler-Eckhoff et al. [17, 23] and Fontanini et al. [24]. These groups investigated the micro-vessel density (MVD) in the tunica propria of normal, metaplastic, dysplastic and early cancerous human bronchial tissue. The morphometric findings reported by the two groups are summarised in Table 4.1. Both groups reported an increase in the MVD with increasing degrees of tissue degeneration. High grade dysplasia and CIS were found to have a 3 to 4 times higher MVD than normal tissue. In samples with advanced dysplasia, increased angiogenesis was found in the vicinity of the basement membrane. In a more recent work, Keith and co-workers [25] observed the presence of capillary blood vessels closely juxtaposed to and projecting into dysplastic squamous epithelium of bronchial biopsy specimens. The MVD in this so-called angiogenic squamous dysplasia (ASD) was increased in comparison with normal mucosa, but comparable to the MVD in other forms of dysplasia. Figure 4.4 illustrates the angiogenic squamous dysplasia and angiogensis in bronchial neoplasia. Shibuya et al. [26, 27]also reported an increase in MVD and the presence of ASD in bronchial pre-neoplasia and early cancerous lesions in a clinical in vivo study using a high magnification bronchoscope. All aforementioned changes in the vascularisation of dysplastic and early carcinomatous tissues are associated with an

Chapter 4 – Autofluorescence Bronchoscopy
56
increased blood (thus, haemoglobin) concentration in this type of tissue relative to normal tissue. Therefore, blood absorption is likely to play an important role in the AF contrast.
Author Fisseler-Eckhoff et al. [17, 23] Fontanini et al. [28]
Measured depth in tissue 0.4 mm below the basement membrane in the
lamina propria in the lamina propria (depth not specified)
Measured Value Microvessel Density Vessel Cross section
[10-4 mm2] Microvessel Density
Healthy Bronchial Wall 33 mm-2 9.04 12 mm-2
Chronic Inflammation 55 mm-2 14.4 -
Acute Inflammation 43 mm-2 11.3 -
Hyperplasia 40 mm-2 5.38 11 ± 5 mm-2
Squamous cell Metaplasia 55 mm-2 15.3 11 ± 5 mm-2
Mild Dysplasia 83 mm-2 2.95 13.5 mm-2
Moderate Dysplasia - - 28 ± 20 mm-2
Severe Dysplasia/ CIS 101 mm-2 9.08 56 ± 14 mm-2
Invasive SCC 105 mm-2 7.61 77 ± 10 mm-2
Table 4.1 Morphometric data for vascularisation of healthy and neoplastic bronchial mucosa, derived from Fisseler-Eckhoff [17, 23] and Fontanini [28]. Though the absolute values for the vessel density in the subepithelial layers of the bronchial wall are different, both reports show an increase in the vessel density with increasing grade of pre-neoplasia and neoplasia
Figure 4.4 Photomicrographs of ASD (adapted form [25]). Image a) shows capillary tufts (arrows) projecting into the dysplastic squamous epithelium of the bronchial wall. The epithelium is thickened. Thickening of the basement membrane, as shown in image b) was frequently observed in ASD lesions.
In Chapter 5 of this thesis, we present a number of studies aimed at investigating the potential mechanisms underlying the AF difference between normal and (pre-)neoplastic bronchial tissue and their origins.
4.2.3 Optical properties of normal bronchial tissue The main optical parameters of normal bronchial epithelium and its subepithelial layers have been investigated by Qu et al. [14] and are summarised in Table 4.2 for blue-violet
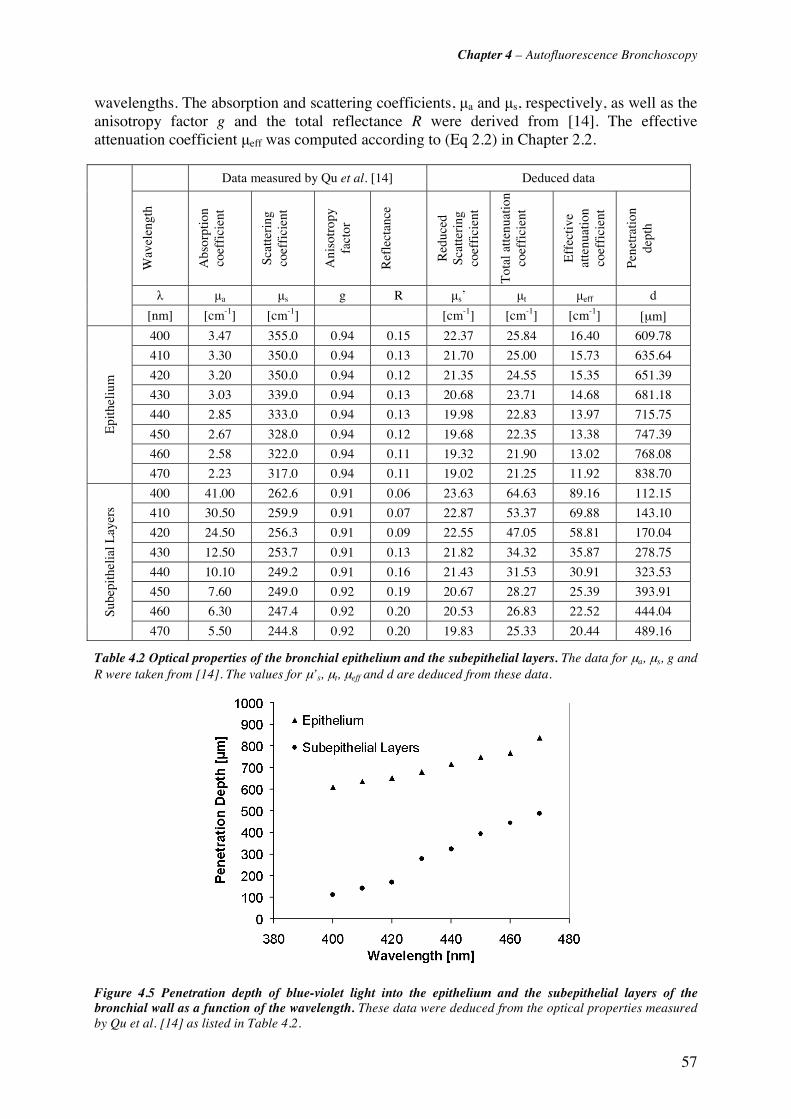
Chapter 4 – Autofluorescence Bronchoscopy
57
wavelengths. The absorption and scattering coefficients, μa and μs, respectively, as well as the anisotropy factor g and the total reflectance R were derived from [14]. The effective attenuation coefficient μeff was computed according to (Eq 2.2) in Chapter 2.2.
Data measured by Qu et al. [14] Deduced data
Wav
elen
gth
Abs
orpt
ion
coef
fici
ent
Scat
teri
ng
coef
fici
ent
Ani
sotr
opy
fact
or
Ref
lect
ance
Red
uced
Sc
atte
ring
co
effi
cien
t
Tot
al a
ttenu
atio
n co
effi
cien
t
Eff
ecti
ve
atte
nuat
ion
coef
fici
ent
Pene
trat
ion
de
pth
λ μa μs g R μs’ μt μeff d
[nm] [cm-1] [cm-1] [cm-1] [cm-1] [cm-1] [μm]
400 3.47 355.0 0.94 0.15 22.37 25.84 16.40 609.78
410 3.30 350.0 0.94 0.13 21.70 25.00 15.73 635.64
420 3.20 350.0 0.94 0.12 21.35 24.55 15.35 651.39
430 3.03 339.0 0.94 0.13 20.68 23.71 14.68 681.18
440 2.85 333.0 0.94 0.13 19.98 22.83 13.97 715.75
450 2.67 328.0 0.94 0.12 19.68 22.35 13.38 747.39
460 2.58 322.0 0.94 0.11 19.32 21.90 13.02 768.08
Epi
thel
ium
470 2.23 317.0 0.94 0.11 19.02 21.25 11.92 838.70
400 41.00 262.6 0.91 0.06 23.63 64.63 89.16 112.15
410 30.50 259.9 0.91 0.07 22.87 53.37 69.88 143.10
420 24.50 256.3 0.91 0.09 22.55 47.05 58.81 170.04
430 12.50 253.7 0.91 0.13 21.82 34.32 35.87 278.75
440 10.10 249.2 0.91 0.16 21.43 31.53 30.91 323.53
450 7.60 249.0 0.92 0.19 20.67 28.27 25.39 393.91
460 6.30 247.4 0.92 0.20 20.53 26.83 22.52 444.04 Sube
pith
elia
l Lay
ers
470 5.50 244.8 0.92 0.20 19.83 25.33 20.44 489.16
Table 4.2 Optical properties of the bronchial epithelium and the subepithelial layers. The data for μa, μs, g and R were taken from [14]. The values for μ’s, μt, μeff and d are deduced from these data.
Figure 4.5 Penetration depth of blue-violet light into the epithelium and the subepithelial layers of the bronchial wall as a function of the wavelength. These data were deduced from the optical properties measured by Qu et al. [14] as listed in Table 4.2.

Chapter 4 – Autofluorescence Bronchoscopy
58
The light penetration depth into tissue is given by d(λ)=1/μeff. Its values for wavelengths ranging between 400 nm and 470 nm are listed in Table 4.2. In addition, the light penetration depth into the epithelium and the subepithelial layers as a function of the wavelength is plotted in Figure 4.5. It can be see that the penetration depth in the epithelium exceeds the thickness of healthy epithelium (about 40 μm - 60 μm) and it is rather independent of the wavelength between 400 nm and 470 nm. However, the absorption in the submucosa is wavelength-dependent in this spectral range. It should be noted that the penetration depth is by a factor of about 4 (for shorter wavelengths) to 2 (for longer wavelengths) shorter in the submucosa than in the epithelium.
4.3 Autofluorescence Bronchoscopy Instrumentation Technically speaking, autofluorescence imaging is based on the detection and visualisation of the spectral and/or intensity differences between the normal and (pre-)neoplastic tissue AF signals. In agreement with the observations from the spectrofluorometric studies reported by Zellweger et al. [7, 9], most AFB systems excite the AF with blue-violet light and detect the AF image in two spectral domains.
Several endoscopic AF imaging systems have been developed [29] and are commercially available. Instruments from the following companies are currently on the market: the LIFE system by Xillix Technologies (Vancouver, BC, Canada), the SAFE system by Pentax (Tokyo, Japan), the D-Light system by Karl Storz GmbH (Tuttlingen, Germany) and the DAFE system by Richard Wolf GmbH (Knittlingen, Germany).
The Xillix LIFE system was the first AFB imaging system to be commercialised. Originally based on a Helium-Cadmium laser (442 nm) for the blue-violet excitation and a separate white light source for WLB, the current system employs a compact filtered Xenon lamp for both AF excitation and WLB. The tissue AF is separated into two spectral components that are intensified and imaged on a CCD. According to Lam et al. [30] the two spectral regions of one of the first prototypes were situated at 500 nm - 575 nm (green) and superior to 625 nm (red). In the current system, the AF images show lesions as reddish brown zones on a greenish background. The LIFE system has been widely used in clinical studies and shows high sensitivity [29] in the detection of moderate dysplasia and CIS.
The first SAFE system (SAFE-1000) also used a filtered Xenon (Xe) lamp for the AF excitation in the 420 nm - 480 nm region. In contrast to the Xillix system, the SAFE-1000 only detect the AF in the green spectral domain (490 nm - 590 nm) by an intensified CCD camera. While the healthy tissue background appeared light green, the lesions appeared as dark green zones in the images. Few studies with this system have been published [31-34]. One drawback of the single-channel detection is the relatively high number of false positives, due to anatomically related shadows and mucus as reported by [31] and [33]. However, the most recent SAFE-3000 system, presented at the World Congress for Bronchoscopy in Barcelona in 2004, is based on the CCD tipped videobronchoscope technique. Unfortunately, not much is publicly known about the spectral excitation and detection characteristics of this system. The AF excitation is performed with a 408 nm laser diode with an output power of 20-40 mW at the distal end of the bronchoscope [35]. The diode is integrated in the endoscopic WL source, which allows easy switching between AFB and WLB. A special feature of the SAFE-3000 system is the so called "twin-mode", in which the AF and the WL image are shown simultaneously on the same screen.
Similar to the Xillix LIFE system, the Storz D-Light system uses a filtered Xe lamp for both WL illumination and blue-violet AF excitation (380 nm - 460 nm). The WL and the AF
Chapter 4 – Autofluorescence Bronchoscopy
59
images are acquired with a 3-CCD endoscopic video camera. The particularity of this system is the superposition of blue-violet excitation light on top of the AF image. Indeed, the long pass filter transmits about 1% of the backscattered excitation light through [36]. The latter creates a "constant" background image for the changing autofluorescence, making the abnormal tissue appear purple against a greenish-blue background. Nothing is publicly known about the spectral domains of detection or electronic signal treatment. In addition to the AF and WL mode, the system can also be used in the “ALA mode”, which is optimised for the detection of 5-aminolaevulinic acid (ALA) (or its derivatives) induced protoporphyrin IX (PpIX). However, the lower light sensitivity of the endoscopic camera compared to an intensified CCD requires frame integration to achieve satisfactory image brightness. The sensitivity and specificity of the Storz D-Light system had been subject to an extensive multi-centre study published recently by Häussinger et al. [37]. The sensitivity of the D-Light system in combination with WLB for bronchial dysplasia and CIS was 82.3%, compared to 57.9% for WLB alone. The corresponding values for the specificity were 62.1% and 58.4%, respectively.
One of the first AFB systems spectrally optimised according to the empirical observations from spectrofluorometry was developed by our group in Lausanne, and later refined by the company Richard Wolf Endoskope GmbH in Knittlingen (Germany). A detailed description of the system can be found in the report by Goujon et al. [38]. The system is based on a filtered 300 W Xenon lamp that can be switched between conventional WL illumination and blue-violet AF excitation (390 nm - 460 nm) by a foot switch. The AF image is acquired with a single CCD. A green image (detection range 500 nm - 590 nm) and a red image (detection range 500 nm - 700 nm) of the bronchoscopic site are acquired simultaneously on the chip which is divided into two parts. The images are superposed and displayed in false colours on the monitor. The blue-violet excitation light is cut-off by a long pass filter. Conventional white light bronchoscopy can be performed with an additional standard colour camera clipped at an angle of 90° to the AF camera unit. A switchable mirror allows for easy changes between AF detection and white light bronchoscopy. Clinical studies performed with this system at the CHUV University Hospital in Lausanne have shown a high sensitivity of this system for bronchial pre-neoplasia and cancers, exceeding that of conventional white light bronchoscopy by a factor of 2.
Since the first clinical studies reported by Goujon et al., numerous clinical and pre-clinical studies have been conducted to further improve the spectral design and thus the specificity and sensitivity of the AFB system. The studies presented in Chapter 5 of this thesis have led to several modifications to the system’s spectral design, namely the addition of backscattered red and blue-violet light. The features of the modified Richard Wolf AFB system currently commercialised by the Richard Wolf Company will be presented in the same chapter.
Chapter 4 – Autofluorescence Bronchoscopy
60
4.4 References [1] T. G. Sutedja, H. Condrigton, E. K. Risse, R. H. Breuer, J. C. van Mourik, R. P. Golding and P. E. Postmus, "Autofluorescence bronchoscopy improves staging of radiographically occult lung cancer and has an impact on therapeutic strategy," Chest 120(4), 1327-1332 (2001)
[2] G. Wagnières, A. P. Studzinski and H. van den Bergh, "An endoscopic fluorescence imaging system for simultaneaous visual examination and photodetection of cancers," Rev. of Scientific Instruments 68(1), 203-212 (1997)
[3] A. E. Profio and D. R. Doiron, "A feasibility study of the use of fluorescence bronchoscopy for localization of small lung tumours," Phys Med Biol 22(5), 949-957 (1977)
[4] A. E. Profio, D. R. Doiron, O. J. Balchum and G. C. Huth, "Fluorescence bronchoscopy for localization of carcinoma in situ," Medical Physics 35-39 (1983)
[5] S. Lam, B. Palcic, D. McLean, J. Hung, M. Korbelik and A. E. Profio, "Detection of early lung cancer using low dose Photofrin II," Chest 97(2), 333-337 (1990)
[6] B. Palcic, S. Lam, J. Hung and C. MacAulay, "Detection and localization of early lung cancer by imaging techniques," Chest 99(742-743 (1991)
[7] M. Zellweger, D. Goujon, R. Conde, M. Forrer, H. van den Bergh and G. Wagnières, "Absolute autofluorescence spectra of human healthy, metaplastic, and early cancerous bronchial tissue in vivo," Applied Optics 40(22), 3784-3791 (2001)
[8] J. Hung, S. Lam, J. LeRiche and B. Palcic, "Autofluorescence of normal and malignant bronchial tissue," Lasers in Surgery and Medicine 11(2), 99-105 (1991)
[9] M. Zellweger, P. Grosjean, D. Goujon, P. Monnier, H. van den Bergh and G. Wagnières, "In vivo autofluorescence spectroscopy of human bronchial tissue to optimize the detection and imaging of early cancers," J Biomed Optics 6(1), 41-51 (2001)
[10] M. Tercelj, H. Zeng, M. Petek, T. Rott and B. Palcic, "Acquisition of fluorescence and reflectance spectra during routine bronchoscopy examinations using the ClearVu Elite(TM) device: Pilot study," Lung Cancer 50(1), 35-42 (2005)
[11] R. Richards-Kortum and E. Sevick-Muraca, "Quantitative optical spectroscopy for tissue diagnosis," Annual Review of Physical Chemistry 47(1), 555-606 (1996)
[12] O. Wolfbeis, "Fluorescence of organic natural products," in Molecular Luminiscence Spectroscopy, S. G. Schulmann, pp. 167-370, John Wiley and Sons, New York (1993).
[13] J. Qu, C. MacAulay, S. Lam and B. Palcic, "Laser-induced fluorescence spectroscopy at endoscopy: tissue optics, Monte Carlo modeling and in vivo measurements," Optical Engineering 34(11), 3334-3343 (1995)
[14] J. Qu, C. MacAulay, S. Lam and B. Palcic, "Optical properties of normal and carcinomatous bronchial tissue," Applied Optics 33(31), 7397-7405 (1994)
[15] M. Kobayashi, K. Shibuya, H. Hoshino and T. Fujisawa, "Spectroscopic analysis of the autofluorescence from human bronchus using an ultraviolet laser diode," J Biomed Opt 7(4), 603-608 (2002)
[16] P. Uehlinger, T. M. Glanzmann, J.-P. Ballini, A. Radu, T. Gabrecht, P. Monnier, H. van den Bergh and G. Wagnieres, "Time-resolved autofluorescence spectroscopy of the bronchial mucosa for the detection of early cancer: clinical results," submitted (2005)
[17] A. Fisseler-Eckhoff, Stromareaktionen in bronchialen Präneoplasien und Lungentumoren, Springer-Verlag GmbH (1998).

Chapter 4 – Autofluorescence Bronchoscopy
61
[18] O. S. Wolfbeis and M. Leiner, "Mapping of the total fluorescence of human blood serum as a new method for its characterization," Analytica Chimica Acta 167(203-215 (1985)
[19] J. D. Pitts, Sloboda R.D., Dragnev K.H., Dmitrovsky E., Mycek M.A., "Autofluorescence characteristics of immortalized and carcinogen-transformed human bronchial epithelial cells," J Biomed Opt 6(1), 31-40 (2001)
[20] R. Drezek, I. Pavlova, R. Richards-Kortum, C. Brookner, I. Boiko, M. Follen, A. Malpica and R. Lotan, "Autofluorescence microscopy of fresh cervical-tissue sections reveals alterations in tissue biochemistry with dysplasia," Photochemistry and Photobiology 73(6), 636-641 (2001)
[21] R. Drezek, K. Sokolov, U. Utzinger, I. Boiko, A. Malpica, M. Follen and R. Richards-Kortum, "Understanding the contributions of NADH and collagen to cervical tissue fluorescence spectra: Modeling, measurements, and implications," Journal of Biomedical Optics 6(4), 385-396 (2001)
[22] S. Prahl, "Optical absorption of hemoglobin," http://omlc.ogi.edu/spectra/hemoglobin/, accessed on 24.03.2006
[23] A. Fisseler-Eckhoff, D. Rothstein and K. M. Müller, "Neovascularization in hyperplastic, metaplastic and potentially preneoplastic lesions of the bronchial mucosa," Virchows Arch 429(2-3), 95-100 (1996)
[24] G. Fontanini, A. Calcinai, L. Boldrini, M. Lucchi, M. Mussi, C. A. Angeletti, C. Cagno, M. A. Tognetti and F. Basolo, "Modulation of neoangiogenesis in bronchial preneoplastic lesions," Oncol Rep 6(4), 813-817 (1999)
[25] R. L. Keith, Y. E. Miller, R. M. Gemmill, H. A. Drabkin, E. C. Dempsey, T. C. Kennesy, S. Prindiville and W. A. Franklin, "Angiogenic squamous dysplasia in bronchi of individuals at high risk for lung cancer," Clinical Cancer Research 6(5), 1616-1625 (2000)
[26] K. Shibuya, H. Hoshino, M. Chiyo, A. Iyoda, S. Yoshida, Y. Sekine, T. Iizasa, Y. Saitoh, M. Baba, K. Hiroshima, H. Ohwada and T. Fujisawa, "High magnification bronchovideoscpy combined with narrow band imaging could detect capillary looops of angiogenic squamous dysplasia in heavy smokers at high risk for lung cancer," Thorax 58(11), 989-995 (2003)
[27] K. Shibuya, H. Hoshino, M. Chiyo, K. Yasufuku, T. Iizasa, Y. Saitoh, M. Baba, K. Hiroshima, H. Ohwada and T. Fujisawa, "Subepithelial vascular patterns in bronchial dysplasias using a high magnification bronchovideoscope.," Thorax 57(10), 902-907 (2002)
[28] G. Fontanini, S. Vignati, L. Boldrini, S. Chiné, V. Silvestri, G. Bevilacqua, M. Lucchi, A. Mussi and C. A. Angeletti, "Vascular endothelial growth factor is associated with neovascularization and influences progression of non-small cell lung carcinoma," Clinical Cancer Research 3(6), 861-865 (1997)
[29] G. Wagnières, A. McWilliams and S. Lam, "Lung cancer imaging with fluorescence endoscopy," in Handbook of Biomedical Fluorescence, M.-A. Myceck and B. W. Pogue, pp. 361-396, Marcel Dekker, Inc. (2003).
[30] S. Lam, C. MacAulay, J. Hung, J. LeRiche, A. E. Profio and B. Palcic, "Detection of dysplasia and carcinoma in situ with a lung imaging fluorescence endoscope device," Journal of Thoracic and Cardiovascular Surgery 105(6), 1035-1040 (1993)
[31] T. Horvath, M. Horvathova, F. Salajka, B. Habanec, L. Foretova, J. Kana, H. Koukalova, P. Pafko, F. Wurst, E. Novotna, J. Pecina, V. Vagunda, R. Vrbacky, R. Talac, H. Coupkova and Z. Pacovsky, "Detection of bronchial neoplasia in uranium miners by autofluorescence endoscopy (SAFE-1000)," Diagnostic and Therapeutic Endoscopy 5(2), 91-98 (1999)
[32] R. Adachi, T. Utsui and K. Furusawa, "Development of the autofluorescence endoscope imaging system," Diagnostic and Therapeutic Endoscopy 5(3), 65-70 (1999)
[33] M. Kakihana, K. Kyong Il., T. Okunaka, K. Furukawa, T. Hirano, C. Konaka, H. Kato and Y. Ebihara, "Early detection of bronchial lesions using system of autofluorescence endoscopy (SAFE) 1000," Diagnostic and Therapeutic Endoscopy 5(2), 99-104 (1999)

Chapter 4 – Autofluorescence Bronchoscopy
62
[34] P. Pierard, B. Martin, J.-M. Verdebout, J. Faber, M. Richez, J.-P. Sculier and V. Ninane, "Fluorescence bronchoscopy in high-risk patients - A comparison of LIFE and Pentay systems," J Bronchology 8(4), 254-259 (2001)
[35] Pentax Europe GmbH, "PENTAX SAFE-3000– erstes Autofluoreszenz Video-Bronchoskopie System," http://www.pentax.nl/4medical/nieuws/productnieuws/pdfs/barcelona_fin2.pdf, accessed on 22.03.2006
[36] M. Leonhard, "New incoherent autofluorescence/fluorescence system for early detection of lung cancer," Diagnostic and Therapeutic Endoscopy 5(2), 71-75 (1999)
[37] K. Häußinger, F. Stanzel, M. Kohlhäufl, H. Becker, F. Herth, A. Kreuzer, B. Schmidt, J. Strausz, S. Cavaliere, K.-M. Müller, R.-M. Huber, U. Pichlmeier and C. T. Bolliger, "Autofluorescence bronchoscopy with white light bronchoscopy compared with white light bronchoscopy alone for the detection of precancerous lesions: A European randomised controlled multicentre trial," Thorax 60(6), 496-503 (2005)
[38] D. Goujon, M. Zellweger, A. Radu, G. P., B.-C. Weber, H. van den Bergh, P. Monnier and G. Wagnières, "In vivo autofluorescence imaging of early cancers in the human tracheobronchial tree with a spectrally optimized system," J Biomed Optics 8(1), 17-25 (2003)
63
Chapter 5 Comprehensive and
Optimisation Studies of the
Autofluorescence Bronchoscopy
utofluorescence bronchoscopy (AFB) has been used in clinical examinations for about one decade. Several clinical studies have proven this technique to be a powerful tool for the detection of bronchial (pre-)neoplasia. As mentioned in the Chapter 4.3,
the clinical study with the spectrally optimised Richard Wolf AFB prototype system has shown that the sensitivity of AFB is about twice as high as that obtained using conventional white light (WL) bronchoscopy [1]. Though the specificity was not assessed in this study, the number of false positive results was high. Similar conclusions have also been reported from clinical studies with other AFB systems [2]. Table 5.1 summarises sensitivity and sensibility
A

Chapter 5.1 – Optimised autofluorescence bronchoscopy using additional backscattered red light
64
data reported in the literature for various clinical studies conducted with different AFB systems. In all studies, the sensitivity of AFB widely exceeds that of WL bronchoscopy, whereas the specificity remains limited and frequently far below that of white light bronchoscopy. Indeed, the high number of false positive results is a major shortcoming of current AFB systems. The majority of the false positive findings are due to tissue reactive changes, inflammation and bruised or bleeding mucosa. They generally result in unnecessary biopsies, a longer bronchoscopy procedure, and increased medical costs. However, it should borne in mind that the specificity, the sensitivity and the NPV of AFB are very difficult to determine, since they would require random biopsies in the whole tracheo-bronchial tree on negative appearing sites (see Chapter 2.2). Sometimes study reports misleadingly refer to the PPV value of a method as its sensitivity. This makes it difficult to compare sensitivity, specificity, and NPV values from different studies.
Only few studies aiming to improve the sensitivity and specificity of AF imaging have been published up to now. Additional techniques can be combined with imaging to improve AFB performance. Intra-endoscopic optical spectroscopy has been reported recently by Bard et al. [3], Kusunoki et al. [4], Zeng et al. [5] and Tercelj et al. [6]. Bard’s and Kusunoki’s groups measured the autofluorescence and reflectance spectra during AFB. For this purpose, Bard et al. and Kusunoki et al. used a fibre-bundle inserted into the biopsy channel of the bronchofibroscope and put it in smooth contact with the mucosa. However, this procedure can bruise the mucosa and provoke bleeding. In contrast to this, Zeng et al. and Tercelj et al. used a non-contact measurement system based on a modified Xillix’s LIFE system with an integrated spectrometer unit. The AF and reflectance spectra were acquired from selected spots on the endoscopic sites. However, these techniques require additional equipment and prolong the bronchoscopic procedure [6]. They are still far from routine application and integration in commercial systems.
A different approach to improve the specificity of AFB was presented by Goujon et al. [1] and Kusunoki et al. [4]. These groups employed off-line spectral image analysis and threshold algorithms to classify true and false positive results but, with limited success. Mathematical algorithms (multicomponent analysis, ratioing, etc.) to improve specificity have also been used in other fields of diagnostic AF spectroscopy and imaging, such as cervical intra-epithelial neoplasia (CIN) [7, 8] or carcinoma of the ENT sphere [9-11].
In this thesis we aimed to improve the AFB sensitivity and specificity by optimising the spectral excitation and detection conditions of the imaging system. This approach was based on three statements: (1) The spectral AF contrast between healthy tissue and lesions results from a high intensity decrease in the green part of the AF spectrum and a much lower decrease in the red part of the AF spectrum. Consequently, the addition of red backscattered light as a background instead of the red AF may improve the spectral contrast and thus the sensitivity. (2) The intensity and spectral contrast are highest with a 405 nm excitation wavelength. Thus, the use of a narrow band excitation around 405 nm instead of a broadband excitation may improve the spectral and intensity contrast and therefore the sensitivity. (3) Bronchial lesions show distinct patterns of subepithelial angiogenesis (thus blood concentration and distribution) that are specific for each histopathologic class. Since the blue-violet AFB excitation light is strongly absorbed by blood, the detection of blue backscattered light may take advantage of the histopathology specific absorption characteristics, and improve the specificity.
However, optimisation of AFB systems requires a fundamental understanding and knowledge of the mechanisms responsible for the spectral and intensity AF contrasts between healthy and (pre-) neoplastic bronchial tissue. Except from the aforementioned studies of Qu [12, 13],

Chapter 5 – Conprehensive and Optimisation Studies of the Autofluorescence Bronchoscopy
65
Zellweger [14, 15] and Hung [16], minimal research has been performed on this subject [17, 18].
The following chapters present the results of the clinical and laboratory studies conducted within the framework of this thesis, as we investigate the mechanisms of the AF contrast to improve the sensitivity and specificity of AFB imaging. The reports of most of these studies have been published or submitted for publication. They are presented here as self-contained chapters and are briefly summarised in the following section. Additional information and results are presented in the appendices.
Chapter 5.1 – Optimised AF bronchoscopy using additional backscattered red light The first clinical study presented here investigated the use of backscattered red light to improve the colour contrast between lesions and healthy tissues, and thus the quality of detection. The lesion-to-healthy colour contrast is defined as the ratio between the intensity levels in the green and the red channels on a lesion divided by the corresponding ratio on the healthy tissue. In other words, the colour contrast “C” is given by C= (R/G)lesion/(R/G)healthy. During AF bronchoscopy, a sharp decrease is observed in the green channel intensity on lesions relative to healthy tissues, whereas this decrease is less marked in the red channel. From their spectrofluorometric measurements, Zellweger et al. [Zellweger, ApplOptics] concluded that additional red light could improve the colour contrast in AFB. Indeed, red light added to the blue-violet excitation light creates a constant background in the image which allows the clinician to take full advantage of the decrease in the green channel.
The main goal of the present study was to confirm these observations with a fluorescence imaging system.This study was conducted at the Centre for Pneumology and Thoracic Surgery, Lungenklinik, Hemer, Germany. An AFB system prototype was specially designed for this study by Richard Wolf Endoskope GmbH, Knittlingen, Germany. This chapter is an article submitted for publication in the Journal of Biomedical Optics.
Chapter 5.2 – The Richard Wolf’s DAFE system The results of the study presented in Chapter 5.1 led the Richard Wolf Company to design a second generation AFB system named DAFE (Diagnostic AutoFluorescence Endoscopy). This system makes use of red backscattered light. The characteristics of this system are described in this chapter.
Chapter 5.3 – Influence of the excitation wavelength bandwidth on the healthy-to-lesion contrast in AFB As in the study presented in Chapter 5.1, the clinical study presented here aimed to optimise the excitation light of AFB. According to the results from Zellweger et al. [15], the highest spectral contrast between healthy bronchial tissues and lesions is obtained using violet light at 405nm for excitation. In a clinical imaging study, we compared the colour contrast obtained with a line-shaped excitation centred at 405nm and the broadband excitation of the DAFE system (430 nm, FWHM 40 nm). This approach provides information on the origin of the AF contrast. Preliminary results of this study were published in the SPIE Proceeding 5862 [19]. It has been rewritten and is presented as a single chapter.
Chapter 5.4 - Blue-violet excited autofluorescence spectroscopy and imaging of normal and cancerous human bronchial tissue after formalin fixation This chapter presents a spectrofluorometric ex vivo study focussed on the understanding of the origins of the bronchial AF contrast. Since it would be ideal to have the possibility to perform spectrofluorometric measurements on human bronchial tissue samples fixed in formalin to

Chapter 5.1 – Optimised autofluorescence bronchoscopy using additional backscattered red light
66
reduce the ethical and technical limitations generally associated with clinical measurements we assessed the AF changes observed between the in vivo and ex vivo conditions
Spectrofluorometric ex vivo studies of bronchial tissue AF have already been reported by Qu et al. [13]. This study measured fresh or frozen tissue samples. Results reported in this study showed some contradictions to those obtained in other clinical studies [14, 15]. Therefore, the present study aimed to improve our understanding of the AF contrast mechanisms, and thus explain the differences observed between in vivo and ex vivo measurements.
The fibre-based spectrofluorometer used in this study is described in detail in the second part of this thesis. This chapter corresponds to an article submitted for publication by Photochemistry and Photobiology.
Chapter 5.5 - Improvement of the specificity of cancer detection by autoflorescence imaging in the tracheo-bronchial tree using backscattered violet light According to the results of the fundamental studies presented in chapter 5.3 and 5.4, tissue blood is very likely to play a key role in the AF contrast. The clinical imaging study presented in this chapter investigated the use of backscattered blue light to improve the specificity of AFB. As already mentioned in Chapter 4, tissue vascularisation is different for healthy tissue, inflammation, reactive changes, and (pre-)neoplasia. Hence, the absorption of blue-violet light will be different on inflammation and reactive changes compared to (pre-)neoplastic lesions. This study had two aims: 1) to investigate the potential of different blue-violet wavelengths to improve the differentiation between true positive (pre-) neoplastic lesions and false positive findings (inflammation and reactive changes), and 2) to implement the results in the DAFE system. These studies were performed using a linear variable band pass and high pass filter, respectively. The characteristics of the two filters and a custom-made filter holder are presented in the Appendix. The results from this study provide further information on the role of tissue blood in the AF contrast mechanism. The report on both studies was submitted to the Journal of Biomedical Optics.
Chapter 5.6 - Design of an endoscopic optical reference to be used for autofluorescence bronchoscopy with the DAFE system and Chapter 5.7 - Autofluorescence bronchoscopy: Quantification of inter-patient tissue remitted light intensity variations The final two chapters present two studies aiming to quantify the intra- and inter-patient variations in the AF intensities and spectroscopy. Zellweger et al. [14] demonstrated in the above mentioned spectrofluorometric study that the intra-patient variations were significantly smaller than the inter-patient variations.
These variations can negatively affect the image quality of AFB and the learning curve of the clinician. Moreover, the magnitude of theses variations will scale the dynamic range of future AFB systems accordingly. The quantification of the AF intensities with the DAFE imaging system is not trivial. As the DAFE imaging system deals with real time automatic control algorithms (see chapter 5.2.), quantification of the tissue AF requires the use of an optical standard (reference) allowing normalisation of the intensity levels. Such a reference should be used in the patient's bronchi during bronchoscopy. To allow normalisation, the reference must appear close to the bronchial tissue in the AFB image.
In Chapter 5.6, the design and characterisation of a reference for AFB is presented. Chapter 5.7 presents an initial clinical study aiming to quantify the inter-patient variations during AFB is reported. Both studies were submitted for publication and are presented in this form.

Chapter 5 – Conprehensive and Optimisation Studies of the Autofluorescence Bronchoscopy
67
NP
V
0.89
*
75.7
- 8
0.6#
96 -
84
97*
92 -
95$
84
PP
V
0.33
*
16 -
24.
8#
13 -
50
23*
25 -
47$
65.3
67
75 (
100*
)
a) d
yspl
asia
b) in
vasi
ve c
arci
nom
a
Spe
cific
ity
56.3
- 5
7.3#
21 -
26
60*
81.8
9
88.6
57 -
71$
31.5
38.2
*
69.6
84
58.4
*
23
80 (
75 -
88)
Rel
ativ
e S
ensi
tivity
2.71
3.75
*
2.6
3.1
1.8
1.33
**
Sen
sitiv
ity
67*
38.1
- 4
3.3#
93*
85*
78.9
5
83.7
71 -
88$
91.1
*
94.1
*
68.8
50a)
- 9
7b)
82.3
*
96
40 (
27 -
51)
** c
ompa
red
with
vid
eobr
onch
osco
pe
$ res
umé
of 3
clin
ical
stu
dies
Num
ber
of
Pat
ient
s
173
39
34
34
56
244
65
(500
)$
64
50
55
30
20
1173
151
Sys
tem
LIF
E
LIF
E
LIF
E
LIF
E
SA
FE
-100
0
LIF
E
LIF
E
LIF
E
LIF
E
LIF
E
LIF
E
LIF
E
Wol
f Pro
toty
pe
D-L
ight
LIF
E
Ref
eren
ce
[20]
[21]
[22]
[23]
[24]
[25]
[4]
[26]
[27]
[28]
[29]
[30]
[1]
[31]
[32]
[26]
Yea
r
1998
1998
1999
1999
1999
2000
2000
2000
2001
2001
2001
2003
2003
2005
2005
2000
* c
ombi
ned
with
whi
te li
ght b
ronc
hosc
opy
# tw
o in
depe
nden
t his
topa
thol
ogis
ts
Aut
hor
Lam
Kur
ie
Ver
myl
en
Ven
man
s
Hor
vath
Nak
host
een
Kus
unok
i
Lam
Shi
buya
Sat
o
Hirs
ch
Iked
a
Gou
jon
Häu
ssin
ger
Chh
ajad
Lam
AF
B
WL
Table 5.1 Synoptic table showing the sensitivity and specificity values of AFB from clinical studies with different imaging systems
Chapter 5.1 – Optimised autofluorescence bronchoscopy using additional backscattered red light
68
References [1] D. Goujon, M. Zellweger, A. Radu, G. P., B.-C. Weber, H. van den Bergh, P. Monnier and G. Wagnières, "In vivo autofluorescence imaging of early cancers in the human tracheobronchial tree with a spectrally optimized system," J Biomed Optics 8(1), 17-25 (2003)
[2] G. Wagnières, A. McWilliams and S. Lam, "Lung cancer imaging with fluorescence endoscopy," in Handbook of Biomedical Fluorescence, M.-A. Myceck and B. W. Pogue, pp. 361-396, Marcel Dekker, Inc. (2003).
[3] M. R. L. Bard, A. Amelink, M. Skurichina, M. den Bakker, S. A. Burgers, J. P. van Meerbeck, R. P. W. Duin, J. G. J. V. Aerts, H. C. Hoogsteden and H. J. C. M. Sterenborg, "Improving the specificity of fluorescence bronchoscopy for the analysis of neoplastic lesions of the bornchial tree by comvination with optical spectroscopy: preliminary communication," Lung Cancer 47(1), 41-47 (2005)
[4] Y. Kusunoki, F. Imamura, H. Uda, M. Mano and T. Horai, "Early detection of lung cancer with laser-induced fluorescence endoscopy and spectrofluorometry," Chest 118(6), 1776-1782 (2000)
[5] H. Zeng, M. Petek, M. T. Zorman, A. McWilliams, B. Palcic and S. Lam, "Integrated endoscopy system for simultaneous imaging and spectroscopy for early lung cancer detection," Opt Lett 29(6), 587-589 (2004)
[6] M. Tercelj, H. Zeng, M. Petek, T. Rott and B. Palcic, "Acquisition of fluorescence and reflectance spectra during routine bronchoscopy examinations using the ClearVu Elite(TM) device: Pilot study," Lung Cancer 50(1), 35-42 (2005)
[7] N. Ramanujam, M. F. Mitchell, A. Mahadevan, S. Thomsen, A. Malpica, T. Wright, N. Atkinson and R. Richards-Kortum, "Development of a multivariate statistical algorithm to analyze human cervical tissue fluorescence spectra acquired in vivo," Lasers in Surgery and Medicine 19(1), 46-62 (1996)
[8] J. M. Benavides, S. Chang, S. Y. Park, R. Richards-Kortum, N. Mackinnon, C. MacAulay, A. Milbourne, A. Malpica and M. Follen, "Multispectral digital colposcopy for in vivo detection of cervical cancer," Optics Express 11(10), 1223-1236 (2003)
[9] J. Qu, H. Chang and S. Xiong, "Light induced fluorescence imaging of tissue using the multivariate statistical analysis," Spie's BIOS 2002, Technical summary digest 79 (2002)
[10] J. Y. Qu, P. Wing, Z. Huang, D. Kwong, J. Sham, S. L. Lee, W. K. Ho and W. I. Wei, "Preliminary study of in vivo autofluorescence of nasopharyngeal carcinoma and normal tissue," Lasers Surg Med 26(5), 432-440 (2000)
[11] W. Lin, X. Yuan, P. Yuen, W. I. Wei, J. Sham, P. Shi and J. Qu, "Classification of in vivo autofluorescence spectra using support vector machines," J Biomed Opt 9(1), 180-186 (2004)
[12] J. Qu, C. MacAulay, S. Lam and B. Palcic, "Laser-induced fluorescence spectroscopy at endoscopy: tissue optics, Monte Carlo modeling and in vivo measurements," Optical Engineering 34(11), 3334-3343 (1995)
[13] J. Qu, C. MacAulay, S. Lam and B. Palcic, "Optical properties of normal and carcinomatous bronchial tissue," Applied Optics 33(31), 7397-7405 (1994)
[14] M. Zellweger, D. Goujon, R. Conde, M. Forrer, H. van den Bergh and G. Wagnières, "Absolute autofluorescence spectra of human healthy, metaplastic, and early cancerous bronchial tissue in vivo," Applied Optics 40(22), 3784-3791 (2001)
[15] M. Zellweger, P. Grosjean, D. Goujon, P. Monnier, H. van den Bergh and G. Wagnières, "In vivo autofluorescence spectroscopy of human bronchial tissue to optimize the detection and imaging of early cancers," J Biomed Optics 6(1), 41-51 (2001)
[16] J. Hung, S. Lam, J. LeRiche and B. Palcic, "Autofluorescence of normal and malignant bronchial tissue," Lasers in Surgery and Medicine 11(2), 99-105 (1991)

Chapter 5 – Conprehensive and Optimisation Studies of the Autofluorescence Bronchoscopy
69
[17] M. Kobayashi, K. Shibuya, H. Hoshino and T. Fujisawa, "Spectroscopic analysis of the autofluorescence from human bronchus using an ultraviolet laser diode," J Biomed Opt 7(4), 603-608 (2002)
[18] P. Uehlinger, T. M. Glanzmann, J.-P. Ballini, A. Radu, T. Gabrecht, P. Monnier, H. van den Bergh and G. Wagnieres, "Time-resolved autofluorescence spectroscopy of the bronchial mucosa for the detection of early cancer: clinical results," submitted (2005)
[19] T. Gabrecht, P. Uehlinger, S. Andrejevic-Blant, P. Grosjean, A. Radu, P. Monnier, B. Weber, H. van den Bergh and G. Wagnières, "Influence of the excitation wavelength on the tumor-to-healthy contrast in autofluorescence bronchoscopy - A comprehensive study," Proc. SPIE 5862(31-36 (2005)
[20] S. Lam, T. Kennedy and M. Unger, "Localization of bronchial intraepitheloial neoplastic lesions by fluorescence bronchoscopy," Chest 113(3), 696-702 (1998)
[21] J. M. Kurie, J. S. Lee, R. C. Morice, L. W. Garrett, F. R. Khuri, A. Broxson, Y. R. Jae, A. F. Wilbur, Y. Ren and K. W. Hong, "Autofluorescence bronchoscopy in the detection of squamous metaplasia and dysplasia in current and former smokers," J Natl Cancer Inst 90(13), 991-995 (1998)
[22] P. Vermylen, P. Pierard, C. Roufosse, T. Bosschaerts, A. Verhest, J. P. Sculier and V. Ninane, "Detection of bronchial preneoplastic lesions and early lung cancer with fluorescence bronchoscopy: a study about its ambulatory feasibility under local anaesthesis," Lung Cancer 25(3), 161-168 (1999)
[23] B. J. W. Venmans, T. J. M. van Boxem, E. T. F. Smit, P. E. Postmus and T. G. Sutedja, "Results of two years experience with fluorescence bronchoscopy in detection of preinvasive bronchial neoplasia," Diagnostic and Therapeutic Endoscopy 5(77-84 (1999)
[24] T. Horvath, M. Horvathova, F. Salajka, B. Habanec, L. Foretova, J. Kana, H. Koukalova, P. Pafko, F. Wurst, E. Novotna, J. Pecina, V. Vagunda, R. Vrbacky, R. Talac, H. Coupkova and Z. Pacovsky, "Detection of bronchial neoplasia in uranium miners by autofluorescence endoscopy (SAFE-1000)," Diagnostic and Therapeutic Endoscopy 5(2), 91-98 (1999)
[25] J. A. Nakhosteen and B. Khanavkar, "Autofluorescence bronchoscopy: the laser imaging fluorescence endoscope," in Interventional Bronchoscopy, M. P. N. Bolliger C.T., pp. 236-242, Karger, Basel (2000).
[26] S. Lam, C. MacAulay, J. C. leRiche and B. Palcic, "Detection and localization of early lung cancer by fluorescence bronchoscopy," Cancer Suppl. 89(11), 2468-2473 (2000)
[27] K. Shibuya, T. Fujisawa, H. Hoshino, M. Baba, Y. Saitoh, T. Iizasa, M. Suzuki, M. Osuji, K. Hiroshima and H. Ohwada, "Fluorescence bronchoscopy in the detection of preinvasive bronchial lesions in patients with sputum cytology suspicious or positive for malignancy," Lung Cancer 32(19-25 (2001)
[28] M. Sato, A. Sakurada, M. Sagawa, M. Minowa, H. Takahashi, T. Oyaizu, Y. Okada, Y. Matsumura, T. Tanita and T. Kondo, "Diagnostic results before and after introduction of autofluorescence bronchoscopy in patients suspected of having lung cancer detected by sputum cytology in lung cancer mass screening," Lung Cancer 32(247-253 (2001)
[29] F. R. Hirsch, S. A. Prindiville, Y. E. Miller, W. A. Franklin, E. C. Dempsey, J. R. Murphy, P. A. Bunn Jr and T. C. Kennedy, "Fluorescence versus white-light bronchoscopy for detection of preneoplasic lesions: a randomized study," J Natl Cancer Inst 93(18), 1385-1391 (2001)
[30] N. Ikeda, T. Hiyoshi, M. Kakihana, H. Honda, Y. Kato, T. Okunaka, K. Furukawa, T. Tsuchida, H. Kato and Y. Ebihara, "Histopathological evaluation of fluorescence bronchoscopy using resected lungs in cases of lung cancer," Lung Cancer 41(3), 303-309 (2003)
[31] K. Häußinger, F. Stanzel, M. Kohlhäufl, H. Becker, F. Herth, A. Kreuzer, B. Schmidt, J. Strausz, S. Cavaliere, K.-M. Müller, R.-M. Huber, U. Pichlmeier and C. T. Bolliger, "Autofluorescence bronchoscopy with white light bronchoscopy compared with white light bronchoscopy alone for the detection of precancerous lesions: A European randomised controlled multicentre trial," Thorax 60(6), 496-503 (2005)

Chapter 5.1 – Optimised autofluorescence bronchoscopy using additional backscattered red light
70
[32] P. N. Chhajed, K. Shibuya, H. Hoshino, M. Chiyo, K. Yasufuku, K. Hiroshima and T. Fujisawa, "A comparison of video and autofluorescence bronchoscopy in patients at high risk of lung cancer," European Respiratory Journal 25(6), 951-955 (2005)

71
5.1 Optimised autofluorescence bronchoscopy using additional backscattered red light
Tanja Gabrecht1, Thomas Glanzmann1, Lutz Freitag2, Bernd-Claus Weber3, Hubert van den Bergh1, Georges Wagnières1* 1 Swiss Federal Institute of Technology (EPFL), Laboratory for Air and Soil Pollution, 1015 Lausanne, Switzerland 2 Clinic for Pneumology and Thoracic Surgery Hemer, Pneumology Department, 58675 Hemer, Germany 3 Richard Wolf Endoscopes GmbH, 75438 Knittlingen, Germany
Abstract Autofluorescence bronchoscopy has been shown to be a highly sensitive tool for the detection of early endobronchial cancers. When excited with blue-violet light, early neoplasia in the bronchi tend to show a decrease of autofluorescence in the green region of the spectrum and a relatively smaller decrease in the red region of the spectrum. Superposing the green foreground image and the red background image creates the resultant autofluorescence image. The aim of this study was to investigate if the addition of backscattered red light to the tissue autofluorescence signal could improve the contrast between healthy and diseased tissue. We have performed a clinical study involving forty-one lung cancers using modified autofluorescence bronchoscopy systems. The lesions were examined sequentially with conventional violet autofluorescence excitation (430 nm ± 30 nm) and violet autofluorescence excitation plus backscattered red light (430 nm ± 40 nm plus 665 nm ± 15 nm). The contrast between neoplastic and healthy tissue was quantified with off-line image analysis. We observed a 2.7 times higher contrast when backscattered red light was added to the violet excitation. In addition, the image quality was improved in terms of the signal to noise ratio with this spectral design.
Keywords Autofluorescence bronchoscopy; backscattered red light; sensitivity Submitted to Journal of Biomedical Optics

Chapter 5.1 – Optimised autofluorescence bronchoscopy using additional backscattered red light
72
Introduction Carcinoma of the bronchi is the most common cancer and cause of cancer deaths in the world, with the highest incidence rates occurring in North America and Europe [1-3]. Bronchial cancer has a poor prognosis, mainly due to its progressive nature and because most cancers are detected at an advanced stage [4]. Prognosis is much more favourable if the cancer is detected and treated early, if possible at the in situ stage [4-6]. Bronchoscopy is the only established method that allows detection, localization and definitive histological diagnosis of endobronchial lesions. Although the resolution of bronchoscopy is superior to that of chest radiography (CRX) and computed tomography (CT), conventional white light bronchoscopy (WLB) has important diagnostic limitations for detecting early cancerous and pre-cancerous lesions. Sato et al. [7] have shown that for radiographically occult bronchial cancers in patients with positive sputum cytology, only about 30% of the lesions can be localized, with difficulty, by conventional bronchoscopy. It should be noted that the percentage of lesions missed during WLB is probably much larger since numerous radiographically occult lesions were not detected during this study. This important clinical problem is central to the extensive research efforts performed by numerous groups to develop patient screening and cancer detection methods [8, 9]. One promising approach to detect bronchial pre-cancerous and early cancerous lesions during bronchoscopy is based on the imaging of the tissue autofluorescence [8, 10]. While conventional white light bronchoscopy (WLB) is based on the detection of minimal alterations in tissue surface structure, autofluorescence bronchoscopy (AFB) exploits the spectral and intensity contrast of the tissue autofluorescence existing between normal and pre-/early cancerous tissues.
AFB works by capitalizing on the decrease in tissue autofluorescence intensity within the green spectral region for pre- and early cancerous lesions as compared to healthy tissue under violet excitation [8, 11, 12]. This decrease can be visualized by specific endoscopic imaging devices [13]. In most cases, due to the three dimensional geometry of the bronchi, a second background image is obtained in the red part of the spectrum, to perform a contrast enhancement procedure between the contrast bearing green and the non-contrast bearing red images. Several endoscopic fluorescence imaging systems (Xillix LIFE system [14], Pentax SAFE system [15], Storz D-Light system [16]) are based on this principle. Numerous clinical studies have demonstrated that AFB used in addition to conventional WLB significantly increases the number of detected lesions [8, 10, 14, 17, 18] increasing the sensitivity by a factor 2. However, the higher sensitivity comes with a limited specificity [8, 19]. Moreover, it should be noted that most of the AFB systems are likely to be suboptimal since their spectral designs are not based on the results of comprehensive studies of specific tissue autofluorescence properties. One exception is the system developed and produced by Richard Wolf GmbH. This system emerged from a systematic and comprehensive clinical study of the autofluorescence spectroscopy of normal tissues, precancerous and early cancerous lesions of the mucous membrane lining the tracheo-bronchial tree [11, 20]. The group in Lausanne demonstrated that the highest contrasts between healthy and (pre-)neoplastic tissues are observed with excitation wavelengths around 405 nm. In addition, they observed that, at this excitation wavelength, a strong decrease of fluorescence intensity exists for these lesions in the green (below 590 nm) region of the spectrum, whereas this decrease is much smaller, but still present in the red part of the spectrum (beyond 590 nm). Typical spectra from healthy and dysplastic bronchial mucosa excited at 405

Chapter 5.1 – Optimised autofluorescence bronchoscopy using additional backscattered red light
73
nm are shown in Figure 5.1.1. Since a small decrease is also observed in the red part of the AF spectrum, this group suggested a possible method to improve the performances of fluorescence bronchoscopy; use additional red backscattered light as a background instead of the red autofluorescence. According to Zellweger et al. [11], using an optimised amount of red backscattered light should increase the contrast between healthy and pre-/early neoplastic tissue by a factor 2. Moreover the background image created by the backscattered red light enhances the brightness and consequently the quality of the endoscopic images. Finally, the choice of backscattered red light appears to be a sensible spectral choice as it is minimally influenced by changes of tissue properties, textures and structures. It should be noted that a similar approach using backscattered red and near-infrared light was reported by Zeng [21] for autofluorescence imaging in the gastrointestinal tract.
Figure 5.1.1 Autofluorescence spectra from normal (circles) bronchial tissue and dysplasia/ CIS (triangles) (adapted from[11]) These spectra were obtained using an excitation of 405 nm, FWHM= 10 nm with an optical fiber based spectrofluorometer. The healthy tissue spectrum is dominated by a peak around 500 nm, i.e. in the green part of the spectrum, while the spectrum measured on dysplastic tissue shows equal intensities in the green and the red part of the visible spectrum. The dotted line separates the green, i.e. short- wavelength region and the red, i.e. long-wavelength region used to generate the foreground and background autofluorescence images, respectively.
The impact of these spectral improvements, according to our knowledge, has not previously been assessed quantitatively with imaging systems. Therefore we have designed an endoscopic fluorescence imaging system that includes the features of violet excitation around 405 nm and offers the option to add red light to the excitation. This system was used for the clinical study reported here to confirm the results from Zellweger et al. [11] and to assess the potential of additional backscattered red light for improved contrast between healthy and (pre-)neoplastic tissue.
Materials and Methods Instrumentation We used a modified endoscopic fluorescence imaging (EFI) system developed in collaboration with the company Richard Wolf Endoskope GmbH, Knittlingen, Germany. The system consisted of a modified endoscopic light source and a filtered 3 CCD RGB camera (5137 Combilight PDD and EFI 5507camera). This experimental system offered the unique advantage of three different illumination/excitation modes that could be selected during the bronchoscopy using a simple foot switch. The light source contained an IR-filtered 300 W Xe lamp and was equipped with a flip-flop filter holder allowing for change between white light illumination for conventional endoscopy and two different violet light excitations for autofluorescence endoscopy. The two violet fluorescence excitation filters used in our study were: 1) a violet band pass filter (pure violet: "PV") with a transmission ≥ 95% between 395 and 460 nm, and 2) a double band pass filter (violet plus red light:"V+R") with a transmission ≥ 90% between 390 to 470 nm and a second weak (8%) transmission between 650 nm to 680 nm. The transmission spectra of these filters are shown in Figure 5.1.2. The slight spectral differences in the blue-violet bands were conditional of manufacturing, but do not affect the excitation properties.
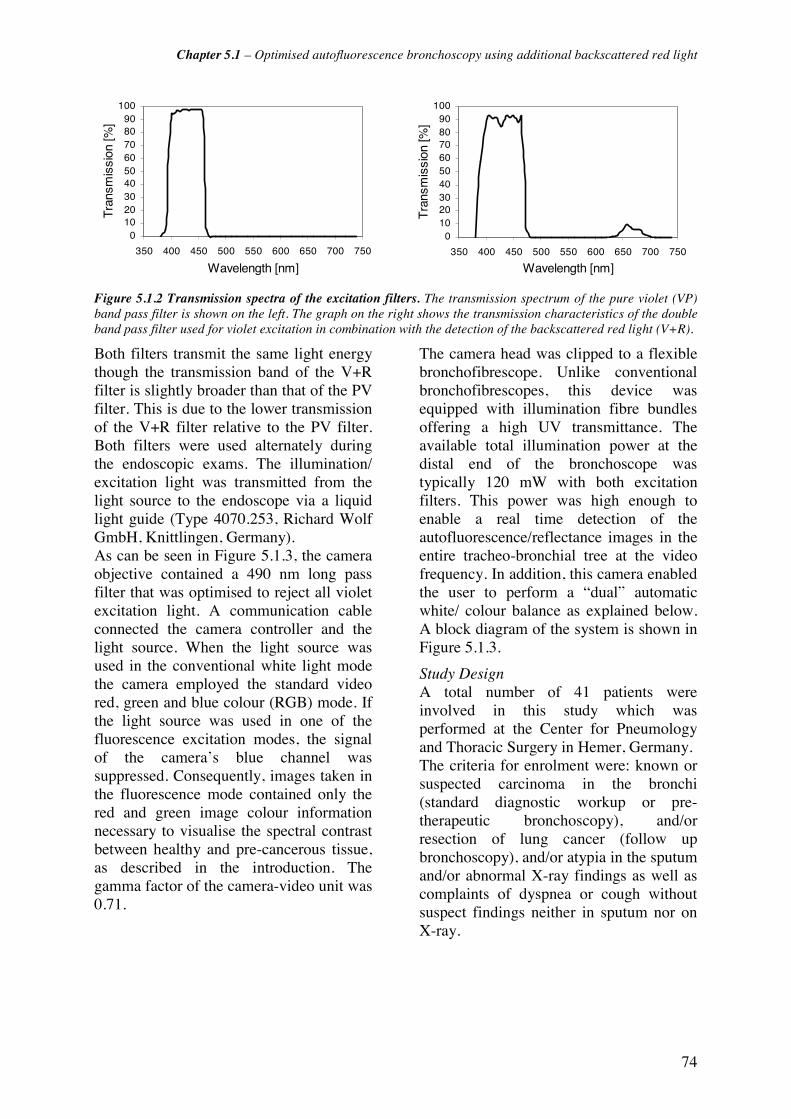
Chapter 5.1 – Optimised autofluorescence bronchoscopy using additional backscattered red light
74
0102030405060708090
100
350 400 450 500 550 600 650 700 750
Wavelength [nm]
Tra
nsm
issi
on [%
]
0102030405060708090
100
350 400 450 500 550 600 650 700 750
Wavelength [nm]
Tra
nsm
issi
on [%
]
Figure 5.1.2 Transmission spectra of the excitation filters. The transmission spectrum of the pure violet (VP) band pass filter is shown on the left. The graph on the right shows the transmission characteristics of the double band pass filter used for violet excitation in combination with the detection of the backscattered red light (V+R).
Both filters transmit the same light energy though the transmission band of the V+R filter is slightly broader than that of the PV filter. This is due to the lower transmission of the V+R filter relative to the PV filter. Both filters were used alternately during the endoscopic exams. The illumination/ excitation light was transmitted from the light source to the endoscope via a liquid light guide (Type 4070.253, Richard Wolf GmbH, Knittlingen, Germany). As can be seen in Figure 5.1.3, the camera objective contained a 490 nm long pass filter that was optimised to reject all violet excitation light. A communication cable connected the camera controller and the light source. When the light source was used in the conventional white light mode the camera employed the standard video red, green and blue colour (RGB) mode. If the light source was used in one of the fluorescence excitation modes, the signal of the camera’s blue channel was suppressed. Consequently, images taken in the fluorescence mode contained only the red and green image colour information necessary to visualise the spectral contrast between healthy and pre-cancerous tissue, as described in the introduction. The gamma factor of the camera-video unit was 0.71.
The camera head was clipped to a flexible bronchofibrescope. Unlike conventional bronchofibrescopes, this device was equipped with illumination fibre bundles offering a high UV transmittance. The available total illumination power at the distal end of the bronchoscope was typically 120 mW with both excitation filters. This power was high enough to enable a real time detection of the autofluorescence/reflectance images in the entire tracheo-bronchial tree at the video frequency. In addition, this camera enabled the user to perform a “dual” automatic white/ colour balance as explained below. A block diagram of the system is shown in Figure 5.1.3.
Study Design A total number of 41 patients were involved in this study which was performed at the Center for Pneumology and Thoracic Surgery in Hemer, Germany. The criteria for enrolment were: known or suspected carcinoma in the bronchi (standard diagnostic workup or pre-therapeutic bronchoscopy), and/or resection of lung cancer (follow up bronchoscopy), and/or atypia in the sputum and/or abnormal X-ray findings as well as complaints of dyspnea or cough without suspect findings neither in sputum nor on X-ray.

Chapter 5.1 – Optimised autofluorescence bronchoscopy using additional backscattered red light
75
Figure 5.1.3 Block diagram of the AF bronchoscopy system
Patients who had received photosensitising agents like Photofrin®, those known or suspected of suffering from pneumonia, and those considered generally unsuitable for bronchoscopy such as patients with uncontrolled hypertension or bleeding disorders, were excluded from the study. All the AF bronchoscopies were performed according to the procedure approved by the local ethical committee of the Hemer Centre for Pneumology and Thoracic Surgery. All but three bronchoscopies were carried out under local anaesthesia. The procedure was performed in two stages. First, conventional white light bronchoscopy was performed with the standard equipment used at the Hemer Center (Olympus endoscopic white light source with Olympus fibre optics (Type BF 40 and BF1T40) or Olympus video endoscope (BF 160)). Then, the bronchoscope was changed in favour of the autofluorescence imaging system. Automatic white balancing (AWB) of the camera was always performed on a white cotton compress prior to endoscopy. Moreover an automatic colour balancing (ACB) was performed for each autofluorescence excitation mode on the healthy main carina of the patient just after insertion of the bronchofibrescope. This ACB allowed us to correct for the interpatient fluctuations in the tissue autofluorescence intensity, that were reported by Zellweger et al. [20].
Bronchoscopy was repeated first with the PV filter and then with the V+R filter. Tissue areas were classified as “suspicious” in the fluorescence mode when they exhibited a brownish or brown-reddish colour with PV light excitation or a marked reddish colour under V+R excitation, respectively. All suspicious sites examined with the conventional WLB were then examined in the fluorescence mode and vice-versa. Since the principal aim of our study was to access the effect of additional backscattered red light on the tumour/tissue contrast, and not to investigate the sensitivity and specificity of the system, no random biopsies were taken. However, the endobronchial position and visual aspect of all abnormal findings were noted. Biopsy specimens or brushes were obtained from all sites suspicious either under WL or AF bronchoscopy. Whenever possible, biopsies were taken under fluorescence examination to guarantee a precise uptake of the specimens even on small areas. Biopsies were classified in a 3-class-system with 9 histologic categories: 1) normal tissue, 2) reactive changes and 3) (pre-)neoplastic changes. Class 2 (reactive changes) included inflammation (code 2) as well as metaplasia (code 3). The class of (pre-)neoplastic changes (class 3) was subdivided into mild, moderate and severe dysplasia/carcinoma in situ (CIS),
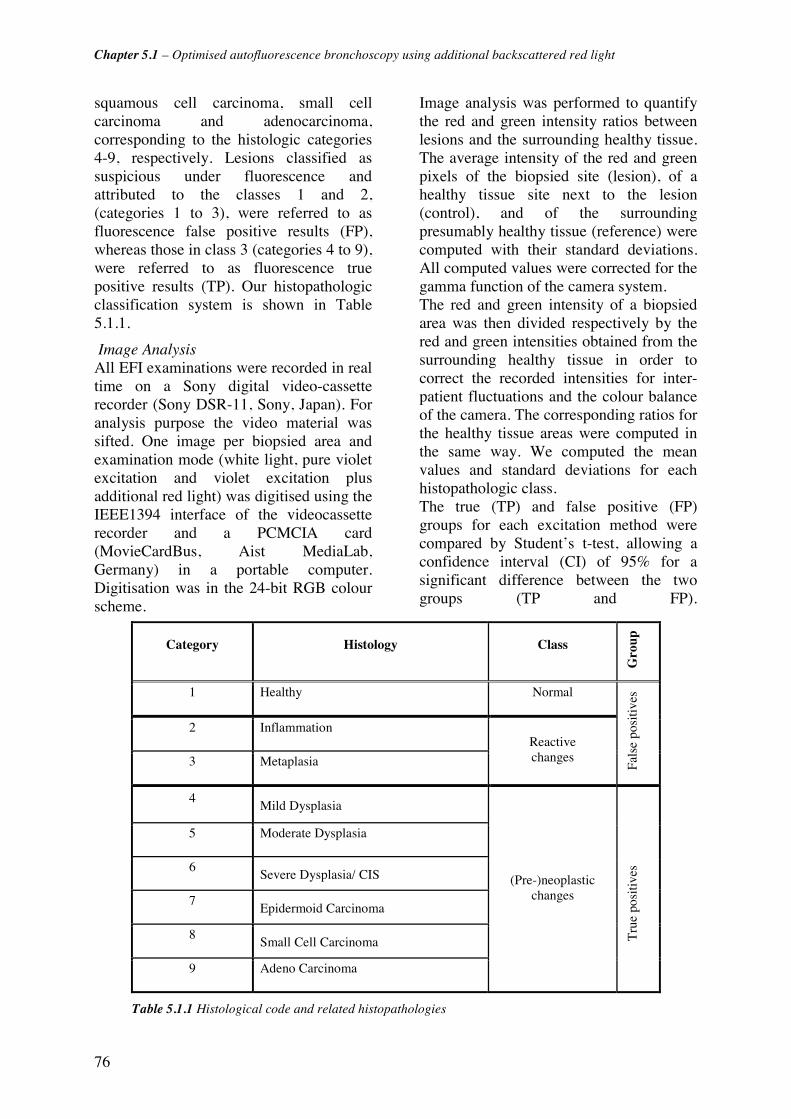
Chapter 5.1 – Optimised autofluorescence bronchoscopy using additional backscattered red light
76
squamous cell carcinoma, small cell carcinoma and adenocarcinoma, corresponding to the histologic categories 4-9, respectively. Lesions classified as suspicious under fluorescence and attributed to the classes 1 and 2, (categories 1 to 3), were referred to as fluorescence false positive results (FP), whereas those in class 3 (categories 4 to 9), were referred to as fluorescence true positive results (TP). Our histopathologic classification system is shown in Table 5.1.1.
Image Analysis All EFI examinations were recorded in real time on a Sony digital video-cassette recorder (Sony DSR-11, Sony, Japan). For analysis purpose the video material was sifted. One image per biopsied area and examination mode (white light, pure violet excitation and violet excitation plus additional red light) was digitised using the IEEE1394 interface of the videocassette recorder and a PCMCIA card (MovieCardBus, Aist MediaLab, Germany) in a portable computer. Digitisation was in the 24-bit RGB colour scheme.
Image analysis was performed to quantify the red and green intensity ratios between lesions and the surrounding healthy tissue. The average intensity of the red and green pixels of the biopsied site (lesion), of a healthy tissue site next to the lesion (control), and of the surrounding presumably healthy tissue (reference) were computed with their standard deviations. All computed values were corrected for the gamma function of the camera system. The red and green intensity of a biopsied area was then divided respectively by the red and green intensities obtained from the surrounding healthy tissue in order to correct the recorded intensities for inter-patient fluctuations and the colour balance of the camera. The corresponding ratios for the healthy tissue areas were computed in the same way. We computed the mean values and standard deviations for each histopathologic class. The true (TP) and false positive (FP) groups for each excitation method were compared by Student’s t-test, allowing a confidence interval (CI) of 95% for a significant difference between the two groups (TP and FP).
Category Histology Class G
roup
1 Healthy Normal
2 Inflammation
3 Metaplasia
Reactive changes
Fals
e po
sitiv
es
4 Mild Dysplasia
5 Moderate Dysplasia
6 Severe Dysplasia/ CIS
7 Epidermoid Carcinoma
8 Small Cell Carcinoma
9 Adeno Carcinoma
(Pre-)neoplastic changes
Tru
e po
sitiv
es
Table 5.1.1 Histological code and related histopathologies
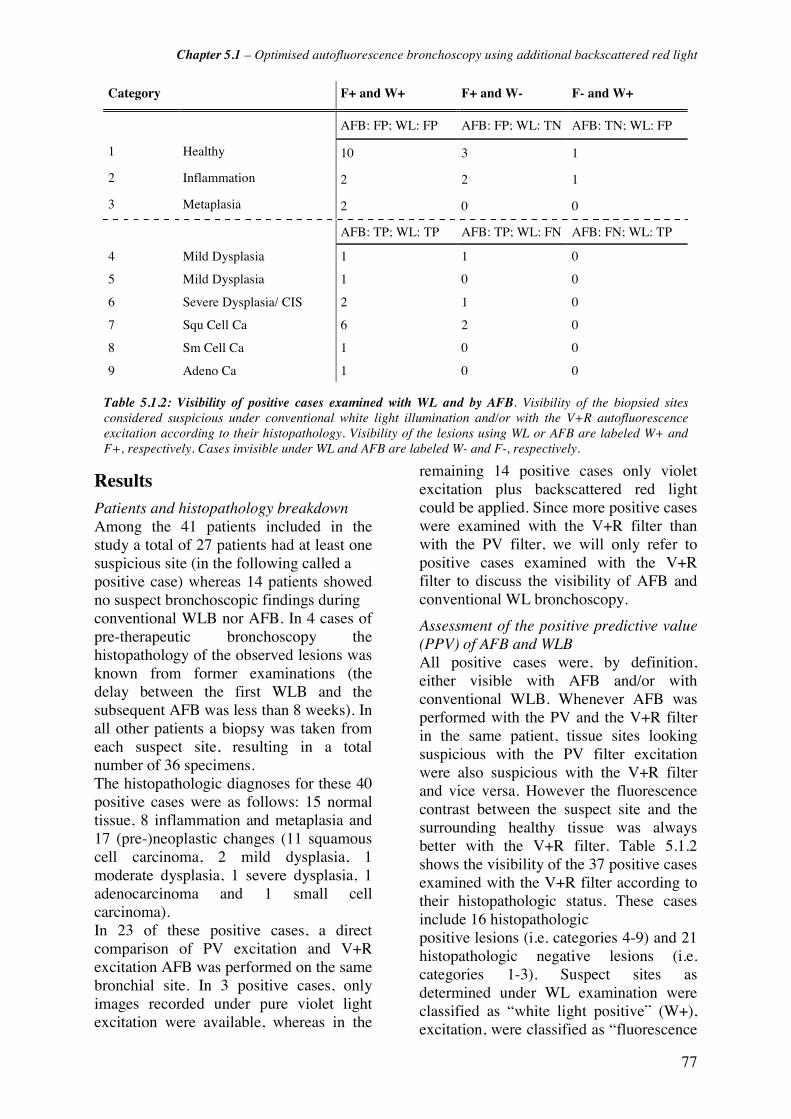
Chapter 5.1 – Optimised autofluorescence bronchoscopy using additional backscattered red light
77
Results Patients and histopathology breakdown Among the 41 patients included in the study a total of 27 patients had at least one suspicious site (in the following called a positive case) whereas 14 patients showed no suspect bronchoscopic findings during conventional WLB nor AFB. In 4 cases of pre-therapeutic bronchoscopy the histopathology of the observed lesions was known from former examinations (the delay between the first WLB and the subsequent AFB was less than 8 weeks). In all other patients a biopsy was taken from each suspect site, resulting in a total number of 36 specimens. The histopathologic diagnoses for these 40 positive cases were as follows: 15 normal tissue, 8 inflammation and metaplasia and 17 (pre-)neoplastic changes (11 squamous cell carcinoma, 2 mild dysplasia, 1 moderate dysplasia, 1 severe dysplasia, 1 adenocarcinoma and 1 small cell carcinoma). In 23 of these positive cases, a direct comparison of PV excitation and V+R excitation AFB was performed on the same bronchial site. In 3 positive cases, only images recorded under pure violet light excitation were available, whereas in the
remaining 14 positive cases only violet excitation plus backscattered red light could be applied. Since more positive cases were examined with the V+R filter than with the PV filter, we will only refer to positive cases examined with the V+R filter to discuss the visibility of AFB and conventional WL bronchoscopy.
Assessment of the positive predictive value (PPV) of AFB and WLB All positive cases were, by definition, either visible with AFB and/or with conventional WLB. Whenever AFB was performed with the PV and the V+R filter in the same patient, tissue sites looking suspicious with the PV filter excitation were also suspicious with the V+R filter and vice versa. However the fluorescence contrast between the suspect site and the surrounding healthy tissue was always better with the V+R filter. Table 5.1.2 shows the visibility of the 37 positive cases examined with the V+R filter according to their histopathologic status. These cases include 16 histopathologic positive lesions (i.e. categories 4-9) and 21 histopathologic negative lesions (i.e. categories 1-3). Suspect sites as determined under WL examination were classified as “white light positive” (W+), excitation, were classified as “fluorescence
Category F+ and W+ F+ and W- F- and W+
AFB: FP; WL: FP AFB: FP; WL: TN AFB: TN; WL: FP
1 Healthy 10 3 1
2 Inflammation 2 2 1
3 Metaplasia 2 0 0
AFB: TP; WL: TP AFB: TP; WL: FN AFB: FN; WL: TP
4 Mild Dysplasia 1 1 0
5 Mild Dysplasia 1 0 0
6 Severe Dysplasia/ CIS 2 1 0
7 Squ Cell Ca 6 2 0
8 Sm Cell Ca 1 0 0
9 Adeno Ca 1 0 0
Table 5.1.2: Visibility of positive cases examined with WL and by AFB. Visibility of the biopsied sitesconsidered suspicious under conventional white light illumination and/or with the V+R autofluorescenceexcitation according to their histopathology. Visibility of the lesions using WL or AFB are labeled W+ andF+, respectively. Cases invisible under WL and AFB are labeled W- and F-, respectively.

Chapter 5.1 – Optimised autofluorescence bronchoscopy using additional backscattered red light
78
Figure 5.1.4 Mild dysplasia. The lesion on the spur is hardly suspicious with WLB, but appears as a sprawled brownish area with AFB using pure violet excitation light. When violet excitation plus additional backscattered red light is used the lesion appears as a marked reddish area on the greenish surrounding tissue. Moreover “3-dimensional” perception is enhanced in the latter image.
and those determined with the AF positive” (F+). Unsuspicious sites in WLB and AFB were labelled “white light negative” (W-), and “fluorescence negative” (F-), respectively. All 16 (pre-)neoplastic lesions examined with AFB exhibited positive fluorescence. Among them, 12 (75%) were also visible under white light examination, and consequently, 4 (25%) of the (pre-)neoplastic lesions were occult with conventional WLB. In addition, no lesion was visible during WLB and negative under fluorescence. Twenty-one (57%) of all cases showed no abnormalities in histopathology apart from inflammation and metaplasia, and were therefore considered as bronchoscopical false positives (FP). Nineteen (90%) of these FP cases showed positive fluorescence and 16 (76%) of the FP cases were considered suspicious during WL examination. Two of these latter 16 FP cases were incorrectly classified as suspicious by white light endoscopy only, but were not suspicious under fluorescence. Five of the bronchoscopical false positive cases were suspect under fluorescence only but not under white light. Theses results are summarized in Table 5.1.3. These results suggest that the sensitivity of AFB is better than the one of WLB.
Illustrations of WLB and AFB imaging The following images show true positive lesions examined with WL, PV
fluorescence excitation and V+R fluorescence excitation. Figure 5.1.4 shows a mild dysplasia presented by a 62-year-old male patient observed with conventional WLB and AFB with PV and V+R fluorescence excitation, respectively. This patient was known to suffer from a squamous cell carcinoma in the upper right bronchus and underwent pre-therapeutic bronchoscopy for treatment by photodynamic therapy. The images show the division between the middle and lower lobe. The spur was slightly suspicious with WLB due to thickening and reddening. Autofluorescence bronchoscopy exhibited a sprawled brownish area on the olive-green healthy tissue background under pure violet excitation. The same area is clearly visible as a bright red zone on a clear green background when backscattered red light is used in addition to the violet excitation.
Table 5.1.3 Number of true (TP) and false positive (FP) as well as the true (TN) and false negative (FN) cases for WL and AFB with backscattered red light.
These images illustrate the improved detectability and demarcation of the
TP FN FP TN
AFB 16 0 19 2
WL 12 4 16 5
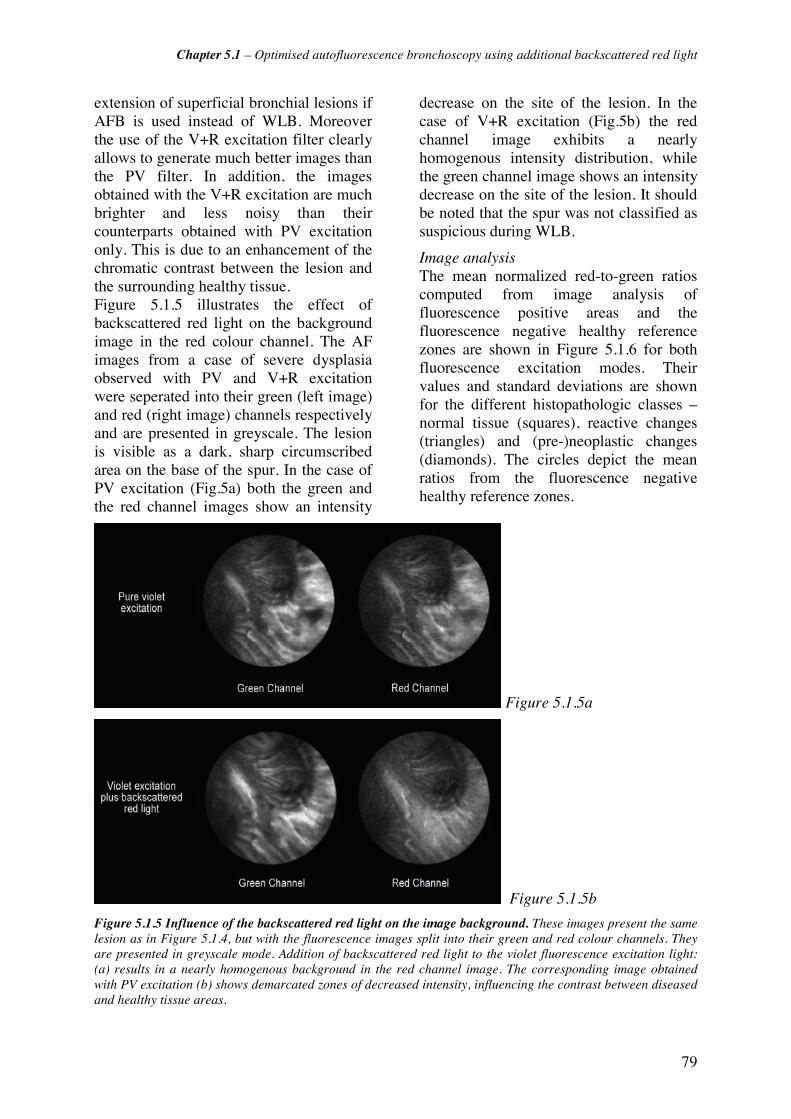
Chapter 5.1 – Optimised autofluorescence bronchoscopy using additional backscattered red light
79
extension of superficial bronchial lesions if AFB is used instead of WLB. Moreover the use of the V+R excitation filter clearly allows to generate much better images than the PV filter. In addition, the images obtained with the V+R excitation are much brighter and less noisy than their counterparts obtained with PV excitation only. This is due to an enhancement of the chromatic contrast between the lesion and the surrounding healthy tissue. Figure 5.1.5 illustrates the effect of backscattered red light on the background image in the red colour channel. The AF images from a case of severe dysplasia observed with PV and V+R excitation were seperated into their green (left image) and red (right image) channels respectively and are presented in greyscale. The lesion is visible as a dark, sharp circumscribed area on the base of the spur. In the case of PV excitation (Fig.5a) both the green and the red channel images show an intensity
decrease on the site of the lesion. In the case of V+R excitation (Fig.5b) the red channel image exhibits a nearly homogenous intensity distribution, while the green channel image shows an intensity decrease on the site of the lesion. It should be noted that the spur was not classified as suspicious during WLB.
Image analysis The mean normalized red-to-green ratios computed from image analysis of fluorescence positive areas and the fluorescence negative healthy reference zones are shown in Figure 5.1.6 for both fluorescence excitation modes. Their values and standard deviations are shown for the different histopathologic classes – normal tissue (squares), reactive changes (triangles) and (pre-)neoplastic changes (diamonds). The circles depict the mean ratios from the fluorescence negative healthy reference zones.
Figure 5.1.5a
Figure 5.1.5b
Figure 5.1.5 Influence of the backscattered red light on the image background. These images present the same lesion as in Figure 5.1.4, but with the fluorescence images split into their green and red colour channels. They are presented in greyscale mode. Addition of backscattered red light to the violet fluorescence excitation light: (a) results in a nearly homogenous background in the red channel image. The corresponding image obtained with PV excitation (b) shows demarcated zones of decreased intensity, influencing the contrast between diseased and healthy tissue areas.

Chapter 5.1 – Optimised autofluorescence bronchoscopy using additional backscattered red light
80
Figure 5.1.6 Mean values of normalized ratios for both pure violet and violet + red excitation. This graphic depicts the mean values of the normalized ratios for pure violet excitation (data on the left) and violet excitation with backscattered red light (data on the right). The circles mark values for healthy and fluorescence negative tissue, squares mark healthy but fluorescence positive tissue, triangles mark reactive changes (inflammation and metaplasia) and diamonds mark (pre-)neoplastic changes (dysplasia and carcinoma). The number of cases, n, is given for each histopathologic class.
In the case of pure violet excitation the mean ratios were comparable for false
positive normal (meannormal = 1.66 ± 0.39), reactive changes (meanreactive= 1.75 ± 0.12)
and (pre-)neoplastic changes (meanneoplastic= 1.74 ± 0.43). It should be noted that the mean value of the normalized ratio for the fluorescence-negative healthy reference zone was meanreference =1.03 ± 0.05. Adding backscattered red light to the violet excitation increased the corresponding mean values by a factor of about 2 for the normal and reactive changes classes (meannormal=3.65 ± 0.43, meanreactive= 4.04 ± 0.48). For the (pre-)neoplastic lesions this factor exceeded the value of 2.7 (meanneoplastict for violet plus red = 4.93 ± 2.25). The mean value of the normalized ratio for the fluorescence-negative healthy reference zone remained in the range of 1 (meanreference= 1.10 ± 0.16).
Discussion Autofluorescence bronchoscopy has proven to be an efficient and useful tool in the detection of pre-neoplastic lesions and early cancers in the bronchi. In this study we present an optimised AFB imaging system offering superior colour contrast between healthy tissue and lesions. One of the major problems the current commercially available AFB systems have to cope with is the poor image quality. This is due to the limited tissue autofluorescence intensity, combined with the limited light collection efficiency, throughput, and physical sensitivity of the imaging system [22]. Our system
employed a filtered Xe-lamp light source in combination with a fiberscope specially designed for autofluorescence detection with an excitation wavelength around 405 nm. Used in combination with a 3 CCD endoscopic colour camera we obtained noise-reduced fluorescence images at video frequency, i.e. about 25 frames per second, bright enough for a proper navigation in the tracheo-bronchial tree. This enabled the physician to perform the whole bronchoscopy in the autofluorescence mode instead of examining the bronchial tree in the conventional white light mode, switching to the autofluorescence mode only at specific sites. Another problem of autofluorescence imaging systems is how to take full advantage of the contrast between healthy and (pre-)neoplastic tissue fluorescence observed in spectroscopic measurements [20]. In the pure violet excitation mode the red (R) and green (G) autofluorescence images are mapped on the red and green video colour channel, respectively. The resulting R-G images delineate the fluorescence positive areas from the surrounding normal tissue, since the first exhibits a higher red-to-green fluorescence ratio than the latter. Pre-neoplastic and neoplastic tissue areas appear as brownish-olive spots on the greenish background. Though the intensity contrast of lesions in these images is quite good, the colour
0
1
2
3
4
5
6
7
8
No
rmal
ized
Rat
io [
r.u
.]
Healthy F+
Infl.&Met. F+
Dys&Ca F+
Healthy F-
Pure violet Violet plus backscattered red
n=8
n=13
n=6
n=6
n=10
n=16
n=26 n=37

Chapter 5.1 – Optimised autofluorescence bronchoscopy using additional backscattered red light
81
contrast is limited as the decrease of the autofluorescence intensity in the red part of the spectrum attenuates the contrast from the green part of the spectrum. Single channel detection of the green autofluorescence signal alone would alleviate this bias induced by the low decrease of the red fluorescence, resulting in a maximal contrast. But due to the tri-dimensional geometry of the bronchi, both a background and a contrast bearing foreground image are necessary for an efficient distinction between healthy and abnormal tissue sites, for avoiding false positives resulting from geometry related shadowing. Such a background image can be created by backscattered light detected in one or several different colour channels. Profio [23] and Leonhard [16] reported the detection of a small amount of backscattered blue excitation light to optimize the quality of AF detection in the bronchi. Commercially available systems, such as the one proposed by the Karl Storz [16] company, are based on this principle. Since blue/violet light is strongly absorbed by haemoglobin, the use of this spectral domain to detect backscattered light generates much more structured images than using red light. Therefore, the use of blue/violet backscattered light helps to reveal the texture of the bronchi, but it is not ideal for correcting the autofluorescence images detected in the green spectral domain. Consequently, following the spectro-fluorometric study of the bronchial autofluorescence performed by our group [11], we investigated the use of backscattered red light for the optimisation of our imaging system. We demonstrated in the study presented in this paper, that the combination of violet light induced tissue autofluorescence with backscattered red light increases the red-to-green colour ratios between normal and (pre-)neoplastic tissue areas in the AFB images by a factor of about 2.8 compared to violet light induced fluorescence alone. This factor corresponds to the autofluorescence intensity ratio measured
spectroscopically in the red part of the spectrum, i.e. between 600 and 800 nm between healthy and (pre-)neoplastic tissues by Zellweger et al. [11]. This 2-3 fold increase of the red-to-green ratio is responsible for the improved chromatic contrast perceived in the V+R fluorescence images. Indeed, the bright red appearance of fluorescence positive lesions excited with violet light and backscattered red light are more easily perceived on the green background characteristic of healthy tissue than the brownish-olive coloured lesions observed under pure violet excitation. Moreover, the red background image created by the backscattered red light dramatically improves the signal to noise ratio, allowing better navigation and orientation for the endoscopist in the autofluorescence mode. In addition, the use of the V+R excitation filter strongly suggests an increase in specificity as indicated by Figure 5.1.6. Indeed, the overlap between the distribution of the normalized ratio measured in true positive and false positive sites is much smaller with the V+P filter than with the PV filter, indicating a more pronounced demarcation. Normal, inflammatory and dysplastic/carcinomatous fluorescence positive sites showed no significant differences in their normalized red-to-green ratios under PV excitation (CI 95%). In the cases when additional backscattered red light was used, a significant difference could be observed between fluorescence positive, but histopathologically normal sites (false positives, FP) and true positive (TP) dysplasia and carcinoma (CI 99%). A much weaker, but significant (CI 80%) difference was observed between the ratios computed from inflammatory false positive sites and dysplasia/carcinoma excited with the V+R filter. The ratios computed from the healthy fluorescence-negative controls were all significantly different from the ratios computed from fluorescence true and false positive sites for the PV and V+R filter, respectively. This point is of crucial importance since the limited specificity has always been a
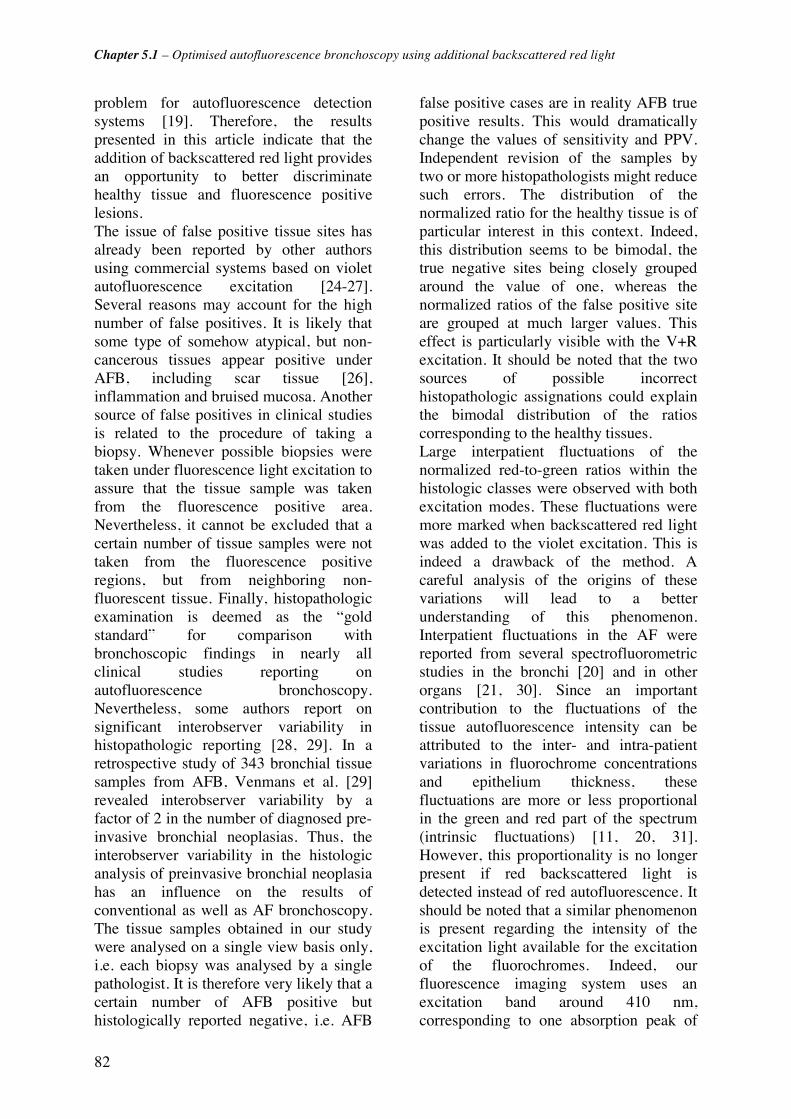
Chapter 5.1 – Optimised autofluorescence bronchoscopy using additional backscattered red light
82
problem for autofluorescence detection systems [19]. Therefore, the results presented in this article indicate that the addition of backscattered red light provides an opportunity to better discriminate healthy tissue and fluorescence positive lesions. The issue of false positive tissue sites has already been reported by other authors using commercial systems based on violet autofluorescence excitation [24-27]. Several reasons may account for the high number of false positives. It is likely that some type of somehow atypical, but non-cancerous tissues appear positive under AFB, including scar tissue [26], inflammation and bruised mucosa. Another source of false positives in clinical studies is related to the procedure of taking a biopsy. Whenever possible biopsies were taken under fluorescence light excitation to assure that the tissue sample was taken from the fluorescence positive area. Nevertheless, it cannot be excluded that a certain number of tissue samples were not taken from the fluorescence positive regions, but from neighboring non-fluorescent tissue. Finally, histopathologic examination is deemed as the “gold standard” for comparison with bronchoscopic findings in nearly all clinical studies reporting on autofluorescence bronchoscopy. Nevertheless, some authors report on significant interobserver variability in histopathologic reporting [28, 29]. In a retrospective study of 343 bronchial tissue samples from AFB, Venmans et al. [29] revealed interobserver variability by a factor of 2 in the number of diagnosed pre-invasive bronchial neoplasias. Thus, the interobserver variability in the histologic analysis of preinvasive bronchial neoplasia has an influence on the results of conventional as well as AF bronchoscopy. The tissue samples obtained in our study were analysed on a single view basis only, i.e. each biopsy was analysed by a single pathologist. It is therefore very likely that a certain number of AFB positive but histologically reported negative, i.e. AFB
false positive cases are in reality AFB true positive results. This would dramatically change the values of sensitivity and PPV. Independent revision of the samples by two or more histopathologists might reduce such errors. The distribution of the normalized ratio for the healthy tissue is of particular interest in this context. Indeed, this distribution seems to be bimodal, the true negative sites being closely grouped around the value of one, whereas the normalized ratios of the false positive site are grouped at much larger values. This effect is particularly visible with the V+R excitation. It should be noted that the two sources of possible incorrect histopathologic assignations could explain the bimodal distribution of the ratios corresponding to the healthy tissues. Large interpatient fluctuations of the normalized red-to-green ratios within the histologic classes were observed with both excitation modes. These fluctuations were more marked when backscattered red light was added to the violet excitation. This is indeed a drawback of the method. A careful analysis of the origins of these variations will lead to a better understanding of this phenomenon. Interpatient fluctuations in the AF were reported from several spectrofluorometric studies in the bronchi [20] and in other organs [21, 30]. Since an important contribution to the fluctuations of the tissue autofluorescence intensity can be attributed to the inter- and intra-patient variations in fluorochrome concentrations and epithelium thickness, these fluctuations are more or less proportional in the green and red part of the spectrum (intrinsic fluctuations) [11, 20, 31]. However, this proportionality is no longer present if red backscattered light is detected instead of red autofluorescence. It should be noted that a similar phenomenon is present regarding the intensity of the excitation light available for the excitation of the fluorochromes. Indeed, our fluorescence imaging system uses an excitation band around 410 nm, corresponding to one absorption peak of
Chapter 5.1 – Optimised autofluorescence bronchoscopy using additional backscattered red light
83
haemoglobin. The main alterations in the local intensity of violet light available for excitation of the tissue autofluorescence, are therefore related to the presence and extent of blood and blood containing structures, i.e. for instance, the density, size and depth of the blood vessels underlying the bronchial epithelium. These factors can vary markedly from one site to another. In the case of pure violet excitation both the green and the red autofluorescence images are detected. A decrease in the violet excitation light due to the above mentioned local blood containing structures, therefore results in a nearly proportional decrease in the green as well as in the red part of the spectrum. Consequently, in the case of pure violet excitation, the inter- and intrapatient variations of the red-to-green ratios are minimally influenced by the blood related fluctuations of the excitation light intensity. When backscattered red light is used in addition to the violet excitation, only the autofluorescence in the green image will be influenced by the absorption of the excitation light. However, since red light is less absorbed by haemoglobin than violet light, the resulting red backscattered image exhibits fewer variations due to the presence of blood. As a consequence the AFB image detected with violet excitation plus backscattered red is sensitive to both the intrinsic (fluorochrome concentration; variation of fluorescence yield, etc) and extrinsic (change of the tissue optical properties) fluctuations, leading to more pronounced inter- and intrapatient variations. This could have an effect on the learning curve of the physician using the different systems. Low variations in the computed normalized red-to-green colour ratios for fluorescence positive lesions indicate only small differences in the colour of lesions presented on the screen, while high variations in the normalized red-to-green ratios are associated with a wider range of colours that will indicate a lesion during AFB. In the first case, which corresponds to the PV excitation conditions in our
study, it will be easier for the physician to identify “the” colour typical for a lesion. In the case of V+R excitation the physician will have to get used to a larger range of “colours” depicting lesions. This suggests that a physician will need ample experience before making accurate diagnoses when using the V+R system as compared to the PV system. Indeed, the improved colour contrast between diseased and undiseased tissue plus the increased signal-to-noise ratio of the V+R excitation, and resultant brighter images, overcome the drawback of a more difficult image interpretation. The enhanced chromatic contrast between a lesion and its healthy surrounding allows a precise demarcation of the lesion’s margins. This makes AFB an important tool, not only for diagnostic, but also for pre-therapeutic and pre-surgical bronchoscopy, where the determination of tumour margins is crucial for the planification and outcome of the treatment or surgery. In summary, the results presented in this work demonstrate that the additional detection of backscattered red light in violet light induced AFB, has the potential to significantly increase the chromatic contrast between healthy and abnormal bronchial tissues. Moreover, the additional light markedly reduces the signal to noise ratio, thus improving the image quality. This is of high interest for the development of future AFB systems. In the study presented here, each bronchoscopy was performed with fibreoptic endoscopes equipped with an endoscopic camera clipped to the endoscope’s eyepiece. However, the use of flexible videobronchoscopes has increased drastically in recent years. These CCD-tipped endoscopes offer high light sensitivity, increased spatial resolution, low-weight, and easy handling. These features make them the tool of choice for most bronchologists. Videoendoscopy systems combining WL and AF detection are under development [32, 33]. Following the results presented in this work, the
Chapter 5.1 – Optimised autofluorescence bronchoscopy using additional backscattered red light
84
implementation of the principle of the V+R autofluorescence detection should be considered in the development of such videoendoscopic system for the improvement of image quality.
Acknowledgements We gratefully acknowledge support from the Swiss National Science Foundation (Grant Nr. 205320-103518). Organisation, collection of data, and some technical equipment (bronchoscopes and AFB system) were supported by the company Richard Wolf Endoskope GmbH, Germany.

Chapter 5.1 – Optimised autofluorescence bronchoscopy using additional backscattered red light
85
References [1] A. Jemal, T. Murray, A. Ghafoor, A. Samuels, E. Ward, M. J. Thun, R. C. Tiwari and E. J. Feuer, "Cancer Statistics, 2004," Ca-A Cancer Journal for Clinicians 54(1), 8-29 (2004)
[2] F. Levi, F. Lucchini, C. La Vecchia, E. Negri and F. Levi, "Trends in mortality from major cancers in the European Union, including acceding countries, in 2004," Cancer 101(1), 2843-2850 (2004)
[3] J. E. Tyczynski, F. Bray and D. M. Parkin, "Lung cancer in europe in 2000: epidemiology, prevention, and early detection," Lancet Oncology 4(1), 45-55 (2003)
[4] A. Jemal, L. X. Clegg, E. Ward, L. A. G. Ries, X. Wu, P. M. Jamison, P. A. Wingo, H. L. Howe, R. N. Anderson and B. K. Edwards, "Annual report to the nation on the status of cancer, 1975-2001, with a special feature regarding survival," Cancer 101(1), 3-27 (2004)
[5] H. Kato, "Photodynamic therapy for lung cancer - A review of 19 years' experience," Journal of Photochemistry and Photobiology B: Biology 42(2), 96-99 (1998)
[6] G. Bepler, B. Djulbegovic, R. A. Clark and M. Tockman, "A systemic review and lessons learned from early lung cancer detection trial using low-dose computed tomography of the chest," Cancer Control 10(4), 306-324 (2003)
[7] M. Sato, Y. Saito, K. Usuda, S. Takahashi, M. Sagawa and S. Fujimura, "Occult lung cancer beyond bronchoscopic visibility in sputum-cytology positive patients," Lung Cancer 20(1), 17-24 (1998)
[8] G. Wagnières, A. McWilliams and S. Lam, "Lung cancer imaging with fluorescence endoscopy," in Handbook of Biomedical Fluorescence, M.-A. Myceck and B. W. Pogue, pp. 361-396, Marcel Dekker, Inc. (2003).
[9] K. Shibuya, H. Hoshino, M. Chiyo, K. Yasufuku, T. Iizasa, Y. Saitoh, M. Baba, K. Hiroshima, H. Ohwada and T. Fujisawa, "Subepithelial vascular patterns in bronchial dysplasias using a high magnification bronchovideoscope.," Thorax 57(10), 902-907 (2002)
[10] D. Goujon, M. Zellweger, A. Radu, G. P., B.-C. Weber, H. van den Bergh, P. Monnier and G. Wagnières, "In vivo autofluorescence imaging of early cancers in the human tracheobronchial tree with a spectrally optimized system," J Biomed Optics 8(1), 17-25 (2003)
[11] M. Zellweger, P. Grosjean, D. Goujon, P. Monnier, H. van den Bergh and G. Wagnières, "In vivo autofluorescence spectroscopy of human bronchial tissue to optimize the detection and imaging of early cancers," J Biomed Optics 6(1), 41-51 (2001)
[12] J. Hung, S. Lam, J. LeRiche and B. Palcic, "Autofluorescence of normal and malignant bronchial tissue," Lasers in Surgery and Medicine 11(2), 99-105 (1991)
[13] G. Wagnieres, W. Star and B. Wilson, "In vivo fluorescence spectroscopy and imaging for oncological applications.," Photochem Photobiol 68(5), 603-632 (1998)
[14] S. Lam, T. Kennedy and M. Unger, "Localization of bronchial intraepitheloial neoplastic lesions by fluorescence bronchoscopy," Chest 113(3), 696-702 (1998)
[15] R. Adachi, T. Utsui and K. Furusawa, "Development of the autofluorescence endoscope imaging system," Diagnostic and Therapeutic Endoscopy 5(3), 65-70 (1999)
[16] M. Leonhard, "New incoherent autofluorescence/fluorescence system for early detection of lung cancer," Diagnostic and Therapeutic Endoscopy 5(2), 71-75 (1999)
[17] P. Pierard, B. Martin, J.-M. Verdebout, J. Faber, M. Richez, J.-P. Sculier and V. Ninane, "Fluorescence bronchoscopy in high-risk patients - A comparison of LIFE and Pentay systems," J Bronchology 8(4), 254-259 (2001)
[18] T. G. Sutedja, H. Condrigton, E. K. Risse, R. H. Breuer, J. C. van Mourik, R. P. Golding and P. E. Postmus, "Autofluorescence bronchoscopy improves staging of radiographically occult lung cancer and has an impact on therapeutic strategy," Chest 120(4), 1327-1332 (2001)
[19] F. R. Hirsch, S. A. Prindiville, Y. E. Miller, W. A. Franklin, E. C. Dempsey, J. R. Murphy, P. A. Bunn Jr and T. C. Kennedy, "Fluorescence versus white-light bronchoscopy for detection of preneoplasic lesions: a randomized study," J Natl Cancer Inst 93(18), 1385-1391 (2001)
[20] M. Zellweger, D. Goujon, R. Conde, M. Forrer, H. van den Bergh and G. Wagnières, "Absolute autofluorescence spectra of human healthy, metaplastic, and early cancerous bronchial tissue in vivo," Applied Optics 40(22), 3784-3791 (2001)
[21] H. Zeng, A. Weiss, R. Cline and C. E. MacAulay, "Real-time endoscopic fluorescence

Chapter 5.1 – Optimised autofluorescence bronchoscopy using additional backscattered red light
86
imaging for early cancer detection in the gastrointestinal tract," Bioimaging 6(4), 151-165 (1998)
[22] G. Wagnières, A. P. Studzinski, D. R. Braichotte, P. Monnier, C. Depeursinge, A. Châtelain and H. Van Den Bergh, "Clinical imaging fluorescence apparatus for the endoscopic photodetection of early cancers by use of Photofrin II," Applied Optics 36(22), 5608-5620 (1997)
[23] A. E. Profio, D. R. Doiron and J. Sarnaik, "Fluorometer for endoscopic diagnosis of tumors," Medical Physics 11(4), 516-520 (1984)
[24] N. Ikeda, H. Honda, T. Katsumi, T. Okunaka, K. Furukawa, T. Tsuchida, K. Tanaka, T. Onoda, T. Hirano, M. Saito, N. Kawate, C. Konaka, H. Kato and Y. Ebihara, "Early detection of bronchial lesions using lung imaging fluorescence endoscope," Diagnostic and Therapeutic Endoscopy 5(2), 85-90 (1999)
[25] M. Kakihana, K. Kyong Il., T. Okunaka, K. Furukawa, T. Hirano, C. Konaka, H. Kato and Y. Ebihara, "Early detection of bronchial lesions using system of autofluorescence endoscopy (SAFE) 1000," Diagnostic and Therapeutic Endoscopy 5(2), 99-104 (1999)
[26] K. Häußinger, F. Stanzel, R. M. Huber, J. Pichler and S. H., "Autofluorescence detection of bronchial tumors with the D-Light/AF," Diagnostic and Therapeutic Endoscopy 5(2), 105-112 (1999)
[27] T. Horvath, M. Horvathova, F. Salajka, B. Habanec, L. Foretova, J. Kana, H. Koukalova, P. Pafko, F. Wurst, E. Novotna, J. Pecina, V. Vagunda, R. Vrbacky, R. Talac, H. Coupkova and Z. Pacovsky, "Detection of bronchial neoplasia in uranium miners by autofluorescence endoscopy (SAFE-1000)," Diagnostic and Therapeutic Endoscopy 5(2), 91-98 (1999)
[28] J. M. Kurie, J. S. Lee, R. C. Morice, L. W. Garrett, F. R. Khuri, A. Broxson, Y. R. Jae, A. F. Wilbur, Y. Ren and K. W. Hong, "Autofluorescence bronchoscopy in the detection of squamous metaplasia and dysplasia in current and former smokers," J Natl Cancer Inst 90(13), 991-995 (1998)
[29] B. J. Venmans, H. C. van der Linden, H. R. Elbers, T. J. van Boxem, E. F. Smit, R. E. Postmus and T. G. Sutedja, "Observer variability in histopathologic reporting of bronchial biopsy specimens - Influence on the results of autofluorescence bronchoscopy in detection of preinvasive bronchial neoplasia," J Bronchology 7(3), 210-214 (2000)
[30] N. Ramanujam, M. F. Mitchell, A. Mahadevan, S. Thomsen, A. Malpica, T. Wright, N. Atkinson and R. Richards-Kortum, "Spectroscopic diagnosis of cervical intraepithelial neoplasia (CIN) in vivo using laser-induced fluorescence spectra at multiple excitation wavelengths," Lasers in Surgery and Medicine 19(1), 63-74 (1996)
[31] R. Richards-Kortum and E. Sevick-Muraca, "Quantitative optical spectroscopy for tissue diagnosis," Annual Review of Physical Chemistry 47(1), 555-606 (1996)
[32] M. A. Kara, F. P. Peters, F. J. W. Ten Kate, S. J. Van Deventer, P. Fockens and J. J. G. H. M. Bergman, "Endoscopic video autofluorescence imaging may improve the detection of early neoplasia in patients with Barrett's esophagus," Gastrointestinal Endoscopy 61(6), 679-685 (2005)
[33] Pentax Europe GmbH, "PENTAX SAFE-3000– erstes Autofluoreszenz Video-Bronchoskopie System," http://www.pentax.nl/4medical/nieuws/productnieuws/pdfs/barcelona_fin2.pdf, accessed on 22.03.2006

87
5.2 The Richard Wolf’s DAFE system Following the results from the clinical study presented in the previous chapter, a second generation AFB system was designed in the context of a collaboration between the EPFL’s Photomedicine group and Richard Wolf Endoskope GmbH. It was commercialised as the DAFE (Diagnostic AutoFluorescence Endoscopy) system. The DAFE bronchoscopy system involves an excitation light source, a detection unit, and a video unit. A block diagram and a picture of the system are shown in Figure 5.2.1. It should be noted that some relevant and interesting features of the DAFE system are deliberately not given for confidentiality reasons.
Figure 5.2.1 : Block diagram of the DAFE bronchoscopy system.
5.2.1 The light source Like in the first generation AFB systems, the excitation unit of the DAFE system relies on a filtered endoscopic light source (LightProjector 5137) equipped with a 300 W UV- and IR filtered Xenon lamp. The light source is equipped with a 2-position flip-flop filter holder containing a metallic grid for white light emission and a band-pass filter for blue-violet light emission ("DAFE mode"). The filter position can rapidly be switched during bronchoscopy with the help of a foot pedal. White light emission ranges from 390 nm to 680 nm. The band-pass filter for AF excitation has a high transmission band at 430nm (FWHM 80 nm) and a low transmission band at 680nm (FWHM 20nm). This second transmission band allows the addition of backscattered red light to the AFB images. The intensity of the red light added to the AFB image can be adjusted with a rotable interference filter located in the light path between the excitation filter and the light source output. In clinical practice, the intensity of the detected backscattered red light is typically adjusted to be about 2/3 of the AF intensity emitted between 590 nm and 680 nm. In other words, the detected red signal intensity (assumed to be 100%) is composed of about 60% of tissue AF and 40% of the detected backscattered red light.
The excitation light intensity can be adjusted by a rotating grid (with different holes size on its surface). The emission spectra of the light projector are shown in Figure 5.2.2 for the white light mode and in Figure 5.2.3 for the DAFE excitation. The inset in Figure 5.2.3 shows a magnification on the second red emission band of the DAFE excitation. The light from the light source is delivered to the endoscopic optics through a liquid light guide (Type 4070.253, Richard Wolf Endoscopes GmbH, Germany). This light guide was specially designed for AF

Chapter 5.2 – The Richard Wolf’s DAFE system
88
endoscopy in the sense that its transmission in the blue-violet wavelength region is larger than for a conventional light guide.
Figure 5.2.2 White light illumination spectrum of the DAFE light source.
Figure 5.2.3 Blue-violet excitation spectrum of the DAFE light source. The insert zooms on the wavelength region corresponding to the red low transmission band around 680 nm.
5.2.2 The camera system Both AF detection and conventional white light examinations are performed with a single endoscopic colour camera unit (type EndoCam 5506) composed of a 3CCD camera head and a dedicated camera controller. A dedicated C-mount zoom objective with an integrated 475 nm LP filter ("emission filter") is mounted on the camera head. The spectral design of this filter was optimised to suppress all blue-violet excitation from the light entering the camera, whereas it transmits a part of the blue AF. Thus, the detected and displayed AF images are based on the complete set of colour information of the RGB space. The spectral design enables to visualise tissue structures that would be difficult to interpret if only one or two colour channels would be active. In the DAFE system, the three RGB components are displayed, allowing proper navigation in the tracheo-bronchial tree using the DAFE mode. Moreover, the chromatic aspect of the DAFE images is similari to that of conventional white light bronchoscopy images, which is much appreciated by many clinicians. The emission filter being integrated in the camera objective, the camera head can be plugged to conventional rigid or flexible bronchoscope optics.
The image signal detected by the 3-CCD unit is converted into a PAL video signal by the camera controller. This video signal is delivered in the Y/C (S-video) and the composite formats. The bronchoscopic images are displayed on a CRT (Cathode Ray Tube) monitor. Y/C output was recorded on a digital video (DV) tape recorder (Sony DVCAM, type DSR-11, Sony Corp., Japan). Typical white light and AFB images obtained with this system are shown in the appendix.
5.2.3 Image Analysis All quantitative analysis of DAFE image presented in this thesis were performed following the same protocol. The Y/C signal from the DAFE unit was recorded on the DV tape recorder. Video sequences were digitized via the IEEE 1394 ("Firewire") interface connecting the DV recorder and a PC. The process was driven by Adobe Premiere 6.5 (Adobe Systems Incorporated, USA), using the built-in Microsoft DV (PAL) format. Still images were exported in the "TIFF" format (Tagged Image File Format in the 24-bit RGB mode). This
Chapter 5.2 – The Richard Wolf’s DAFE system
89
encoding allows 8-bit quantification for each colour channel (RGB), resulting in 256 intensity levels per channel.
The quantitative image analysis was performed with Adobe Photoshop 7.0 (Adobe Systems Incorporated, USA). Areas of interest on the image were selected and the intensity levels of the RGB colour channels were read out with the help of the histogram function. Attention was paid not to select saturated areas.
A pseudo black mask is present around the circular endoscopic image to match the image size of a conventional rectangular (4:3) display. Signal intensity originating from the mask was averaged to quantify the electronic offset of the camera. The result was considered as a background to be systematically subtracted from all measurements. Depending on the camera's intensification settings, this background was up to 10% of the 8-bit quantification's dynamic range. Finally, it should be noted that, all intensity level values were corrected for the system's gamma factor (see below).
5.2.4 Specific features of the DAFE system The DAFE Endocam 5506 is equipped with special functions to preprocess the detected raw input signal: automatic white balancing (AWB), gamma correction of the input signal, spectral crosstalk between the detection colour channels, automatic shutter function and automatic gain control (AGC).
Most studies presented in this thesis are based on the quantitative analysis of the bronchoscopic images obtained with the DAFE system. Detailed knowledges and understanding of the system characteristics are therefore required to reliably assess quantitative study based on image analysis. In the following section, we will describe these features in details.
Automatic white balancing The automatic white balancing (AWB) is used to adapt the camera response to the colour temperature of the illumination. Practically speaking, AWB is performed by pointing the camera to a white surface and activating the white balancing routine of the system. This routine measures the intensities detected in each colour channel and adjusts them until they correspond to a default value. In clinical practice, AWB is always performed on a white surface, such as a cotton compress, illuminated with the white light source of the DAFE unit before any medical examination. The AWB performed with the filtered DAFE camera deserves special attention. As the LP filter in the DAFE objective cuts off most blue-violet excitation wavelengths, only a low intensity is detected in the blue channel when a white reference is observed. Consequently, AWB will lead to a maximum amplification of the detected blue channel signal. This results in rather high intensity levels in the blue channel of DAFE images, generating the impression of a "blue background noise" on the images. If the optical setup was modified during an examination (typically in the study presented in the Chapter 5.5.), a new AWB procedure was repeated before resuming the bronchoscopic examination.
The Gamma factor The gamma factor in photography, video and computer graphics refers to a numerical parameter that describes the non-linearity of intensity reproduction of cathode ray tube (CRT) monitors. The relation (or transfer function) between the input voltage "V", i.e. the video signal intensity, and the light intensity reproduced on the CRT screen "L" follows a power function L=Vc,, where “c” is a constant parameter characterising the non-linear response . Accordingly, all camera raw signals "S" have to be corrected by the inverse transfer function
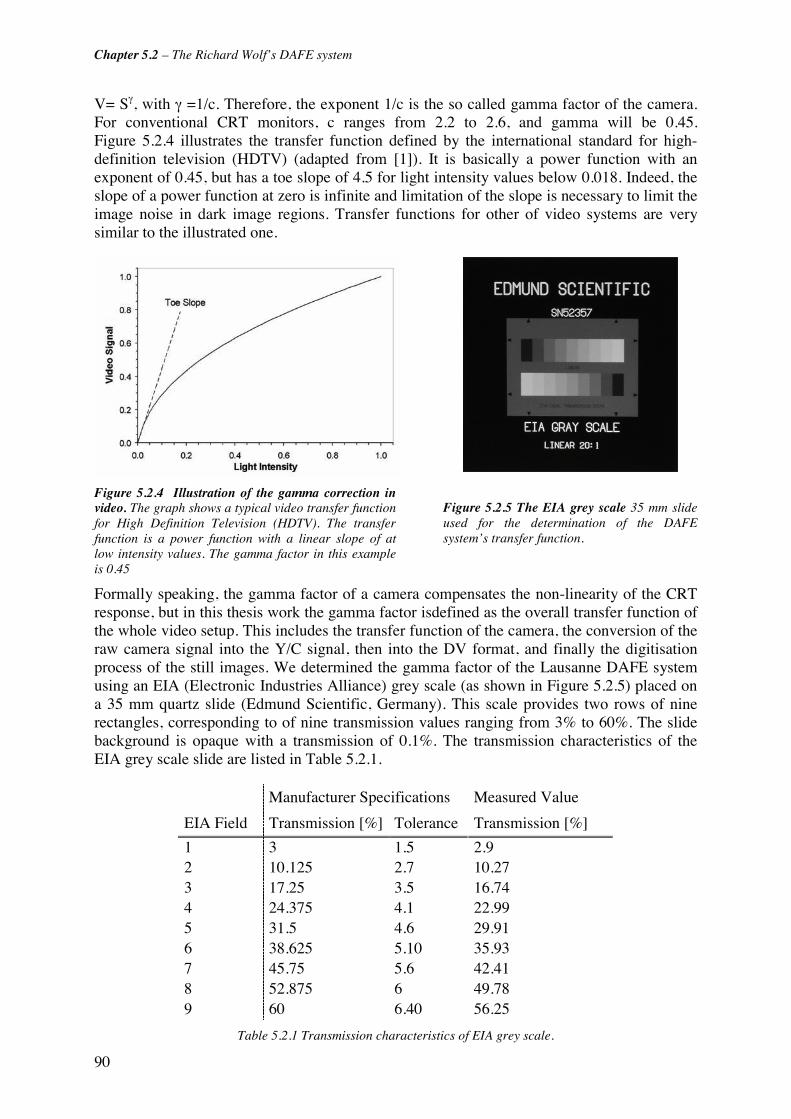
Chapter 5.2 – The Richard Wolf’s DAFE system
90
V= Sγ, with γ =1/c. Therefore, the exponent 1/c is the so called gamma factor of the camera. For conventional CRT monitors, c ranges from 2.2 to 2.6, and gamma will be 0.45. Figure 5.2.4 illustrates the transfer function defined by the international standard for high-definition television (HDTV) (adapted from [1]). It is basically a power function with an exponent of 0.45, but has a toe slope of 4.5 for light intensity values below 0.018. Indeed, the slope of a power function at zero is infinite and limitation of the slope is necessary to limit the image noise in dark image regions. Transfer functions for other of video systems are very similar to the illustrated one.
Figure 5.2.4 Illustration of the gamma correction in video. The graph shows a typical video transfer function for High Definition Television (HDTV). The transfer function is a power function with a linear slope of at low intensity values. The gamma factor in this example is 0.45
Figure 5.2.5 The EIA grey scale 35 mm slide used for the determination of the DAFE system’s transfer function.
Formally speaking, the gamma factor of a camera compensates the non-linearity of the CRT response, but in this thesis work the gamma factor isdefined as the overall transfer function of the whole video setup. This includes the transfer function of the camera, the conversion of the raw camera signal into the Y/C signal, then into the DV format, and finally the digitisation process of the still images. We determined the gamma factor of the Lausanne DAFE system using an EIA (Electronic Industries Alliance) grey scale (as shown in Figure 5.2.5) placed on a 35 mm quartz slide (Edmund Scientific, Germany). This scale provides two rows of nine rectangles, corresponding to of nine transmission values ranging from 3% to 60%. The slide background is opaque with a transmission of 0.1%. The transmission characteristics of the EIA grey scale slide are listed in Table 5.2.1.
Manufacturer Specifications Measured Value
EIA Field Transmission [%] Tolerance Transmission [%]
1 3 1.5 2.9 2 10.125 2.7 10.27 3 17.25 3.5 16.74 4 24.375 4.1 22.99 5 31.5 4.6 29.91 6 38.625 5.10 35.93 7 45.75 5.6 42.41 8 52.875 6 49.78 9 60 6.40 56.25
Table 5.2.1 Transmission characteristics of EIA grey scale.

Chapter 5.2 – The Richard Wolf’s DAFE system
91
Variations smaller than 4% were observed between upper and lower rows. The slide was placed at one port of a 19 inches (about 48 cm) integrating sphere (Labsphere Inc., USA). White light from the DAFE light source was injected into the sphere through an other port in order to ensure homogenous illumination of the EIA scale. The DAFE camera head equipped with a conventional unfiltered objective was positioned behind the EIA scale. The camera/scale distance was adjusted to adapt the field of view to the whole slide. The camera was operated sequentially in the different AGC modes (see section below for more details on the AGC). The light intensity was tuned so that the detected signal from the EIA chart did not saturate the CCD. Video images of the EIA scale were recorded using the standard video recording chain. Digitisation and image analysis were performed following the standard procedure described above.
Areas of identically sizes were selected on the images from each field of the EIA scale, and the RGB mean intensity levels were computed. All values were background-subtracted. The obtained RGB values from the nine transmission levels obtained with the AGC set to "low" are plotted in Figure 5.2.6. All transmission values were normalised to the maximal transmission of the EIA scale. The points were fitted by a γxaxf ⋅=)( power function with the exponent corresponding to the system's gamma factor. The fitted power functions nicely superposed for all colour channels. The data and curve fits obtained with the AGC set to "off" and "high" perfectly align with those shown in Figure 5.2.6. The mean value of the gamma factor computed for the three colour channels and the three AGC settings was 0.64 ± 0.01. All intensity values in this thesis computed from DAFE images were corrected for this gamma factor.
AGC Low0
50
100
150
200
250
0.0 0.2 0.4 0.6 0.8 1.0
Normalised EIA Transmission [a.u.]
8-b
it R
GB
Inte
nsi
ty L
evel
R G B
Figure 5.2.6. Response of the DAFE system operated with the AGC set on “low”. The measured RGB intensity levels are reported vs. the normalised transmission of the EIA grey scale. The curve fits revealed a mean value of 0.64 for the gamma factors of the RGB channels. This factor is independent of the camera AGC settings.
Spectral Crosstalk In a 3 CCD video camera, each of the image spectral components (usually red, green and blue or RGB) is detected by a separate CCD detector (see Appendix for more detailed information). The overlap of the spectral detection regions of the 3 separate colour channels is referred to as crosstalk. It is essential for a natural reproduction of the initial colours perceived from the object on the monitor. Nevertheless, the crosstalk will bias the results derived from

Chapter 5.2 – The Richard Wolf’s DAFE system
92
quantitative chromatic image analysis. Light of wavelengths within the crosstalk regions will be detected by both involved colour channels.
The crosstalks of the DAFE camera were accessed by analysing the RGB components of a reference image excited with a monochromatic light source at different wavelengths. For this purpose, the white light source from the DAFE unit was filtered by a Zeiss quartz prism monochromator (Zeiss M4 QIII, Karl Zeiss, Germany) and projected on a matted glass plate. The monochromatic beam image on the glass plate was detected with the DAFE camera through 0° Hopkins telescope and recorded with the DV recorder. The monochromator was tuned from 400 nm to 660 nm in steps of 10 nm. Steps were reduced to 5 nm, within the potential crosstalk regions (480 nm - 530 nm and 570 nm - 610 nm),.
Image digitisation and analysis was performed as described in the previous section. RGB intensity levels were corrected for the image background and the system's gamma factor. Figure 5.2.7 shows the intensity levels of the RGB channels. The values were obtained with the filtered DAFE objective mounted on the camera head. Values are thus presented for wavelengths longer than 470 nm only, and they were normalised with the B intensity level at 480 nm. The following detection ranges for the colour channels were deduced from these measurements: 470 nm - 520 nm (blue), 490 nm - 590 nm (green), and 560 nm - 650 nm (red). When the camera is used with an unfiltered objective, the lower detection limit of the blue channel is 400 nm (data not shown). Two crosstalk regions were identified: between 490 nm and 520 nm for the B and G channels, and between 560 nm and 590 nm for the G and R channels. Assuming that an incoming light (100%) is distributed between two channels, the resulting reflectance of the intensitiy detected by both channels are shown in Figure 5.2.8 (B and G) and Figure 5.2.9 (G and R). It can easily be seen that the crosstalk area between B and G is larger than between G and R. This is likely to be due to the high intensification of the blue channel resulting from the AWB process performed with the filtered objective.
The crosstalk effect has to be taken into account when performing chromatic analysis of the DAFE images.
0.0
0.2
0.4
0.6
0.8
1.0
450 475 500 525 550 575 600 625 650
Wavelength [nm]
Nor
mal
ised
Inte
nsity
Lev
el Red Channel
Green Channel
Blue Channel
Figure 5.2.7 Colour channel response of the DAFE camera. All intensity levels were normalised relativ to the maximal value in the blue channel. It should be noted that the automatic white balancing was performed with the filtered DAFE objective, resulting in a strong amplification of the blue channel signal. The crosstalk between these channels is significant.

Chapter 5.2 – The Richard Wolf’s DAFE system
93
0
20
40
60
80
100
120
460 480 500 520 540 560
Detected Wavelength [nm]
Rel
ativ
e lig
ht d
istr
ibut
ion
[%]
G ChannelB Channel
0
20
40
60
80
100
120
500 520 540 560 580 600 620 640
Detected Wavelength [nm]
Rel
ativ
e lig
ht d
istr
ibut
ion
[%]
G ChannelR Channel
Automatic shutter control and automatic gain control The intensity of the light collected by the endoscopes’ objective vary dramatically because of the tube-like anatomy and changing dimensions of the bronchi. Moreover, the autofluorescence emission from the bronchial tissue is by 3 to 4 orders of magnitude smaller than the signal obtained during white light reflectance bronchoscopy [2-4]. Consequently, the DAFE system is equipped with two independent intensity control circuits to compensate the image brightness fluctuations, namely the automatic shutter control and the automatic gain control (AGC).
The camera controller automatically adjusts the brightness of endoscopic image to prevent saturated or very dark images. This adjustment is performed by varying the CCD exposure time. The term "shutter control" refers to devices with a mechanical shutter regulating the exposure. In the DAFE camera the image brightness is measured in real-time at the centre of the field of view. The upper limit of the exposition time is given by the number of images (frames) to be acquired per unit of time. For instance, 25 fps (frames per second) are displayed in the PAL video standard . The frame rate might be reduced to 12.5 fps, but below this value, movements will be perceived as jerky.
The automatic shutter control is sufficient to correct image intensity fluctuations during conventional white light illumination, but it can not correct for the low AF intensities detected during examination in the DAFE mode. Therefore, additional activation of the AGC is required. The AGC control is a 3-step (off, low, high) electronic signal amplification. In the DAFE mode, an activation of the AGC brightens the AF image at the level of white light reflectance images. However, AGC comes along with a significant increase of the image background. Subtracting the image background from the intensity values prior to image analysis compensates this effect.
AGC is manually set, whereas the settings of the automatic shutter control cannot be tracked. Consequently, image analysis of the DAFE images only allows to compare intensity ratios between channels, but no absolute intensity levels in individual channels can be measured.
Figure 5.2.9 Crosstalk between the green (G) and red (R) colour channel. The figure shows the distribution of the light intensity signal on the two colour channels for different wavelength colour channels in function of the wavelength.
Figure 5.2.8 Crosstalk between the blue (B) andgreen (G) colour channel. The figure shows the distribution of the light intensity signal on the twocolour channels for different wavelength colour channels in function of the wavelength.

Chapter 5.2 – The Richard Wolf’s DAFE system
94
5.2.5 References [1] C. A. Poynton, "A technical introduction to digital video". John Wiley & Sons, Inc. ed, John Wiley & Sons, Inc., New York (1996)
[2] G. Wagnières, Photochimiotherapie et photodetection du cancer a l'aide de photosensibilateurs ou de colorants fluorescents in Département de Physique. 1992, EPFL: Lausanne.
[3] G. Wagnières, A. P. Studzinski, D. R. Braichotte, P. Monnier, C. Depeursinge, A. Châtelain and H. Van Den Bergh, "Clinical imaging fluorescence apparatus for the endoscopic photodetection of early cancers by use of Photofrin II". Applied Optics, 36(22): p. 5608-5620 (1997).
[4] G. Wagnières, A. P. Studzinski and H. van den Bergh, "An endoscopic fluorescence imaging system for simultaneaous visual examination and photodetection of cancers". Rev. of Scientific Instruments, 68(1): p. 203-212 (1997).
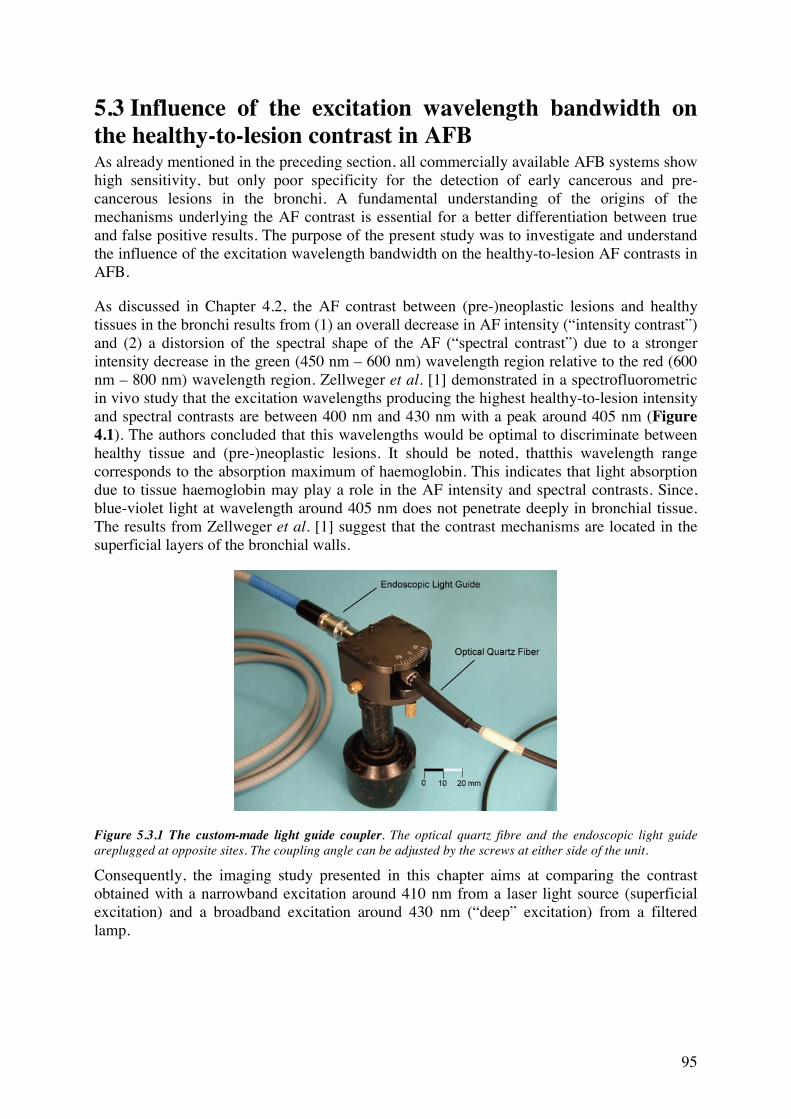
95
5.3 Influence of the excitation wavelength bandwidth on the healthy-to-lesion contrast in AFB As already mentioned in the preceding section, all commercially available AFB systems show high sensitivity, but only poor specificity for the detection of early cancerous and pre-cancerous lesions in the bronchi. A fundamental understanding of the origins of the mechanisms underlying the AF contrast is essential for a better differentiation between true and false positive results. The purpose of the present study was to investigate and understand the influence of the excitation wavelength bandwidth on the healthy-to-lesion AF contrasts in AFB.
As discussed in Chapter 4.2, the AF contrast between (pre-)neoplastic lesions and healthy tissues in the bronchi results from (1) an overall decrease in AF intensity (“intensity contrast”) and (2) a distorsion of the spectral shape of the AF (“spectral contrast”) due to a stronger intensity decrease in the green (450 nm – 600 nm) wavelength region relative to the red (600 nm – 800 nm) wavelength region. Zellweger et al. [1] demonstrated in a spectrofluorometric in vivo study that the excitation wavelengths producing the highest healthy-to-lesion intensity and spectral contrasts are between 400 nm and 430 nm with a peak around 405 nm (Figure 4.1). The authors concluded that this wavelengths would be optimal to discriminate between healthy tissue and (pre-)neoplastic lesions. It should be noted, thatthis wavelength range corresponds to the absorption maximum of haemoglobin. This indicates that light absorption due to tissue haemoglobin may play a role in the AF intensity and spectral contrasts. Since, blue-violet light at wavelength around 405 nm does not penetrate deeply in bronchial tissue. The results from Zellweger et al. [1] suggest that the contrast mechanisms are located in the superficial layers of the bronchial walls.
Figure 5.3.1 The custom-made light guide coupler. The optical quartz fibre and the endoscopic light guide areplugged at opposite sites. The coupling angle can be adjusted by the screws at either side of the unit.
Consequently, the imaging study presented in this chapter aims at comparing the contrast obtained with a narrowband excitation around 410 nm from a laser light source (superficial excitation) and a broadband excitation around 430 nm (“deep” excitation) from a filtered lamp.

Chapter 5.3 – Influence of the excitation wavelength bandwidth on the healthy-to-lesion contrast
96
5.3.1 Materials and Methods The modified DAFE system The comparison between the two excitation modes was performed in a clinical study with the Wolf DAFE system. The system is described in detail in Chapter 5.2. The light delivery unit of the system was slightly modified for this study. The blue-violet excitation light (430 nm ± 40 nm) from the DAFE light source served as the broadband excitation.
The narrowband excitation was realised by using light from a laser instead of from the endoscopic light source. Light from a Krypton (Kr+) laser (Spectra Physics Type 171, Spectra Physics, USA) was coupled into a 400 μm optical quartz fibre (extension fibre) equipped with 2 SMA connectors. The laser was operated in the multi-line mode at 407 nm and 413 nm and the maximal laser output power was 2.5 W. The light from the extension fibre was coupled into the endoscopic light guide using a custom made fibre coupler. A special coupling system was necessary to accommodate the different guide diameters and numerical apertures (NA) of the two devices to each other for best light transmission efficiency. While the extension fibre had a NA of 0.4 and a diameter of 400 μm, the liquid light guide had a NA of 0.53 and a diameter of 4 mm. The coupler itself consisted of a black box having a SMA plug on one side and custom made plug for the light guide on the other side, as shown in Figure 5.3.1. The part containing the SMA plug could be rotated in the x-y plane around a central axis in order to change the injection angle between the extension fibre and the light guide. Perpendicular injection resulted in a “forward peaked” light output at the distal end of the endoscopic light guide and the bronchoscope, thus leading to an inhomogenous illumination of the endoscopic site. A slight rotation of the SMA connector around the central axis of the black box resulted in a bell-shaped light distribution at the distal tip of the bronchoscope which fits the angular distribution of the illumination with the DAFE light source.
The endoscopic procedure The clinical study took place at the ENT department of the CHUV University Hospital in Lausanne. Autofluorescence bronchoscopies with the broadband and narrowband excitations were performed in 3 patients with known endobronchial pre-neoplastic, but non-invasive lesions. All the lesions had been detected during former standard AFB examinations and had been confirmed by biopsy and histopathologic analysis. Bronchoscopy was performed under total anesthesia using rigid Hopkins optics. Typical excitation light intensities at the distal tip of the endoscope optics were 110 mW for the broadband excitation from the DAFE light source and 70 mW for the narrowband excitation from the Kr+ laser. The lesion areas were at first localised using conventional WLB and AFB. The light guide was then unplugged from the endoscopic light source and connected to the custom fibre coupler. Bronchoscopic examination of the lesions was repeated with the excitation light delivered from the Kr+ laser. The whole endoscopic procedure was recorded on a DV tape for analysis. All AF+ sites were biopsied and sent for histopathologic analysis. Carcinoma in situ was confirmed in 2 patients and moderate dysplasia was found in 1 patient.
Image analysis The image analysis procedure was already described in Chapter 5.2. Still images showing both tumour and adjacent normal tissue were digitised in the 24-bit RGB mode using an IEEE1394 interface between the DV recorder and a PC. For each patient, typically two images obtained with the broadband excitation (“broadband images”) and two corresponding images obtained with the narrowband excitation (“narrowband images”), as well as a single WL image were digitised. Attention was paid to choose the broadband, narrowband and WL images showing the lesion and its normal surrounding under the same view. The intensity levels in the green channel of the images were computed from selected areas on the
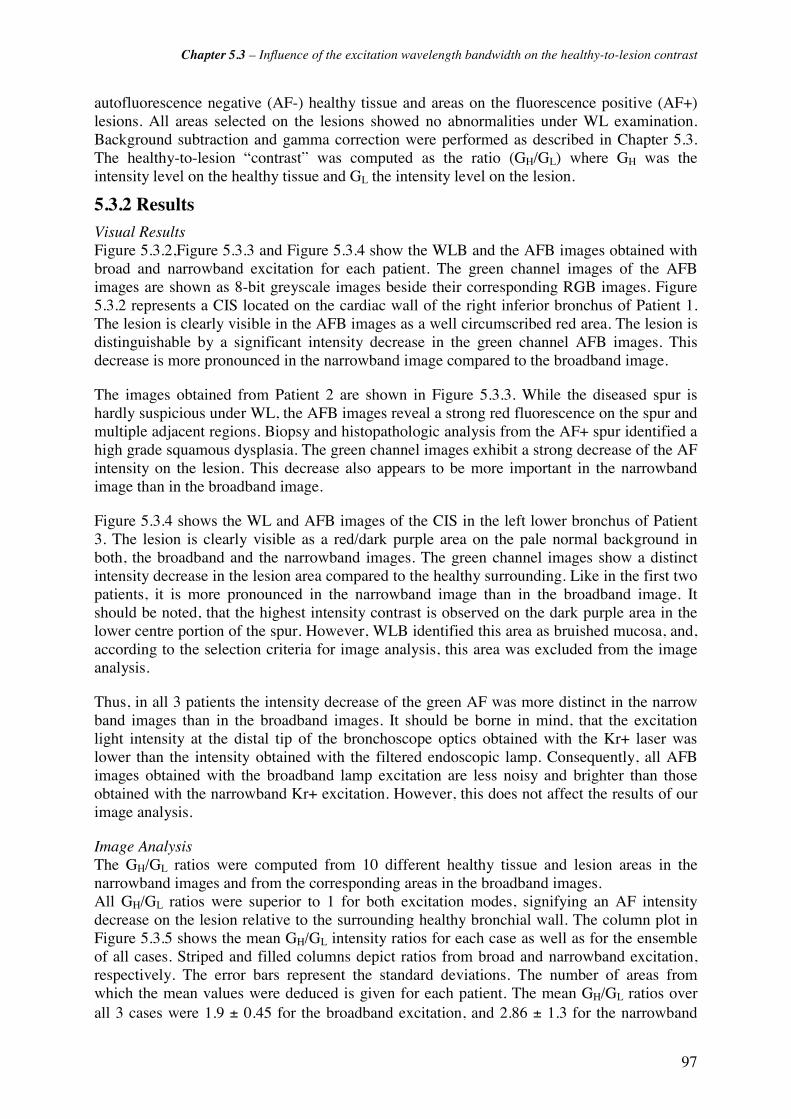
Chapter 5.3 – Influence of the excitation wavelength bandwidth on the healthy-to-lesion contrast
97
autofluorescence negative (AF-) healthy tissue and areas on the fluorescence positive (AF+) lesions. All areas selected on the lesions showed no abnormalities under WL examination. Background subtraction and gamma correction were performed as described in Chapter 5.3. The healthy-to-lesion “contrast” was computed as the ratio (GH/GL) where GH was the intensity level on the healthy tissue and GL the intensity level on the lesion.
5.3.2 Results Visual Results Figure 5.3.2,Figure 5.3.3 and Figure 5.3.4 show the WLB and the AFB images obtained with broad and narrowband excitation for each patient. The green channel images of the AFB images are shown as 8-bit greyscale images beside their corresponding RGB images. Figure 5.3.2 represents a CIS located on the cardiac wall of the right inferior bronchus of Patient 1. The lesion is clearly visible in the AFB images as a well circumscribed red area. The lesion is distinguishable by a significant intensity decrease in the green channel AFB images. This decrease is more pronounced in the narrowband image compared to the broadband image.
The images obtained from Patient 2 are shown in Figure 5.3.3. While the diseased spur is hardly suspicious under WL, the AFB images reveal a strong red fluorescence on the spur and multiple adjacent regions. Biopsy and histopathologic analysis from the AF+ spur identified a high grade squamous dysplasia. The green channel images exhibit a strong decrease of the AF intensity on the lesion. This decrease also appears to be more important in the narrowband image than in the broadband image.
Figure 5.3.4 shows the WL and AFB images of the CIS in the left lower bronchus of Patient 3. The lesion is clearly visible as a red/dark purple area on the pale normal background in both, the broadband and the narrowband images. The green channel images show a distinct intensity decrease in the lesion area compared to the healthy surrounding. Like in the first two patients, it is more pronounced in the narrowband image than in the broadband image. It should be noted, that the highest intensity contrast is observed on the dark purple area in the lower centre portion of the spur. However, WLB identified this area as bruished mucosa, and, according to the selection criteria for image analysis, this area was excluded from the image analysis.
Thus, in all 3 patients the intensity decrease of the green AF was more distinct in the narrow band images than in the broadband images. It should be borne in mind, that the excitation light intensity at the distal tip of the bronchoscope optics obtained with the Kr+ laser was lower than the intensity obtained with the filtered endoscopic lamp. Consequently, all AFB images obtained with the broadband lamp excitation are less noisy and brighter than those obtained with the narrowband Kr+ excitation. However, this does not affect the results of our image analysis.
Image Analysis The GH/GL ratios were computed from 10 different healthy tissue and lesion areas in the narrowband images and from the corresponding areas in the broadband images. All GH/GL ratios were superior to 1 for both excitation modes, signifying an AF intensity decrease on the lesion relative to the surrounding healthy bronchial wall. The column plot in Figure 5.3.5 shows the mean GH/GL intensity ratios for each case as well as for the ensemble of all cases. Striped and filled columns depict ratios from broad and narrowband excitation, respectively. The error bars represent the standard deviations. The number of areas from which the mean values were deduced is given for each patient. The mean GH/GL ratios over all 3 cases were 1.9 ± 0.45 for the broadband excitation, and 2.86 ± 1.3 for the narrowband
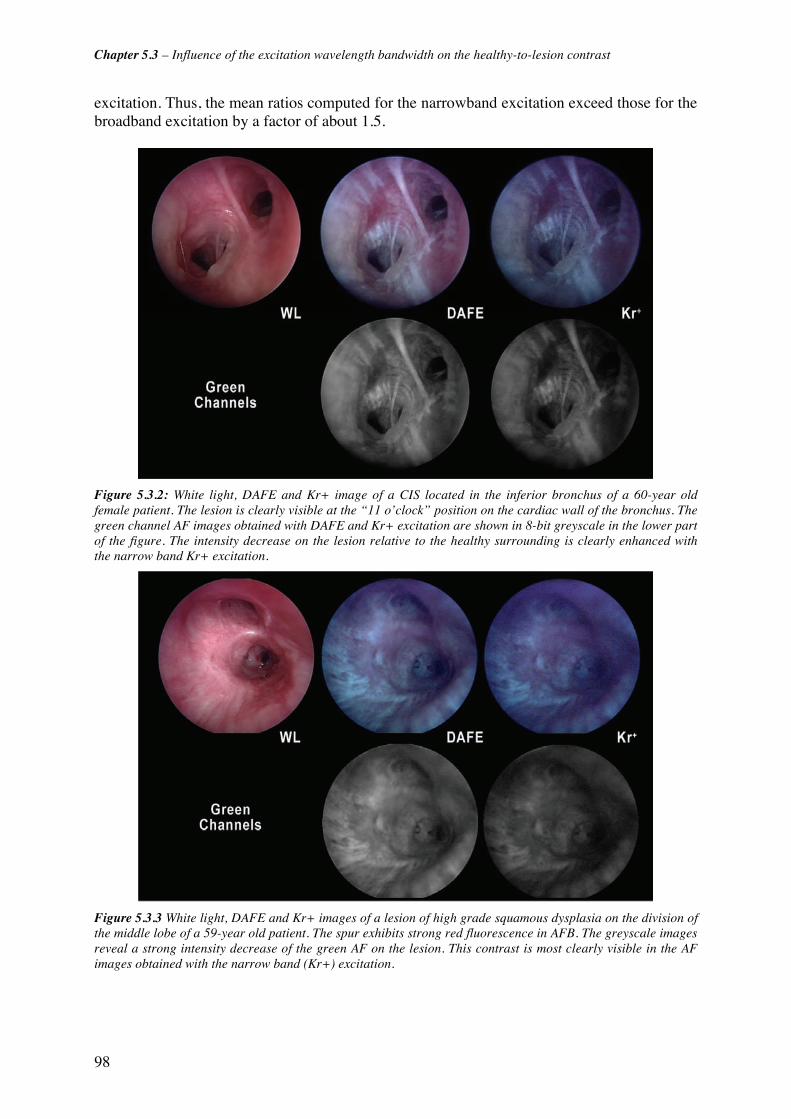
Chapter 5.3 – Influence of the excitation wavelength bandwidth on the healthy-to-lesion contrast
98
excitation. Thus, the mean ratios computed for the narrowband excitation exceed those for the broadband excitation by a factor of about 1.5.
Figure 5.3.2: White light, DAFE and Kr+ image of a CIS located in the inferior bronchus of a 60-year old female patient. The lesion is clearly visible at the “11 o’clock” position on the cardiac wall of the bronchus. The green channel AF images obtained with DAFE and Kr+ excitation are shown in 8-bit greyscale in the lower part of the figure. The intensity decrease on the lesion relative to the healthy surrounding is clearly enhanced with the narrow band Kr+ excitation.
Figure 5.3.3 White light, DAFE and Kr+ images of a lesion of high grade squamous dysplasia on the division of the middle lobe of a 59-year old patient. The spur exhibits strong red fluorescence in AFB. The greyscale images reveal a strong intensity decrease of the green AF on the lesion. This contrast is most clearly visible in the AF images obtained with the narrow band (Kr+) excitation.
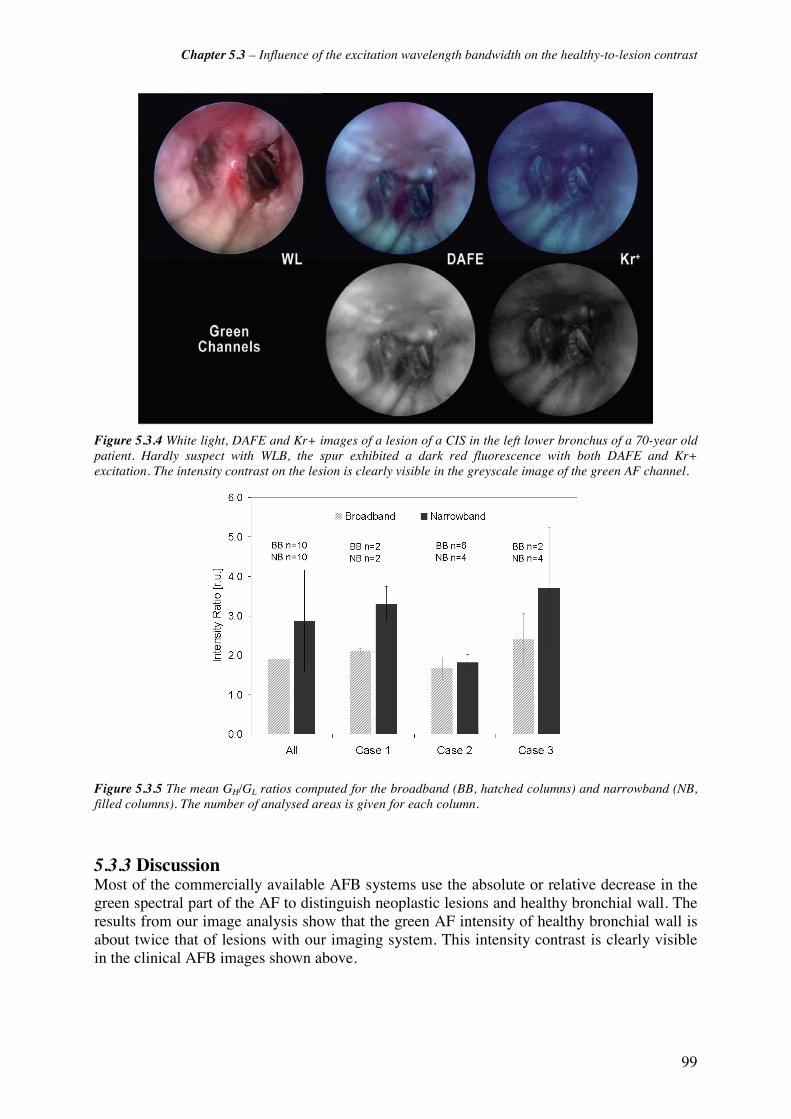
Chapter 5.3 – Influence of the excitation wavelength bandwidth on the healthy-to-lesion contrast
99
Figure 5.3.4 White light, DAFE and Kr+ images of a lesion of a CIS in the left lower bronchus of a 70-year old patient. Hardly suspect with WLB, the spur exhibited a dark red fluorescence with both DAFE and Kr+ excitation. The intensity contrast on the lesion is clearly visible in the greyscale image of the green AF channel.
Figure 5.3.5 The mean GH/GL ratios computed for the broadband (BB, hatched columns) and narrowband (NB, filled columns). The number of analysed areas is given for each column.
5.3.3 Discussion Most of the commercially available AFB systems use the absolute or relative decrease in the green spectral part of the AF to distinguish neoplastic lesions and healthy bronchial wall. The results from our image analysis show that the green AF intensity of healthy bronchial wall is about twice that of lesions with our imaging system. This intensity contrast is clearly visible in the clinical AFB images shown above.
Chapter 5.3 – Influence of the excitation wavelength bandwidth on the healthy-to-lesion contrast
100
Comparison with Data from Zellweger In their spectrofluorometric study, Zellweger et al. [2] quantified the ratios of the green AF between healthy bronchial wall and neoplastic lesions for different excitation wavelengths. The resulting graphic showed a sharp increase in the green intensity ratios at 410 nm excitation wavelength. In the context of our imaging study, it is interesting to relate our results to those from Zellweger et al. For this purpose, we extracted GH/GL ratios from the data given in [2] corresponding to the wavelength range of our broad- and narrowband excitation. More precisely, we computed the mean ratios from Zellweger's data over (1) the wavelength interval between 390 nm and 470 nm (broadband excitation) and (2) for 410 nm. According to these data, the GH/GL ratio for a narrowband excitation corresponding to that used in our study should exceed that of a broadband excitation by a factor of about 1.6. In our imaging study the mean GH/GL intensity ratio for the broadband excitation exceeded that of the narrowband excitation by a factor 1.5. Thus, there is good agreement between the results in the two studies.
Consequences on the AF Mechanisms The fact that the intensity contrast between the healthy bronchial wall and neoplastic lesions increases at narrowband excitation around 410 nm is very interesting for the understanding of the AF contrast mechanisms. As already mentioned in Chapter 4, these contrasts are likely to be due to (1) an angiogenesis and the associated changes in the blood content in the subepithelial layers of the bronchial wall, and (2) the thickening of the epithelium. First of all we can draw conclusions on the depth at which the contrast mechanisms are localised in the bronchial wall. According to the data from Qu et al. [3, 4], the main contribution of bronchial AF arises from the upper part of the sub-epithelial layer while no significant AF is observed from the superficial epithelium.
It is interesting to note, that the uppermost sub-epithelial zone below the basement membrane, the lamina propria, undergoes characteristic changes in vascularisation during the cancerisation process. The morphometric studies from Fisseler-Eckhoff et al. [5], Fontanini et al. [6] and others (see Chapter 4) have shown an increase in the microvessel densities (MVD), resulting from angiogenesis [7, 8], in pre-neoplastic and neoplastic lesions relative to healthy mucosa and submucosa. This increase in the MVD preferentially occur in the vicinity of the basement membrane. Hence, the blood concentration is higher in this layer of the (pre-)neoplastic bronchial lesions than in its healthy surrounding. Indeed, the increase in the sub-epitelial blood contents is invoked by several authors as cause for the healthy-to-lesion intensity contrast [3, 9]. Due to the light absorption properties of blood (see Figure 4. ), the blue-violet excitation light used in AFB will be strongly absorbed by the vascular blood in the superior layers of the submucosa, hence, being no longer available for the AF excitation. This absorption will be stronger in the (pre-)neoplastic lesions showing an increase in the MVD and the blood contents close to the basement membrane than in healthy tissues. Hence, the results presented in this study indicate, that the tissue blood contents and angiogenesis play a major role in the intensity contrast observed between (pre-)neoplastic and healthy bronchial tissue.
It should be noted, that the vascular blood also absorbs the AF generated in the sub-epithelial layers .As for the absorption of the excitation light, this effect is more important in (pre-)neoplastic lesions than in healthy bronchial wall and will consequently result in an additional amplification of the intensity contrast. However, the shielding effect will rather be independent of the excitation bandwidth.
Chapter 5.3 – Influence of the excitation wavelength bandwidth on the healthy-to-lesion contrast
101
Limited Data Set Though our results clearly show an increase in the intensity contrast with the line-shaped wavelength excitation relative to the broadband one, the data show noticeable statistical variations. These are mainly due to the (1) the low number of measurements, (2) the images available for analysis and (3) the intra-case errors. The limited number of cases in our study results from the very special selection criteria for the patients. Our study aimed to compare both broadband and narrowband excitation on early but non-invasive neoplastic lesions. The prevalence of second primary tumours in the lung in patients with ENT cancer is inferior to 10% [10-13]. Within the 3-years period of our study, only 3 cases in the ENT department of the CHUV University Hospital fulfilled the inclusion criteria. Additionally, the endoscopic images recorded from the bronchoscopic examinations were not always suited for proper image analysis. As already mentioned above, these images had to show AF+ lesions and AF- healthy bronchial wall within the same view and in the same image plane. This was not always possible due to anatomical reasons and the location of the lesion. One example for the difficulties related to anatomy can be seen in the images of Patient 2 (Figure 5.3.4). The AFB images show the extensive moderate dysplasia on the spur with multiple AF+ satellite lesions all-over the field of view. Autofluorescence negative areas are small and do not always lay within the lesion area's image plane. Moreover, the areas classified as "AF-" in this patient show less contrast to the AF+ areas than their counterparts in the other two patients, resulting in a lower GH/GL ratio. The computed GH/GL ratio for narrowband excitation exceeds those for broadband excitation by only a factor 1.1 in this patient. This value is much smaller than the corresponding factors of 1.7 and 1.6 computed for the Patients 1 and 3, respectively. The example of Patient 2 illustrates the main causes for the inter-case variations in our study, namely (1) the differences in the overall AF intensities between individuals [2], (2) the differences in the GH/GL ratios between individuals [1, 14] and (3) the geometry of the endoscopic site, namely the distribution AF+ and AF- areas within the field of view.
Intra-case fluctuations The last point is also of importance for the intra-patient variations. Within a given AF image, the computed intensity values are sensitive to the distance between endoscope and tissue, the angle of view, and the morphology of the tissue surface. Following the r-square law of the intensity-distance correlation, the AF signal from a tissue area close to the endoscopic optics will be detected with a 4 times higher intensity than that of an area located at a twice longer distance. Changes in the viewing angle might also induce a wavelength shift in the detected AF signal, thus influencing the intensity values. Consequently, the GH/GL ratios strongly depend on the relative distance between the selected AF+ and AF- areas.
Morphologic structures such as the longitudinal stripe-like structure visible in the bronchial wall, airway crypts (invaginations in the bronchial wall) or ring-shaped convexities due to cartilages in the upper bronchi can, among others, influence the AF intensity values. Unfortunately, for technical and anatomical reasons, it is not always feasible to observe healthy mucosa and lesions from the same distance and avoid the aforementioned morphologic sources of error. However, paying attention to selecting images containing AF+ and AF- areas in the same or close image planes, can significantly decrease the intra-case variations.
Remarks on image analysis and backscattered red light A short notice should be done regarding the data processing and image analysis used in this study. In other reports dealing with spectral image analysis [1, 14-17] we employed the normalised red (R) to green (G) intensity ratio (R/G), i.e. the (R/G) ratio on lesions relative to its value on the neighbouring healthy bronchial wall, to gain information on the spectral AF differences between the two tissue states. However, in this study only the green intensity

Chapter 5.3 – Influence of the excitation wavelength bandwidth on the healthy-to-lesion contrast
102
ratios were investigated for several reasons. First of all, the DAFE excitation source used in this study emitted a certain amount of red light in addition to the blue-violet AF excitation. During standard DAFE bronchoscopy, the backscattered portion of this red light is detected, increasing the lesion-to-healthy spectral contrast, as described in [16]. Though the amount of red light can be deliberately changed, it is not possible, to fully omit all red light from the DAFE images. As a consequence, the red colour intensity of the AF images not only corresponds to the tissue AF intensity, but also show a contribution from this red backscattered light. However, it should be noted that the amount of red light is much larger when the DAFE system is operated in standard clinical conditions. This results in an elimination of the healthy-to-lesion AF intensity contrast in the red part of the spectrum, as described in Chapter 5.1. Thus, the changes in the green spectral region reported in the present study not only correspond to an intensity contrast but also to the healthy-to-lesion chromatic contrast, when the DAFE system is used in standard conditions.
Outlook In future imaging studies, attention should be paid to fully block the red light produced by the DAFE light source to enable comparison of the healthy-to-lesion contrast observed in the red part of the spectrum This approach will enable to get interesting information on the mechanisms responsible for the healthy-to-lesion spectral contrasts. For this purpose it might be necessary to use an alternative excitation filter in the DAFE light source, having the same blue-violet transmission properties that the actual one, but having no additional transmission in the red wavelengths range. Since the flip-flop filter mounted in the DAFE light source is designed for the sequential use of up to 3 excitation modes (2 AF excitations and 1 WL illumination), such a modification can easily be performed.
Most commercially available AFB imaging system use the light from filtered halogen lamps for AF excitation [14, 18-21]. Endoscopic halogen light sources are available at relative high powers and are cost-effective. Moreover, the same light source can be used for blue-violet AF excitation and the WL illumination for conventional WLB. However, the use of filtered halogen WL sources does not allow narrowband filtering for intensity reasons. Blue-violet diode laser systems delivering sufficient light intensities for rigid optics or fibre based AFB, are not available at the present time. However, this situation will change in the near term future. In addition, the use of flexible videobronchoscopes dramatically increased in the last years and the implementation of the technology in AFB can be anticipated. Since these CCD-tipped flexible bronchoscopes have a much higher light sensitivity than conventional fibreoptics, blue-violet diode lasers emitting at 405 nm are highly interesting for narrowband excitation AFB, as they combine small size, handiness and sufficient light power for videobronchoscpy. Moreover, they can easily be combined or even integrated into endoscopic WL sources.
Summary In summary, our results presented in this clinical study demonstrate that a narrowband excitation around 415 nm increases the intensity contrast between healthy bronchial wall and neoplastic lesions in AFB. This is in good agreement with the findings reported by Zellweger et al. [1]. Since the excitation wavelength producing the largest intensity contrast is centred on the absoption peak of blood, the spatial distribution and concentration of sub-epithelial blood seem to play a key-role in this contrast. Thus, it is very likely that the neo-angiogenesis observed in the lamina propria and the submucosa of (pre-)neoplastic bronchial lesions play a key role in the AF intensity contrast mechanisms.

Chapter 5.3 – Influence of the excitation wavelength bandwidth on the healthy-to-lesion contrast
103
5.3.4 References [1] M. Zellweger, P. Grosjean, D. Goujon, P. Monnier, H. van den Bergh and G. Wagnières, "In vivo autofluorescence spectroscopy of human bronchial tissue to optimize the detection and imaging of early cancers," J Biomed Optics 6(1), 41-51 (2001)
[2] M. Zellweger, D. Goujon, R. Conde, M. Forrer, H. van den Bergh and G. Wagnières, "Absolute autofluorescence spectra of human healthy, metaplastic, and early cancerous bronchial tissue in vivo," Applied Optics 40(22), 3784-3791 (2001)
[3] J. Qu, C. MacAulay, S. Lam and B. Palcic, "Laser-induced fluorescence spectroscopy at endoscopy: tissue optics, Monte Carlo modeling and in vivo measurements," Optical Engineering 34(11), 3334-3343 (1995)
[4] J. Qu, C. MacAulay, S. Lam and B. Palcic, "Optical properties of normal and carcinomatous bronchial tissue," Applied Optics 33(31), 7397-7405 (1994)
[5] A. Fisseler-Eckhoff, D. Rothstein and K. M. Müller, "Neovascularization in hyperplastic, metaplastic and potentially preneoplastic lesions of the bronchial mucosa," Virchows Arch 429(2-3), 95-100 (1996)
[6] G. Fontanini, A. Calcinai, L. Boldrini, M. Lucchi, M. Mussi, C. A. Angeletti, C. Cagno, M. A. Tognetti and F. Basolo, "Modulation of neoangiogenesis in bronchial preneoplastic lesions," Oncol Rep 6(4), 813-817 (1999)
[7] R. L. Keith, Y. E. Miller, R. M. Gemmill, H. A. Drabkin, E. C. Dempsey, T. C. Kennesy, S. Prindiville and W. A. Franklin, "Angiogenic squamous dysplasia in bronchi of individuals at high risk for lung cancer," Clinical Cancer Research 6(5), 1616-1625 (2000)
[8] G. Bergers and L. Benjamin, "Tumorigenesis and the angiogenic switch.," Nat Rev Cancer 3(6), 401-410 (2003)
[9] R. Richards-Kortum and E. Sevick-Muraca, "Quantitative optical spectroscopy for tissue diagnosis," Annual Review of Physical Chemistry 47(1), 555-606 (1996)
[10] X. León, M. Quer, S. Diez, C. Orús, J. Burgués and A. López-Pousa, "Second neoplasm in patients with head and neck cancer," Head and Neck 21(3), 204-210 (1999)
[11] B. J. W. Venmans, T. J. M. Van Boxem, E. F. Smit, P. E. Postmus and T. G. Sutedja, "Bronchial intraepithelial neoplastic lesions in head and neck cancer patients: Results of autofluorescence bronchoscopy," Annals of Otology, Rhinology and Laryngology 110(7 I), 635-638 (2001)
[12] F. W.-B. Deleyiannis and D. B. Thomas, "Risk of lung cancer among patients with head and neck cancer," Otolaryngology - Head and Neck Surgery 116(6), 630-636 (1997)
[13] U. Atabek, M. A. Mohit-Tabatabai, S. Raina, B. F. Rush Jr. and K. S. Dasmahapatra, "Lung cancer in patients with head and neck cancer. Incidence and long-term survival," American Journal of Surgery 154(4), 434-438 (1987)
[14] D. Goujon, M. Zellweger, A. Radu, G. P., B.-C. Weber, H. van den Bergh, P. Monnier and G. Wagnières, "In vivo autofluorescence imaging of early cancers in the human tracheobronchial tree with a spectrally optimized system," J Biomed Optics 8(1), 17-25 (2003)
[15] P. Uehlinger, T. M. Glanzmann, J.-P. Ballini, A. Radu, T. Gabrecht, P. Monnier, H. van den Bergh and G. Wagnieres, "Time-resolved autofluorescence spectroscopy of the bronchial mucosa for the detection of early cancer: clinical results," submitted (2005)
[16] T. Gabrecht, T. Glanzmann, L. Freitag, B.-C. Weber, H. van den Bergh and G. Wagnières, "Optimised autofluorescence bronchoscopy using additional backscattered red light," submitted
[17] T. Gabrecht, S. Andrejevic-Blant, H. Van Den Bergh and G. Wagnières, "Blue-violet excited autofluorescence spectroscopy and imaging of normal and cancerous human bronchial tissue after formalin fixation," submitted

Chapter 5.3 – Influence of the excitation wavelength bandwidth on the healthy-to-lesion contrast
104
[18] M. Leonhard, "New incoherent autofluorescence/fluorescence system for early detection of lung cancer," Diagnostic and Therapeutic Endoscopy 5(2), 71-75 (1999)
[19] R. Adachi, T. Utsui and K. Furusawa, "Development of the autofluorescence endoscope imaging system," Diagnostic and Therapeutic Endoscopy 5(3), 65-70 (1999)
[20] M. Kakihana, K. Kyong Il., T. Okunaka, K. Furukawa, T. Hirano, C. Konaka, H. Kato and Y. Ebihara, "Early detection of bronchial lesions using system of autofluorescence endoscopy (SAFE) 1000," Diagnostic and Therapeutic Endoscopy 5(2), 99-104 (1999)
[21] F. J. F. Herth, A. Ernst and H. D. Becker, "Autofluorescence bronchoscopy - a comparison of two systems (LIFE and D-Light)," Respiration 70(395-398 (2003)

105
5.4 Blue-Violet Excited Autofluorescence Spectroscopy and Imaging of Normal and Cancerous Human Bronchial Tissue after Formalin Fixation Tanja Gabrecht1, Snezana Andrejevic-Blant2, Georges Wagnières1 1 Swiss Federal Institute of Technology (EPFL), Laboratory for Air and Soil Pollution, 1015 Lausanne, Switzerland 2 The CHUV University Hospital, Institute of Pathology, 1011 Lausanne, Switzerland
Abstract Autofluorescence (AF) imaging is a powerful tool for the detection of (pre-)neoplastic lesions in the bronchi. Several endoscopic imaging systems exploit the spectral and intensity contrast of AF between healthy and (pre-)neoplastic bronchial tissues, yet the mechanisms underlying these contrasts are poorly understood. In this report, the effect of formalin fixation on the human bronchi AF, hence on the contrast, was studied by spectrofluorometric point measurements and DAFE (Diagnostic AutoFluorescence Endoscopy) broad field imaging. Generally, formalin fixed samples have higher AF intensity than in vivo, whereas the emission spectral shape is similar. Additionally, the spectrofluorometric data showed a moderate decrease of the AF intensity on (pre-) neoplastic lesions relative to the healthy bronchial samples. However, this decrease was lower than that reported from in vivo measurements. Neither spectral measurements nor imaging revealed spectral contrast between healthy bronchial tissue and (pre-)neoplastic lesions in formalin. These results indicate that epithelial thickening and blood supply in the adjacent lamina propria are likely to play a key role in the generation of the AF contrast in bronchial tissues. Our results show that the AF contrast in bronchial tissues was significantly affected by standard, 10% buffered, formalin fixation. Therefore, these samples are not suited to AF contrast studies.
Keywords Autofluorescence bronchoscopy, spectrofluorometry, formalin fixation, AF contrast mechanisms
Submitted to Photochemistry Photobiology
Chapter 5.4 – Autofluorescence Spectroscopy and Imaging of … Bronchial Tissue after Formalin Fixation
106
Introduction Bronchial squamous cell carcinoma (SCC) remains the leading cause of cancer related death in the western world and its incidence is currently rising in Asia and in developing countries [3-5]. SCC develops in a gradual and stepwise fashion according to the World Health Organisation (WHO) grading of pre-neoplastic and early neoplasic lesions, from normal epithelium, to basal cell hyperplasia, squamous metaplasia, low grade (mild, moderate) dysplasia, high grade (severe) dysplasia, towards carcinoma in situ-(CIS) and micro-invasive carcinoma [6-8]. Over time, these early neoplastic forms progress to ultimately invasive squamous cell carcinoma. The bronchial wall has a distinctive layered structure involving mucosa (epithelium and lamina propria), muscularis mucosae, submucosa, cartilage or smooth muscle. Pre- or early neoplastic lesions are limited to the mucosa. Invasive carcinoma are characterised by an infiltration of the submucosa and deeper lying layers and are referred to as neoplasia. A carcinoma infiltrating the sub-mucosal layers less than 3 mm is considered as microinvasive. Early detection of the disease can drastically decrease mortality and morbidity[9-11]. The development of highly sensitive, non-invasive and cost efficient detection methods, permitting detection and diagnostic of early bronchial lesions [12-14] has been the subject of much research. The application of diagnostic autofluorescence bronchoscopy (AFB) has proven to be highly sensitive to early, non-invasive bronchial neoplasia , even for occult lesions invisible during conventional white light bronchoscopy (WLB) [15, 16]. Current commercially available AFB systems are all based on the visualisation of the spectral and intensity contrast of the tissue autofluorescence (AF) between normal bronchial tissue and neoplastic or pre-neooplastic lesions when excited with light in the blue-violet wavelength region [17]. In several clinical
studies AFB has shown a two fold improvement in sensitivity and specificity over WLB [15, 16, 18]. Nevertheless, the specificity of AFB remains limited [17-19]. However, the mechanisms underlying the spectral and intensity lesion-healthy contrast are barely understood. A better understanding should lead to dramatic improvements in the spectral and technical design of AF based imaging systems. To our best knowledge, few publications report the fundamental optical, spectral and AF properties of healthy bronchial tissue and neoplastic and pre-neoplastic lesions in the bronchi. Among those, only a limited number rely on spectrofluorometric in vivo studies [2, 20, 21], while the majority of the reported results have been obtained from ex vivo tissue samples. Ex vivo studies are more convenient than in vivo studies for spectral and imaging measurements of the AF of bronchial tissue. Constraints surrounding measurement set-up, dynamic measurement conditions, accessibility, and ethical criteria, are much more limited with ex vivo studies. In addition, access to tissue banks gives researchers rapid access to many more cases, which produces statistically more robust results. Fixation of samples in 10% buffered formalin is a common processing used in standard histopathological analysis, and allow retrospective analysis, even after long time intervals. However, discrepancies between the in vivo and ex vivo spectofluorometric properties of healthy and (pre-)neoplastic human bronchial mucosa and submucosa are found in the literature [22-25]. Since it is not clear if similar differences exist for spectral condition corresponding to AFB, we investigated the properties of bronchial AF in formalin fixed human bulk bronchial samples. Finally, the illumination-detection conditions are more easily controlled during ex vivo measurements than under in vivo conditions, producing more stable results. All in vivo studies based on fluorescence imaging report a spectral and intensity

Chapter 5.4 – Autofluorescence Spectroscopy and Imaging of … Bronchial Tissue after Formalin Fixation
107
contrast between healthy bronchial sites, (pre-)neoplasia and invasive tumors. In contrast, spectrofluorometric measurements performed under in vivo conditions produced controversial results. Using a fibre bundle probe placed 3.5 mm from the bronchial mucosa and exciting the AF at blue-violet wavelengths, Zellweger et al. [20] observed a strong intensity decrease and a change in the spectral composition between healthy bronchial wall and neoplastic or (pre-)neoplastic lesions . In contrast, when performing spectrofluorometric measurements with a fibre bundle probe in slight contact with the bronchial mucosa, Qu and coworkers [21] reported a significant intensity decrease, but no spectral distortion on CIS and neoplastic bronchial lesions compared to the healthy bronchial wall. Moreover, AFB imaging systems, like the DAFE (Diagnostic AutoFluorescence Endoscopy) system used in this study, are based on the detection of the spectral and intensity contrast to localise bronchial neoplasia and pre-neoplasia. The DAFE system, commercialised by Richard Wolf Endoscopes GmbH (Germany), uses a switchable filtered endoscopic light source for WL illumination and blue-violet AF excitation and detects the WL and AF images with a filtered endoscopic camera. The purpose of studying the spectrofluorometric properties of formalin fixed bronchial samples was two-fold: first, we aimed to determine the influence of the formalin fixation on the tissue AF and the suitability of this kind of tissue processing for spectrofluorometric measurements in a spectral domain corresponding to that of the DAFE system. Secondarily, our aim was to use these measurements to gather information on the mechanisms underlying the healthy-to-lesion contrast that can be visualised with the DAFE imaging systems.
Materials and Methods
Tissue samples and processing A total number of 26 formalin-fixed bronchial samples collected from 18
patients who underwent surgery for their widely invasive bronchial cancer were investigated in this study. The 6 mm thick samples of bronchial wall were fixed at least 14 hours in 10% buffered formalin-. After fixation, each sample was divid into two parts; one part was paraffin-embedded, cut in 5 μm thick slices and stained with hemotoxylen and eosin (H&E) for morphologic control analysis. The other part was stored in buffered formalin solution at room temperature, then used for the spectrofluorometric measurements. Various lesions and regions of healthy bronchial mucosa were marked on the control HE sections. A reference mark was set on the slide and on the bulk sample to facilitate sample orientation and precise localisation of different lesions and healthy mucosa during measurements. In most cases, between two and three independent bronchial samples were obtained from a patient (for future reference, each case corresponds to an individual patient). Each sample exhibited at least one region of healthy bronchial mucosa. The lesions were classified according to the WHO classification [26] into 5 categories as follows: 1) reactive changes including basal cell hyperplasia and squamous metaplasia, 2) mild dysplasia, 3)moderate dysplasia, 4) severe dysplasia /CIS, and micro-invasive carcinoma, and 5) widely invasive squamous cell carcinoma (SCC). Fourteen samples were identified as exhibiting one or more lesions corresponding to the categories 1-2 and 4-3. The number of lesions per category and the number of samples per case are summarised in Table 5.4.1. Healthy areas of the bronchial wall were identified in 25 samples originating from 17 patients. Metaplastic lesions were found in 2 samples from 2 patients. Mild and moderate dysplasia were identified in each1 sample from a unique case and CIS in 4 samples from 4 cases. Finally, invasive SCC was found in 10 samples from 6 patients. None of the samples showed hyperplastic or moderate dysplastic lesions.

Chapter 5.4 – Autofluorescence Spectroscopy and Imaging of … Bronchial Tissue after Formalin Fixation
108
The spectrofluorometer The spectrofluorometric measurements were performed with an optical fibre-based spectrofluorometer that consisted of a Xenon arc lamp as excitation source and filtered by a short pass filter. A dichroic mirror focused the light into a quartz optical fibre, which served as both excitation and detection fibre. The sample fluorescence was transmitted through a long pass filter and was analysed by the detection unit. Figure 5.4.1 illustrates this device in more detail. The light delivered by the 100 W Xe light source (LS) (Osram HBO 103 W/2, Osram, Germany) passed an electro-mechanical shutter (Uniblitz VS25, Vincent Associates, USA) (S) and entered the filter unit of an EPI fluorescence microscope (Nikon Y-FL, Nikon Corp., Japan). The EPI fluorescence microscope contained a set of removable neutral density filters (ND) and a set of excitation-emission filter cubes. The white light delivered by the light source was purified by an excitation band pass filter before being reflected by the dichroic mirror and focused into the 600 μm core diameter quartz optical fibre (Type SN EX-042, NA 0.37, Medlight SA, Switzerland) by a microscope objective (Nikon Plan Fluor,
10x, NA 0.3, Nikon Corp., Japan). The optical fibre was placed in gentle contact with the sample for the measurements. As already mentioned above, the same quartz optical fibre collected the fluorescence signal of the sample. The fluorescence signal was separated from the excitation light by the dichroic filter in the filter cube, and then filtered by a long pass filter installed in the filter cube. A second microscope objective (Nikon Plan Fuor, 10x, NA 03, Nikon Corp., Japan) focused the florescence signal into a 600 μm round-to-slit converting fibre bundle (7 fibres each 200 μm, Top Sensor Systems, The Netherlands). The latter redirected the fluorescence signal to the spectrograph (type CP-140-104, Jobin Yvon SA, France) that was coupled to a thermoelectrically air cooled CCD head (Hamamatsu S7030-1006N, Hamamatsu, Japan). The shutter opening dwell time was synchronised with the read-out of the CCD by the CCD controller (type Spectrum One 3500, Jobin Yvon SA, France). The fluorescence detection range was between 250 nm and 850 nm (depending of the excitation wavelength) with a resolution of 6 nm (FWHM). The whole set-up was controlled by a portable PC.
Figure 5.4.1 Set-up of the optical fibre based spectro-fluorometer. The light from the Xenon light source is filtered by a band pass filter (BP) and redirected by a dicroïc mirror (DC) to the optical fibre probe.The fluorescence signal is captured by the same fibre, passed to the DC mirror and filtered by a long pass filter (LP) before being analysed in a spectrograph. The two microscope objectives (MIC) focus the lightbeam into the fibre and the fibre bundle. A set of neutral density filters (ND) allow attenuation of theexcitation light intensity.
Xe Light Source
Shutter BP
LP
DC
Spectrograph
CCD
CCD Control Unit
Optical Fiber Probe
Sampleor
Endoscope
Fiber bundle
PC
MIC
MIC
ND
Xe Light Source
Shutter BP
LP
DC
SpectrographSpectrograph
CCDCCD
CCD Control Unit
CCD Control Unit
Optical Fiber Probe
Sampleor
Endoscope
Fiber bundle
PCPC
MIC
MIC
ND

Chapter 5.4 – Autofluorescence Spectroscopy and Imaging of … Bronchial Tissue after Formalin Fixation
109
For measurements we used a custom made filter cube consisting of a 405 nm ± 10 nm band pass filter (EX405/10), a 430 nm dichroic filter (DM 430, peak reflection 45° at 415 nm) and a 435 nm long pass filter (BA435). A supplementary 455 nm long pass filter (Chroma Inc.,USA ) was inserted between the filter cube and the detection microscope objective to assure a 100% rejection of the excitation light. With this spectral set-up the resolution of the excitation was 10 nm (FWHM) and the typical excitation power at the distal end of the quartz optical fibre was 4 μW. Integration time for the measurements was 100 ms. The physical sensitivity of the set-up yielded a signal-to-noise ratio better than 20 on a typical sample under these conditions.
Spectrofluorometric measurements Before each measurement samples were removed from the formalin solution and washed with a sterile saline solution. They were placed on a non-fluorescing dark support and orientated by superposing the corresponding H&E stained tissue slices for identification of the healthy bronchial areas and lesions of interest. The fluorescence excitation light power at the distal tip of the measurement fibre was controlled with a powermeter (Field Master GS, Coherent Inc., USA). A dark spectrum was collected before each set of
measurements by placing the distal tip of the fibre into a black box. This spectrum was used as the background spectrum for the system’s intrinsic fluorescence and was subtracted automatically from the samples’ spectra during data acquisition. Before and after each set of measurements the fluorescence spectrum of a stable solution of Rhodamine B (c=1e-6 M in ethanol) was collected as a reference in a 10 x 10 x 30 mm3 quartz cuvette. For the measurements the distal tip of the optical fibre was put in slight contact with the epithelial (luminal) surface. Autofluorescence spectra were collected subsequently from healthy tissue and from the lesions. During the tissue AF measurements, particular attention was paid to ensure a perpendicular position of the fibre relative to the tissue surface was maintained. Whenever possible, for each type of lesion present in a sample, spectra were acquired at typically three different sites to access the intra-sample variations. In samples with more than one lesion, three measurements were performed on each lesion. A total of 179 spectrofluorometric measurements were collected: 116 from healthy bronchial tissue, 6 from sites with reactive changes, 24 from early neoplastic lesions and 33 from widely invasive cancers (Table 5.4.1).
Data Processing The raw spectra, i.e. the acquired spectra after subtraction of the system background, were corrected for the peak value of the Rhodamine B reference spectrum at 575 nm. The amplitude of the peak allows fluctuations of the excitation light intensity and detection sensitivity to be taken into
Type of lesions Cases Samples Measurements
Healthy tissue 17 25 116
Basal cell hyperplasia Reactive changes Squamous metaplasia 2 2 6
Mild and moderate dysplasia
1 2 7 Pre-neoplasia
Severe dysplasia/CIS 4 4 17
Microinvasive carcinoma Neoplasia
Invasive SCC 6 10 33
Total 18 26 179
Table 5.4.1 Distribution of samples and histopathologies. The table shows the number of cases, samples, and measurements for the four histopathologic groups.

Chapter 5.4 – Autofluorescence Spectroscopy and Imaging of … Bronchial Tissue after Formalin Fixation
110
account and corrected for. These corrected spectra from different sets of measurements can be compared. The spectra were further corrected for the spectral response of the detection unit. For this purpose, the spectrum of a calibrated light source (The Eppley Laboratory, Inc., USA) equipped with a halogen lamp was collected by the spectrofluorometer. The resulting curve was compared with the specifications of the lamp’s emission and a correction function F(λ) was computed for the detection unit. Following this correction procedure, the spectra throughout this study can be compared between themselves and are expressed in relative units. All relative spectra measured from tissues belonging to the same histopathologic category were averaged and further normalised at their peak maximum. Moreover, for each sample the spectra corresponding to the same histopathologic category were averaged and compared with the corresponding spectra from other samples of the same patient as well with the average spectra from other lesions. This per patient comparison allowed us to directly compare the relative AF intensities and spectral shapes for the different categories of lesions without the bias of any interpatient fluctuations. In order to assess the spectral changes of the AF between the different histopathologic categories, we computed the intensity ratios between the green and the red spectral domains, as described by Zellweger et al. [20]. The spectra were separated in a green and a red spectral region, ranging from 495 nm to 570 nm and from 570 nm to 690 nm, respectively. This spectral decomposition was chosen according to the green and red channel detection ranges of the DAFE imaging system that is described in the following section. Integration of the spectra within these two wavelength ranges allowed us to compute intensity values for the green and the red spectral domain that can be compared to the green and red channel
intensity values of the DAFE images as described below.
Imaging system AF imaging of the samples was performed using the DAFE (Diagnostic AutoFluorescence Endsoscopy) system, commercialised by Richard Wolf Endoscopes GmbH, Germany. The system consisted of a filtered endoscopic light source (type Endo Light Projector 5137) and a filtered 3 CCD endoscopic video camera (type EndoCam 5506). The light source was equipped with an IR filtered 300 W Xenon lamp. A two step flip-flop filter holder containing a grid and a colour band pass filter, respectively, allowed rapid changes between (i) conventional WL illumination and (ii) violet AF excitation at 430 nm ± 40 nm. A liquid light guide delivered the light to the bronchoscope optics. The 3CCD camera was clipped to the eyepiece of the bronchoscopic optics and detected the WL and the AF images. The zoom objective of the camera had an integrated 475 nm long pass filter that rejected all violet excitation light from the AF images. The images were visualized on a monitor and were recorded by a digital video (DV) recorder (Sony Digital Videocassette Recorder DSR-11, Sony Corp., Japan). Three bulk samples exhibiting healthy bronchial wall, CIS and invasive SCC were examined with the DAFE system. For this procedure the samples were removed from the 5% buffered formalin solution, rinsed with sterile physiologic NaCl solution and placed on a black, non-fluorescing background. The samples were orientated by superposing the corresponding H&E stained slice. Autofluorescence imaging was performed with the DAFE system using a rigid 0° bronchoscope optics clipped to the camera. Excitation was performed with blue violet excitation with and without additional backscattered red light (BRL). The procedure was recorded on DV and three images per sample were digitised. Image analysis was performed as described above. After identification of the healthy tissue zone and the lesions zone on

Chapter 5.4 – Autofluorescence Spectroscopy and Imaging of … Bronchial Tissue after Formalin Fixation
111
the image, the red (R), green (G) and blue (B) intensity values were computed for both zones. All values were corrected for the image background and the gamma factor of the camera. The non-normalised ((R/G)) and normalised red-to-green intensity ((R/G)norm) ratios were computed for the normal tissue and the tumour site for each image. The (R/G)norm ratio is the R/G on the tumour zone divided by the one on the normal tissue zone, i.e. (R/G)norm = (R/G)tumour/(R/G)normal.
Results All samples had an overall pale white aspect with any macroscopic differences visible between healthy tissue and pre-neoplastic lesions. The cross sections containing invasive cancer areas were well demarcated from adjacent structures. In several samples, cartilage clasps underlying the bronchial mucosa were visible in the cross section.
Spectrofluorometric measurements The mean spectra for each histopathologic category are shown in Figure 5.4.2 with their standard deviations and the number of measurements “n”. The relative peak intensity decreases from metaplasia to healthy tissue, mild and moderate dysplasia, invasive SCC, and CIS or micro-invasive carcinoma. Standard variations of the mean value for the different types of lesions (inter-patient variations) were in the order of 36 % (range 26 % to 45 %). On a per patient analysis the relative standard deviations between samples of one patient (intra-patient fluctuations) were found to be 36%. The peak intensities measured in a given sample (intra-sample fluctuations) showed a mean error of 23%. Figure 5.4.3 shows the same spectra normalised at their maximum for comparison of their spectral shape. Error bars are not shown in this graphic for better intelligibility. They can easily be deduced from Figure 5.4.2. All spectra corresponding to the 5 histopathologic categories nicely superimpose, suggesting
no difference in the spectral shape for the different lesion categories.
0.0
0.2
0.4
0.6
0.8
1.0
1.2
1.4
1.6
400 500 600 700 800
Wavelength [nm]
Flu
ore
sce
nce
Inte
nsi
ty [a
.u.]
.
Healthy (n=116)Squ. Metaplasia (n=6)Mild Dysplasia (n=7)CIS (n=17)Invasive SCC (n=33)
Figure 5.4.2 Mean AF spectra from ex vivo samples. The mean AF spectra acquired from normal tissue (black with diamond), metaplasia (dotted dark grey with circle), dysplasia (light grey with triangle), CIS (dotted light grey with open square) and invasive tumour (dotted black with filled square) are shown with their standard deviations. The number of measurements used for computation of the mean is given for each histopathologic group.
0.0
0.2
0.4
0.6
0.8
1.0
1.2
400 500 600 700 800
Wavelength [nm]
No
rma
lise
d In
tens
ity [n
.u.]
.
HealthySqu. MetaplasiaMild DysplasiaCISInvasive SCCHealthy (In vivo)
Figure 5.4.3 Mean AF spectra from ex vivo samples. The mean AF spectra acquired from normal tissue (black with diamond), metaplasia (dotted dark grey with circle), dysplasia (light grey with triangle), CIS (dotted light grey with open square) and invasive tumour (dotted black with filled square) are shown with their standard deviations. The number of measurements used for computation of the mean is given for each histopathologic group.
A per patient comparison of the relative AF intensities between the different types of lesions was possible in 7 patients with a total of 19 samples exhibiting both healthy tissue and pre- neoplastic or neoplastic

Chapter 5.4 – Autofluorescence Spectroscopy and Imaging of … Bronchial Tissue after Formalin Fixation
112
lesions. Fluorescence intensity ratios at 510 nm between the AF spectra obtained from healthy bronchial wall and those obtained from invasive SCC, CIS, low grade dysplasia, or metaplasia, are shown in Figure 5.4.4 on a per patients basis. The mean intensity ratios between the AF from healthy bronchial wall and invasive SCC (1.7 ± 0.3) and healthy bronchial wall and CIS (2.0 ± 0.6), respectively, are plotted as dotted lines in the graphics. The other mean ratios, 1.2 for low grade dysplasia and 1.0 ± 0.3 for metaplasia, are not shown for clarity. While there were no differences in the AF intensities between healthy, metaplastic and low grade dysplastic conditions, the fluorescence intensities of invasive SCC and CIS were about two times smaller than those of the healthy bronchial tissuesfor a given patient. The intensity ratios between the red and the green region of the spectra computed, as described above, to be (R/G) = 0.35 for all histopathologic categories.
0.0
0.5
1.0
1.5
2.0
2.5
3.0
0 1 2 3 4 5 6 7 8
Case No.
Inte
nsi
ty R
atio
[n.u
.]
Healthy/Inv. SCC Healthy/ CISHealthy/ Dysplasia Healthy/ M etaplasiaM ean Healthy/ Inv. SCC M ean Healthy/ CIS
Figure 5.4.4 Per case analysis of AF intensities. The figure shows the normalised R/G intensity ratios between normal tissue and tumour (diamonds), CIS (filled triangles), dysplasia (open triangles) and metaplasia (circles), respectively. The dotted lines show the mean values for the normal/tumour and normal/CIS ratios with the error bars depicting standard deviations
Imaging All samples exhibited a homogenous pale white visual aspect when examined with the DAFE system. None of the neoplastic or pre-neoplastic sites identified by
standard histopathologic analysis was visible by fluorescence imaging. One example of DAFE image of formalin fixed samples is shown in Figure 5.4.5. The original colour image was split into its red and green colour channels, and presented as greyscale images. Histopathologic analysis revealed invasive SCC and healthy mucosa. The tissue areas corresponding to the healthy mucosa and the neoplastic lesion are encircled in both images. The corresponding spectra obtained on the marked zones are shown for comparison. The image below shows a typical example of an AFB image obtained from the in vivo study reported in [1]. Once more the original colour image was split into its red and green colour channels. The lesion on the spur in the centre of the image was graded as CIS. The AF decrease on the lesion relative to the surrounding normal tissue is clearly visible in the both images. However, the intensity decrease is more marked in the green channel image than in the red one. Three images from three different samples were digitised and analysed according to the procedure described in the Materials and Methods section. The mean (R/G) ratios computed for the tumour tissue and the normal tissue were 0.41 ± 0.04 and 0.43 ± 0.06, respectively. The mean normalised (R/G) ratio was 0.96 ± 0.17, signifying no visible spectral contrast between the healthy bronchial wall and the pre-neoplastic lesion in the formalin fixed samples with AFB. When comparing the mean R/G ratios of neoplastic and normal mucosa computed from imaging with those computed from the spectrofluorometric measurements (0.35), the relative amount of red AF detected with the imaging system is higher than that measured with contact point spectroscopy. It should be noted, that all images of the formalin fixed samples could be detected without employing the intensification function of the DAFE camera which must be used for in vivo imaging. This observation indicates that the AF intensity of formalin fixed samples is significantly larger than in the
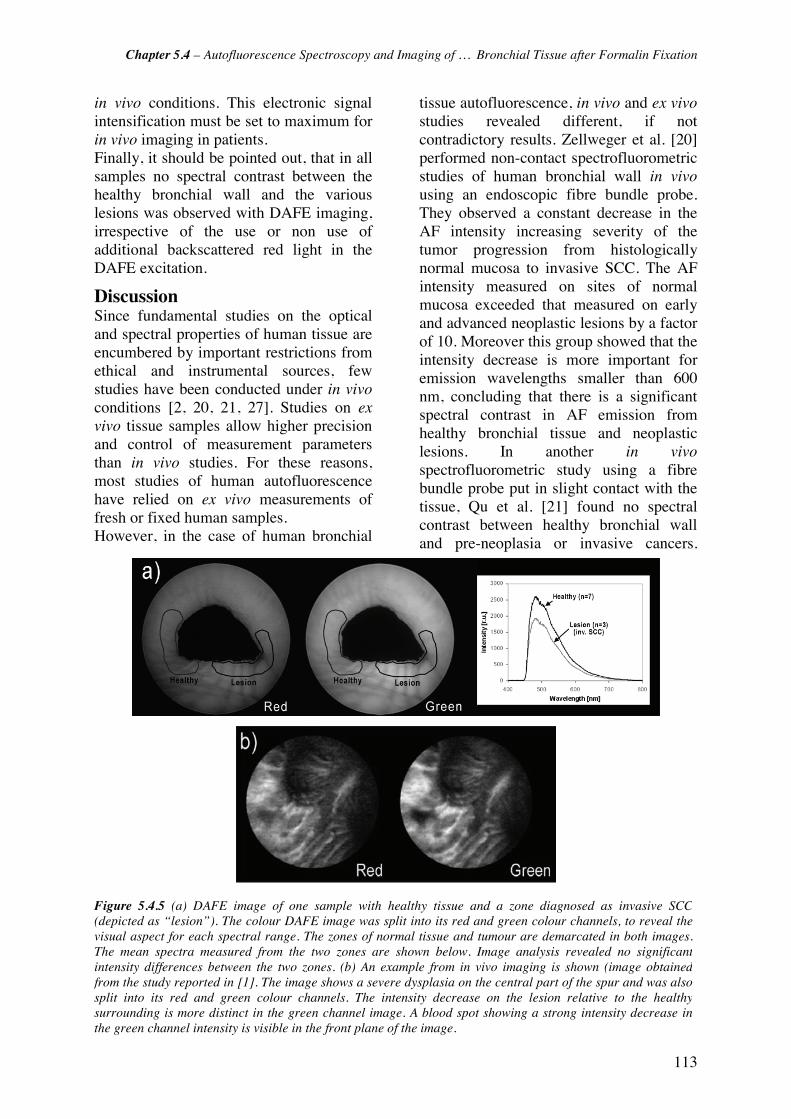
Chapter 5.4 – Autofluorescence Spectroscopy and Imaging of … Bronchial Tissue after Formalin Fixation
113
in vivo conditions. This electronic signal intensification must be set to maximum for in vivo imaging in patients. Finally, it should be pointed out, that in all samples no spectral contrast between the healthy bronchial wall and the various lesions was observed with DAFE imaging, irrespective of the use or non use of additional backscattered red light in the DAFE excitation.
Discussion Since fundamental studies on the optical and spectral properties of human tissue are encumbered by important restrictions from ethical and instrumental sources, few studies have been conducted under in vivo conditions [2, 20, 21, 27]. Studies on ex vivo tissue samples allow higher precision and control of measurement parameters than in vivo studies. For these reasons, most studies of human autofluorescence have relied on ex vivo measurements of fresh or fixed human samples. However, in the case of human bronchial
tissue autofluorescence, in vivo and ex vivo studies revealed different, if not contradictory results. Zellweger et al. [20] performed non-contact spectrofluorometric studies of human bronchial wall in vivo using an endoscopic fibre bundle probe. They observed a constant decrease in the AF intensity increasing severity of the tumor progression from histologically normal mucosa to invasive SCC. The AF intensity measured on sites of normal mucosa exceeded that measured on early and advanced neoplastic lesions by a factor of 10. Moreover this group showed that the intensity decrease is more important for emission wavelengths smaller than 600 nm, concluding that there is a significant spectral contrast in AF emission from healthy bronchial tissue and neoplastic lesions. In another in vivo spectrofluorometric study using a fibre bundle probe put in slight contact with the tissue, Qu et al. [21] found no spectral contrast between healthy bronchial wall and pre-neoplasia or invasive cancers.
Figure 5.4.5 (a) DAFE image of one sample with healthy tissue and a zone diagnosed as invasive SCC(depicted as “lesion”). The colour DAFE image was split into its red and green colour channels, to reveal thevisual aspect for each spectral range. The zones of normal tissue and tumour are demarcated in both images.The mean spectra measured from the two zones are shown below. Image analysis revealed no significantintensity differences between the two zones. (b) An example from in vivo imaging is shown (image obtainedfrom the study reported in [1]. The image shows a severe dysplasia on the central part of the spur and was alsosplit into its red and green colour channels. The intensity decrease on the lesion relative to the healthysurrounding is more distinct in the green channel image. A blood spot showing a strong intensity decrease inthe green channel intensity is visible in the front plane of the image.
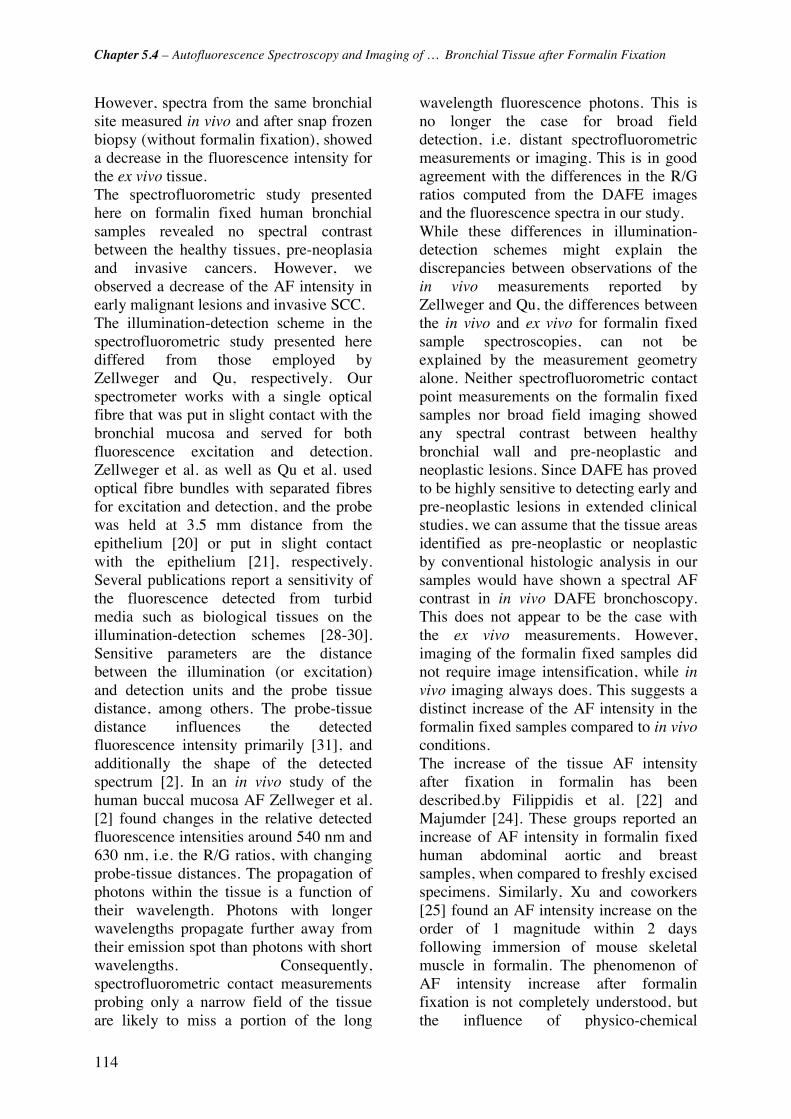
Chapter 5.4 – Autofluorescence Spectroscopy and Imaging of … Bronchial Tissue after Formalin Fixation
114
However, spectra from the same bronchial site measured in vivo and after snap frozen biopsy (without formalin fixation), showed a decrease in the fluorescence intensity for the ex vivo tissue. The spectrofluorometric study presented here on formalin fixed human bronchial samples revealed no spectral contrast between the healthy tissues, pre-neoplasia and invasive cancers. However, we observed a decrease of the AF intensity in early malignant lesions and invasive SCC. The illumination-detection scheme in the spectrofluorometric study presented here differed from those employed by Zellweger and Qu, respectively. Our spectrometer works with a single optical fibre that was put in slight contact with the bronchial mucosa and served for both fluorescence excitation and detection. Zellweger et al. as well as Qu et al. used optical fibre bundles with separated fibres for excitation and detection, and the probe was held at 3.5 mm distance from the epithelium [20] or put in slight contact with the epithelium [21], respectively. Several publications report a sensitivity of the fluorescence detected from turbid media such as biological tissues on the illumination-detection schemes [28-30]. Sensitive parameters are the distance between the illumination (or excitation) and detection units and the probe tissue distance, among others. The probe-tissue distance influences the detected fluorescence intensity primarily [31], and additionally the shape of the detected spectrum [2]. In an in vivo study of the human buccal mucosa AF Zellweger et al. [2] found changes in the relative detected fluorescence intensities around 540 nm and 630 nm, i.e. the R/G ratios, with changing probe-tissue distances. The propagation of photons within the tissue is a function of their wavelength. Photons with longer wavelengths propagate further away from their emission spot than photons with short wavelengths. Consequently, spectrofluorometric contact measurements probing only a narrow field of the tissue are likely to miss a portion of the long
wavelength fluorescence photons. This is no longer the case for broad field detection, i.e. distant spectrofluorometric measurements or imaging. This is in good agreement with the differences in the R/G ratios computed from the DAFE images and the fluorescence spectra in our study. While these differences in illumination-detection schemes might explain the discrepancies between observations of the in vivo measurements reported by Zellweger and Qu, the differences between the in vivo and ex vivo for formalin fixed sample spectroscopies, can not be explained by the measurement geometry alone. Neither spectrofluorometric contact point measurements on the formalin fixed samples nor broad field imaging showed any spectral contrast between healthy bronchial wall and pre-neoplastic and neoplastic lesions. Since DAFE has proved to be highly sensitive to detecting early and pre-neoplastic lesions in extended clinical studies, we can assume that the tissue areas identified as pre-neoplastic or neoplastic by conventional histologic analysis in our samples would have shown a spectral AF contrast in in vivo DAFE bronchoscopy. This does not appear to be the case with the ex vivo measurements. However, imaging of the formalin fixed samples did not require image intensification, while in vivo imaging always does. This suggests a distinct increase of the AF intensity in the formalin fixed samples compared to in vivo conditions. The increase of the tissue AF intensity after fixation in formalin has been described.by Filippidis et al. [22] and Majumder [24]. These groups reported an increase of AF intensity in formalin fixed human abdominal aortic and breast samples, when compared to freshly excised specimens. Similarly, Xu and coworkers [25] found an AF intensity increase on the order of 1 magnitude within 2 days following immersion of mouse skeletal muscle in formalin. The phenomenon of AF intensity increase after formalin fixation is not completely understood, but the influence of physico-chemical

Chapter 5.4 – Autofluorescence Spectroscopy and Imaging of … Bronchial Tissue after Formalin Fixation
115
processes occurring during fixation, such as enzyme degradation and dehydration, along with changes in blood content are discussed by Xu et al. [25]. This second factor is likely to play the most important role since no change of the AF emission spectral shape is observed under blue-violet light excitation between the in vivo and formalin fixed samples. In addition, the spectral properties of blood, one of the principal absorbers of visible light in biological tissues, contained in samples are strongly modified by the formalin fixation process. Haemoglobin, the light absorbing component in blood, has been shown to leak from human red blood cells at short time intervals following formaldehyde immersion [32] and to undergo important molecular modifications. Farbiszewski and coworkers [33] reported that the absorption of haemoglobin decreases significantly following the formaldehyde fixation process. There are two consequences of the reduced blood absorption in the formalin fixed samples on the fluorescence spectra excited with blue-violet wavelengths: on the one hand, more excitation light reaches deeper tissue layers and is available for the excitation of AF. On the other hand, less fluorescence generated in the different layers is reabsorbed. Both effects lead to an increase in the fluorescence intensity.
Absence of contrast Blood content changes in the bronchial mucosa and sub-mucosa are also discussed as a potential mechanism for the spectral tumour-to-normal AF contrast observed in in vivo human bronchi [21, 34, 35]. Indeed, early bronchial cancers and pre-neoplasitc lesions are characterised by a distinct increase in the microvessel density, i.e. number of blood vessels and by this the blood content in a given tissue volume, below the epithelial layer relative to the normal mucosa [36, 37]. Under in vivo conditions pre-neoplastic and neoplastic lesions show a higher absorption of the violet excitation light and a decrease of the emitted AF intensity compared to healthy bronchial wall. Due to the absorption
spectrum of haemoglobin, the re-absorption of the AF is stronger in the green wavelength region (490 nm to 600 nm) than at longer wavelengths (>600 nm), generating the spectral AF contrast observed between bronchial sites with healthy mucosa and pre-neoplastic or neoplastic lesions in vivo. This can also be seen when comparing in vivo AF spectra with those from formalin fixed samples. A typical in vivo AF spectra from normal bronchial wall (adapted from [2]) is shown in Figure 3. The shapes of the in vivo and formalin spectra differ only in the absorption region of haemoglobin, i.e. between 530 nm and 600 nm. It should be noted that the relative increase of the tissue blood content in pre-neoplastic and neoplastic bronchial lesions might not be the only contrast mechanism. Spatial distribution of the fluorochromes in the bronchial wall and the thickening of the epithelial cell layer [17, 21, 34] may also contribute to this phenomenon. As already mentioned before, the bronchial wall has a distinct layered structure. It has been shown that the major contribution of AF originates from the sub-epithelial layers, while the epithelium is hardly fluorescing when excited with blue-violet light [21, 38, 39]. Cancerogenesis in the bronchi comes along with an increase in the cell nuclei density and nuclei size. In addition a thickening of the epithelium is frequently observed. Most of the pre-neoplastic lesions investigated in this study were associated with a thickening of the epithelial layer relative to the healthy mucosa. The thickening of the epithelium and the modifications in size and density of the light scattering nuclei could act as a screen for the AF emitted from the sub-epithelial layers including the lanima propria and the submucosa. Our results demonstrate that the intensity contrast is not totally inhibited by the formalin fixation process. Pre-neoplastic and neoplastic lesions show a decrease in the AF intensity relative to healthy tissues after formalin fixation. Since no spectral contrasts are observed between healthy
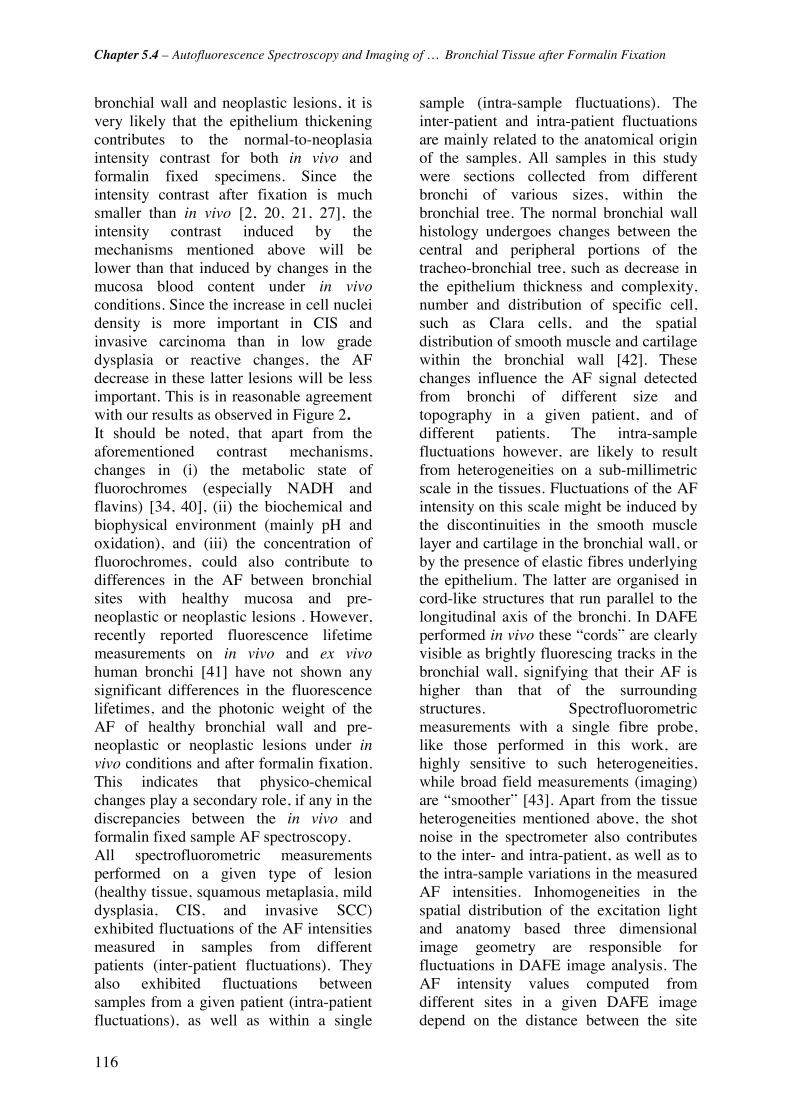
Chapter 5.4 – Autofluorescence Spectroscopy and Imaging of … Bronchial Tissue after Formalin Fixation
116
bronchial wall and neoplastic lesions, it is very likely that the epithelium thickening contributes to the normal-to-neoplasia intensity contrast for both in vivo and formalin fixed specimens. Since the intensity contrast after fixation is much smaller than in vivo [2, 20, 21, 27], the intensity contrast induced by the mechanisms mentioned above will be lower than that induced by changes in the mucosa blood content under in vivo conditions. Since the increase in cell nuclei density is more important in CIS and invasive carcinoma than in low grade dysplasia or reactive changes, the AF decrease in these latter lesions will be less important. This is in reasonable agreement with our results as observed in Figure 2. It should be noted, that apart from the aforementioned contrast mechanisms, changes in (i) the metabolic state of fluorochromes (especially NADH and flavins) [34, 40], (ii) the biochemical and biophysical environment (mainly pH and oxidation), and (iii) the concentration of fluorochromes, could also contribute to differences in the AF between bronchial sites with healthy mucosa and pre-neoplastic or neoplastic lesions . However, recently reported fluorescence lifetime measurements on in vivo and ex vivo human bronchi [41] have not shown any significant differences in the fluorescence lifetimes, and the photonic weight of the AF of healthy bronchial wall and pre-neoplastic or neoplastic lesions under in vivo conditions and after formalin fixation. This indicates that physico-chemical changes play a secondary role, if any in the discrepancies between the in vivo and formalin fixed sample AF spectroscopy. All spectrofluorometric measurements performed on a given type of lesion (healthy tissue, squamous metaplasia, mild dysplasia, CIS, and invasive SCC) exhibited fluctuations of the AF intensities measured in samples from different patients (inter-patient fluctuations). They also exhibited fluctuations between samples from a given patient (intra-patient fluctuations), as well as within a single
sample (intra-sample fluctuations). The inter-patient and intra-patient fluctuations are mainly related to the anatomical origin of the samples. All samples in this study were sections collected from different bronchi of various sizes, within the bronchial tree. The normal bronchial wall histology undergoes changes between the central and peripheral portions of the tracheo-bronchial tree, such as decrease in the epithelium thickness and complexity, number and distribution of specific cell, such as Clara cells, and the spatial distribution of smooth muscle and cartilage within the bronchial wall [42]. These changes influence the AF signal detected from bronchi of different size and topography in a given patient, and of different patients. The intra-sample fluctuations however, are likely to result from heterogeneities on a sub-millimetric scale in the tissues. Fluctuations of the AF intensity on this scale might be induced by the discontinuities in the smooth muscle layer and cartilage in the bronchial wall, or by the presence of elastic fibres underlying the epithelium. The latter are organised in cord-like structures that run parallel to the longitudinal axis of the bronchi. In DAFE performed in vivo these “cords” are clearly visible as brightly fluorescing tracks in the bronchial wall, signifying that their AF is higher than that of the surrounding structures. Spectrofluorometric measurements with a single fibre probe, like those performed in this work, are highly sensitive to such heterogeneities, while broad field measurements (imaging) are “smoother” [43]. Apart from the tissue heterogeneities mentioned above, the shot noise in the spectrometer also contributes to the inter- and intra-patient, as well as to the intra-sample variations in the measured AF intensities. Inhomogeneities in the spatial distribution of the excitation light and anatomy based three dimensional image geometry are responsible for fluctuations in DAFE image analysis. The AF intensity values computed from different sites in a given DAFE image depend on the distance between the site

Chapter 5.4 – Autofluorescence Spectroscopy and Imaging of … Bronchial Tissue after Formalin Fixation
117
and the endoscope, as well as on the angle of view. However, those intra-sample fluctuations were reduced by comparing only intensity values from sites in the same image plane. Moreover, only intensity values obtained from images showing the samples at comparable distances from the endoscope were compared in this study, reducing inter- and intra-patient variations.
Conclusions Formalin fixed bronchial samples exhibit no spectral contrast between histologically healthy tissue, squamous metaplasia, low grade dysplasia, CIS and invasive SCC with either spectrofluorometric contact point measurements, or the DAFE imaging. The AF intensity contrast between bronchial sites with healthy mucosa and neoplastic lesions is strongly diminished but still exists for all categories of early and advanced neoplasia but is absent for reactive changes. The overall AF intensity is increased compared to in vivo measurements. These observations indicate that the principal mechanisms responsible for the spectral contrast between healthy bronchial tissue and pre-neoplasia or neoplasia are destroyed or at least significantly altered by either tissue death and/or the formalin fixation process. Blood flow seems to play a key-role in the mechanism generating the spectral AF contrast between healthy tissue and early bronchial lesions. In contrast to this, the mechanisms responsible for the intensity contrast are altered, but not destroyed by tissue death and/or the formalin fixation process. The thickening of the epithelium in the measured tissue samples is likely to be the cause of this observed phenomenon. Moreover, we demonstrated that formalin fixed bronchial samples are not suited for studying the AF contrasts between healthy bronchial wall and early neoplasia and their mechanisms.

Chapter 5.4 – Autofluorescence Spectroscopy and Imaging of … Bronchial Tissue after Formalin Fixation
118
References [1] T. Gabrecht, T. Glanzmann, L. Freitag, B.-C. Weber, H. van den Bergh and G. Wagnières, "Optimised autofluorescence bronchoscopy using additional backscattered red light," submitted
[2] M. Zellweger, D. Goujon, R. Conde, M. Forrer, H. van den Bergh and G. Wagnières, "Absolute autofluorescence spectra of human healthy, metaplastic, and early cancerous bronchial tissue in vivo," Applied Optics 40(22), 3784-3791 (2001)
[3] A. Jemal, T. Murray, A. Ghafoor, A. Samuels, E. Ward, M. J. Thun, R. C. Tiwari and E. J. Feuer, "Cancer Statistics, 2004," Ca-A Cancer Journal for Clinicians 54(1), 8-29 (2004)
[4] W. K. Lam, M. M. Chan-Yeung and N. W. White, "Lung cancer epidemiology and risk factors in Asia and Africa," International Journal of Tuberculosis and Lung Disease 8(9), 1045-1057 (2004)
[5] Y.-P. Liaw, G.-W. Lien and Y.-C. Huang, "Patterns of lung cancer mortality in 23 countries: Application of the Age-Period-Cohort model," BMC Public Health 5((2005)
[6] E. Brambilla, W. D. Travis, T. V. Colby, B. Corrin and Y. Shimosato, "The new World Health Organization classification of lung tumours," Eur Respir J 18(6), 1059-1068 (2001)
[7] O. Auerbach, E. C. Hammond and L. Garfinkel, "Bronchial epithelium and cigarette smoking," N Engl J Med 300(24), 1395-1396 (1979)
[8] G. Saccomanno, V. E. Archer, O. Auerbach, R. P. Saunders and L. M. Brennan, "Development of carcinoma of the lung as reflected in exfoliated cells," Cancer 33(1), 256-270 (1974)
[9] H. Kato, "Photodynamic therapy for lung cancer - A review of 19 years' experience," Journal of Photochemistry and Photobiology B: Biology 42(2), 96-99 (1998)
[10] A. Jemal, L. X. Clegg, E. Ward, L. A. G. Ries, X. Wu, P. M. Jamison, P. A. Wingo, H. L. Howe, R. N. Anderson and B. K. Edwards, "Annual report to the nation on the status of cancer, 1975-2001, with a special feature regarding survival," Cancer 101(1), 3-27 (2004)
[11] G. Bepler, B. Djulbegovic, R. A. Clark and M. Tockman, "A systemic review and lessons learned from early lung cancer detection trial using low-dose computed tomography of the chest," Cancer Control 10(4), 306-324 (2003)
[12] F. R. Hirsch, W. A. Franklin, A. F. Gazdar and J. Bunn P.A., "Early detection of lung cancer: Clinical perspectives of recent advances in biology and radiology," Clinical Cancer Research 7(1), 5-22 (2001)
[13] J. Port, M. Kent and N. Altorki, "Early lung cancer detection and treatment strategies.," Surg Oncol 11(4), 191-199 (2002)
[14] N. van Zandwijk, "New methods for early diagnosis of lung cancer," Lung Cancer 38(S9-S11 (2002)
[15] K. Häußinger, F. Stanzel, M. Kohlhäufl, H. Becker, F. Herth, A. Kreuzer, B. Schmidt, J. Strausz, S. Cavaliere, K.-M. Müller, R.-M. Huber, U. Pichlmeier and C. T. Bolliger, "Autofluorescence bronchoscopy with white light bronchoscopy compared with white light bronchoscopy alone for the detection of precancerous lesions: A European randomised controlled multicentre trial," Thorax 60(6), 496-503 (2005)
[16] S. Lam, C. MacAulay, J. C. leRiche and B. Palcic, "Detection and localization of early lung cancer by fluorescence bronchoscopy," Cancer Suppl. 89(11), 2468-2473 (2000)
[17] G. Wagnières, A. McWilliams and S. Lam, "Lung cancer imaging with fluorescence endoscopy," in Handbook of Biomedical Fluorescence, M.-A. Myceck and B. W. Pogue, pp. 361-396, Marcel Dekker, Inc. (2003).
[18] D. Goujon, M. Zellweger, A. Radu, G. P., B.-C. Weber, H. van den Bergh, P. Monnier and G. Wagnières, "In vivo autofluorescence imaging of early cancers in the human tracheobronchial tree with a spectrally optimized system," J Biomed Optics 8(1), 17-25 (2003)
[19] T. C. Kennedy, S. Lam and F. R. Hirsch, "Review of recent advances in fluorescence bronchoscopy in early localization of central airway lung cancer," Oncologist 6(3), 257-262 (2001)
[20] M. Zellweger, P. Grosjean, D. Goujon, P. Monnier, H. van den Bergh and G. Wagnières, "In vivo autofluorescence spectroscopy of human bronchial tissue to optimize the detection and imaging of early cancers," J Biomed Optics 6(1), 41-51 (2001)
[21] J. Qu, C. MacAulay, S. Lam and B. Palcic, "Laser-induced fluorescence spectroscopy at endoscopy: tissue optics, Monte Carlo modeling and in vivo measurements," Optical Engineering 34(11), 3334-3343 (1995)

Chapter 5.4 – Autofluorescence Spectroscopy and Imaging of … Bronchial Tissue after Formalin Fixation
119
[22] G. Filippidis, G. Zacharakis, M. Kouktzela, T. G. Papazoglou, A. Katsamouris and A. Giannoukas, "Effect of liquid-nitrogen and formalin-based conservation in the in vitro measurement of laser-induced fluorescence from peripheral vascular tissue," Journal of Photochemistry and Photobiology B: Biology 47(2-3), 109-114 (1998)
[23] Z. Huang, A. McWilliams, S. Lam, J. English, D. McLean, H. Lui and H. Zeng, "Effect of formalin fixation on the near-infrared Raman spectroscopy of normal and cancerous human bronchial tissue," Int Jou Oncol 23(649-655 (2003)
[24] S. K. Majumder, N. Ghosh and P. K. Gupta, "N2 laser excited autofluorescence spectroscopy of formalin-fixed human breast tissue," Journal of Photochemistry and Photobiology B: Biology 81(1), 33-42 (2005)
[25] M. G. Xu, E. D. Williams, W. E. Thompson and M. Gu, "Effect of handling and fixation processes on fluorescence spectroscopy of mouse skeletal muscles under two-photon excitation," Applied Optics 39(34), 6312-6317 (2000)
[26] W. D. Travis, E. Brambilla, H. K. Müller-Hermelink and C. C. Harris, Pathology and genetics of tumours of lung, pleura, thymus and heart, IARC Press, Lyon (2000).
[27] J. Hung, S. Lam, J. LeRiche and B. Palcic, "Autofluorescence of normal and malignant bronchial tissue," Lasers in Surgery and Medicine 11(2), 99-105 (1991)
[28] T. J. Pfefer, K. T. Schomacker, M. N. Ediger and N. S. Nishioka, "Light propagation in tissue during fluorescence spectroscopy with single-fiber probes," IEEE Journal on Selected Topics in Quantum Electronics 7(6), 1004-1012 (2001)
[29] T. J. Pfefer, A. Agrawal and R. A. Drezek, "Oblique-incidence illumination and collection for depth-selective fluorescence spectroscopy," J Biomed Opt 10(4), 44016 (2005)
[30] U. Utzinger and R. Richards-Kortum, "Fiber optic probes for biomedical optical spectroscopy," Journal of Biomedical Optics 8(1), 121-147 (2003)
[31] L. C. Kwek, S. Fu, T. C. Chia and C. L. Tang, "Distance and angular dependence of intensity ratios in laser-induced autofluorescence techniques," Medical Physics 1072-1075 (2004)
[32] P. S. Vassar, J. M. Hards, D. E. Brooks, B. Hagenberger and G. V. F. Seaman, "Physicochemical effects of aldehydes on the human erythrocyte," The Journal of Cell Biology 53(809-818 (1972)
[33] R. Farbiszewski, E. Skrzydlewska and A. Roszkowska, "Formaldehyde-induced modification of hemoglobin in vitro," Acta Biologica Hungarica 49(2-4), 345-352 (1998)
[34] R. Richards-Kortum and E. Sevick-Muraca, "Quantitative optical spectroscopy for tissue diagnosis," Annual Review of Physical Chemistry 47(1), 555-606 (1996)
[35] W. F. Cheong, S. A. Prahl and A. J. Welch, "A review of the optical properties of biological tissues," IEEE Journal of Quantum Electronics 26(12), 2166-2185 (1990)
[36] A. Fisseler-Eckhoff, D. Rothstein and K. M. Müller, "Neovascularization in hyperplastic, metaplastic and potentially preneoplastic lesions of the bronchial mucosa," Virchows Arch 429(2-3), 95-100 (1996)
[37] G. Fontanini, A. Calcinai, L. Boldrini, M. Lucchi, M. Mussi, C. A. Angeletti, C. Cagno, M. A. Tognetti and F. Basolo, "Modulation of neoangiogenesis in bronchial preneoplastic lesions," Oncol Rep 6(4), 813-817 (1999)
[38] C. M. Gardner, A. J. Welch and S. L. Jacques, "Fluorescence spectroscopy of tissue: Recovery of intrinsic fluorescence from measured fluorescence," Applied Optics 35(10), 1780-1792 (1996)
[39] J. Qu, C. MacAulay, S. Lam and B. Palcic, "Optical properties of normal and carcinomatous bronchial tissue," Applied Optics 33(31), 7397-7405 (1994)
[40] O. Wolfbeis, "Fluorescence of organic natural products," in Molecular Luminiscence Spectroscopy, S. G. Schulmann, pp. 167-370, John Wiley and Sons, New York (1993).
[41] P. Uehlinger, T. M. Glanzmann, J.-P. Ballini, A. Radu, T. Gabrecht, P. Monnier, H. van den Bergh and G. Wagnieres, "Time-resolved autofluorescence spectroscopy of the bronchial mucosa for the detection of early cancer: clinical results," submitted (2005)
[42] L. C. Junqueira, J. Carneiro and J. A. Long, Basic Histology, Lange Medical Publications, Los Altos/ California (1986).
[43] B. W. Pogue, B. Chen, X. Zhou and P. J. Hoopes, "Analysis of sampling volume and tissue heterogeneity on the in vivo detection of fluorescence," J Biomed Opt 10(4), 041206 (2005)

120

121
5.5 Improvement of the specificity of Cancer Detection by Autofluorescence Imaging in the Tracheo-Bronchial Tree using backscattered Blue-Violet Light Tanja Gabrecht1, Alexandre Radu2, Pierre Grosjean2, Bernd-Claus Weber3, Günther Reichle4, Lutz Freitag4, Philippe Monnier2, Hubert van den Bergh1, Georges Wagnières1* 1 Swiss Federal Institute of Technology (EPFL), Laboratory for Air and Soil Pollution, 1015 Lausanne, Switzerland 2 The CHUV University Hospital, ENT Department, 1011 Lausanne, Switzerland 3 Richard Wolf Endoscopes GmbH, 75438 Knittlingen, Germany 4 Clinic for Pneumology and Thoracic Surgery Hemer, Pneumology Department, 58675 Hemer, Germany
Abstract Autofluorescence bronchoscopy (AFB) is a highly sensitive tool for the detection of early bronchial cancers. However, its specificity remains limited due primarily to false positive results induced by hyperplasia, metaplasia and inflammation. We have investigated the potential of blue-violet backscattered light to reduce false positive results during AFB. The backscattering properties of normal and abnormal bronchial mucosae were investigated in a clinical imaging study for blue-violet wavelengths ranging between 410 nm and 490 nm with the DAFE (Diagnostic Auto-Fluorescence Endoscopy) system equipped with a variable bandpass filter. Our results showed that the detection of blue-violet light has the potential to significantly reduce the number of false positive results in AFB. In addition we determined the optimal spectral design of the emission filter dedicated to the detection of this blue-violet light with the DAFE system.
Keywords autofluorescence bronchoscopy; backscattered blue-violet light; specificity; clinical study; imaging; DAFE; endobronchial cancer; dysplasia; CIS Submitted to Journal of Biomedical Optics
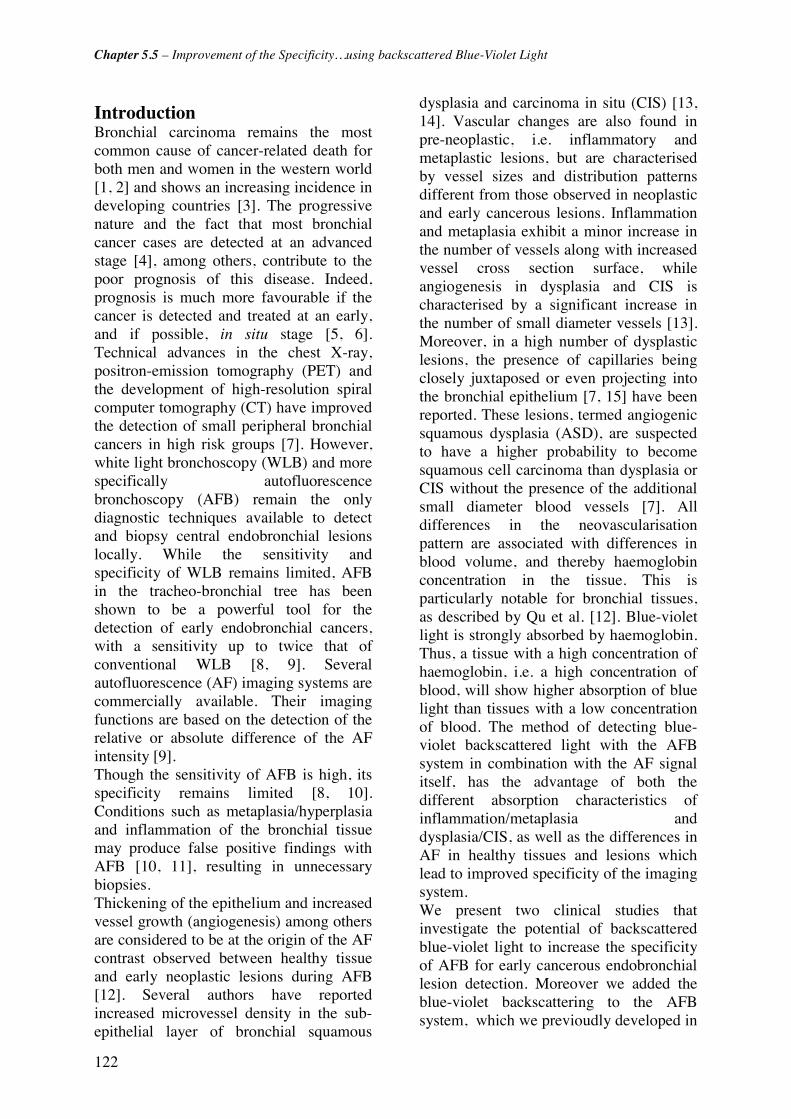
Chapter 5.5 – Improvement of the Specificity…using backscattered Blue-Violet Light
122
Introduction Bronchial carcinoma remains the most common cause of cancer-related death for both men and women in the western world [1, 2] and shows an increasing incidence in developing countries [3]. The progressive nature and the fact that most bronchial cancer cases are detected at an advanced stage [4], among others, contribute to the poor prognosis of this disease. Indeed, prognosis is much more favourable if the cancer is detected and treated at an early, and if possible, in situ stage [5, 6]. Technical advances in the chest X-ray, positron-emission tomography (PET) and the development of high-resolution spiral computer tomography (CT) have improved the detection of small peripheral bronchial cancers in high risk groups [7]. However, white light bronchoscopy (WLB) and more specifically autofluorescence bronchoscopy (AFB) remain the only diagnostic techniques available to detect and biopsy central endobronchial lesions locally. While the sensitivity and specificity of WLB remains limited, AFB in the tracheo-bronchial tree has been shown to be a powerful tool for the detection of early endobronchial cancers, with a sensitivity up to twice that of conventional WLB [8, 9]. Several autofluorescence (AF) imaging systems are commercially available. Their imaging functions are based on the detection of the relative or absolute difference of the AF intensity [9]. Though the sensitivity of AFB is high, its specificity remains limited [8, 10]. Conditions such as metaplasia/hyperplasia and inflammation of the bronchial tissue may produce false positive findings with AFB [10, 11], resulting in unnecessary biopsies. Thickening of the epithelium and increased vessel growth (angiogenesis) among others are considered to be at the origin of the AF contrast observed between healthy tissue and early neoplastic lesions during AFB [12]. Several authors have reported increased microvessel density in the sub-epithelial layer of bronchial squamous
dysplasia and carcinoma in situ (CIS) [13, 14]. Vascular changes are also found in pre-neoplastic, i.e. inflammatory and metaplastic lesions, but are characterised by vessel sizes and distribution patterns different from those observed in neoplastic and early cancerous lesions. Inflammation and metaplasia exhibit a minor increase in the number of vessels along with increased vessel cross section surface, while angiogenesis in dysplasia and CIS is characterised by a significant increase in the number of small diameter vessels [13]. Moreover, in a high number of dysplastic lesions, the presence of capillaries being closely juxtaposed or even projecting into the bronchial epithelium [7, 15] have been reported. These lesions, termed angiogenic squamous dysplasia (ASD), are suspected to have a higher probability to become squamous cell carcinoma than dysplasia or CIS without the presence of the additional small diameter blood vessels [7]. All differences in the neovascularisation pattern are associated with differences in blood volume, and thereby haemoglobin concentration in the tissue. This is particularly notable for bronchial tissues, as described by Qu et al. [12]. Blue-violet light is strongly absorbed by haemoglobin. Thus, a tissue with a high concentration of haemoglobin, i.e. a high concentration of blood, will show higher absorption of blue light than tissues with a low concentration of blood. The method of detecting blue-violet backscattered light with the AFB system in combination with the AF signal itself, has the advantage of both the different absorption characteristics of inflammation/metaplasia and dysplasia/CIS, as well as the differences in AF in healthy tissues and lesions which lead to improved specificity of the imaging system. We present two clinical studies that investigate the potential of backscattered blue-violet light to increase the specificity of AFB for early cancerous endobronchial lesion detection. Moreover we added the blue-violet backscattering to the AFB system, which we previoudly developed in

Chapter 5.5 – Improvement of the Specificity…using backscattered Blue-Violet Light
123
collaboration with Richard Wolf Endoscopes (Knittlingen, Germany). The first study which we for convenience here name our "reflectance imaging study," was designed to identify the optimal violet wavelength. It was performed by positioning a linear variable narrow band pass filter (LVBF) in front of the camera of our imaging system while operated in the conventional WL mode. We measured the intensity contrast of the violet backscattered light on fluorescence positive lesions as compared to the surrounding fluorescence negative tissues at different backscattered blue-violet wavelengths. The second study, or “implementation study”, was carried out to determine the optimal intensity of detected backscattered blue light to be added to the AF signal of the AFB system. This was performed by varying the detection cut-on wavelength of of a linear variable high pass filter (LVHF) placed in front of the camera of the imaging system operated in the AF mode. In measuring the ratios between the green and blue channel intensities for different wavelengths, we estimated the optimal fraction of blue-violet excitation light for backscattering detection.
Materials and Methods Reflectance imaging Study AFB and WLB were performed in the tracheo-bronchial tree using the so called DAFE (Diagnostic AutoFluorescence Endoscopy) system, commercialised by Richard Wolf Endoscopes GmbH, Germany. The system consisted of a filtered endoscopic light source and a filtered 3CCD endoscopic video camera. The light source (type Endo Light Projector 5137, Richard Wolf Endoscopes GmbH, Germany) () was equipped with an IR filtered 300W Xenon lamp (emission range 390 nm to 680 nm) and a 2 step flip-flop filter holder containing (1) a grid for conventional white light excitation and (2) a square “top hat” profile violet colour band pass filter for AF excitation at 430 nm with a FWHM of 80 nm. A foot switch
allowed changing between white light illumination (WL mode) and violet fluorescence excitation (AFB mode). A liquid light guide delivered the light to the bronchoscope optics. The WL and AFB images were detected by the 3 CCD camera (type EndoCam 5506, Richard Wolf Endoscopies GmbH, Germany) that can be clipped to the endoscopic optics. The zoom objective of the camera had an integrated 475 nm long pass filter (emission filter) that rejected all violet excitation light. The images were visualized on a monitor and were recorded by a digital video (DV) recorder (Sony Digital Videocassette Recorder DSR-11, Sony Corp., Japan). The system was used with both conventional rigid optics (Hopkins' 0°, Storz Endoscopes, Germany) and bronchofiberscopes (Olympus Type BF, Olympus, Japan). Patients undergoing autofluorescence bronchoscopy in the ENT department of the CHUV University Hospital in Lausanne (Switzerland) and the Centre for Pneumology and Thoracic Surgery in Hemer (Germany) were included in the multicentric reflectance imaging study. Indications for AF bronchoscopy candidates were known or suspected squamous cell carcinoma in the bronchi (standard diagnostic workup or pre-therapeutic bronchoscopy), and/or resection of lung cancer (follow up bronchoscopy), and/or atypia in the sputum, and/or abnormal X-ray findings, as well as complaints of dyspnea or cough without suspect findings in sputum or X-ray. All bronchoscopies were performed according to the guidelines approved by the ethical committee of the CHUV University Hospital and the Hemer Centre for Pneumology and Thoracic Surgery. AF bronchoscopy revealed 12 fluorescence positive lesions in 12 patients that were further examined with the LVBF set-up. "Optical" exclusion criteria for these measurements were endobronchial bleeding or a very lateral position of the lesion that prohibited a frontal view during measurements.

Chapter 5.5 – Improvement of the Specificity…using backscattered Blue-Violet Light
124
For the reflectance imaging study the detection filter located in the camera objective comprising the emission filter, was replaced by the LVBF filter (Oriel Veril S-60, Oriel Optik GmbH, Germany). This filter covered a wavelength range from 400 to 700 nm. Full half width maximum (FWHM) of the transmission bands was 12 nm ± 1 nm and the mean peak transmission was 43% ± 2% for central wavelengths ranging from 410 to 500 nm. To take measurements, the filter was placed in a custom-made endoscopic filter holder in which the filter could be moved along its longitudinal axis by a worm gear mechanism. The actual tuned central wavelength readout came from a calibrated scale on the filter holder. Each scale element was 10 nm and the measurement precision was ± 3 nm. In the case of AF positive (AF+) lesions, i.e. lesions exhibiting a more reddish fluorescence than the surrounding healthy tissue, the optics were positioned in a stable position relative to the lesion in the AF mode and measurements with the LVBF filter were performed. After mounting and focussing, the VBPF was tuned from 490 nm central wavelength to 410 nm central wavelength in steps of 10 nm. The whole procedure was recorded with the DV recorder. All AF+ sites were biopsied following the measurements. Histopathologic analysis revealed 3 cases of healthy tissue, 1 inflammatory lesion, 2 scar lesions, 1 hyperplastic lesion, 2 metaplasia, 1 mild dysplasia and 2 invasive squamous cell carcinomas (SCC). For further analysis these pathologies were grouped into 5 classes, namely 1) neoplasia, including invasive SCC and dysplasia, 2) scar lesions, 3) inflammation, 4) metaplasia, and 5) normal bronchial wall, including healthy mucosa and hyperplasia. The LVBF video sequences were digitised using the IEEE1394 interface of the DV recorder and a portable personal computer. Still images for each wavelength were digitised in the 24-bit red, green and blue (RGB) mode. The colour intensity levels in the red (R), green (G)
and blue (B) channels were computed on the fluorescence positive lesions and on the surrounding fluorescence negative tissue. All values were corrected for the image background and the gamma factor of the system. The latter relates the video signal voltage “V” and the detected illumination intensity “I” through the correlation V=Iγ. In order to quantify the relative reflectivity of the backscattered blue-violet light on the AF+ and the surrounding non-suspicious, i.e. AF negative (AF-) tissue sites, we computed the ratio of the blue intensity levels on these two tissues types. The errors related to the image analysis procedure were estimated by computing and comparing the intensity level values and ratios from multiple AF+ and AF- zones selected arbitrarily within a sample image. The variations between the computed values were in the order of ±10% for the intensity and ± 20% for the intensity ratios.
The Implementation Study The main goal of the implementation study was to determine the amount of detected backscattered blue-violet light intensity best suited for the simultaneous detection of the AF and the backscattered blue-violet light with the DAFE system. Here we established the position of the cut-on wavelength of the emission filter in order to detect similar green AF and backscattered blue-violet intensities. For this purpose we used the LVHF filter (LVF-HH, Ocean Optics BV, The Netherlands) to vary the amount of blue-violet excitation light detected by the DAFE camera. The cut-off wavelengths of this filter ranged from 300 nm to 750 nm with a transmission of 85%. The slope of the cut-off edge was 20 nm from 10% to 90% of the total transmission. For the endoscopic measurements the LVHF filter was mounted in the endoscopic filter holder described in our reflectance imaging study. The LVHF scale on the filter holder had a precision of ± 2 nm and an accuracy of 5 nm with the major scale elements being spaced 20 nm. The filtered DAFE camera objective was replaced by an
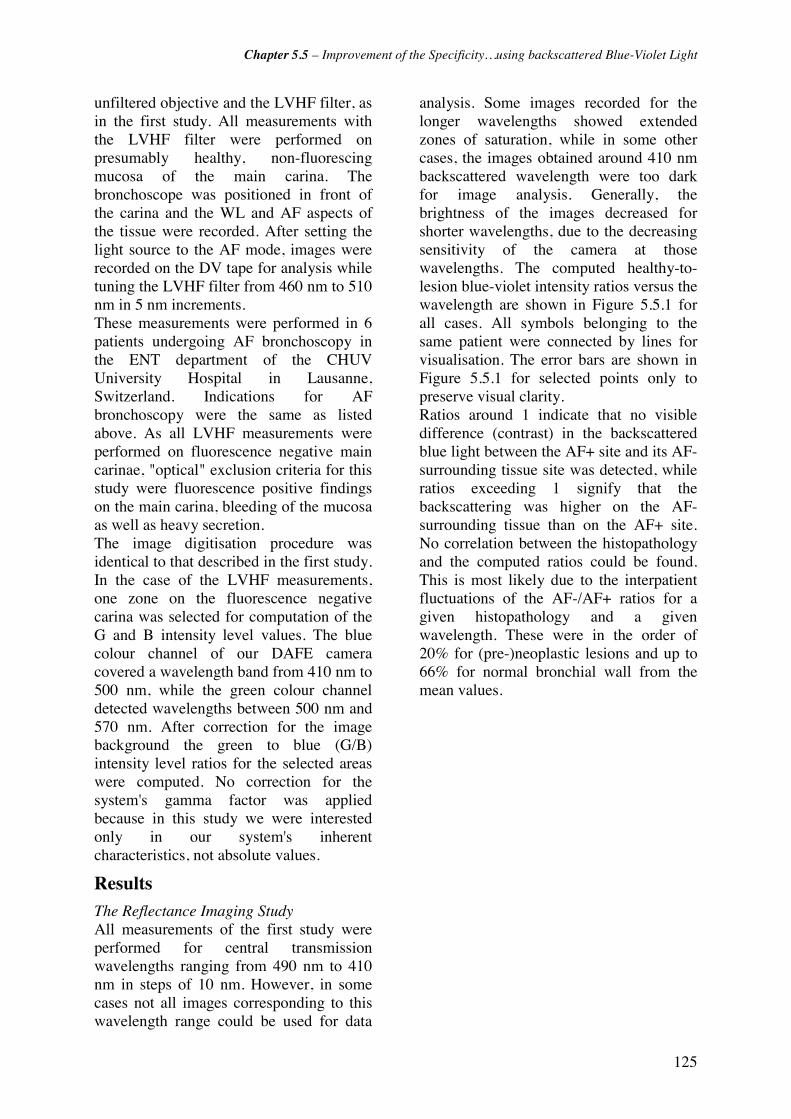
Chapter 5.5 – Improvement of the Specificity…using backscattered Blue-Violet Light
125
unfiltered objective and the LVHF filter, as in the first study. All measurements with the LVHF filter were performed on presumably healthy, non-fluorescing mucosa of the main carina. The bronchoscope was positioned in front of the carina and the WL and AF aspects of the tissue were recorded. After setting the light source to the AF mode, images were recorded on the DV tape for analysis while tuning the LVHF filter from 460 nm to 510 nm in 5 nm increments. These measurements were performed in 6 patients undergoing AF bronchoscopy in the ENT department of the CHUV University Hospital in Lausanne, Switzerland. Indications for AF bronchoscopy were the same as listed above. As all LVHF measurements were performed on fluorescence negative main carinae, "optical" exclusion criteria for this study were fluorescence positive findings on the main carina, bleeding of the mucosa as well as heavy secretion. The image digitisation procedure was identical to that described in the first study. In the case of the LVHF measurements, one zone on the fluorescence negative carina was selected for computation of the G and B intensity level values. The blue colour channel of our DAFE camera covered a wavelength band from 410 nm to 500 nm, while the green colour channel detected wavelengths between 500 nm and 570 nm. After correction for the image background the green to blue (G/B) intensity level ratios for the selected areas were computed. No correction for the system's gamma factor was applied because in this study we were interested only in our system's inherent characteristics, not absolute values.
Results The Reflectance Imaging Study All measurements of the first study were performed for central transmission wavelengths ranging from 490 nm to 410 nm in steps of 10 nm. However, in some cases not all images corresponding to this wavelength range could be used for data
analysis. Some images recorded for the longer wavelengths showed extended zones of saturation, while in some other cases, the images obtained around 410 nm backscattered wavelength were too dark for image analysis. Generally, the brightness of the images decreased for shorter wavelengths, due to the decreasing sensitivity of the camera at those wavelengths. The computed healthy-to-lesion blue-violet intensity ratios versus the wavelength are shown in Figure 5.5.1 for all cases. All symbols belonging to the same patient were connected by lines for visualisation. The error bars are shown in Figure 5.5.1 for selected points only to preserve visual clarity. Ratios around 1 indicate that no visible difference (contrast) in the backscattered blue light between the AF+ site and its AF- surrounding tissue site was detected, while ratios exceeding 1 signify that the backscattering was higher on the AF- surrounding tissue than on the AF+ site. No correlation between the histopathology and the computed ratios could be found. This is most likely due to the interpatient fluctuations of the AF-/AF+ ratios for a given histopathology and a given wavelength. These were in the order of 20% for (pre-)neoplastic lesions and up to 66% for normal bronchial wall from the mean values.
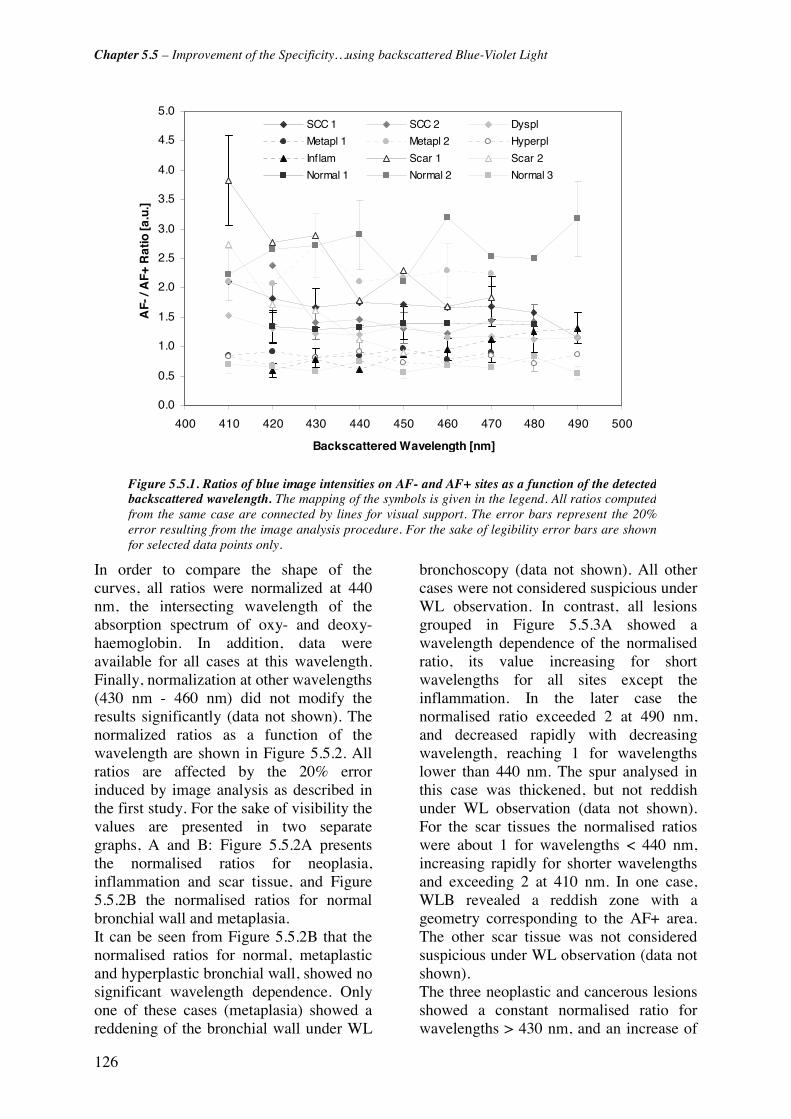
Chapter 5.5 – Improvement of the Specificity…using backscattered Blue-Violet Light
126
In order to compare the shape of the curves, all ratios were normalized at 440 nm, the intersecting wavelength of the absorption spectrum of oxy- and deoxy-haemoglobin. In addition, data were available for all cases at this wavelength. Finally, normalization at other wavelengths (430 nm - 460 nm) did not modify the results significantly (data not shown). The normalized ratios as a function of the wavelength are shown in Figure 5.5.2. All ratios are affected by the 20% error induced by image analysis as described in the first study. For the sake of visibility the values are presented in two separate graphs, A and B: Figure 5.5.2A presents the normalised ratios for neoplasia, inflammation and scar tissue, and Figure 5.5.2B the normalised ratios for normal bronchial wall and metaplasia. It can be seen from Figure 5.5.2B that the normalised ratios for normal, metaplastic and hyperplastic bronchial wall, showed no significant wavelength dependence. Only one of these cases (metaplasia) showed a reddening of the bronchial wall under WL
bronchoscopy (data not shown). All other cases were not considered suspicious under WL observation. In contrast, all lesions grouped in Figure 5.5.3A showed a wavelength dependence of the normalised ratio, its value increasing for short wavelengths for all sites except the inflammation. In the later case the normalised ratio exceeded 2 at 490 nm, and decreased rapidly with decreasing wavelength, reaching 1 for wavelengths lower than 440 nm. The spur analysed in this case was thickened, but not reddish under WL observation (data not shown). For the scar tissues the normalised ratios were about 1 for wavelengths < 440 nm, increasing rapidly for shorter wavelengths and exceeding 2 at 410 nm. In one case, WLB revealed a reddish zone with a geometry corresponding to the AF+ area. The other scar tissue was not considered suspicious under WL observation (data not shown). The three neoplastic and cancerous lesions showed a constant normalised ratio for wavelengths > 430 nm, and an increase of
0.0
0.5
1.0
1.5
2.0
2.5
3.0
3.5
4.0
4.5
5.0
400 410 420 430 440 450 460 470 480 490 500
Backscattered Wavelength [nm]
AF-
/ A
F+ R
atio
[a.u
.]
SCC 1 SCC 2 Dyspl
Metapl 1 Metapl 2 Hyperpl
Inflam Scar 1 Scar 2
Normal 1 Normal 2 Normal 3
Figure 5.5.1. Ratios of blue image intensities on AF- and AF+ sites as a function of the detectedbackscattered wavelength. The mapping of the symbols is given in the legend. All ratios computedfrom the same case are connected by lines for visual support. The error bars represent the 20%error resulting from the image analysis procedure. For the sake of legibility error bars are shownfor selected data points only.
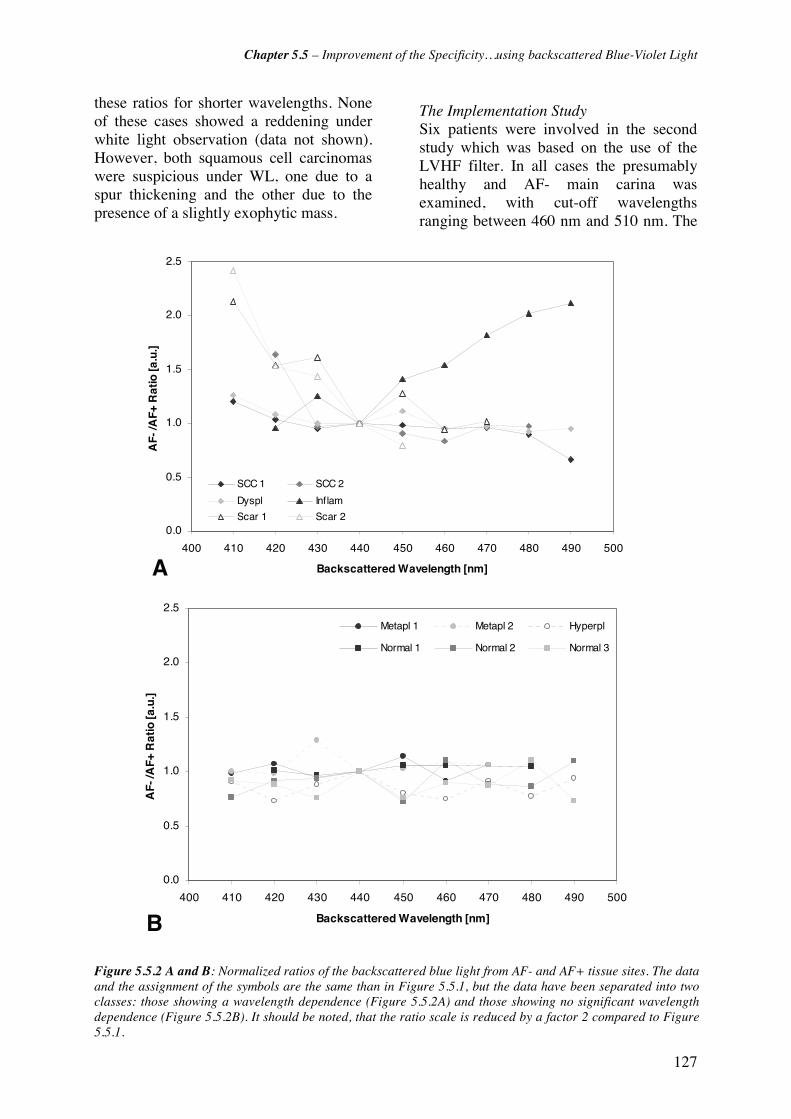
Chapter 5.5 – Improvement of the Specificity…using backscattered Blue-Violet Light
127
these ratios for shorter wavelengths. None of these cases showed a reddening under white light observation (data not shown). However, both squamous cell carcinomas were suspicious under WL, one due to a spur thickening and the other due to the presence of a slightly exophytic mass.
The Implementation Study Six patients were involved in the second study which was based on the use of the LVHF filter. In all cases the presumably healthy and AF- main carina was examined, with cut-off wavelengths ranging between 460 nm and 510 nm. The
0.0
0.5
1.0
1.5
2.0
2.5
400 410 420 430 440 450 460 470 480 490 500
Backscattered Wavelength [nm]
AF-
/AF+
Rat
io [a
.u.]
SCC 1 SCC 2
Dyspl Inflam
Scar 1 Scar 2
A
0.0
0.5
1.0
1.5
2.0
2.5
400 410 420 430 440 450 460 470 480 490 500
Backscattered Wavelength [nm]
AF-
/AF+
Rat
io [a
.u.]
Metapl 1 Metapl 2 Hyperpl
Normal 1 Normal 2 Normal 3
B
Figure 5.5.2 A and B: Normalized ratios of the backscattered blue light from AF- and AF+ tissue sites. The data and the assignment of the symbols are the same than in Figure 5.5.1, but the data have been separated into two classes: those showing a wavelength dependence (Figure 5.5.2A) and those showing no significant wavelength dependence (Figure 5.5.2B). It should be noted, that the ratio scale is reduced by a factor 2 compared to Figure5.5.1.
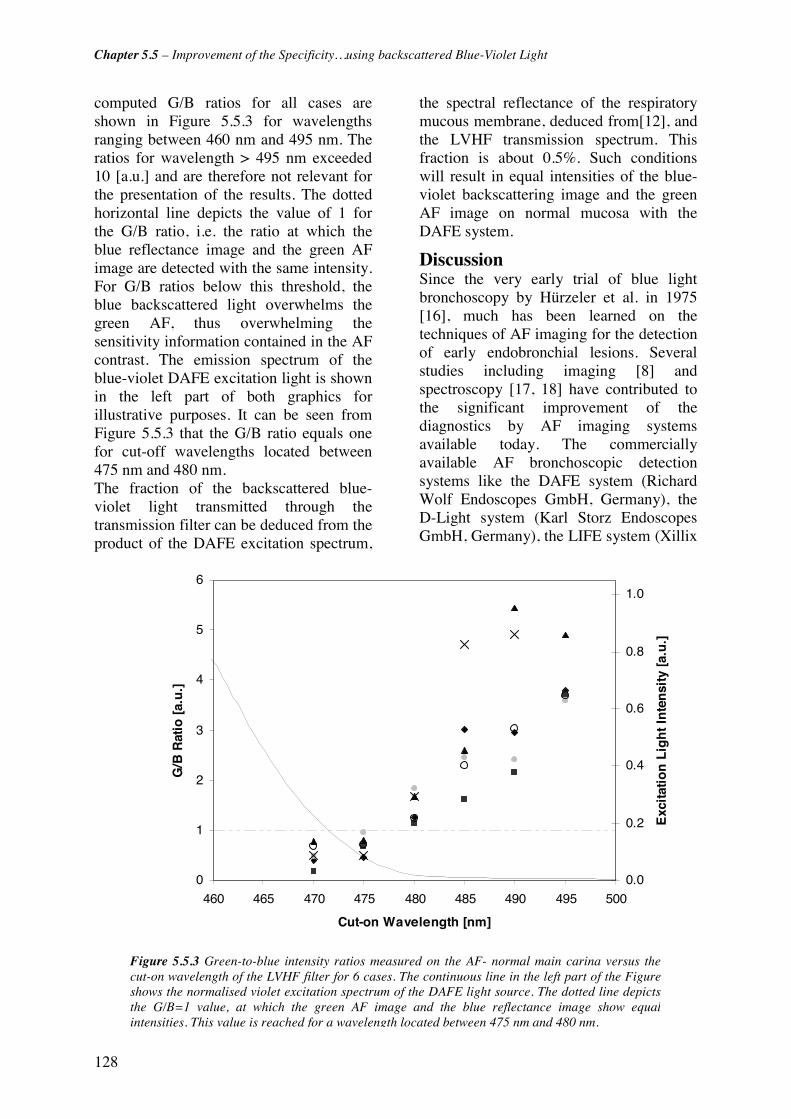
Chapter 5.5 – Improvement of the Specificity…using backscattered Blue-Violet Light
128
computed G/B ratios for all cases are shown in Figure 5.5.3 for wavelengths ranging between 460 nm and 495 nm. The ratios for wavelength > 495 nm exceeded 10 [a.u.] and are therefore not relevant for the presentation of the results. The dotted horizontal line depicts the value of 1 for the G/B ratio, i.e. the ratio at which the blue reflectance image and the green AF image are detected with the same intensity. For G/B ratios below this threshold, the blue backscattered light overwhelms the green AF, thus overwhelming the sensitivity information contained in the AF contrast. The emission spectrum of the blue-violet DAFE excitation light is shown in the left part of both graphics for illustrative purposes. It can be seen from Figure 5.5.3 that the G/B ratio equals one for cut-off wavelengths located between 475 nm and 480 nm. The fraction of the backscattered blue-violet light transmitted through the transmission filter can be deduced from the product of the DAFE excitation spectrum,
the spectral reflectance of the respiratory mucous membrane, deduced from[12], and the LVHF transmission spectrum. This fraction is about 0.5%. Such conditions will result in equal intensities of the blue-violet backscattering image and the green AF image on normal mucosa with the DAFE system.
Discussion Since the very early trial of blue light bronchoscopy by Hürzeler et al. in 1975 [16], much has been learned on the techniques of AF imaging for the detection of early endobronchial lesions. Several studies including imaging [8] and spectroscopy [17, 18] have contributed to the significant improvement of the diagnostics by AF imaging systems available today. The commercially available AF bronchoscopic detection systems like the DAFE system (Richard Wolf Endoscopes GmbH, Germany), the D-Light system (Karl Storz Endoscopes GmbH, Germany), the LIFE system (Xillix
0
1
2
3
4
5
6
460 465 470 475 480 485 490 495 500
Cut-on Wavelength [nm]
G/B
Rat
io [
a.u
.]
0.0
0.2
0.4
0.6
0.8
1.0
Exc
itat
ion
Lig
ht
Inte
nsi
ty [
a.u
.]
Figure 5.5.3 Green-to-blue intensity ratios measured on the AF- normal main carina versus thecut-on wavelength of the LVHF filter for 6 cases. The continuous line in the left part of the Figureshows the normalised violet excitation spectrum of the DAFE light source. The dotted line depictsthe G/B=1 value, at which the green AF image and the blue reflectance image show equalintensities. This value is reached for a wavelength located between 475 nm and 480 nm.

Chapter 5.5 – Improvement of the Specificity…using backscattered Blue-Violet Light
129
Inc., Canada) and the SAFE system (Pentax Corp., Japan) proved to be highly effective for early cancer detection and localisation in the tracheo-bronchial tree [8, 9, 11, 19]. Nevertheless, all authors report poor specificity with this detection method. In a very recent study with the LIFE system, Chhajed et al. [11] reported a sensitivity of AF imaging of 96%, while the specificity (23%) was inferior to that of conventional white light fibroscopy (53%). To our best knowledge only a few comprehensive studies aimed at improving the specificity of the aforementioned AF systems have been reported up to now [18]. In two independent studies published recently, the authors used white light reflectance spectroscopy to increase the specificity of AFB [20, 21]. The reflectance measurements were performed either with a probe inserted in the bronchi or with the central part of the bronchoscopic image projected onto the bronchoscope eyepiece. One advantage of our imaging approach is that the AF and the backscattering signal are detected simultaneously over the entire field of vision, while the aforementioned methods rely on the probing of selective and rather limited areas. This is of great importance for the development of future AF detection systems, namely ccd-tipped videoendoscopes for WL and AF detection, as described by [22, 23].
The Reflectance Imaging Study The studies presented here exploit several morphometric features of angiogenesis as it develops in inflammatory and (pre-)neoplastic bronchial lesions, reported by Fontanini et al. [14], Keith et al. [15] and Fisseler-Eckhoff et al. [13] among others, by using blue-violet backscattered light detection. All these authors report a significant increase in the microvessel density in the subepithelial tissue layers, i.e. in the lamina propria and the submucosa, associated with the presence of moderate dysplasia and in situ carcinoma. Fisseler-Eckhoff and Keith found increasing angiogenesis in the vicinity of the basement membrane of samples
presenting dysplasia and CIS. Keith even reported the presence of capillary blood vessels closely juxtaposed to, or even projecting into the dysplastic bronchial epithelium, a phenomenon known as angiogenic squamous dysplasia (ASD). In an endoscopic study using a high magnification videobronchoscope in combination with narrow band imaging between 400 nm and 430 nm, Shibuya and coworkers [24] were able to differentiate between microvessel patterns of lesions with and without ASD. Thus, early cancerous and neoplastic lesions in the bronchi are characterised by an increase in blood content within the tissue close to the basement membrane. This statement is further supported by Bard et al. [21] who performed in vivo reflectance spectroscopy on malignant and non-malignant tissues. This group found a lower reflectance in the short wavelength region on malignant tissues relative to non-malignant tissues. All these findings correspond well to our observation that carcinoma shows a relative increase in the absorption of short wavelength blue-violet light, inferior to 430 nm, compared to healthy tissue. These wavelengths match the absorption peak of oxygenated and deoxygenated haemoglobin, and should be absorbed more than average by tissue showing a high concentration of blood. Vascular conditions similar to those observed in early carcinomas are also found in newly formed scar tissue. This type of tissue forms following injury or surgery, as in the cases presented here and is characterised by a dense system of neovessels that increase the tissue blood content close to the tissue surface. This explains why the newly formed scar tissue in our study showed an important decrease in the blue violet backscattering when approaching the haemoglobin absorption wavelengths below 430 nm. The unique case of clearly documented inflammation in our study showed a wavelength-ratio dependence opposite to that of dysplasia/squamous cell carcinoma and scar tissues. The backscattered blue-
Chapter 5.5 – Improvement of the Specificity…using backscattered Blue-Violet Light
130
violet light ratio between the AF- surrounding and the AF+ inflammation was significantly higher at wavelengths longer than 440 nm than for the shorter ones. At first this seems astonishing in the context of the blood absorption “theory”, since the absorption coefficient of haemoglobin at 470 nm is about one order of magnitude smaller than at 410 nm (data adapted from [25]). However, the decreased backscattering of this lesion of long wavelength blue-violet light compared to short wavelengths can be explained by a neovascularisation and vasodilatation rather localised deep below the surface in the inflammatory tissue, as compared to the more superficial neovascularisation typically present in carcinoma and scar tissue. Indeed, the penetration depth into bronchial tissue for wavelengths around 470 nm is about a factor 5 higher than for wavelengths around 410 nm (data adapted from [12]). If the neovessels are deep enough, the backscattering of short blue-violet wavelengths on the inflammatory tissue site will be less affected by haemoglobin absorption than the backscattering of long wavelengths. A similar effect has been described by Kienle et al. [26] for the explanation of the bluish appearance of veins in skin. The fact, that the inflammation was non-suspicious and without any signs of reddening when observed with WL, underlines the theory of a “deep” localisation of the neovascularisation. Hyperplastic and metaplastic tissues show a lower but still significant increase in the microvessel density compared to normal tissue, than it is the case for dysplasia and CIS [13]. Consequently, one would expect hyperplasia and metaplasia to show a wavelength dependent backscattering behaviour of blue-violet light. However, our measurements did not show any wavelength dependence. The depth where increased blood concentration occurs in the tissue could provide the explanation. If the relative increase in blood concentration in the sub-epithelial layers is superficial but
not in close vicinity to the basement membrane, the backscattering might show a wavelength independent behaviour due to a neutralisation of the effects described above for the dysplasia/squamous cell carcinoma and the inflammation. Of note is that all lesions examined in this study showed positive fluorescence, i.e. a decrease in the green AF. As already mentioned before, epithelial thickening as well as changes in the haemoglobin and fluorochrome concentration in the sub-epithelial layer during cancerogenesis are possible explanations [9, 12, 21, 27]. Since all tissues exhibiting positive fluorescence under blue-violet excitation do not show similar backscattering properties for the blue-violet light, it is likely that different “in depth” distributions of haemoglobin take place between these different tissues. Indeed, in microscopic ex vivo studies Qu et al. [12] showed that the AF of bronchial tissue is predominantly generated in the sub-epithelial tissue layers while the superficial epithelium exhibits very low fluorescence. Therefore the detected fluorescence signal originates from deep tissue layers, while the backscattering of light is more superficial. The thickness of the bronchial epithelium increases from 40 μm - 50 μm in normal tissue and to more than 120 μm in CIS [12]. In dysplasia and CIS the thickening is associated with an enlargement of the cell nuclei, i.e. a shift of the nucleus/cytoplasm ratio in favour of the nuclei, pleomorphism, hypercellularity and a continuous decomposition of the basement membrane [13, 28]. The optical properties of normal bronchial tissue and invasive SCC have been investigated by Qu and coworkers [12]. Normal epithelium shows only low absorption independent of the wavelength. The thickening of the epithelial layer in combination with the wavelength-dependent increase in the absorption coefficient for the sub-epithelial layer will positively amplify the selective absorption of short blue-violet wavelength in neoplastic and early cancerous lesions. This will not only decrease the intensity of

Chapter 5.5 – Improvement of the Specificity…using backscattered Blue-Violet Light
131
the blue-violet light backscattered from the tissue, but also decrease the AF generated in and detected from the diseased tissue, producing an AF intensity contrast. It should be noted that squamous metaplasia and hyperplasia alike neoplastic changes are characterised by a thickening of the epithelial layer. They are therefore likely to show similar changes as neoplasia and early cancers in their AF intensity relative to normal tissue. The reflectance imaging study was designed to investigate the potential of backscattered blue-violet light detection to improve the sensitivity of AFB. According to our preliminary findings two blue-violet wavelength regions below 430 nm and near 450 nm are well suited for this purpose. However, false positives resulting from scar tissue will not be discriminated from the true positive lesions. Fortunately scars can usually be identified as AFB false positives by considering their texture, location and the patient's clinical history, making them non critical false positives. Finally, it should be noted that only one properly documented inflammatory site exhibiting positive AF but being unsuspicious in WLB, has been involved in this study. However, most inflammations show a reddening of the tissue under WL observation due to hyperaemia, i.e. increased blood perfusion in the tissue near the surface. Therefore we do not expect such WL+ inflammations to exhibit blue-violet backscattering properties similar to those of dysplasia, SCC and scar lesions. Consequently, AF+ and WL+ inflammatory lesions might not be rejected as false positives when using backscattered blue-violet light below 430 nm. This issue is the subject of further studies being conducted by our group. The clinical in vivo studies presented in this work are based on a limited number of cases, due to the restrictive inclusion conditions, i.e. only patients showing AF+, but WL- tissue sites. Moreover, for the sake of image analysis the respective AF+ areas needed to be oriented perpendicular to the endoscope optics, to avoid spectral
artefacts. All images recorded had to show both the AF+ area and surrounding AF- tissue, without any sites of bleeding or retention of mucous. Only a few of the cases examined with the DAFE system over a one year period fulfilled these criteria. Upon image analysis, the AF-/AF+ ratios computed for a given wavelength showed large variations from one case to another, as seen in Figure 5.5.1. This is primarily due to the inter-patient changes of the tissue-endoscope distance and the bronchial anatomy. The AF-/AF+ ratios computed for nearby wavelengths in a given case showed significantly smaller variations. Indeed, those intra-case variations are due to the error induced by our image analysis method, as already described in Materials and Methods. In other words, the light intensity computed from a given image zone strongly correlates with the tissue-endoscope distance. A tissue area close to the optics will have a 4 times higher light intensity than an area situated twice as far away. For technical and anatomical reasons, it is not feasible to observe all bronchoscopic sites from the same distance with the same viewing angle. This potentially causes tissue areas having the same reflectivity to give different intensity values. To illustrate this problem we computed blue intensity level values from AF- tissue areas in the close and far plane of the image. The results showed variations of about 35% around the mean intensity level value (data not shown). Similar variations were observed for AF+ tissue areas. Therefore particular attention was paid to selecting AF- and AF+ analysis areas situated as close as possible to each other, within the same image plane. Moreover, images from a given case detected at different wavelengths were chosen to appear under similar viewing angles. This procedure allowed us to minimize the intra-case error for the intensity to about 10% (data not shown) and to compare the ratios computed from a given case at different wavelengths.

Chapter 5.5 – Improvement of the Specificity…using backscattered Blue-Violet Light
132
Implementation Study The implementation of backscattered blue-violet light detection in the existing DAFE system required the replacement of the high pass emission filter in front of the camera by a similar high pass filter with an additional low transmission below 430 nm. A transmission band centred near 415 nm with a FWHM of 15 nm allowed us to take full advantage of the blood absorption. This value had to be about 0.25% of the backscattered light collected by the endoscope to create equal intensities of the blue and green images during AFB. Our future emission filter will be a high pass filter with a cut-off wavelength around 477 nm and an additional transmission band ranging from 410 nm to 450 nm (square profile) with a transmission of 0.5%. It should be noted that our computations of the transmission value of the filter at 415 nm from the experimental data obtained at 480 nm were based on the assumption that the intensity signal detected by the blue CCD of the camera is independent of the wavelength. The sensitivity of the DAFE camera is wavelength dependent and decreases markedly for wavelengths below 410 nm. The wavelength sensitivity S(λ) of the camera has to be taken into account for a more precise computation of the transmission value of the emission filter. In summary, we have shown in this work, that the detection of a blue image resulting from short wavelength backscattered light in addition to the green and red AF images has the potential to discriminate AF+ neoplastic tissues that are WL- from benign ones, thus improving the specificity of AFB.

Chapter 5.5 – Improvement of the Specificity…using backscattered Blue-Violet Light
133
References [1] F. Levi, F. Lucchini, C. La Vecchia, E. Negri and F. Levi, "Trends in mortality from major cancers in the European Union, including acceding countries, in 2004," Cancer 101(1), 2843-2850 (2004)
[2] A. Jemal, T. Murray, A. Ghafoor, A. Samuels, E. Ward, M. J. Thun, R. C. Tiwari and E. J. Feuer, "Cancer Statistics, 2004," Ca-A Cancer Journal for Clinicians 54(1), 8-29 (2004)
[3] Y.-P. Liaw, G.-W. Lien and Y.-C. Huang, "Patterns of lung cancer mortality in 23 countries: Application of the Age-Period-Cohort model," BMC Public Health 5((2005)
[4] A. Jemal, L. X. Clegg, E. Ward, L. A. G. Ries, X. Wu, P. M. Jamison, P. A. Wingo, H. L. Howe, R. N. Anderson and B. K. Edwards, "Annual report to the nation on the status of cancer, 1975-2001, with a special feature regarding survival," Cancer 101(1), 3-27 (2004)
[5] G. Bepler, B. Djulbegovic, R. A. Clark and M. Tockman, "A systemic review and lessons learned from early lung cancer detection trial using low-dose computed tomography of the chest," Cancer Control 10(4), 306-324 (2003)
[6] H. Kato, "Photodynamic therapy for lung cancer - A review of 19 years' experience," Journal of Photochemistry and Photobiology B: Biology 42(2), 96-99 (1998)
[7] F. R. Hirsch, W. A. Franklin, A. F. Gazdar and J. Bunn P.A., "Early detection of lung cancer: Clinical perspectives of recent advances in biology and radiology," Clinical Cancer Research 7(1), 5-22 (2001)
[8] D. Goujon, M. Zellweger, A. Radu, G. P., B.-C. Weber, H. van den Bergh, P. Monnier and G. Wagnières, "In vivo autofluorescence imaging of early cancers in the human tracheobronchial tree with a spectrally optimized system," J Biomed Optics 8(1), 17-25 (2003)
[9] G. Wagnières, A. McWilliams and S. Lam, "Lung cancer imaging with fluorescence endoscopy," in Handbook of Biomedical Fluorescence, M.-A. Myceck and B. W. Pogue, pp. 361-396, Marcel Dekker, Inc. (2003).
[10] T. C. Kennedy, S. Lam and F. R. Hirsch, "Review of recent advances in fluorescence bronchoscopy in early localization of central airway lung cancer," Oncologist 6(3), 257-262 (2001)
[11] P. N. Chhajed, K. Shibuya, H. Hoshino, M. Chiyo, K. Yasufuku, K. Hiroshima and T. Fujisawa, "A comparison of video and autofluorescence bronchoscopy in patients at high risk of lung cancer," European Respiratory Journal 25(6), 951-955 (2005)
[12] J. Qu, C. MacAulay, S. Lam and B. Palcic, "Optical properties of normal and carcinomatous bronchial tissue," Applied Optics 33(31), 7397-7405 (1994)
[13] A. Fisseler-Eckhoff, D. Rothstein and K. M. Müller, "Neovascularization in hyperplastic, metaplastic and potentially preneoplastic lesions of the bronchial mucosa," Virchows Arch 429(2-3), 95-100 (1996)
[14] G. Fontanini, A. Calcinai, L. Boldrini, M. Lucchi, M. Mussi, C. A. Angeletti, C. Cagno, M. A. Tognetti and F. Basolo, "Modulation of neoangiogenesis in bronchial preneoplastic lesions," Oncol Rep 6(4), 813-817 (1999)
[15] R. L. Keith, Y. E. Miller, R. M. Gemmill, H. A. Drabkin, E. C. Dempsey, T. C. Kennesy, S. Prindiville and W. A. Franklin, "Angiogenic squamous dysplasia in bronchi of individuals at high risk for lung cancer," Clinical Cancer Research 6(5), 1616-1625 (2000)
[16] D. Hürzeler, "Blue light endoscopy," Laryngoscope 85(8), 1374-1378 (1975)
[17] M. Zellweger, D. Goujon, R. Conde, M. Forrer, H. van den Bergh and G. Wagnières, "Absolute autofluorescence spectra of human healthy, metaplastic, and early cancerous bronchial tissue in vivo," Applied Optics 40(22), 3784-3791 (2001)
[18] M. Zellweger, P. Grosjean, D. Goujon, P. Monnier, H. van den Bergh and G. Wagnières, "In vivo autofluorescence spectroscopy of human bronchial tissue to optimize the detection and imaging of early cancers," J Biomed Optics 6(1), 41-51 (2001)
[19] K. Häußinger, F. Stanzel, R. M. Huber, J. Pichler and S. H., "Autofluorescence detection of bronchial tumors with the D-Light/AF," Diagnostic and Therapeutic Endoscopy 5(2), 105-112 (1999)
[20] M. Tercelj, H. Zeng, M. Petek, T. Rott and B. Palcic, "Acquisition of fluorescence and reflectance spectra during routine bronchoscopy examinations using the ClearVu Elite(TM) device: Pilot study," Lung Cancer 50(1), 35-42 (2005)
[21] M. R. L. Bard, A. Amelink, M. Skurichina, M. den Bakker, S. A. Burgers, J. P. van Meerbeck, R.

Chapter 5.5 – Improvement of the Specificity…using backscattered Blue-Violet Light
134
P. W. Duin, J. G. J. V. Aerts, H. C. Hoogsteden and H. J. C. M. Sterenborg, "Improving the specificity of fluorescence bronchoscopy for the analysis of neoplastic lesions of the bornchial tree by comvination with optical spectroscopy: preliminary communication," Lung Cancer 47(1), 41-47 (2005)
[22] M. A. Kara, F. P. Peters, F. J. W. Ten Kate, S. J. Van Deventer, P. Fockens and J. J. G. H. M. Bergman, "Endoscopic video autofluorescence imaging may improve the detection of early neoplasia in patients with Barrett's esophagus," Gastrointestinal Endoscopy 61(6), 679-685 (2005)
[23] Pentax Europe GmbH, "PENTAX SAFE-3000– erstes Autofluoreszenz Video-Bronchoskopie System," http://www.pentax.nl/4medical/nieuws/productnieuws/pdfs/barcelona_fin2.pdf, accessed on 22.02.2006
[24] K. Shibuya, H. Hoshino, M. Chiyo, A. Iyoda, S. Yoshida, Y. Sekine, T. Iizasa, Y. Saitoh, M. Baba, K. Hiroshima, H. Ohwada and T. Fujisawa, "High magnification bronchovideoscpy combined with narrow band imaging could detect capillary looops of angiogenic squamous dysplasia in heavy smokers at high risk for lung cancer," Thorax 58(11), 989-995 (2003)
[25] S. Prahl, "Optical absorption of hemoglobin," http://omlc.ogi.edu/spectra/hemoglobin/, accessed on 22.02.2006
[26] A. Kienle, L. Lilge, A. V. Vitkin, M. S. Patterson, B. C. Wilson, R. Hibst and R. Steiner, "Why do veins appear blue? A new look at an old question," Applied Optics 35(7), 1151-1160 (1996)
[27] J. Qu, C. MacAulay, S. Lam and B. Palcic, "Laser-induced fluorescence spectroscopy at endoscopy: tissue optics, Monte Carlo modeling and in vivo measurements," Optical Engineering 34(11), 3334-3343 (1995)
[28] E. Brambilla, W. D. Travis, T. V. Colby, B. Corrin and Y. Shimosato, "The new World Health Organization classification of lung tumours," Eur Respir J 18(6), 1059-1068 (2001)

135
5.6 Design of an endosocopic optical reference to be used for autofluorescence bronchoscopy with the DAFE system
Tanja Gabrecht1, Blaise Lovisa1, François Borle1, Georges Wagnières1* 1 Swiss Federal Institute of Technology (EPFL), Laboratory for Air and Soil Pollution, 1015 Lausanne, Switzerland
Abstract: We present the design of a sterilisable optical reference to characterise and quantify the inter-patient variations in the tissue autofluorescence (AF) during autofluorescence bronchoscopy (AFB) with the Richard Wolf’s DAFE system. The reference was designed to have optical and spectral properties similar to those of the human bronchial wall in spectral conditions corresponding to AFB conducted with the DAFE system (fluorescence excitation at 390 nm – 470 nm and red illumination at 590 nm – 680 nm). The reference’s effective attenuation coefficient and reflectance were measured at 685 nm. In addition its fluorescence emission spectrum was determined under 410 nm wavelength excitation. The reference is photostable, reproducible, biocompatible and small enough to be easily inserted in the working channel of a conventional bronchofiberscope. This cylindrical (length: 2mm; diameter: 2mm) optical reference was validated in a clinical environment. Submitted to Physics in Medicine and Biology
Chapter 5.6 – Design of an endoscopic optical Reference…
136
Introduction Autofluorescence bronchoscopy (AFB) has proven to be a highly sensitive tool for the detection and localisation of early bronchial cancers and pre-cancers that remain invisible with conventional white light bronchoscopy (WLB) [1-3]. Several AFB imaging systems are commercially available today [4]. They are all based on the visualisation of the spectral and intensity contrast of the tissue autofluorescence (AF) between healthy bronchial tissue and (pre-)neoplastic lesions when excited with light in the blue-violet wavelength region. Most systems use filtered Xenon (Xe) arc lamps [1, 5, 6] or laser sources [7] for the AF excitation. The detection and imaging of the AF is performed with intensified or non-intensified endoscopic colour video cameras. Early neoplastic or neoplastic bronchial lesions exhibit a significant decrease of the AF intensity[8-10]. The group in Lausanne reported a detailed spectral study demonstrating that this decrease is more marked in the green part of the spectrum, i.e. between 490 nm and 600 nm [10]. Using additional red backscattered light as a constant background instead of the red (600 nm – 800 nm) tissue AF offers one possible method to improve the performance of AFB. Such an approach will result in more contrasted images after the multispectral (red/green) image detection and processing procedure, because the red AF presents an intensity decrease on bronchial lesions. Using an optimised amount of red backscattered light, the contrast can be increased by a factor 2 [10]. Indeed, the AFB system used in Lausanne employs red backscattered light for contrast improvement. Spectrofluorometric point measurement studies in the human tracheo-bronchial tree have revealed significant fluctuations > 50% in the AF intensities of healthy bronchial mucosa among different individuals ("inter-patient fluctuations") [11]. Clinical practice has shown that these
fluctuations, in terms of brightness and colour aspect, are quite common between individuals in AFB [4]. Such inter-patient fluctuations can adversely affect the learning curve of AF bronchoscopists. Therefore, quantitative measurements of the fluctuations are important for the design of future AFB systems. To our best knowledge, no quantitative in vivo data of the inter-patient fluctuations of the bronchial AF has been reported up to now. Quantification of the AF intensity using imaging techniques is based on the retrospective analysis of the digitised intensity levels detected by the cameras in different colour channels. It demands the use of an optical/ fluorescence standard or reference that can be used in the bronchi during AF image acquisition. Such a reference, placed in such a way that it fills a small portion of the field of view, allows to correct the AF image for the settings of the AFB system at the time of recording and to compare the AF signals from different endoscopic sites with one another. The design of such a reference is not easy as its optical and mechanical properties must match a precise set of requirements. Its fluorescence properties should ideally match the AF properties of healthy bronchial mucosa in terms of spectroscopy and intensity. This latter feature is critical for preventing saturation of the camera. As the DAFE system detects backscattered red light around 680 nm, the reference’s reflectance at this wavelength must necessarily be similar to that of the bronchial mucosa. The optical properties of the reference must be stable and the physical dimensions of the reference need to be small enough to be inserted through the working channel of the bronchoscopic optics. Moreover, the material must be biocompatible and endure decontamination procedures. In this work we present the design, characterisation and first clinical application of an endoscopic reference for the Richard Wolf’s DAFE (Diagnostic AutoFluorescence Endoscopy) system

Chapter 5.6 – Design of an endoscopic optical Reference…
137
(Richard Wolf Endoscopes GmbH, Germany).
Materials and Methods Design of the endoscopic reference Due to the excitation/illumination properties (violet excitation light and red backscattered light) of the DAFE system, the endoscopic reference must exhibit tissue like fluorescence between 490 and 600 nm and backscattering properties around 680 nm, as mentioned above. We selected a white opaque polymethyl methacrylate (PMMA) acrylic glass (Perspex ® Blanc Opal 1X20, Lucite Solutions U.K.) for the endoscopic reference. This material is easy to process and demonstrates resistance to conventional sterilisation detergents used in the hospital. Its Rockwell hardness is 101, according to the manufacturer’s specifications. Small cylinders 2 mm in diameter and 2 mm in length were machined and provided with a central longitudinal drilling of 0.5 mm diameter. The outer diameter of the cylinder was chosen according to the inner diameter of the working channel of the bronchofiberscopes being used for AFB in the local hospital. The cylinder was beaded on a surgical steel guide wire (Unimed, Switzerland) with a diameter of 0.5 mm and a length of 2 m. A small bead was formed at the distal tip of the guide wire by thermal heating, to prevent the cylinder from slipping off the wire. Biocompatible and non-fluorescing epoxy resin (Epo-Tek 301, Epoxy Technology, USA, Distributor: Polyscience AG, Switzerland) was applied to the distal tip of the guide wire to keep the PMMA cylinder in position and to round up the tip. This was necessary to prevent damage to the patient's mucosa during measurement. A mechanical adjustable marker was set on the proximal end of the guide wire to assure a constant distance of 7 mm between the bronchoscope tip and the reference during measurements. The position of the marker was adjusted prior
to each bronchoscopy for the length of the bronchofiberscope to be used. An image of the endoscopic reference is shown in Figure 5.6.1.
Figure 5.6.1 Close-up look at the endoscopic reference protruding out of the working channel of the AFB bronchofiberscope.
The imaging system Endoscopic procedures were performed according to the guidelines approved by the ethical committee of the CHUV University Hospital. The DAFE system used in this study has been described in detail elsewhere [12]. Briefly, it consisted of a filtered endoscopic Xenon light source and a filtered 3 CCD endoscopic colour camera. A flip-flop filter system in the light source controlled by a foot switch allowed for rapid changes between conventional WL illumination (WL mode)(390 nm - 680 nm) and blue-violet AF excitation (AFB mode) (430 nm ± 40 nm). In the AFB mode, a small variable amount of red light around 685 nm was added to the blue-violet excitation. The red light was detected in the backscattering mode to create a background image and to improve the spectral contrast between healthy mucosa and lesions [13, 14]. The light from the light source was delivered to the endoscopic site via a liquid light guide and the bronchoscope optics. The endoscopic images were captured by the endoscopic camera that was clipped to the optic's eyepiece. A 475 nm long pass filter in the camera objective eliminated all blue-violet AF excitation light. The spectral detection ranges for the three camera
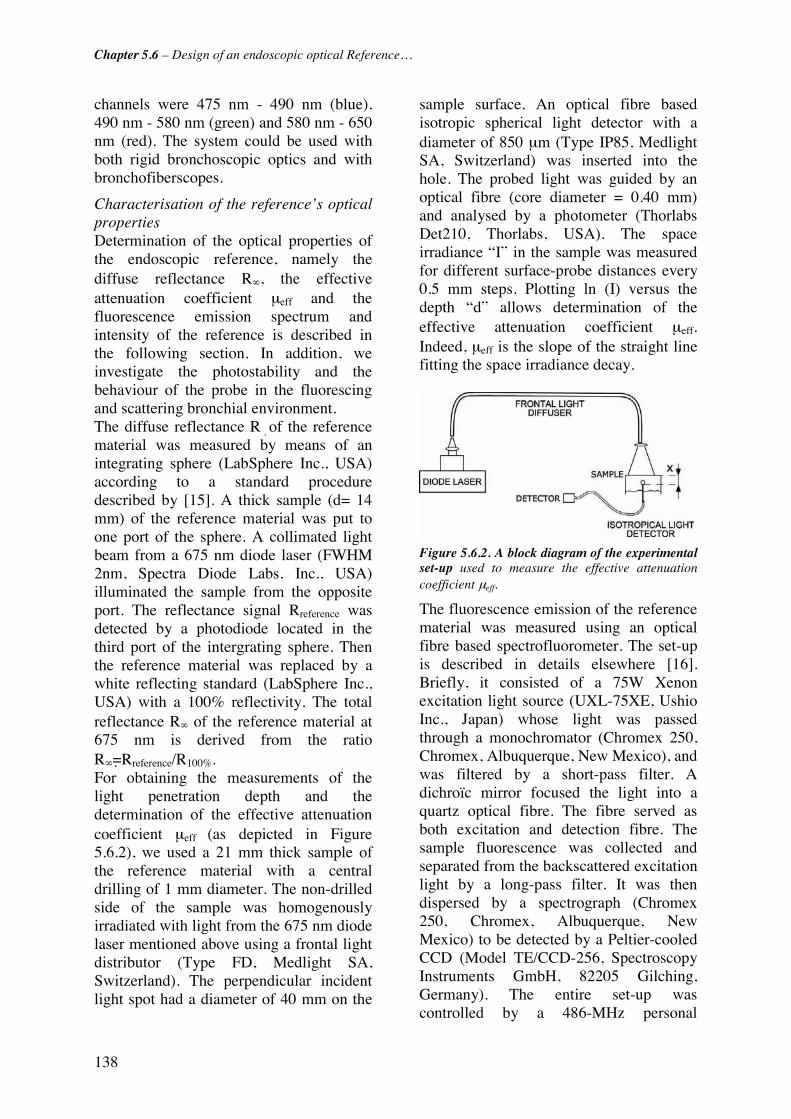
Chapter 5.6 – Design of an endoscopic optical Reference…
138
channels were 475 nm - 490 nm (blue), 490 nm - 580 nm (green) and 580 nm - 650 nm (red). The system could be used with both rigid bronchoscopic optics and with bronchofiberscopes.
Characterisation of the reference’s optical properties Determination of the optical properties of the endoscopic reference, namely the diffuse reflectance R∞, the effective attenuation coefficient μeff and the fluorescence emission spectrum and intensity of the reference is described in the following section. In addition, we investigate the photostability and the behaviour of the probe in the fluorescing and scattering bronchial environment. The diffuse reflectance R�of the reference material was measured by means of an integrating sphere (LabSphere Inc., USA) according to a standard procedure described by [15]. A thick sample (d= 14 mm) of the reference material was put to one port of the sphere. A collimated light beam from a 675 nm diode laser (FWHM 2nm, Spectra Diode Labs, Inc., USA) illuminated the sample from the opposite port. The reflectance signal Rreference was detected by a photodiode located in the third port of the intergrating sphere. Then the reference material was replaced by a white reflecting standard (LabSphere Inc., USA) with a 100% reflectivity. The total reflectance R∞ of the reference material at 675 nm is derived from the ratio R∞=Rreference/R100%. For obtaining the measurements of the light penetration depth and the determination of the effective attenuation coefficient μeff (as depicted in Figure 5.6.2), we used a 21 mm thick sample of the reference material with a central drilling of 1 mm diameter. The non-drilled side of the sample was homogenously irradiated with light from the 675 nm diode laser mentioned above using a frontal light distributor (Type FD, Medlight SA, Switzerland). The perpendicular incident light spot had a diameter of 40 mm on the
sample surface. An optical fibre based isotropic spherical light detector with a diameter of 850 μm (Type IP85, Medlight SA, Switzerland) was inserted into the hole. The probed light was guided by an optical fibre (core diameter = 0.40 mm) and analysed by a photometer (Thorlabs Det210, Thorlabs, USA). The space irradiance “I” in the sample was measured for different surface-probe distances every 0.5 mm steps. Plotting ln (I) versus the depth “d” allows determination of the effective attenuation coefficient μeff. Indeed, μeff is the slope of the straight line fitting the space irradiance decay.
Figure 5.6.2. A block diagram of the experimental set-up used to measure the effective attenuation coefficient μeff.
The fluorescence emission of the reference material was measured using an optical fibre based spectrofluorometer. The set-up is described in details elsewhere [16]. Briefly, it consisted of a 75W Xenon excitation light source (UXL-75XE, Ushio Inc., Japan) whose light was passed through a monochromator (Chromex 250, Chromex, Albuquerque, New Mexico), and was filtered by a short-pass filter. A dichroïc mirror focused the light into a quartz optical fibre. The fibre served as both excitation and detection fibre. The sample fluorescence was collected and separated from the backscattered excitation light by a long-pass filter. It was then dispersed by a spectrograph (Chromex 250, Chromex, Albuquerque, New Mexico) to be detected by a Peltier-cooled CCD (Model TE/CCD-256, Spectroscopy Instruments GmbH, 82205 Gilching, Germany). The entire set-up was controlled by a 486-MHz personal
Chapter 5.6 – Design of an endoscopic optical Reference…
139
computer (Fast 486/50, Spectroscopy Instruments GmbH, 8225 Gilching, Germany). The excitation wavelength was 405 nm ± 15 nm. The typical total power at the distal end of the fibre was 15 μW. For the measurements the distal tip of the optical fibre was put in slight contact with a 3 mm thick sample of the reference material.
Photostability of the reference material According to the manufacturer's specifications, the selected PMMA material is considered to be weatherstable [17], i.e. stable under UV irradiation. We assessed the photostability of the reference material by longtime exposition to a high intensity IR-filtered WL source (Light Projector 5137, Richard Wolf GmbH, Germany). One half of the surface of a 40 mm x 40 mm plate of the reference material (thickness 3 mm) was covered with lightproof, black aluminium foil. The plate's whole surface was then exposed homogeneously to intensive white light (range 390 nm – 680 nm) from the light source. The irradiance on the plate's surface was 25 mW/cm2. Irradiation was performed during a 7 hour period, resulting in a total light dose of 630 J/cm2 on the plate's surface. After irradiation the fluorescence and backscattering properties from the shielded and the unshielded half of the plate, were compared by imaging with the DAFE system.
Influence of the environmental green and red space irradiance in the bronchi The behaviour of the reference in a fluorescing and light scattering environment (the "space irradiance modification") was investigated in one patient undergoing diagnostic DAFE bronchoscopy. This test was performed under local anaesthesia using an Olympus BF30 bronchofiberscope (Olympus Corp., Japan). The bronchoscope was placed in the right primary bronchus with the light source set in the DAFE mode. The reference was inserted into the bronchi via the biopsy channel of the
bronchofiberscope. The spacer on the guide wire was set to allow the reference to extend 7 mm out of the bronchofiberscope. Then the bronchoscope was slowly redrawn towards the trachea, placing the reference in close contact to and at several different distances from the bronchial wall. Then the entire bronchoscope-reference unit was removed from the patient. The bronchoscope tip with the protruding reference was placed in a 40 cm x 50 cm non-fluorescing and non-reflecting black box with the same illumination and detection settings of the DAFE system. The whole procedure (bronchoscopy and black box observations) was recorded by a digital video (DV) recorder (Sony DSR-11, Sony Corp., Japan). Still images from different positions of the reference in the bronchi and in the black box were digitised using the IEEE 1394 interface of the DV recorder and a personal computer. In each image the red (R) and green (G) intensity level values were computed from an area on the reference and an area on the neighbouring healthy bronchial wall. All intensity level values were corrected for the gamma factor of the camera (gamma =0.62) and the image background. The intensity level values were computed from the reference as a function of the intensity level values of the tissue and the distance between reference and bronchial wall were compared.
Results Figure 5.6.3 shows the endoscopic reference in the upper bronchial tree during bronchoscopy. The distance between the proximal face of the reference and the bronchofiberscope's tip is about 7 mm. The two specular reflections on the reference's surface result from the two illumination fibre bundles of the bronchofiberscope. The diffuse reflectance of the reference material at 675 nm was determined to be 73%. The results from the measurements of the effective attenuation coefficient at the same wavelength are shown in Figure

Chapter 5.6 – Design of an endoscopic optical Reference…
140
5.6.4. In this graphic, the ln(I) is plotted against the measurement depth “d”. As mentioned above, the effective attenuation coefficient corresponds to the slope of the linear function fitting the measurements. It was determined to be 0.14 mm-1 ± 0.02 mm-1. Thus, the penetration depth d =1/μeff is 7.1 mm for red light at 675 nm. Knowing the diffuse reflectance and the effective attenuation coefficient, the absorption and reduced scattering coefficients can be deduced according to [15].
Figure 5.6.3. Endoscopic view of the reference close to the main carina. The cylinder’s cross section surface is facing the observer. The two red specular reflections observed on the right side of the reference are due to the reflection of the red light delivered by the DAFE light source through the two illumination fibre bundles of the bronchofiberscope.
For the reference material the absorption coefficient was computed to be μa = 0.001 mm-1 and the reduced scattering coefficient, μ's = 6 mm-1. A compilation of the principal optical properties of the PMMA material and healthy human bronchial tissue for light at 675 nm is presented in Table 5.6.1. The reference fluorescence emission spectrum measured with the optical fibre based spectrofluorometer is shown in Figure 5.6.5. For illustrative purposes, the same graphic shows a typical in vivo AF spectrum of healthy human mucosa, measured with the same set-up (adapted from [11]).
-2.5
-2
-1.5
-1
-0.5
0
0.5
0 5 10 15Depth [mm]
ln (
I)
Figure 5.6.4. The graphic shows the decrease of the space irradiance versus the depth of the isotropic probe within the sample for a broad (40 mm in diameter), collimated and perpendicular illumination at 675 nm. The effective attenuation coefficient μeff of the reference material is given by the slope of the straight line fitting the data.
R∞ [%]
μeff [mm-1]
μa [mm-1]
μ’s [mm-1]
d [mm]
PMMA material 73a
(human mucosa: 74) 0.14a 0.001 6 7.1
Table 5.6.1 Optical properties of the reference material for light at 675 nm. The table shows the diffuse reflectance R∞, the effective attenuation coefficient μeff, the absorption coefficient μa, the reduced scattering coefficient μ’s, and the penetration depth “d”. Values superscripted with (a) were measured in the study presented here. The diffuse reflectance value for the human mucosa was taken from [18]. All other values were deduced as shown in [15].

Chapter 5.6 – Design of an endoscopic optical Reference…
141
0
0.2
0.4
0.6
0.8
1
1.2
400 500 600 700Wavelength [nm]
No
rm. F
luo
r. In
ten
sity
[a.u
.]
B ronchial M ucosa
Reference
Figure 5.6.5. Fluorescence emission spectra of the reference material. Excitation was performed at 405 nm ± 15 nm (FWHM). A typical in vivo AF spectrum from healthy bronchial tissue measured with the same set-up, is shown for comparison. The spectrum was adapted from [11].
The long-term exposure to a white light dose of 630 J/cm2 did not affect the fluorescence and backscattering behaviour. Imaging of the exposed plate of the reference material with the DAFE system did not reveal any measurable difference of the fluorescence and backscattering signal between the exposed and the unexposed areas (data not shown). Imaging of the reference in the tracheo-bronchial tree showed no correlation between the AF intensity levels of the bronchial wall and that of the reference when it was not in direct contract with the wall. However, when the reference cylinder was put in direct contact with high fluorescing bronchial tissue areas, the red and green intensity levels computed from the reference increased by a factor of 2 (data not shown).
Discussion: The aim of this work was to design a stable fluorescence and reflectance standard for the quantification of inter-patient variations in the AF intensity during AFB imaging. The chosen PMMA material, Perspex Blanc Opal/White 1X20 is a commercially available white semi- opaque plexi glass. The material complies with the European regulations for food
contact and can easily be sterilised after use. The dimensions of the reference were limited by the inner diameter of the biopsy channel (2.2 mm) of the diagnostic bronchofiberscopes in use at the CHUV University Hospital in Lausanne. Image acquisition and analysis is most reliable and reproducible when performed on the even, homogenous surfaces of the reference perpendicular to the optical axis. The cylinder cross cut-section was localised perpendicularly to the optical axis of the bronchoscope and allowed unbiased read out of the intensity levels. Due to its size the reference is also compatible to with most other bronchofiberscopes and the more recent chip-on-tip videobronchoscopes equipped with a standard working channel. One drawback of the set-up was the slightly inhomogenous illumination of the reference due to the asymmetrically arranged illumination fibrebundles of the bronchofiberscopes. The resulting specular reflections are visible as bright red spots on the reference's cut section in some endoscopic images. Those spots might bias the reference measurement if they are not excluded in the retrospective image analysis. The shape of the Perspex's fluorescence spectrum is similar to the in vivo AF spectrum of human bronchial mucosa excited at 405 nm. However, it should be noted that the relative contribution of wavelength > 590 nm is slightly higher in the reference fluorescence spectrum than in the in vivo spectrum. However, this difference in the spectral shape of the reference material fluorescence and the tissue AF do not adversely affect the material’s functionality as an endoscopic reference since most (about 65 %) of the red light emitted by the reference during AFB originates from the red backscattered light. A comparison of the relative fluorescence intensities was not possible with our set-up. However, a preliminary clinical study
Chapter 5.6 – Design of an endoscopic optical Reference…
142
with the endoscopic reference showed that the green (490 nm – 580 nm) fluorescence intensity of the reference is about 55% of the typical green AF intensity of the bronchial wall [19]. The latter is in the order of 4.2 pW/(μW · nm) [11]. Since the DAFE camera uses automatic shutter and gain control functions based on central image measurements to optimise its image brightness during AFB, the lower fluorescence of the reference might be affected by a poor signal-to-noise ratio when used in a high fluorescing/backscattering environment. In addition, the low luminescence of the reference increases the distortion of the measurements by the space irradiance due to the AF of the bronchial wall. Indeed, as described above, the endoscopic measurements on the reference are modified in a high light irradiating surrounding. Using a material with a fluorescence intensity equal to or slightly higher than the tissue AF intensities will reduce the relative contribution of the space irradiance to the detected reference signal. However, this reference luminescence yield has to be kept at a value comparable to that of the bronchial wall due to the limited dynamic range of the camera. The reference material has a relatively high (73%) reflectance at 675 nm. The diffuse reflectance of normal bronchial mucosa was measured by Tecelj [18] using reflectance spectroscopy. This group reported a diffuse reflectance of about 75% at 675 nm wavelength. Thus the reflectance of the reference can be considered identical to that of the bronchial mucosa. The effective absorption coefficient of the reference material is in the order of 0.14 mm-1. Unfortunately there is a lack of knowledge on the values of μeff of human bronchial mucosa in vivo. However, Bays et al. [20] reported a value of 0.24 mm-1 for μeff for the human esophageal mucosa at 630 nm. Since the reflectance of the bronchial mucosa is higher than that of the
esophageal mucosa, the absorption and by this μeff is likely to smaller than the value given by Bays et al. Moreover, μeff decreases with increasing wavelengths. Thus the effective absorption coefficient of the reference can be considered identical to that of the human bronchial mucosa.
Conclusions: We have designed an endoscopic reference to characterise and quantify the AF intensity and spectral composition of bronchial tissue in vivo using imaging techniques. The reference has optical properties simulating that of the bronchial mucosa. It can easily be inserted into the biopsy channel of conventional bronchofiberscopes and can be used during routine AF bronchoscopy. The main interest of this reference is to enable a reliable assessment of the inter-patient fluctuations of bronchial tissue AF. This is of importance for the spectral and optical design of AFB systems. Optimisation of the spectral design of the endoscopic reference can be achieved by the use of a material having a slightly green shifted and stronger (by a factor 2) fluorescence emission relative to the Perspex 1X20 one.

Chapter 5.6 – Design of an endoscopic optical Reference…
143
References [1] D. Goujon, M. Zellweger, A. Radu, G. P., B.-C. Weber, H. van den Bergh, P. Monnier and G. Wagnières, "In vivo autofluorescence imaging of early cancers in the human tracheobronchial tree with a spectrally optimized system," J Biomed Optics 8(1), 17-25 (2003)
[2] K. Häußinger, F. Stanzel, M. Kohlhäufl, H. Becker, F. Herth, A. Kreuzer, B. Schmidt, J. Strausz, S. Cavaliere, K.-M. Müller, R.-M. Huber, U. Pichlmeier and C. T. Bolliger, "Autofluorescence bronchoscopy with white light bronchoscopy compared with white light bronchoscopy alone for the detection of precancerous lesions: A European randomised controlled multicentre trial," Thorax 60(6), 496-503 (2005)
[3] S. Lam, C. MacAulay, J. C. leRiche and B. Palcic, "Detection and localization of early lung cancer by fluorescence bronchoscopy," Cancer Suppl. 89(11), 2468-2473 (2000)
[4] G. Wagnières, A. McWilliams and S. Lam, "Lung cancer imaging with fluorescence endoscopy," in Handbook of Biomedical Fluorescence, M.-A. Myceck and B. W. Pogue, pp. 361-396, Marcel Dekker, Inc. (2003).
[5] M. Leonhard, "New incoherent autofluorescence/fluorescence system for early detection of lung cancer," Diagnostic and Therapeutic Endoscopy 5(2), 71-75 (1999)
[6] K. Häußinger, F. Stanzel, R. M. Huber, J. Pichler and S. H., "Autofluorescence detection of bronchial tumors with the D-Light/AF," Diagnostic and Therapeutic Endoscopy 5(2), 105-112 (1999)
[7] Pentax Europe GmbH, "PENTAX SAFE-3000– erstes Autofluoreszenz Video-Bronchoskopie System," http://www.pentax.nl/4medical/nieuws/productnieuws/pdfs/barcelona_fin2.pdf, accessed on 22.03.2006
[8] J. Qu, C. MacAulay, S. Lam and B. Palcic, "Laser-induced fluorescence spectroscopy at endoscopy: tissue optics, Monte Carlo modeling and in vivo measurements," Optical Engineering 34(11), 3334-3343 (1995)
[9] J. Hung, S. Lam, J. LeRiche and B. Palcic, "Autofluorescence of normal and malignant bronchial tissue," Lasers in Surgery and Medicine 11(2), 99-105 (1991)
[10] M. Zellweger, P. Grosjean, D. Goujon, P. Monnier, H. van den Bergh and G. Wagnières, "In vivo autofluorescence spectroscopy of human bronchial tissue to optimize the detection and imaging of early cancers," J Biomed Optics 6(1), 41-51 (2001)
[11] M. Zellweger, D. Goujon, R. Conde, M. Forrer, H. van den Bergh and G. Wagnières, "Absolute autofluorescence spectra of human healthy, metaplastic, and early cancerous bronchial tissue in vivo," Applied Optics 40(22), 3784-3791 (2001)
[12] Richard Wolf GmbH, "Diagnostic Auto Fluorescence Endoscopy," www.richard-wolf.com, accessed on 24.03.2006
[13] T. Gabrecht, T. Glanzmann, H. Van Den Bergh, G. Wagnieres, L. Freitag, P. Grosjean, P. Monnier and B. Weber, "Optimization of the spectral design used to detect early carcinoma in the human tracheo-bronchial tree by autofluorescence imaging," in Proceedings of SPIE - The International Society for Optical Engineering, pp. 1-7 (2003).
[14] T. Gabrecht, T. Glanzmann, L. Freitag, B.-C. Weber, H. van den Bergh and G. Wagnières, "Optimised autofluorescence bronchoscopy using additional backscattered red light," submitted
[15] G. Wagnières, S. Cheng, M. Zellweger, N. Utke, D. Braichotte, J.-P. Ballini and H. Van Den Bergh, "An optical phantom with tissue-like properties in the visible for use in PDT and fluorescence spectroscopy," Physics in Medicine and Biology 42(7), 1415-1426 (1997)
[16] M. Zellweger, P. Grosjean, P. Monnier, H. van den Bergh and G. Wagnieres, "Stability of the fluorescence measurement of Foscan in the normal human oral cavity as an indicator of its content in early cancers of the esophagus and the bronchi," Photochem Photobiol 69(5), 605-610 (1999)
[17] Lucite International, "Lucite - Knowledgebase," http://www.lucitesolutions.com/knowledgebase.cfm, accessed on 09.05.2006
[18] M. Tercelj, H. Zeng, M. Petek, T. Rott and B. Palcic, "Acquisition of fluorescence and reflectance spectra during routine bronchoscopy examinations using the ClearVu Elite(TM) device: Pilot study," Lung Cancer 50(1), 35-42 (2005)
[19] T. Gabrecht, B. Lovisa, H. van den Bergh and G. Wagnières, "Autofluorescence bronchoscopy:

Chapter 5.6 – Design of an endoscopic optical Reference…
144
Quantification of inter-patient tissue remitted light intensity variations," submitted
[20] R. Bays, G. Wagnières, D. Robert, D. Braichotte, H. Van Den Bergh, J. F. Savary and P. Monnier, "Clinical determination of tissue optical properties by endoscopic spatially resolved reflectometry," Applied Optics 35(10), 1756-1766 (1996)

145
5.7 Autofluorescence bronchoscopy: Quantification of inter-patient tissue remitted light intensity variations
T. Gabrecht1, B. Lovisa1, H. van den Bergh1, G. Wagnières1* Swiss Federal Institute of Technology (EPFL), Photomedicine Laboratory, 1015 Lausanne, Switzerland
Abstract Autofluorescence (AF) from bronchial tissue is widely used for the endoscopic detection of early bronchial neoplasia. Several imaging systems are commercially available, all detecting the absolute or relative AF intensity and/or spectral contrasts between normal tissue and early neoplastic lesions. These devices have a high sensitivity for flat neoplasia, but the specificity remains limited. Variations in the AF intensity between individuals (inter-patient variations), is considered one of the most limiting factors. In the clinical study presented here, we quantified those variations using a non-invasive optical reference positioned in situ during AF bronchoscopy. The inter-patient intensity variations were in the order of 25%- 30%. The results of this study are quite useful for improving and defining the design of the optical features (dynamic range, physical sensitivity) of AF detection systems.
Keywords: autofluorescence bronchoscopy; inter-patient variations; in vivo; clinical, imaging, DAFE, dynamic range Submitted to Journal of Biomedical Optics Letters
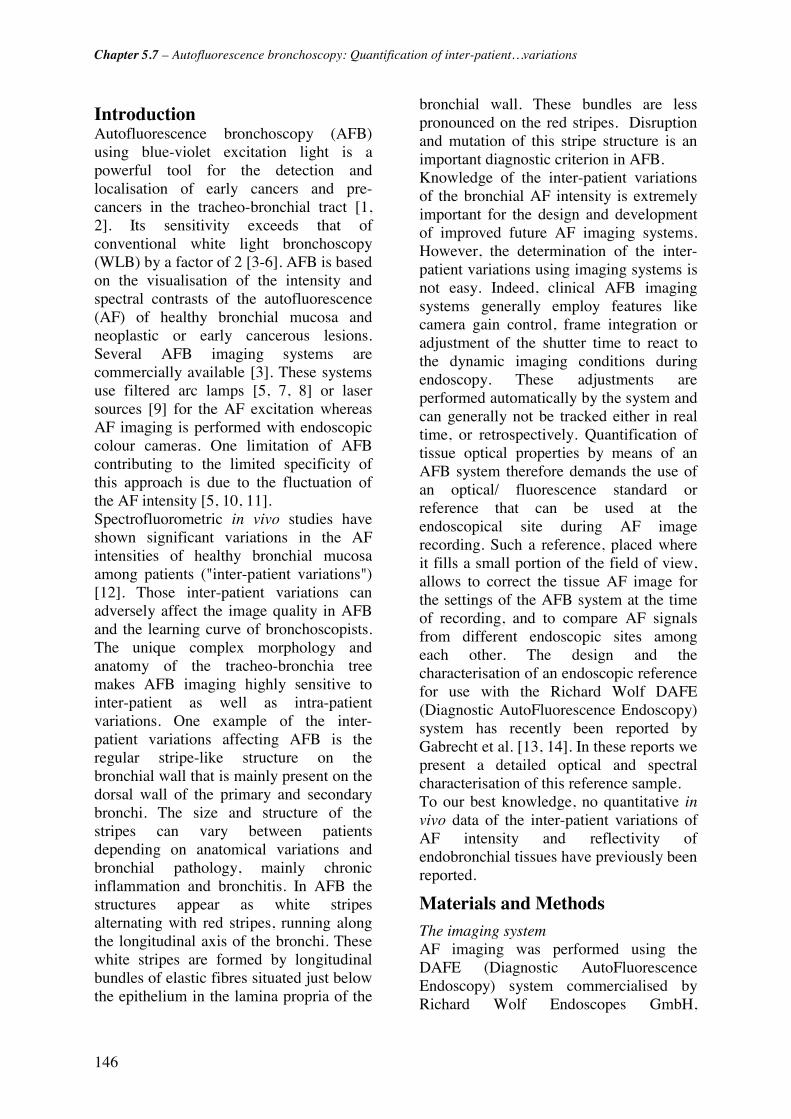
Chapter 5.7 – Autofluorescence bronchoscopy: Quantification of inter-patient…variations
146
Introduction Autofluorescence bronchoscopy (AFB) using blue-violet excitation light is a powerful tool for the detection and localisation of early cancers and pre-cancers in the tracheo-bronchial tract [1, 2]. Its sensitivity exceeds that of conventional white light bronchoscopy (WLB) by a factor of 2 [3-6]. AFB is based on the visualisation of the intensity and spectral contrasts of the autofluorescence (AF) of healthy bronchial mucosa and neoplastic or early cancerous lesions. Several AFB imaging systems are commercially available [3]. These systems use filtered arc lamps [5, 7, 8] or laser sources [9] for the AF excitation whereas AF imaging is performed with endoscopic colour cameras. One limitation of AFB contributing to the limited specificity of this approach is due to the fluctuation of the AF intensity [5, 10, 11]. Spectrofluorometric in vivo studies have shown significant variations in the AF intensities of healthy bronchial mucosa among patients ("inter-patient variations") [12]. Those inter-patient variations can adversely affect the image quality in AFB and the learning curve of bronchoscopists. The unique complex morphology and anatomy of the tracheo-bronchia tree makes AFB imaging highly sensitive to inter-patient as well as intra-patient variations. One example of the inter-patient variations affecting AFB is the regular stripe-like structure on the bronchial wall that is mainly present on the dorsal wall of the primary and secondary bronchi. The size and structure of the stripes can vary between patients depending on anatomical variations and bronchial pathology, mainly chronic inflammation and bronchitis. In AFB the structures appear as white stripes alternating with red stripes, running along the longitudinal axis of the bronchi. These white stripes are formed by longitudinal bundles of elastic fibres situated just below the epithelium in the lamina propria of the
bronchial wall. These bundles are less pronounced on the red stripes. Disruption and mutation of this stripe structure is an important diagnostic criterion in AFB. Knowledge of the inter-patient variations of the bronchial AF intensity is extremely important for the design and development of improved future AF imaging systems. However, the determination of the inter-patient variations using imaging systems is not easy. Indeed, clinical AFB imaging systems generally employ features like camera gain control, frame integration or adjustment of the shutter time to react to the dynamic imaging conditions during endoscopy. These adjustments are performed automatically by the system and can generally not be tracked either in real time, or retrospectively. Quantification of tissue optical properties by means of an AFB system therefore demands the use of an optical/ fluorescence standard or reference that can be used at the endoscopical site during AF image recording. Such a reference, placed where it fills a small portion of the field of view, allows to correct the tissue AF image for the settings of the AFB system at the time of recording, and to compare AF signals from different endoscopic sites among each other. The design and the characterisation of an endoscopic reference for use with the Richard Wolf DAFE (Diagnostic AutoFluorescence Endoscopy) system has recently been reported by Gabrecht et al. [13, 14]. In these reports we present a detailed optical and spectral characterisation of this reference sample. To our best knowledge, no quantitative in vivo data of the inter-patient variations of AF intensity and reflectivity of endobronchial tissues have previously been reported.
Materials and Methods The imaging system AF imaging was performed using the DAFE (Diagnostic AutoFluorescence Endoscopy) system commercialised by Richard Wolf Endoscopes GmbH,
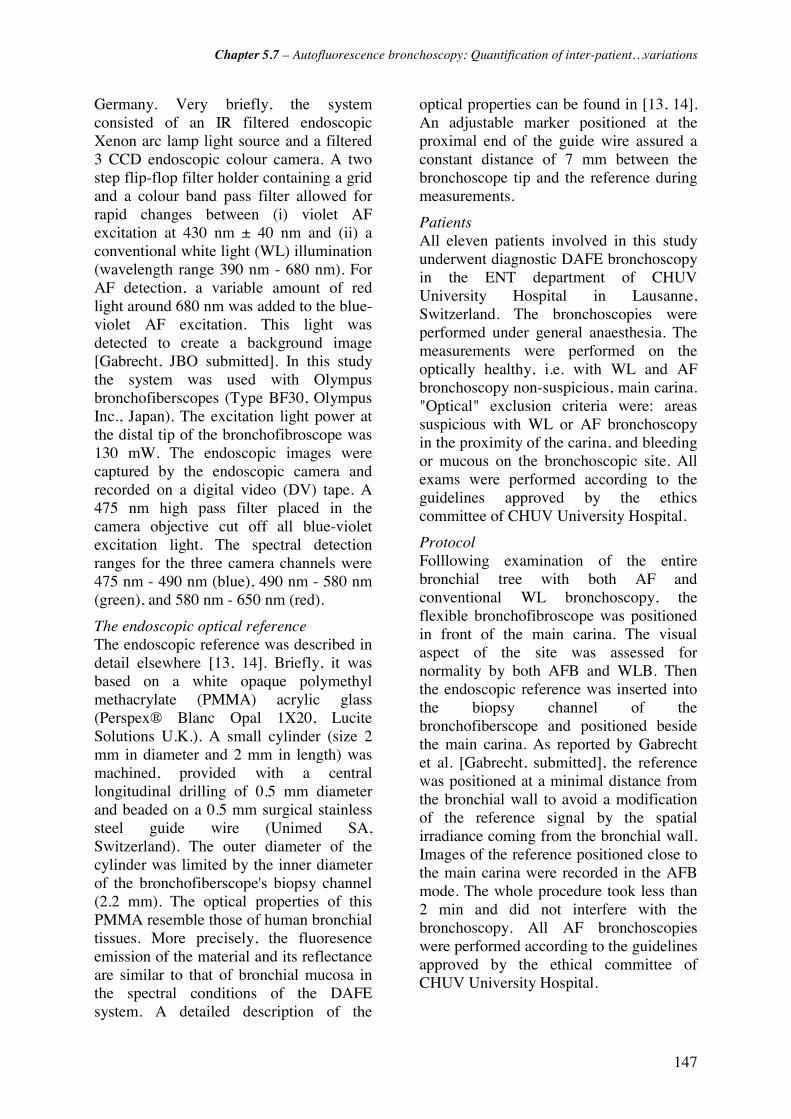
Chapter 5.7 – Autofluorescence bronchoscopy: Quantification of inter-patient…variations
147
Germany. Very briefly, the system consisted of an IR filtered endoscopic Xenon arc lamp light source and a filtered 3 CCD endoscopic colour camera. A two step flip-flop filter holder containing a grid and a colour band pass filter allowed for rapid changes between (i) violet AF excitation at 430 nm ± 40 nm and (ii) a conventional white light (WL) illumination (wavelength range 390 nm - 680 nm). For AF detection, a variable amount of red light around 680 nm was added to the blue-violet AF excitation. This light was detected to create a background image [Gabrecht, JBO submitted]. In this study the system was used with Olympus bronchofiberscopes (Type BF30, Olympus Inc., Japan). The excitation light power at the distal tip of the bronchofibroscope was 130 mW. The endoscopic images were captured by the endoscopic camera and recorded on a digital video (DV) tape. A 475 nm high pass filter placed in the camera objective cut off all blue-violet excitation light. The spectral detection ranges for the three camera channels were 475 nm - 490 nm (blue), 490 nm - 580 nm (green), and 580 nm - 650 nm (red).
The endoscopic optical reference The endoscopic reference was described in detail elsewhere [13, 14]. Briefly, it was based on a white opaque polymethyl methacrylate (PMMA) acrylic glass (Perspex® Blanc Opal 1X20, Lucite Solutions U.K.). A small cylinder (size 2 mm in diameter and 2 mm in length) was machined, provided with a central longitudinal drilling of 0.5 mm diameter and beaded on a 0.5 mm surgical stainless steel guide wire (Unimed SA, Switzerland). The outer diameter of the cylinder was limited by the inner diameter of the bronchofiberscope's biopsy channel (2.2 mm). The optical properties of this PMMA resemble those of human bronchial tissues. More precisely, the fluoresence emission of the material and its reflectance are similar to that of bronchial mucosa in the spectral conditions of the DAFE system. A detailed description of the
optical properties can be found in [13, 14]. An adjustable marker positioned at the proximal end of the guide wire assured a constant distance of 7 mm between the bronchoscope tip and the reference during measurements.
Patients All eleven patients involved in this study underwent diagnostic DAFE bronchoscopy in the ENT department of CHUV University Hospital in Lausanne, Switzerland. The bronchoscopies were performed under general anaesthesia. The measurements were performed on the optically healthy, i.e. with WL and AF bronchoscopy non-suspicious, main carina. "Optical" exclusion criteria were: areas suspicious with WL or AF bronchoscopy in the proximity of the carina, and bleeding or mucous on the bronchoscopic site. All exams were performed according to the guidelines approved by the ethics committee of CHUV University Hospital.
Protocol Folllowing examination of the entire bronchial tree with both AF and conventional WL bronchoscopy, the flexible bronchofibroscope was positioned in front of the main carina. The visual aspect of the site was assessed for normality by both AFB and WLB. Then the endoscopic reference was inserted into the biopsy channel of the bronchofiberscope and positioned beside the main carina. As reported by Gabrecht et al. [Gabrecht, submitted], the reference was positioned at a minimal distance from the bronchial wall to avoid a modification of the reference signal by the spatial irradiance coming from the bronchial wall. Images of the reference positioned close to the main carina were recorded in the AFB mode. The whole procedure took less than 2 min and did not interfere with the bronchoscopy. All AF bronchoscopies were performed according to the guidelines approved by the ethical committee of CHUV University Hospital.
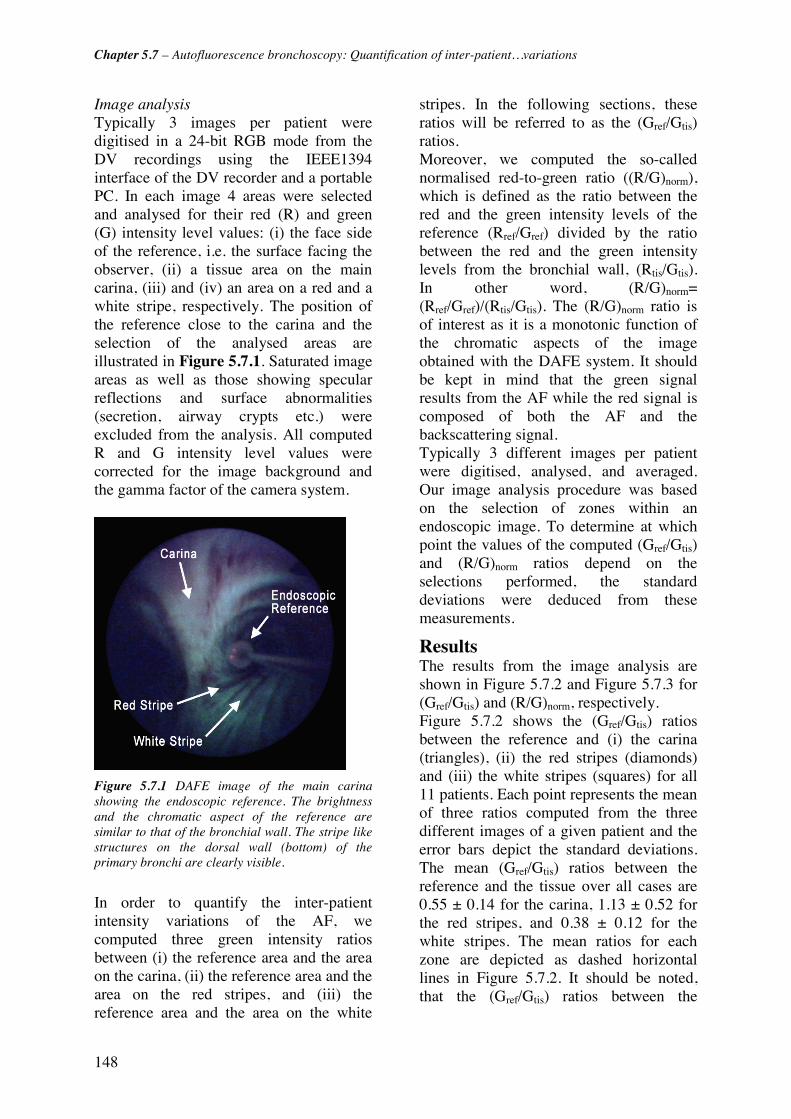
Chapter 5.7 – Autofluorescence bronchoscopy: Quantification of inter-patient…variations
148
Image analysis Typically 3 images per patient were digitised in a 24-bit RGB mode from the DV recordings using the IEEE1394 interface of the DV recorder and a portable PC. In each image 4 areas were selected and analysed for their red (R) and green (G) intensity level values: (i) the face side of the reference, i.e. the surface facing the observer, (ii) a tissue area on the main carina, (iii) and (iv) an area on a red and a white stripe, respectively. The position of the reference close to the carina and the selection of the analysed areas are illustrated in Figure 5.7.1. Saturated image areas as well as those showing specular reflections and surface abnormalities (secretion, airway crypts etc.) were excluded from the analysis. All computed R and G intensity level values were corrected for the image background and the gamma factor of the camera system.
Figure 5.7.1 DAFE image of the main carina showing the endoscopic reference. The brightness and the chromatic aspect of the reference are similar to that of the bronchial wall. The stripe like structures on the dorsal wall (bottom) of the primary bronchi are clearly visible.
In order to quantify the inter-patient intensity variations of the AF, we computed three green intensity ratios between (i) the reference area and the area on the carina, (ii) the reference area and the area on the red stripes, and (iii) the reference area and the area on the white
stripes. In the following sections, these ratios will be referred to as the (Gref/Gtis) ratios. Moreover, we computed the so-called normalised red-to-green ratio ((R/G)norm), which is defined as the ratio between the red and the green intensity levels of the reference (Rref/Gref) divided by the ratio between the red and the green intensity levels from the bronchial wall, (Rtis/Gtis). In other word, (R/G)norm= (Rref/Gref)/(Rtis/Gtis). The (R/G)norm ratio is of interest as it is a monotonic function of the chromatic aspects of the image obtained with the DAFE system. It should be kept in mind that the green signal results from the AF while the red signal is composed of both the AF and the backscattering signal. Typically 3 different images per patient were digitised, analysed, and averaged. Our image analysis procedure was based on the selection of zones within an endoscopic image. To determine at which point the values of the computed (Gref/Gtis) and (R/G)norm ratios depend on the selections performed, the standard deviations were deduced from these measurements.
Results The results from the image analysis are shown in Figure 5.7.2 and Figure 5.7.3 for (Gref/Gtis) and (R/G)norm, respectively. Figure 5.7.2 shows the (Gref/Gtis) ratios between the reference and (i) the carina (triangles), (ii) the red stripes (diamonds) and (iii) the white stripes (squares) for all 11 patients. Each point represents the mean of three ratios computed from the three different images of a given patient and the error bars depict the standard deviations. The mean (Gref/Gtis) ratios between the reference and the tissue over all cases are 0.55 ± 0.14 for the carina, 1.13 ± 0.52 for the red stripes, and 0.38 ± 0.12 for the white stripes. The mean ratios for each zone are depicted as dashed horizontal lines in Figure 5.7.2. It should be noted, that the (Gref/Gtis) ratios between the
Chapter 5.7 – Autofluorescence bronchoscopy: Quantification of inter-patient…variations
149
reference and the carina, as well as those between the reference and the white stripes are all smaller than 1, while most of the corresponding ratios for the red stripes exceed 1.
0.0
0.5
1.0
1.5
2.0
2.5
0 2 4 6 8 10 12Patient No.
(Gre
f/Gtis
) ra
tio
Reference/CarinaReference/Red Stripes
Reference/White Stripes
Figure 5.7.2 Green intensity ratios of the reference and the bronchial tissues measured in 11 patients. The ratios are presented for the carina, the red stripes and the white stripes. The horizontal lines depict the mean ratios for the carina (dashed line), the red stripes (continuous line) and the white stripes (large dashed line). The error bars depict the standard deviations.
0.0
0.5
1.0
1.5
2.0
2.5
3.0
3.5
4.0
0 2 4 6 8 10 12Patient No.
(R/G
)nor
m r
atio
Reference/CarinaReference/Red StripesReference/White Stripes
Figure 5.7.3 Normalised (R/G) intensity ratios between the reference and the bronchial carina, the red stripes, and the white stripes measured in 11 patients. The error bars depict the standard deviation.
The (R/G)norm ratios for the carina are shown in Figure 5.7.3 for all 11 cases. As in Figure 5.7.2 each data point represents the mean of typically 3 ratios and the error bars depict the standard deviations. The dotted horizontal line shows the mean (R/G)norm ratio. The mean (R/G)norm ratios were 1.46 +/- 0.38 (26%) for the carina,
1.19 +/- 0.45 (38%) for the red tracks and 1.76 +/- 0.65 (37%) for the white tracks. We deduced from multiple measurements performed on the same site that the errors resulting from our image analysis procedure were about 15% for the (Gref/Gtis) intensity level ratios and about 11% for the (R/G)norm ratios.
Discussion The autofluorescence spectra of human bronchial tissue have been studied by several groups [12, 15-17]. However, the inter-patient variations of the AF intensity and spectral composition have hardly been studied quantitatively in vivo. Zellweger and coworkers [12] reported significant inter-patient variations of about 50% within the 67% confidence interval using 405 nm as excitation wavelength. Compared to these values, the inter-patient variations found in the study presented here are surprisingly small. The inter-patient variations measured on the healthy carina were about 25% for the AF intensity in the green part of the spectrum (490 nm - 580 nm) and about 26% for the relative ratio between the green and the red spectral part of the AF. These values are nearly two times that of the error related to the image analysis method in this study. The differences between the inter-patient variations found by Zellweger et al. and those presented in this report most likely result from the measurement geometry used in the two studies. Zellweger et al. performed spectrofluorometric measurements using a fibre bundle and a spacer to keep a tissue-bundle distance of 3.5 mm [18]. This set-up offers a relatively small probing area for a given measurement. Consequently, local non homogeneities of the tissue AF in the millimeter range in all probability dramatically influenced the AF signals measured from different spots in a given patient or between patients. Moreover, the AF intensities measured with this set-up are highly sensitive to slight changes in the tissue-probe distance. The results presented

Chapter 5.7 – Autofluorescence bronchoscopy: Quantification of inter-patient…variations
150
in this work were obtained using a broad field imaging technique. This measurement geometry is much less sensitive to tissue AF non homogeneities in the millimetric range and to slight variations in the tissue-probe distance, since the tissue-endoscope distance is about 10 mm. In this context, it is worth noting that the inter-patient variations observed in this imaging study are significantly higher (31% to 46%) on the white and red stripes of the dorsal bronchial wall than on the carina (25%). As already pointed out in the introduction, the white stripes are formed by dense bundles of highly fluorescent elastic fibres that are closely juxtaposed to the epithelium. On the red stripes the fibre bundles are missing, resulting in a much lower AF intensity. Thus the signal from the red stripes is dominated by the red backscattered light. The higher variations observed on the stripes are most likely due to the small size of both types of stripes (and consequently the small size of the analysed areas) making image analysis more sensitive to heterogeneities in the tissue’s emission. Though the inter-patient variations in the bronchial tissue AF observed in the this study were small, it is known from clinical practise with AFB that autofluorescence images obtained from different patients can show clear differences in their chromatic composition and intensity [3]. This is likely to be partly due to variations in the system's performance from one bronchoscopy to another, including variations of the excitation light intensity at the tip of the bronchoscope optics, the transmission quality of the imaging optics, and colour settings of the camera-display unit, among others. Calibration charts or references used prior to the bronchoscopic exam can reduce these instrumental variations. Surprisingly, virtually no such test reference samples are provided by manufactures producing AFB systems. This pioneering clinical study conducted with the endoscopic reference shows that its optical and fluorescence properties
differ slightly from that of human bronchial tissue. As reported by Gabrecht et al. [13, 14] the diffuse reflectance of the endoscopic reference is slightly higher than that of human bronchial mucosa at 675 nm. However, the AF emission spectrum of the reference was found to be slightly blue shifted relative to the tissue AF, resulting in a higher R/G ratio for the reference. This is confirmed by the fact that all (R/G)norm ratios computed for the carina in the study presented here were larger than one. Moreover, the mean (Gref/Gtis) ratios computed for the main carina were 0.55. This indicates that the AF intensity emitted by the endoscopic reference in the green spectral part, i.e. between 490 nm and 580 nm, is about half the AF intensity typically emitted by healthy bronchial tissues. Although the tissue AF and that of the reference sample are about the same, this relative low AF of the Perspex material is indeed not ideal in the sense that the reference emission is more affected by the environmental space irradiance induced by the tissues. Most reliable results will therefore be obtained with a brighter reference. Thus for further clinical studies the choice of a higher fluorescing reference material than the current one should be considered. It should be kept in mind that the procurement of material presenting similar optical and spectral properties than the bronchial wall, while being suited fro this clinical use is very challenging. In addition it is crucial to prevent a saturation of the image which will occur if the reference is too bright. Apart from the inter-patient variations, the differences in the AF intensity and spectral composition within the bronchial tree of a given patient (the so called "intra-patient variations") are also very likely to influence the performance of AFB. Intra-patient variations result from morphologic changes of the bronchial wall observed between the lower and the higher level bronchi [3, 19]. These changes are at least in part due to variations in: the epithelium thickness and complexity, the number and
Chapter 5.7 – Autofluorescence bronchoscopy: Quantification of inter-patient…variations
151
distribution of specific cells and the spatial distribution of smooth muscle and cartilage in the bronchial wall. A clinical study by our group aiming to quantify these intra-patient variations using the endoscopic reference at different levels of the tracheo-bronchial tree is currently in progress.
Conclusions: In this study we present the use of an endoscopic reference for the determination and quantification of inter-patient variations in the AF and reflectance of human bronchial tissue using AFB imaging. The inter-patient variations in the bronchial AF intensity and spectral composition found on the carina with the AFB imaging system are small and therefore probably do not significantly affect the performance of AFB. The endoscopic reference described here presents a rapid and minimally invasive method to determine and quantify the intensity and spectral composition of the bronchial AF during AFB.
Chapter 5.7 – Autofluorescence bronchoscopy: Quantification of inter-patient…variations
152
References [1] K. Häußinger, F. Stanzel, M. Kohlhäufl, H. Becker, F. Herth, A. Kreuzer, B. Schmidt, J. Strausz, S. Cavaliere, K.-M. Müller, R.-M. Huber, U. Pichlmeier and C. T. Bolliger, "Autofluorescence bronchoscopy with white light bronchoscopy compared with white light bronchoscopy alone for the detection of precancerous lesions: A European randomised controlled multicentre trial," Thorax 60(6), 496-503 (2005)
[2] S. Lam, C. MacAulay, J. C. leRiche and B. Palcic, "Detection and localization of early lung cancer by fluorescence bronchoscopy," Cancer Suppl. 89(11), 2468-2473 (2000)
[3] G. Wagnières, A. McWilliams and S. Lam, "Lung cancer imaging with fluorescence endoscopy," in Handbook of Biomedical Fluorescence, M.-A. Myceck and B. W. Pogue, pp. 361-396, Marcel Dekker, Inc. (2003).
[4] S. Lam, T. Kennedy and M. Unger, "Localization of bronchial intraepitheloial neoplastic lesions by fluorescence bronchoscopy," Chest 113(3), 696-702 (1998)
[5] D. Goujon, M. Zellweger, A. Radu, G. P., B.-C. Weber, H. van den Bergh, P. Monnier and G. Wagnières, "In vivo autofluorescence imaging of early cancers in the human tracheobronchial tree with a spectrally optimized system," J Biomed Optics 8(1), 17-25 (2003)
[6] P. Pierard, B. Martin, J.-M. Verdebout, J. Faber, M. Richez, J.-P. Sculier and V. Ninane, "Fluorescence bronchoscopy in high-risk patients - A comparison of LIFE and Pentay systems," J Bronchology 8(4), 254-259 (2001)
[7] M. Leonhard, "New incoherent autofluorescence/fluorescence system for early detection of lung cancer," Diagnostic and Therapeutic Endoscopy 5(2), 71-75 (1999)
[8] K. Häußinger, F. Stanzel, R. M. Huber, J. Pichler and S. H., "Autofluorescence detection of bronchial tumors with the D-Light/AF," Diagnostic and Therapeutic Endoscopy 5(2), 105-112 (1999)
[9] Pentax Europe GmbH, "PENTAX SAFE-3000– erstes Autofluoreszenz Video-Bronchoskopie System," http://www.pentax.nl/4medical/nieuws/productnieuws/pdfs/barcelona_fin2.pdf, accessed on 22.03.2006
[10] F. R. Hirsch, S. A. Prindiville, Y. E. Miller, W. A. Franklin, E. C. Dempsey, J. R. Murphy, P. A. Bunn Jr and T. C. Kennedy, "Fluorescence versus white-light bronchoscopy for detection of preneoplasic lesions: a randomized study," J Natl Cancer Inst 93(18), 1385-1391 (2001)
[11] T. C. Kennedy, S. Lam and F. R. Hirsch, "Review of recent advances in fluorescence bronchoscopy in early localization of central airway lung cancer," Oncologist 6(3), 257-262 (2001)
[12] M. Zellweger, D. Goujon, R. Conde, M. Forrer, H. van den Bergh and G. Wagnières, "Absolute autofluorescence spectra of human healthy, metaplastic, and early cancerous bronchial tissue in vivo," Applied Optics 40(22), 3784-3791 (2001)
[13] T. Gabrecht, "Clinical fluorescence spectroscopy and imaging for the detection of early carcinoma by autofluorescence bronchoscopy and the study of protoporphyrin IX pharmacokinetics in the endometrium.," in Faculty of Architecture, Civil and Environmental Engineering, Swiss Federal Institute of Technolog (EPFL), Lausanne (2006).
[14] T. Gabrecht, B. Lovisa, F. Borle and G. Wagnières, "Design of an endoscopic optical reference to be used for autofluoresence bronchoscopy with the DAFE system," submitted
[15] R. Alfano, D. Tata, J. Cordero, P. Tomashefsky, F. Longo and M. Alfano, "Laser induced fluorescence spectroscopy from native cancerous and normal tissue," Quantum Electronics, IEEE Journal of 20(12), 1507-1511 (1984)
[16] R. Alfano, G. Tang, A. Pradhan, W. Lam, D. Choy and E. Opher, "Fluorescence spectra from cancerous and normal human breast and lung tissues," Quantum Electronics, IEEE Journal of 23(10), 1806-1811 (1987)
[17] J. Qu, C. MacAulay, S. Lam and B. Palcic, "Laser-induced fluorescence spectroscopy at endoscopy: tissue optics, Monte Carlo modeling and in vivo measurements," Optical Engineering 34(11), 3334-3343 (1995)
[18] M. Zellweger, P. Grosjean, D. Goujon, P. Monnier, H. van den Bergh and G. Wagnières, "In vivo autofluorescence spectroscopy of human bronchial tissue to optimize the detection and imaging of early cancers," J Biomed Optics 6(1), 41-51 (2001)
[19] T. Gabrecht, S. Andrejevic-Blant, H. Van Den Bergh and G. Wagnières, "Blue-violet excited

Chapter 5.7 – Autofluorescence bronchoscopy: Quantification of inter-patient…variations
153
autofluorescence spectroscopy and imaging of normal and cancerous human bronchial tissue after formalin fixation," submitted

154

155
Chapter 6 Conclusions and
Future Prospects
The main aims of the first part of this thesis were to improve our understanding of the mechanisms playing a role in AFB, and to optimize this approach for the detection of early endobronchial carcinoma. Several clinical and ex vivo imaging and spectrofluorometry studies were performed to gain insight on the origins of the lesion/healthy tissue AF contrast and, consequently, define further possibilities to increase the sensitivity and specificity of AFB. These studies led to the identification of two main factors that are likely to be at the origin of these contrast mechanisms: (1) A lesions-specific neovascularisation, located inside these dysplasia/CIS as well as in their underlying lamina propria and submucosa, plays a key role in the AF intensity and chromatic contrasts; (2) the epithelium thickening, at locations corresponding to these lesions, seems to be responsible for an intensity contrast only. The increase of haemoglobin concentration associated with the neovascularisation mentioned in "1" absorbs both the excitation light and the AF it induces, whereas the epithelium thickening (point "2") essentially prevents the excitation light to reach the lamina propria and the submucosa, the latter containing much more endogenous fluorochromes than the epithelium.
These statements already had, and will have, a high impact on the optical and spectral design of future AFB systems.
The first clinical imaging study reported in Chapter 5.1 demonstrated that the use of additional red backscattered light as a background reference, instead of the red AF image,
Chapter 6 – Conclusions and Future Prospects
156
increases the spectral contrast by a factor of about two. Thus, detection of the red background image increases the sensitivity of the system, even if this novel approach generates specular reflections that are not present in the red AF images. Although the quantification of this increase of sensitivity is very difficult to assess, the novel approach proposed here can be seen as a significant improvement. Indeed, according to [1, 2] an improvement of contrast by a factor two enables to detect twice-smaller lesions. It should be noted that this improvement is probably more important since the S/N ratio is much better for images generated with red backscattering light than with red AF. It is also not clear to determine if the use of infrared (IR) light, as suggested by the group of Vancouver [ref], gives better results than the use of ref light. However, since all medical light sources for endoscopy are equipped with IR cut-off filter, the instrumental implementation of the red light-based approach seems to be a sensible choice. This study eventually let to the development and commercialisation of the DAFE (Diagnostic AutoFluorescence Endoscopy) system by our industrial partner, as described in details in chapter 5.2.
Considering the role played by blood in the contrast mechanisms, the use of blue-violet light at wavelengths corresponding to the blood absorption is useful to enhance the lesion-healthy intensity and spectral contrast as described in chapter 5.3. Consequently, this approach is also likely to improve the sensitivity of AFB. One approach to exploit this concept can be based on the use of a narrowband blue-violet excitation instead of the current broad band one, as suggested in this Chapter. However, sufficiently powerful and cost effective light sources that are compatible with a clinical use are not available at the present time. Indeed, solid-state lasers and gas lasers provide high power, but they are generally cumbersome, costly and not well suited for routine clinical application. Blue diode lasers at 410 nm with output powers in the range of 100 mW have become available recently. Their small size allows an integration into standard endoscopic light source. It should be noted that the use of videobronchoscopes, which were recently implemented in AFB, will require less excitation light intensity for satisfactory image quality than the conventional fibre-based bronchofibroscopes. In addition, the move from bronchofiberscopes to videobronchoscope is fortunate since the later have higher resolution. It should be noted, that all suggestions resulting from the studies reported in this thesis manuscript to improve the performance of AFB can be implemented in videobronchoscopy systems.
Another approach to improve the performances of AFB is the combination of AFB and imaging reflectometry, as described in the chapter 5.5. This approach can improve the specificity of AFB since the detection of background images generated by blue-violet backscattered light presents a good approach to discriminate between true and false positives. Since the main source of false positives comes from inflammation, the idea behind this approach consists to exploit the differences of subepithelial vascularisation between inflamed tissues and dysplasia/CIS. The main limitation of this approach is probably due to the fact that dysplasia/CIS are frequently associated with the presence of inflammation. This problems seem to be one of the main ultimate challenges of AFB and it definitively needs further investigations. Nevertheless, blue-violet backscattered light detected around 430 nm showed the most promising results for this purpose. The implementation of this method in the Richard Wolf's DAFE system is based on the modification of the camera's detection filter. However, the optimal conditions still remain to be refined before this method can definitively be integrated in the DAFE system. It should be noted, that the close vicinity of the wavelengths used for the narrowband excitation and the blue backscattered light detection facilitates the integration of both approaches in the next generation of DAFE systems. Since the differences of spectral reflectance between dysplasia/CIS and inflammation are quite small, one approach could be to characterise AFB positives areas using a spectroscopic system. If this reflectance spectroscopy is performed after the use of the AFB system, it will enable to investigate the
Chapter 6 – Conclusions and Future Prospects
157
information located in the green part of the spectrum. Since light around 550 nm penetrates deeper in the respiratory mucosa than blue-violet light and since it corresponds to secondary absorption peak of haemoglobin, the use of green light will probe vascular structures deeper in the submucosa. However, the integration of these combined imaging and spectral approaches in one cost-effective commercial system seems to be very difficult. This approach was recently reported by Chiyo et al. [3]. This group found an increased specificity with this spectral set-up compared to "LIFE" AFB.
A very similar endoscopic approach based on a narrowband excitation and detection of both backscattered light and tissue AF is the so-called narrow band imaging (NBI). Sano and coworkers at the National Cancer Center Hospital East, Chiba, Japan, recently developed this technique in collaboration with Olympus Corporation. Current NBI systems illuminate the endocopic site with a narrow wavelength band (FWHM = 30) around 415 nm and detect the signal emitted by the tissue around 415 nm, 445 nm and 500 nm. Each corresponding image is assigned to a R, G, or B channel. The first wavelength band is comparable to the wavelength range of the blue backscattered light in AFB (first absorption maximum of haemoglobin). A very interesting aspect of NBI is its potential to emphasise the surface structure and vascular patterns in the GI tract [4, 5] and in the bronchi [6] when combined with high magnification endoscopy. However, the absence of a red backscattered image of this NBI system may negatively affect the orientation in the ramified tube-like structure of the bronchi. Unfortunatly, nothing has been reported up to now according to our knowledge on the performance of NBI for the detection of (pre-)neoplastic lesions in the tracheo-bronchial tree. High magnification bronchoscopy may reveal features of the vascular pattern, emphasised by blue backscattered light AFB, thus allowing discrimination between (pre-)neoplastic lesions and non-malignant changes. However, high magnification bronchoscopy is a recent tool that is still under development. Nevertheless, its combination with AFB in a single instrument should be considered for future developments.
The use of exogenous agents for the detection of early carcinoma in the tracheo-bronchial tree should be avoided due to the complexity of their use as well as for regulatory and cost effectiveness reasons. However, their use can be envisaged if they prove to provide a robust and specific contrast between the lesions and their surrounding tissues. A very promising way of detecting early neoplastic and pre-neoplastic epithelial lesions is to rely on the selective induction of PpIX by 5-ALA or its derivatives. First experimental uses of 5-ALA induced PpIX for the imaging fluorescence detection in the tracheo-bronchial tree have proven disappointing [7, 8]. However, ALA hexylester (h-ALA) demonstrated superior performances than 5-ALA for the fluorescence detection of neoplasia in the bladder [9-11]. Thus, comparable results may be expected in the bronchi. Testing this approach with the DAFE system is of particular interest since its spectral design is well adapted to that of PpIX. However, since one of the main limitation of this approach seems to be the homogenous application of the PpIX precursor in the tracheo-bronchial tree, attention should be paid to the optimisation of the administration procedure. Although an administration under the form of the inhalation of an aerosol seems to be the most appropriate application method for the tracheo-bronchial tree, significant efforts still need to be performed in this field.. This is why the exploration of PpIX based fluorescence bronchosocopy following inhalation of h-ALA is currently under investigation in the Lausanne's Photomedicine group.
Endobronchial ultrasonography (EBUS) like optical coherence tomography (OCT) can visualise some distinct layers of the bronchial wall. It is successfully used to define tumour invasion in the bronchial wall. The use of EBUS in combination with AFB has recently been reviewed [12]. Unfortunately, currently available EBUS systems have resolutions below the thickness of the bronchial epithelium. However, systems with resolutions higher than the
Chapter 6 – Conclusions and Future Prospects
158
epithelium thickness are undergoing clinical evaluation. It should also be kept in mind that the main limitation faced by EBUS is its difficulty to establish a contrast between early carcinoma and the non-neoplastic epithelium. Therefore, its main interest is related to the determination of the epithelium thickness. This may provide supplementary information on the staging of the lesions discovered by AFB. Since the EBUS probe is inserted through the working channel of the bronchoscope, it may easily be used with AFB (video-)bronchoscopes.
It should be noted, that the studies presented in this part of the thesis aimed to improve the lesion-to-healthy contrast in terms of spectroscopy. However, the way colours and contrasts between colours are perceived by the human eye are not addressed in this thesis. It appears clearly that an optimisation of the display of the AF contrast may significantly improve the sensitivity and specificity of AFB. This may be realised by modifying the standard assignment of the three primary RGB signals delivered by the camera, as reported by [13] and [3]. A thorough selection of the colour space and colour balance used for the camera signal conversion dramatically influences the perceived colour contrast. Human colour vision and its correlation to physics and spectroscopy is a highly complex subject. The optimisation of the AFB system in terms of colour contrast perception is beyond the scope of this work, but may be the subject of another PhD thesis.
Finally, it should be noted, that a new AFB system is currently under development at the Richard Wolf's R&D department in close collaboration with the Lausanne's Photomedicine group. This last generation system will be based on a videobronchoscope. Its first clinical evaluation will start within several months.

Chapter 6 – Conclusions and Future Prospects
159
6.1 References [1] G. Wagnières, "Photochimiotherapie et photodetection du cancer a l'aide de photosensibilateurs ou de colorants fluorescents " in Département de Physique, EPFL, Lausanne (1992).
[2] A. Rose and K. Weimer, "Physical limits to the performance of imaging systems," Physics Today 24-32 (1989)
[3] M. Chiyo, K. Shibuya, H. Hoshino, K. Yasufuku, Y. Sekine, T. Iizasa, T. Fujisawa and K. Hiroshima, "Effective detection of bronchial preinvasive lesions by a new autofluorescence imaging bronchovideoscope system," Lung Cancer 48(3), 307-313 (2005)
[4] H. Tajiri, K. Matsuda and J. Fujisaki, "What can we see with the endoscope? Present status and future perspectives," Digestive Endoscopy 14(4), 131-137 (2002)
[5] M. Aalders, H. Sterenborg, F. Stewart and N. van der Vange, "Photodetection with 5-aminolevulinic acid-induced protoporphyrin IX in the rat abdominal cavity: drug dose-dependent fluorescecs kinetics," Photochemistry and Photobiology 72(4), 521-525 (2000)
[6] K. Shibuya, H. Hoshino, M. Chiyo, A. Iyoda, S. Yoshida, Y. Sekine, T. Iizasa, Y. Saitoh, M. Baba, K. Hiroshima, H. Ohwada and T. Fujisawa, "High magnification bronchovideoscpy combined with narrow band imaging could detect capillary looops of angiogenic squamous dysplasia in heavy smokers at high risk for lung cancer," Thorax 58(11), 989-995 (2003)
[7] R. Baumgartner, R. M. Huber, H. Schulz, H. Stepp, K. Rick, F. Gamarra, A. Leberig and C. Roth, "Inhalation of 5-aminolevulinic acid: a new technique for fluorescence detection of early stage lung cancer," Journal of Photochemistry and Photobiology B: Biology 36(2), 169-174 (1996)
[8] N. Awadh, C. MacAulay and S. Lam, "Detection and treatment of superficial lung cancer by using 5-aminolevulinic acid: A preliminary report," Journal of Bronchology 4(1), 13-17 (1997)
[9] N. Lange, P. Jichlinski, M. Zellweger, M. Forrer, L. Guillou, P. Kucera, G. Wagnières and H. van den Bergh, "Photodetection of early human bladder cancer based on the fluorescence of 5-aminolaevulinic acid hexylester-induced protoporphyrin IX: a pilot study," British Journal of Cancer 80(1/2), 185-193 (1999)
[10] P. Jichlinski, L. Guillou, S. J. Karlsen, P. U. Malmstrom, D. Jocham, B. Brennhovd, E. Johansson, T. Gartner, N. Lange, H. van den Bergh and H. J. Leisinger, "Hexyl aminolevulinate fluorescence cystoscopy: new diagnostic tool for photodiagnosis of superficial bladder cancer--a multicenter study," J Urol 170(1), 226-229 (2003)
[11] A. Marti, P. Jichlinski, N. Lange, J. P. Ballini, L. Guillou, H. J. Leisinger and P. Kucera, "Comparison of aminolevulinic acid and hexylester aminolevulinate induced protoporphyrin IX distribution in human bladder cancer," J Urol 170(2 Pt 1), 428-432 (2003)
[12] D. Feller-Kopman, W. Lunn and A. Ernst, "Autofluorescence bronchoscopy and endobronchial ultrasound: a practical review," Ann Thorac Surg 80(6), 2395-2401 (2005)
[13] K. Gono, T. Obi, M. Yamaguchi, N. Ohyama, H. Machida, Y. Sano, S. Yoshida, Y. Hamamoto and T. Endo, "Appearance of enhanced tissue features in narrow-band endoscopic imaging," J Biomed Optics 9(3), 568-577 (2004)

160
PART II CLINICAL PHARMACOKINETICS OF 5-ALA INDUCED PPIX TO OPTIMISE THE TREATMENT OF UTERINE BLEEDING DISORDERS BY PHOTODYNAMIC THERAPY The second part of this thesis presents a clinical pharmacokinetics study of topically 5-ALA induced PpIX in the endometrium for the optimisation of photodynamic endometrial ablation to treat abnormal menstrual bleedings. Light induced fluorescence spectroscopy (LIFS) was performed in the human uterus with a specially designed intrauterine optical probe between 20 min and 345 min after topical application of 5-ALA. This work was performed in collaboration with the Obstetrics and Gynaecology department of the University Hospital in Zurich (Switzerland). Parts of this study have been published in Lasers in Surgery and Medicine [1, 2].
[1] A. F. Degen, T. Gabrecht, L. Mosimann, M. K. Fehr, R. Hornung, V. A. Schwarz, Y. Tadir, R. A. Steiner, G. Wagnieres and P. Wyss, "Photodynamic endometrial ablation for the treatment of dysfunctional uterine bleeding: a preliminary report," Lasers Surg Med 34(1), 1-4 (2004)
[2] A. Degen, T. Gabrecht, G. Wagnieres, R. Caduff, B. Imthurn and P. Wyss, "Influence of the menstrual cycle on aminolevulinic acid induced protoporphyrin IX fluorescence in the endometrium: in vivo study," Lasers Surg Med 36(3), 234-237 (2005)

162
163
Chapter 7 Uterine bleeding
disorders
7.1 Anatomy and Histology of the Uterus The human uterus is a pear-shaped hollow organ located between the urinary bladder and the rectum. A ventral view of the uterus anatomy is depicted in Figure 7.1. The dome shaped sector at the “end” of the organ is called fundus uteri. The corpus uteri is located between the fundus uteri and the cervix, which connects the uterine cavity with the vagina. The wall of the uterus is built up by a serous membrane called perimetrium, a thick muscle layer called myometrium, and a mucous membrane lining the uterus called the endometrium. The thick myometrium essentially consists of smooth muscle fibres and plays an important role during pregnancy and delivery. The average length of the uterus in a mature woman is 7-9 cm. It should be noted that the uterine cavity does not form a hollow as might be wrongly derived from FF. The lateral view of the female pelvis (Figure 7.2) reveals that the cavity almost collapses due to the ventral inclination of the corpus uteri. The ventral and dorsal walls of the uterus almost lay on each other.

Chapter 7 – Uterine bleeding disorders
164
Figure 7.1 Anatomy of the human uterus. (adapted from [1])
Figure 7.2 Transvaginal ultrasound image of the uterus. The anatomical structures were traced for clearity. The opposite endometrial surfaces lay on each other. The white line in the centre delineates their contact surface. (adapted from [3])
The endometrium can be subdivided in the permanent basalis and the non-permanent functionalis (Figure 7.3). The latter undergoes permanent cyclic changes and is entirely renewed during the menstrual cycle of a woman. Within a cycle period, its thickness varies from 1- 7 mm. The endometrium is the only human tissue, which bleeds periodically while undergoing a regular cycle of proliferation, necrosis and desquamation.
Figure 7.3 Histology of the uterus. The slide shows a transversal cut through the uterus. The thick smooth muscle layer of the myometrium is well visible. The endometrium is in the proliferative state. The interfaces between the myometrium, the basalis and the functionalis are illustrated by dashed lines. (adapted from [4])
As shown schematically in Figure 7.4, this cycle is controlled by a complex system of varying hormonal concentrations. Oestrogen and progesterone are the main hormones regulating the thickness and pathological state of the uterine tissue. In a woman of fertile age, a complete cycle, during which endometrium undergoes rejection and renewal, lasts about 25 - 31 days. The uterine endometrial cycle can be divided into three phases: the follicular or proliferative phase (typically day 4-14), the luteal or secretory phase (typically 14-28), and the menstrual phase (typically day 1-4).
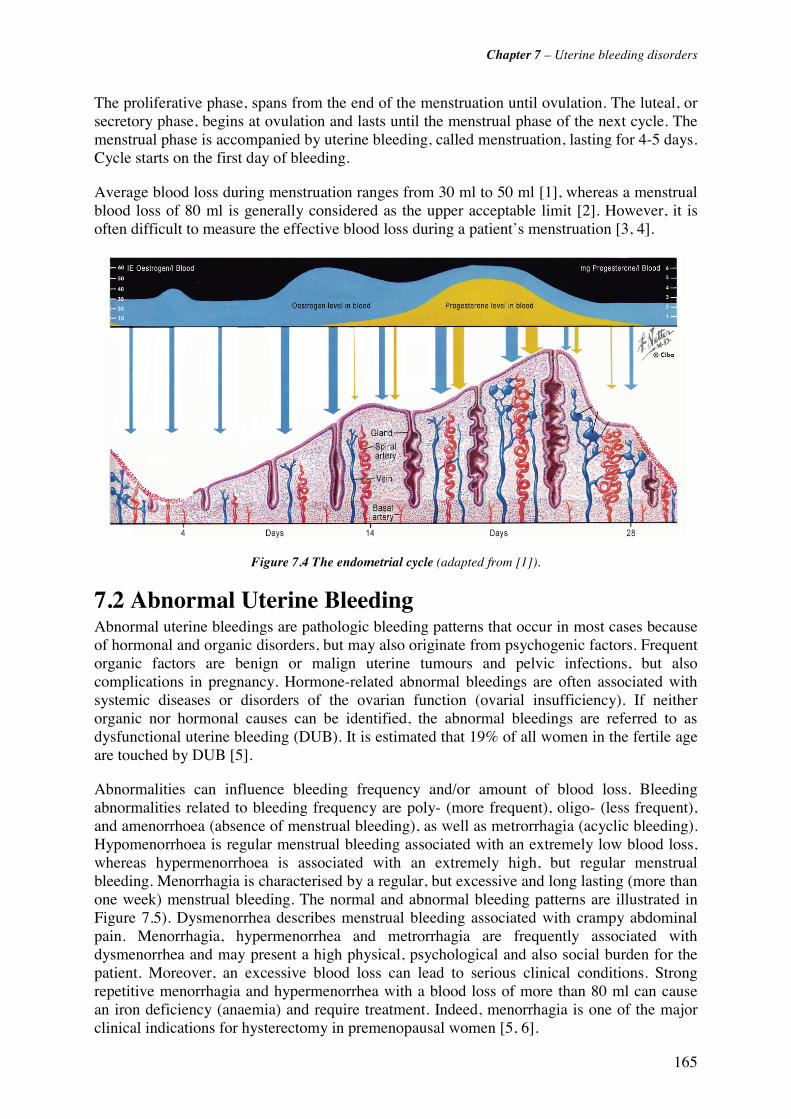
Chapter 7 – Uterine bleeding disorders
165
The proliferative phase, spans from the end of the menstruation until ovulation. The luteal, or secretory phase, begins at ovulation and lasts until the menstrual phase of the next cycle. The menstrual phase is accompanied by uterine bleeding, called menstruation, lasting for 4-5 days. Cycle starts on the first day of bleeding.
Average blood loss during menstruation ranges from 30 ml to 50 ml [1], whereas a menstrual blood loss of 80 ml is generally considered as the upper acceptable limit [2]. However, it is often difficult to measure the effective blood loss during a patient’s menstruation [3, 4].
Figure 7.4 The endometrial cycle (adapted from [1]).
7.2 Abnormal Uterine Bleeding Abnormal uterine bleedings are pathologic bleeding patterns that occur in most cases because of hormonal and organic disorders, but may also originate from psychogenic factors. Frequent organic factors are benign or malign uterine tumours and pelvic infections, but also complications in pregnancy. Hormone-related abnormal bleedings are often associated with systemic diseases or disorders of the ovarian function (ovarial insufficiency). If neither organic nor hormonal causes can be identified, the abnormal bleedings are referred to as dysfunctional uterine bleeding (DUB). It is estimated that 19% of all women in the fertile age are touched by DUB [5].
Abnormalities can influence bleeding frequency and/or amount of blood loss. Bleeding abnormalities related to bleeding frequency are poly- (more frequent), oligo- (less frequent), and amenorrhoea (absence of menstrual bleeding), as well as metrorrhagia (acyclic bleeding). Hypomenorrhoea is regular menstrual bleeding associated with an extremely low blood loss, whereas hypermenorrhoea is associated with an extremely high, but regular menstrual bleeding. Menorrhagia is characterised by a regular, but excessive and long lasting (more than one week) menstrual bleeding. The normal and abnormal bleeding patterns are illustrated in Figure 7.5). Dysmenorrhea describes menstrual bleeding associated with crampy abdominal pain. Menorrhagia, hypermenorrhea and metrorrhagia are frequently associated with dysmenorrhea and may present a high physical, psychological and also social burden for the patient. Moreover, an excessive blood loss can lead to serious clinical conditions. Strong repetitive menorrhagia and hypermenorrhea with a blood loss of more than 80 ml can cause an iron deficiency (anaemia) and require treatment. Indeed, menorrhagia is one of the major clinical indications for hysterectomy in premenopausal women [5, 6].
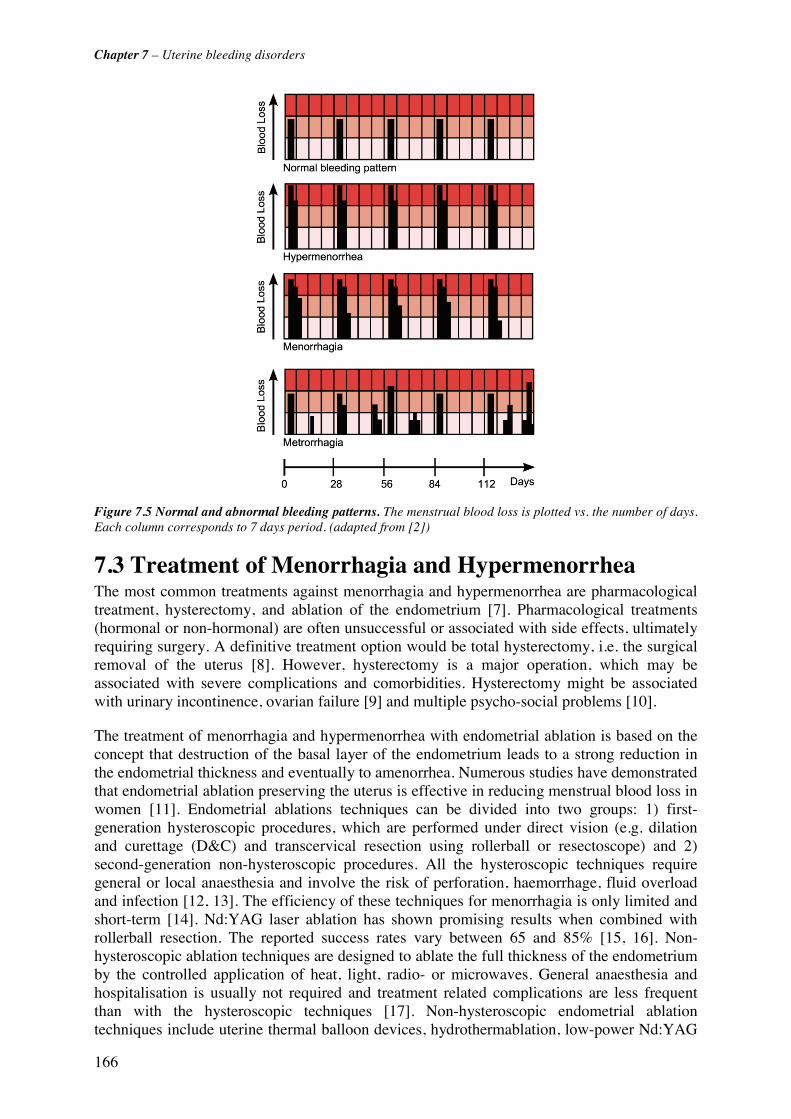
Chapter 7 – Uterine bleeding disorders
166
Figure 7.5 Normal and abnormal bleeding patterns. The menstrual blood loss is plotted vs. the number of days. Each column corresponds to 7 days period. (adapted from [2])
7.3 Treatment of Menorrhagia and Hypermenorrhea The most common treatments against menorrhagia and hypermenorrhea are pharmacological treatment, hysterectomy, and ablation of the endometrium [7]. Pharmacological treatments (hormonal or non-hormonal) are often unsuccessful or associated with side effects, ultimately requiring surgery. A definitive treatment option would be total hysterectomy, i.e. the surgical removal of the uterus [8]. However, hysterectomy is a major operation, which may be associated with severe complications and comorbidities. Hysterectomy might be associated with urinary incontinence, ovarian failure [9] and multiple psycho-social problems [10].
The treatment of menorrhagia and hypermenorrhea with endometrial ablation is based on the concept that destruction of the basal layer of the endometrium leads to a strong reduction in the endometrial thickness and eventually to amenorrhea. Numerous studies have demonstrated that endometrial ablation preserving the uterus is effective in reducing menstrual blood loss in women [11]. Endometrial ablations techniques can be divided into two groups: 1) first-generation hysteroscopic procedures, which are performed under direct vision (e.g. dilation and curettage (D&C) and transcervical resection using rollerball or resectoscope) and 2) second-generation non-hysteroscopic procedures. All the hysteroscopic techniques require general or local anaesthesia and involve the risk of perforation, haemorrhage, fluid overload and infection [12, 13]. The efficiency of these techniques for menorrhagia is only limited and short-term [14]. Nd:YAG laser ablation has shown promising results when combined with rollerball resection. The reported success rates vary between 65 and 85% [15, 16]. Non-hysteroscopic ablation techniques are designed to ablate the full thickness of the endometrium by the controlled application of heat, light, radio- or microwaves. General anaesthesia and hospitalisation is usually not required and treatment related complications are less frequent than with the hysteroscopic techniques [17]. Non-hysteroscopic endometrial ablation techniques include uterine thermal balloon devices, hydrothermablation, low-power Nd:YAG

Chapter 7 – Uterine bleeding disorders
167
laser, microwave ablation, and radio-frequency induced hyperthermia [7]. These methods are based on a non-selective thermal destruction of the inner uterine tissue layers. Reported amenorrhea rates after treatment vary from 35% for hydrothermablation to 68% for the thermal balloon devices and 90% for low power Nd:YAG laser ablation [18]
7.4 Photodynamic Endometrial Ablation In contrast to endometrial damaging by hyperthermia, photodynamic endometrial ablation (PEA) provides a selective endometrial destruction based on phototoxic reactions. The photosensitiser or its precursor is applied either systemically or topically to the uterus. After a time delay, the uterine cavity is irradiated with light of appropriate wavelength using a dedicated light applicator. One form of light applicator was designed as a diffusing elastic balloon with a shape and a size similar to the uterine cavity [19]. The deflated balloon diameter is smaller than 6 mm to pass the cervix with minimal dilation. First clinical studies have shown that PEA can be performed without extensive anaesthesia [20]. The success of PEA critically depends on the complete destruction of the endometrium, as well as the proliferating stem cells at the endo-myometrial junction [21-24]. A photosensitiser for PEA should therefore be highly selective for the endometrium. Topically applied 5-ALA induced PpIX has shown promising results for PEA in several preclinical and clinical studies. The basics of 5-ALA induced PpIX based PDT have already been discussed in the first chapter of this thesis. The fluorescence emission spectra of PpIX are shown in Figure 7.6. The fluorescence intensity emitted by PpIX with blue (410 nm) or green (504 nm) excitation light is dependent on the photosensitiser's concentration in biological cells or tissues [25]. Spectrofluorometric measurements of the PpIX fluorescence intensity can therefore be used to monitor the pharmacokinetics of PpIX in biological tissues.
0
200
400
600
800
1000
400 500 600 700 800
Wavelength [nm]
Exc
itatio
n [a
.u.]
0
500
1000
1500
2000
2500E
mis
sion
[a.u
.]Excitation
Emission
Figure 7.6 Fluorescence excitation and emission spectra of PpIX in ethanol.
5-ALA-related photodynamic therapy (PDT) and fluorescence detection (FD) of neoplastic lesions have been widely developed within the past years [26, 27]. Its major application fields and have been reviewed in Chapter 1.3.3 of this thesis.are dermatology and urology. The high vascularisation and oxygenation of the endometrium compared with the surrounding myometrium makes it a potential good target for photodynamic ablation. Photodynamic endometrial ablation using topically applied 5-ALA induced PpIX as a photosensitiser has been investigated since the 1990’s. Several preclinical studies in rats, rabbits and non-human primates showed that PpIX localises selectively in the endometrium after systemic or topical
Chapter 7 – Uterine bleeding disorders
168
application of 5-ALA [21-24, 28]. One major advantage of the intrauterine application of 5-ALA compared to a systemic application is the absence of skin photosensitisation [29]. Generation of PpIX after intrauterine application of 5-ALA in humans was investigated by Gannon et al. [30] and Fehr et al.[28]. Gannon et al. quantified the concentration of PpIX after intrauterine administration of 5-ALA using fluorescence microscopy. They analysed human endometrium and myometrium samples after hysterectomy. They found a 9 to 10 times higher concentration of PpIX in the functional and basal layers of the endometrium than in the adjacent myometrium. Similar results were reported by Fehr et al.. who demonstrated that 5-ALA induced PpIX accumulates selectively in endometrial glands compared to the adjacent myometrium in human hysterectomy samples.
The outcome of PDT strongly depends on the concentration of the photosensitiser in the tissue at the time of irradiation. Thus, the determination of the pharmacokinetics of PpIX concentration in the endometrium is the basis for effective PEA. However, no in vivo pharmacokinetic measurements in the human uterus were reported until now to our best knowledge. Wyss et al. [22] reported a fluorescence peak 3 hours after intrauterine instillation of 5-ALA in the endometrium of rats and rabbits. In a clinical hysterectomy study including 26 patients, Fehr et al. [28] showed that a maximal PpIX fluorescence in the human endometrium can be observed 4-8 hours after intrauterine application of 5-ALA. In both studies, the fluorescence was measured by fluorescence microscopy of frozen sections from hysterectomy preparations. The measurements obtained by ex vivo fluorescence microscopy may be subject to errors, related to environmental factors (changes in pH, bleaching) that may affect the photosensitiser's fluorescence yield. Moreover, theses studies did not take into account the inter-individual fluctuations in the pharmacokinetics of 5-ALA induced PpIX. The inter-patient variation may result, among others, from the patient's menopausal status and/or the phase of the menstrual cycle at the time of drug instillation [28, 31].
The clinical study presented in this thesis aimed to (1) determine the optimal time interval between application of the precursor and treatment, (2) assess the inter-patient variations in terms of pharmacokinetics and maximal PpIX concentration, and (3) investigate the correlation between the PpIX pharmacokinetics and the patient's menopausal status and/or phase of menstrual cycle at the time of 5-ALA instillation. Considering a linear relation between the fluorescence intensity and the PpIX concentration in the endometrium [32, 33], the results from the LIFS measurements allow prediction of the tissue damage induced by PEA [25]. PpIX fluorescence intensity in the endometrium was measured with a specially designed optical probe attached to a fibre-based spectrofluorometer.

Chapter 7 – Uterine bleeding disorders
169
7.5 References [1] J. B. Wright, M. J. Gannon and M. Greenberg, "Psychological aspects of heavy periods: does endometrial ablation provide the answer?," British journal of hospital medicine 55(5), 289-294 (1996)
[2] M. Lumsden and J. Norman, "Menstruation and menstrual abnormality," in Gynaecology (2nd Edn.), S. W. P. Shaw R.W., Stanton S.L., pp. 421-440, Churchill Livingstone, Edingburgh (1997).
[3] L. Hallberg and L. Nilsson, "Determination of Menstrual Blood Loss," Scand J Clin Lab Invest 16(244-248 (1964)
[4] M. J. Gannon, P. Day, N. Hammadieh and N. Johnson, "A new method for measuring menstrual blood loss and its use in screening women before endometrial ablation," British Journal Of Obstetrics And Gynaecology 103(10), 1029-1033 (1996)
[5] M. P. Vessey, L. Villard-Mackintosh, K. McPherson, A. Coulter and D. Yeates, "The epidemiology of hysterectomy: findings in a large cohort study," British Journal Of Obstetrics And Gynaecology 99(5), 402-407 (1992)
[6] C. L. Easterday, D. A. Grimes and J. A. Riggs, "Hysterectomy in the United States," Obstetrics And Gynecology 62(2), 203-212 (1983)
[7] N. S. Banu and I. T. Manyonda, "Alternative medical and surgical options to hysterectomy," Best Practice and Research in Clinical Obstetrics and Gynaecology 19(3 SPEC. ISS.), 431-449 (2005)
[8] P. Dwyer, W. M. White, R. L. Fabian and R. R. Anderson, "Optical integrating balloon device for photodynamic therapy," Lasers in Surgery and Medicine 26(58-66 (2000)
[9] K. Walsh and A. R. Stone, "How is the lower urinary tract affected by gynaecological surgery?," BJU International 94(3), 272-275 (2004)
[10] A. Zintl-Wiegand, B. Krumm, F. Köhler and W. Wiest, "Long-term outcome after hysterectomy - An interdisciplinary study
[Langzeitergebnisse nach einer hysterektomie - Eine interdisziplinäre verlaufsstudie]," Geburtshilfe und Frauenheilkunde 61(2), 53-62 (2001)
[11] "A Scottish audit of hysteroscopic surgery for menorrhagia: complications and follow up. Scottish Hysteroscopy Audit Group," Br J Obstet Gynaecol 102(3), 249-254 (1995)
[12] M. J. Manyak, L. M. Nelson, D. Solomon, A. Russo, G. F. Thomas and R. J. Stillman, "Photodynamic therapy of rabbit endometrial transplants: a model for treatment of endometriosis," Fertil Steril 52(1), 140-145 (1989)
[13] A. M. Sambrook and D. E. Parkin, "Endometrial ablation - A review of second generation techniques," Reviews in Gynaecological Practice 5(3), 166-171 (2005)
[14] J. J. Smith and H. Schulman, "Current dilatation and curettage practice: a need for revision," Obstet Gynecol 65(4), 516-518 (1985)
[15] K. G. Cooper, C. Bain and D. E. Parkin, "Comparison of microwave endometrial ablation and transcervical resection of the endometrium for treatment of heavy menstrual loss: a randomised trial," The Lancet 354(9193), 1859-1863 (1999)
[16] H. O'Connor and A. Magos, "Endometrial resection for the treatment of menorrhagia," N Engl J Med 335(3), 151-156 (1996)
[17] I. A. A. Van Zon-Rabelink, M. P. H. Vleugels, H. M. W. M. Merkus and R. De Graaf, "Endometrial ablation by rollerball electrocoagulation compared to uterine balloon thermal ablation: Technical and safety aspects," European Journal of Obstetrics Gynecology and Reproductive Biology 110(2), 220-223 (2003)

Chapter 7 – Uterine bleeding disorders
170
[18] J. Donnez, R. Polet, R. Rabinovitz, M. Ak, J. Squifflet and M. Nisolle, "Endometrial laser intrauterine thermotherapy: the first series of 100 patients observed for 1 year," Fertil Steril 74(4), 791-796 (2000)
[19] H. van den Bergh, "On the evolution of some endoscopic light delivery systems for photodynamic therapy," Endoscopy 30(4), 392-407 (1998)
[20] P. Wyss, M. Fehr, H. Van den Bergh and U. Haller, "Feasibility of photodynamic endometrial ablation without anesthesia," International Journal of Gynecology & Obstetrics 60(3), 287-288 (1998)
[21] D. A. van Vugt, A. Krzemien, R. L. Reid, B. N. Roy, W. A. Fletcher, W. Foster, S. Lundahl and S. L. Marcus, "Photodynamic endometrial ablation in the nonhuman primate," Journal of the Society for Gynecologic Investigation 7(2), 125-130 (2000)
[22] P. Wyss, B. J. Tromberg, M. T. Wyss, T. Krasieva, M. Schell, M. W. Berns and Y. Tadir, "Photodynamic destruction of endometrial tissue with topical 5-aminolevulinic acid in rats and rabbits," American Journal of Obstetrics and Gynecology 171(5), 1176-1183 (1994)
[23] J. Z. Yang, D. A. Van Vugt, J. C. Kennedy and R. L. Reid, "Intrauterine 5-aminolevulinic acid induces selective fluorescence and photodynamic ablation of the rat endometrium," Photochem Photobiol 57(5), 803-807 (1993)
[24] R. A. Steiner, Y. Tadir, B. J. Tromberg, T. Krasieva, A. T. Ghazains, P. Wyss and M. W. Berns, "Photosensitization of the rat endometrium following 5-aminolevulinic acid induced photodynamic therapy," Lasers in Surgery and Medicine 18(3), 301-308 (1996)
[25] D. J. Robinson, M. R. Stringer, H. S. De Bruijn, N. Van Der Veen, W. M. Star and S. B. Brown, "Fluorescence Photobleaching of ALA-induced Protoporphyrin IX during Photodynamic Therapy of Normal Hairless Mouse Skin: The Effect of Light Dose and Irradiance and the Resulting Biological Effect," Photochemistry and Photobiology 67(1), 140-149 (1998)
[26] C. J. Kelty, N. J. Brown, M. W. R. Reed and R. Ackroyd, "The use of 5-aminolaevulinic acid as a photosensitiser in photodynamic therapy and photodiagnosis," Photochemical and Photobiological Sciences 1(3), 158-168 (2002)
[27] Q. Peng, K. Berg, J. Moan, M. Kongshaug and J. Nesland, "5-Aminolevulinic acid-based photodynamic therapy: principles and experimental research.," Photochem Photobiol 65(2), 235-251 (1997)
[28] M. K. Fehr, P. Wyss, B. J. Tromberg, T. Krasieva, P. J. DiSaia, F. Lin and Y. Tadir, "Selective photosensitizer localization in the human endometrium after intrauterine application of 5-aminolevulinic acid," American Journal of Obstetrics and Gynecology 175(5), 1253-1259 (1996)
[29] P. Wyss, L. O. Svaasand, Y. Tadir, U. Haller, M. W. Berns, M. T. Wyss and B. J. Tromberg, "Photomedicine of the endometrium: Experimental concepts," Human Reproduction 10(1), 221-226 (1995)
[30] M. J. Gannon, N. Johnson, D. J. H. Roberts, J. A. Holroyd, D. I. Vernon, S. B. Brown and R. J. Lilford, "Photosensitization of the endometrium with topical 5-aminolevulinic acid," American Journal of Obstetrics and Gynecology 173(6), 1826-1828 (1995)
[31] A. Degen, T. Gabrecht, G. Wagnieres, R. Caduff, B. Imthurn and P. Wyss, "Influence of the menstrual cycle on aminolevulinic acid induced protoporphyrin IX fluorescence in the endometrium: in vivo study," Lasers Surg Med 36(3), 234-237 (2005)
[32] P. M. Armenante, D. Kim and W. N. Duran, "Experimental determination of the linear correlation between in vivo TV fluorescence intensity and vascular and tissue FITC-DX concentrations," Microvascular Research 42(2), 198-208 (1991)
[33] T. Smits, C. A. Robles, P. E. van Erp, P. C. van de Kerkhof and M. J. Gerritsen, "Correlation between macroscopic fluorescence and protoporphyrin IX content in psoriasis and actinic keratosis following application of aminolevulinic acid.," The Journal of investigative dermatology 125(4), 833-839 (2005)
171
Chapter 8 The clinical
pharmacokinetics study
8.1 Materials and Methods 8.1.1 The spectrofluorometer The optical fibre-based spectrofluorometer is shown in Figure 8.1. Excitation light is provided by a filtered Xenon (Xe) arc lamp. A dicroic mirror focuses the light into a quartz optical fibre, which serves as both excitation and detection fibre. The fluorescence is collected by the fibre, then filtered by a longpass filter and analysed with the help of a CCD-based detection unit.
The light delivered by the 100 W Xe light source (Osram HBO 103 W/2, Osram) passes through an electro-mechanical shutter (Uniblitz VS25, Vincent Associates, USA) (S) and enters the filter unit of an EPI fluorescence microscope (Nikon Y-FL, Nikon Corp., Japan). The said unit contains a set of removable neutral density filters (ND) and a set of interchangeable filter cubes. Each filter cube consists of an excitation bandpass filter (BP), a dichroic filter (DC), and a longpass filter (LP). The white light from the light source is filtered
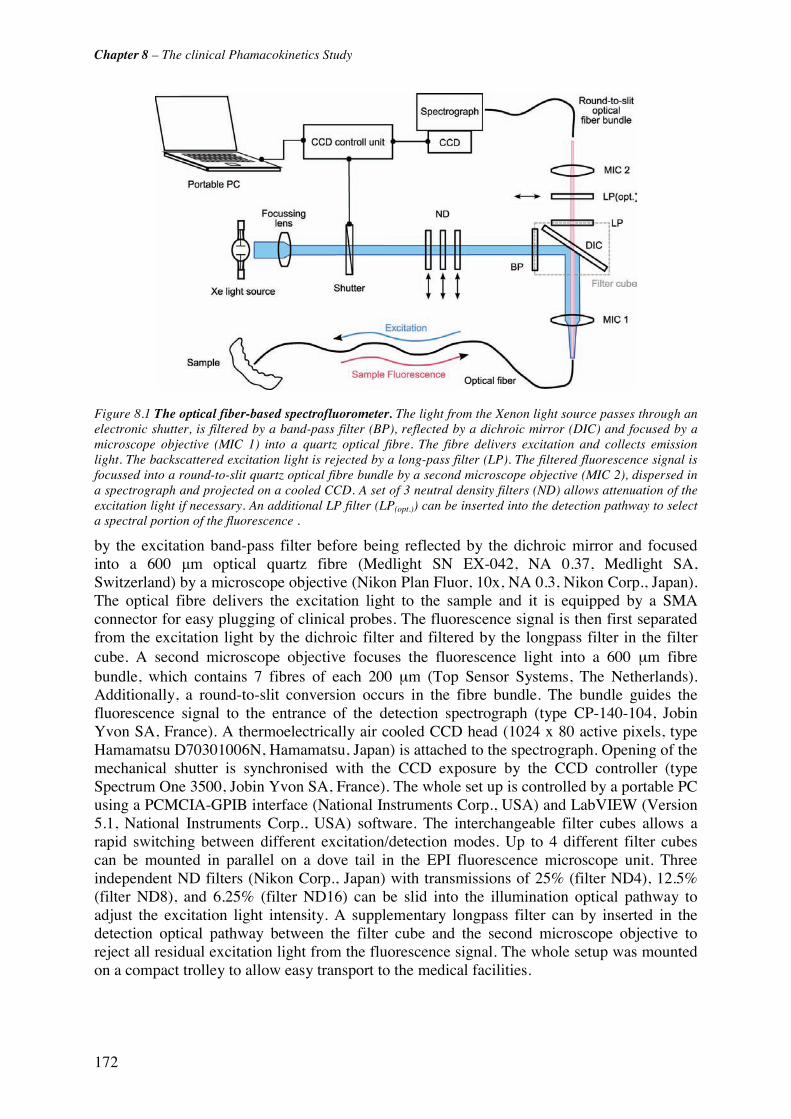
Chapter 8 – The clinical Phamacokinetics Study
172
Figure 8.1 The optical fiber-based spectrofluorometer. The light from the Xenon light source passes through an electronic shutter, is filtered by a band-pass filter (BP), reflected by a dichroic mirror (DIC) and focused by a microscope objective (MIC 1) into a quartz optical fibre. The fibre delivers excitation and collects emission light. The backscattered excitation light is rejected by a long-pass filter (LP). The filtered fluorescence signal is focussed into a round-to-slit quartz optical fibre bundle by a second microscope objective (MIC 2), dispersed in a spectrograph and projected on a cooled CCD. A set of 3 neutral density filters (ND) allows attenuation of the excitation light if necessary. An additional LP filter (LP(opt.)) can be inserted into the detection pathway to select a spectral portion of the fluorescence . by the excitation band-pass filter before being reflected by the dichroic mirror and focused into a 600 μm optical quartz fibre (Medlight SN EX-042, NA 0.37, Medlight SA, Switzerland) by a microscope objective (Nikon Plan Fluor, 10x, NA 0.3, Nikon Corp., Japan). The optical fibre delivers the excitation light to the sample and it is equipped by a SMA connector for easy plugging of clinical probes. The fluorescence signal is then first separated from the excitation light by the dichroic filter and filtered by the longpass filter in the filter cube. A second microscope objective focuses the fluorescence light into a 600 μm fibre bundle, which contains 7 fibres of each 200 μm (Top Sensor Systems, The Netherlands). Additionally, a round-to-slit conversion occurs in the fibre bundle. The bundle guides the fluorescence signal to the entrance of the detection spectrograph (type CP-140-104, Jobin Yvon SA, France). A thermoelectrically air cooled CCD head (1024 x 80 active pixels, type Hamamatsu D70301006N, Hamamatsu, Japan) is attached to the spectrograph. Opening of the mechanical shutter is synchronised with the CCD exposure by the CCD controller (type Spectrum One 3500, Jobin Yvon SA, France). The whole set up is controlled by a portable PC using a PCMCIA-GPIB interface (National Instruments Corp., USA) and LabVIEW (Version 5.1, National Instruments Corp., USA) software. The interchangeable filter cubes allows a rapid switching between different excitation/detection modes. Up to 4 different filter cubes can be mounted in parallel on a dove tail in the EPI fluorescence microscope unit. Three independent ND filters (Nikon Corp., Japan) with transmissions of 25% (filter ND4), 12.5% (filter ND8), and 6.25% (filter ND16) can be slid into the illumination optical pathway to adjust the excitation light intensity. A supplementary longpass filter can by inserted in the detection optical pathway between the filter cube and the second microscope objective to reject all residual excitation light from the fluorescence signal. The whole setup was mounted on a compact trolley to allow easy transport to the medical facilities.

Chapter 8 – The clinical Phamacokinetics Study
173
8.1.2 Characterisation of the spectrofluorometer The detection range of the spectrofluorometer is 250 nm to 850 nm, whereas its spectral resolution is 6 nm (FWHM). Wavelength calibration of the detection unit was performed with a calibrated mercury argon (Hg Ar) lamp (Type HG-1, Ocean Optics, The Netherlands) with well-defined spectral lines. The lamp spectrum was measured with the described spectrofluorometer setup. The pixel position of the detected emission peaks on the CCD was compared with their emission wavelengths given by the lamp's manufacturer. The pixel-to-wavelength transfer function was implemented into the LabView routine controlling the setup. This conversion allows data to be displayed vs. real wavelengths instead of pixel positions.
Spectral response of the spectrofluorometer was determined using a calibrated light source (Type EPLAP EH-117, The Eppley Laboratory Inc., USA). The lamp (operated at 6.5 mA) was positioned according to the manufacturer specifications at a 50 cm distance from the distal tip of the spectrometer's quartz optical fibre. The lamp spectrum was acquired with the spectrofluorometer without any filter cube. A correction factor was computed from the measured spectrum. Figure 8.2 shows the calibrated lamp emission spectrum supplied by the manufacturer, the spectrum acquired with the spectrofluorometer, and the correction function. For the PpIX pharmacokinetics study, the wavelength region of interest ranges from 500 to 650 nm (PpIX emission maxima at 635 nm). The mean correction factor within this wavelength region is 1.02 +/- 0.08. Thus the fluorescence data presented in this chapter did not require correction for the spectrometer's spectral response.
8.1.3 Configuration for the clinical measurements The pharmacokinetics measurements were performed with a filter cube optimised for the excitation and emission characteristics of PpIX (maximal excitation peak at 405 nm, maximal emission peak at 635 nm). It consisted of a 405 nm ± 10 nm band pass filter (type EX405/10), a 430 nm dichroic filter (type DM 430, peak reflection at 45° at 415 nm) and a 435 nm longpass filter (BA435). All three filters were purchased from Nikon Corp, Japan. A supplementary 455 nm longpass filter (Chroma Inc., USA) was inserted between the filter cube and the detection microscope to assure 100% rejection of the excitation light. The spectral resolution with this setup was 10 nm. Exposure time was typically 100 ms. This exposure time allowed us to detect low PpIX fluorescence signals, whereas the measurements are less sensitive to position variations of the probe during data acquisition.
0.0
0.2
0.4
0.6
0.8
1.0
1.2
400 500 600 700 800
Wavelength [nm]
Inte
nsity
[r.
u.]
0.0
0.51.0
1.5
2.02.5
3.0
3.5
4.04.5
5.0
Cor
rect
ion
Fac
tor
Calibrated LampSpectrometerCorrection Factor
Figure 8.2 Spectral response of the detection unit. The correction factor is about one (dashed line) within the PpIX fluorescence emission.

Chapter 8 – The clinical Phamacokinetics Study
174
Below this value, the shutter dwell time significantly differs from the value set by the control software and was not reliable. In the case of high intensity fluorescence signals, the excitation light intensity was reduced with the help of neutral density (ND) filters. Measurements were often performed with the excitation light attenuated by the ND 4 filter. Signal-to-noise ratio was better than 30:1 under these conditions.
8.1.4 The intrauterine optical probe A dedicated intrauterine optical probe was developed for the in vivo pharmacokinetics measurements. This probe had to fulfil the following requirements: (1) excitation and detection of the PpIX fluorescence, (2) stable position in the uterine cavity during several hours, (3) small size to be inserted into the uterine cavity through the cervix without sedation or anaesthesia, and (4) biocompatibility. The probe was based on a commercial silicone balloon catheter (Willy Ruesch GmbH, Germany) with an outer diameter of 1.67 mm (Figure 8.3). The spherical silicone balloon located at 10 mm from the catheter distal tip was about 13 mm in diameter when inflated with 1.5 ml of sterile saline. The catheter had a working channel and a balloon inflation channel. The distal tip of the catheter was drilled. A 600 μm quartz optical fibre with NA 0.4 was inserted through the working channel from the proximal end of the catheter. The polished fibre tip protruded 2 mm out of the distal tip. The fibre was glued and the probe distal tip was rounded up using non-fluorescing, biocompatible epoxy resin (type Epo-Tek 301, Epoxy Technology, USA). A SMA connector was mounted on the proximal end of the fibre to connect the probe to the spectrometer's optical fibre. The overall length of the intrauterine probe was 1.2 m. The entire probe could be sterilised by ethylene-oxide cold gas sterilisation.
Figure 8.3 The intrauterine optical probe.

Chapter 8 – The clinical Phamacokinetics Study
175
8.1.5 Patients Patients undergoing diagnostic or therapeutic hysteroscopy for dysfunctional bleeding (dys- or hypermenorrhoea, as well as postmenopausal bleeding) were asked to participate in the study. Exclusion criteria were pregnancy, vaginal bleeding, sterility examination, women younger than 30 years, and a history of porphyria. The study was approved by the local ethical committee of the Zurich University Hospital. Eleven patients gave written informed consent to the pharmacokinetics measurements in the uterine cavity.
Several problems occurred during the study. In one case, the measurement probe broke during the measurements. In another case, the instillation of the precursor solution failed due to a caesarean scar. Thus, only 9 patients were included in the data analysis. The average age of the patients was 52.1 years, ranging from 36 to 85 years. Five patients were premenopausal, 3 postmenopausal and 1 perimenopausal. Histopathologic analysis of the endometrial biopsies revealed the following states: 3 atrophy, 1 proliferation, 3 secretory phase and 2 hyperplasia (Table 8.1).
Pharmacokinetics Interval [min]
Patient Endomaterial
Histology Menopausal
status Patient's room
Operation Theatre
Time of Imax(PpIX) [min]
Fluorescence Hysteroscopy
P1 Atrophy premp 225 N.A. F- P2 Atrophy postmp 345 N.A. F- P3 Atrophy postmp 50 - 190 190a) N.A. P4 Proliferation premp 20 - 170 220 180 F- P5 Secretion premp 30 - 240 280 260 F+ P6 Secretion premp 40 - 180 310 310a) F- P7 Secretion premp 40 - 140 200 200a) F±c) P8 Hyperplasia perimp 20 - 140 270 80 F+ P9 Hyperplasia postmp 40 - 210 270 180b) F-
a) end of measurements b) constant fluorescence over long time period (80 - 270 min) c) highly inhomogeneous fluorescence
Table 8.1 Histology and pharmacokinetics conditions for all patients. The table shows the endometrial histology and menopausal status (premenopausal = premp, postmenopausal =postmp, perimenopausal= perimp), the time interval of the pharmacokinetics measurements in the patient’s room and in the operation theatre, and the time interval between the instillation and the maximal in PpIX fluorescence intensity. Moreover, the table shows the observations during fluorescence hysteroscopy (F+ = visible PpIX fluorescence, F- = no PpIX fluorescence visible, F± = inhomogenous PpIX fluorescence).
8.1.6 Protocol 100 mg diclofenac were given 30 min before ALA-instillation to prevent uterine cramps and pain during instillation. 2 ml of a 2% aqueous solution of 5-ALA (ASAT AG, Zug, Switzerland) was administered through a sterile 0.22 μm filter unit (Millex-GS, Milipore Products Division, Bedford, MA) into the uterine cavity using a hysterosalpingography catheter (Sholkoff Balloon Catheter, COOK, USA). The acidic ALA-solution was buffered to pH 4.0. After instillation of the precursor, the catheter was carefully removed. The sterile intrauterine optical probe was inserted into the uterine cavity. The balloon was inflated with 1.5 ml sterile saline and blocked in the cervix in order to prevent backflow of the 5-ALA solution out of the uterus and to keep the probe in place. The patient was sent back to her room and the probe remained in place until the surgical intervention. The procedure was generally well tolerated. Slight pain and discomfort related to the drug instillation were only reported in 2 cases.
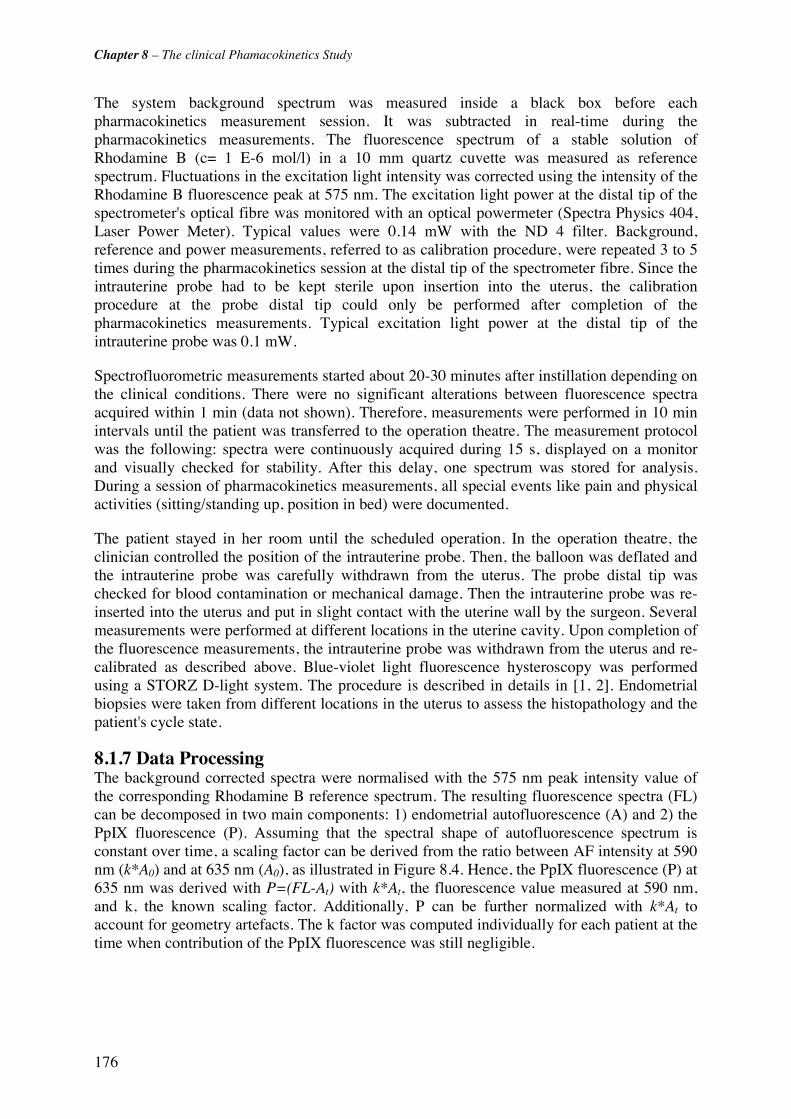
Chapter 8 – The clinical Phamacokinetics Study
176
The system background spectrum was measured inside a black box before each pharmacokinetics measurement session. It was subtracted in real-time during the pharmacokinetics measurements. The fluorescence spectrum of a stable solution of Rhodamine B (c= 1 E-6 mol/l) in a 10 mm quartz cuvette was measured as reference spectrum. Fluctuations in the excitation light intensity was corrected using the intensity of the Rhodamine B fluorescence peak at 575 nm. The excitation light power at the distal tip of the spectrometer's optical fibre was monitored with an optical powermeter (Spectra Physics 404, Laser Power Meter). Typical values were 0.14 mW with the ND 4 filter. Background, reference and power measurements, referred to as calibration procedure, were repeated 3 to 5 times during the pharmacokinetics session at the distal tip of the spectrometer fibre. Since the intrauterine probe had to be kept sterile upon insertion into the uterus, the calibration procedure at the probe distal tip could only be performed after completion of the pharmacokinetics measurements. Typical excitation light power at the distal tip of the intrauterine probe was 0.1 mW.
Spectrofluorometric measurements started about 20-30 minutes after instillation depending on the clinical conditions. There were no significant alterations between fluorescence spectra acquired within 1 min (data not shown). Therefore, measurements were performed in 10 min intervals until the patient was transferred to the operation theatre. The measurement protocol was the following: spectra were continuously acquired during 15 s, displayed on a monitor and visually checked for stability. After this delay, one spectrum was stored for analysis. During a session of pharmacokinetics measurements, all special events like pain and physical activities (sitting/standing up, position in bed) were documented.
The patient stayed in her room until the scheduled operation. In the operation theatre, the clinician controlled the position of the intrauterine probe. Then, the balloon was deflated and the intrauterine probe was carefully withdrawn from the uterus. The probe distal tip was checked for blood contamination or mechanical damage. Then the intrauterine probe was re-inserted into the uterus and put in slight contact with the uterine wall by the surgeon. Several measurements were performed at different locations in the uterine cavity. Upon completion of the fluorescence measurements, the intrauterine probe was withdrawn from the uterus and re-calibrated as described above. Blue-violet light fluorescence hysteroscopy was performed using a STORZ D-light system. The procedure is described in details in [1, 2]. Endometrial biopsies were taken from different locations in the uterus to assess the histopathology and the patient's cycle state.
8.1.7 Data Processing The background corrected spectra were normalised with the 575 nm peak intensity value of the corresponding Rhodamine B reference spectrum. The resulting fluorescence spectra (FL) can be decomposed in two main components: 1) endometrial autofluorescence (A) and 2) the PpIX fluorescence (P). Assuming that the spectral shape of autofluorescence spectrum is constant over time, a scaling factor can be derived from the ratio between AF intensity at 590 nm (k*A0) and at 635 nm (A0), as illustrated in Figure 8.4. Hence, the PpIX fluorescence (P) at 635 nm was derived with P=(FL-At) with k*At, the fluorescence value measured at 590 nm, and k, the known scaling factor. Additionally, P can be further normalized with k*At to account for geometry artefacts. The k factor was computed individually for each patient at the time when contribution of the PpIX fluorescence was still negligible.
Chapter 8 – The clinical Phamacokinetics Study
177
Figure 8.4 PpIX fluorescence spectra in the endometrium and relevant factors for data post-processing
8.2 Results In 6 of the 9 patients included in the study PpIX fluorescence measurements were performed in the patient room as well as in the operation theatre, as described above. For one patient (Patient 3) measurements were only performed in the patient room because the scheduled surgical intervention was cancelled for medical reasons. In the two other patients (Patient 1 and Patient 2), PpIX fluorescence measurements could only be performed in the operation theatre at 225 min and 345 min after instillation. The mean time interval between 5-ALA instillation and transfer to the operation theatre was 180 min (range 140 min - 240 min), and between 5-ALA instillation and surgery 260 min (range 195 min - 345 min). The time intervals for every patient are summarised in Table 8.1.
Figure 8.5 shows the corrected and normalised PpIX fluorescence intensity values as a function of time after instillation for all 9 patients. The data presented without error bars were obtained from the measurements in the patients room, whereas the data points presented with error bars show the mean values and the standard deviations of the measurements performed in the operation theatre. The curves were drawn for visual support. It can easily be seen that the shape of the pharmacokinetics vary significantly from one patient to another. Inter-patient variations of the PpIX fluorescence intensities at a given post instillation time were about one order of magnitude. The highest PpIX fluorescence intensities were measured in P5 in the secretory phase and in P8 with endometrial hyperplasia. The lowest PpIX fluorescence was observed in P3 with atrophic endometrium. The PpIX fluorescence intensities measured with LIFS showed good correlation with the fluorescence observed during the subsequent fluorescence hysteroscopies. Endometrium with low PpIX fluorescence intensities measured with LIFS generally exhibited no or extremely low PpIX fluorescence (F-) with fluorescence hysteroscopy, while patients with high LIFS PpIX fluorescence intensities in the endometrium exhibited a clear PpIX fluorescence (F+).
Moreover, significant inter-patient variations were observed in the time intervals between instillation and maximal measured PpIX fluorescence. The mean time interval between instillation and PpIX fluorescence maximum was 200 min (range 80 min - 310 min). The shortest time interval (80 min) was observed in P8 with endometrial hyperplasia. There were

Chapter 8 – The clinical Phamacokinetics Study
178
no significant correlations between the PpIX pharmacokinetics parameters (instillation-fluorescence maximum interval, maximal fluorescence intensity value) and the patient
menopausal status or endometrial histology. The variations in the PpIX fluorescence intensities measured in a patient at a given time post instillation can be estimated from the measurements performed in the operation theatre. Those "intra-patient" variations were in the order of 47% (range 16% - 73 %). In P4, important fluctuations of 160% were observed due to very low Pp IX fluorescence values in the corpus uteri and one high value obtained in contact with the fundus uteri. The fluorescence diagnostic hysteroscopy performed after the spectrofluorometric measurements revealed a non-fluorescing endometrium in this case.
0
5
10
15
20
25
30
0 40 80 120 160 200 240 280 320 360 400
Time after drug instillation [min]
Pp
IX F
luo
resc
en
ce In
ten
sity
[r.u
.]
P1 AthropyP2 AtrophyP3 AtrophyP4 ProliferationP5 Secretory PhaseP6 Secretory PhaseP7 Secretory PhaseP8 HyperplasiaP9 Hyperplasia
Figure 8.5 Pharmacokinetics of 5-ALA induced PpIX in the endometrium for all 9 patients. The error bars depict the standard deviations. The curves were drawn for visual support.
Significant relative decrease or increase of the PpIX fluorescence intensity at two successive times post instillation occurred principally following a patient's change of position in the bed (data not shown). Eleven of such changes were documented. The mean fluctuations resulting from the changes of position were 37% (range 5% - 75%). In two patients, the change of position resulted in fluctuations of 300%. Fluorescence hysteroscopy revealed an endometrial polyp in one patient and a hardly fluorescing endometrium in the other.
8.3 References [1] P. Wyss, A. Degen, R. Caduff, R. Hornung, U. Haller and M. Fehr, "Fluorescence hysteroscopy using 5-aminolevulinic: a descriptive study," Lasers Surg Med 33(3), 209-212 (2003)
[2] A. Degen, T. Gabrecht, G. Wagnieres, R. Caduff, B. Imthurn and P. Wyss, "Influence of the menstrual cycle on aminolevulinic acid induced protoporphyrin IX fluorescence in the endometrium: in vivo study," Lasers Surg Med 36(3), 234-237 (2005)

179
Chapter 9 Discussion and
Future Prospects
9.1 Discussion Photodynamic endometrial ablation for the treatment of menorrhagia and hypermenorrhea is under investigation since more than one decade. PEA following topical application of 5-ALA into the uterine cavity has shown promising results in preclinical studies in rodents [1-3] and non-human primates [4, 5]. However, first clinical trials reported only limited therapeutic effect of PEA due to an incomplete and/or inhomogenous destruction of the functional and basal layers of the endometrium [6, 7]. In both studies, the PEA parameters (amount of instilled 5-ALA, drug-light time interval, and irradiation light dose) were determined according to the results of ex vivo fluorescence microscopy studies. These results might have been biased by several artefacts, as already mentioned above. However, it seems likely that the variable and limited success for clinical PEA is due to the variations observed in this study here. Indeed, these ljThey may have a severe negative impact on the outcome of PEA. In a morphological clinical study, Wyss et al. [7] found incomplete or absent destruction of the endometrium after 5-ALA based PEA resulting from inhomogeneities in the PpIX distribution, among others. The results presented here strongly suggest that the outcome of PEA may strongly vary from one patient to another, even if a well-defined protocol is applied to all patients.

Chapter 9 – Discussion and Future Prospects
180
To our best knowledge, the study presented here is the first report of an in vivo pharmacokinetics study of 5-ALA induced PpIX in the human endometrium. The main results of the study may be summarised as follows:
(1) we demonstrated that in vivo pharmacokinetics measurements of 5-ALA induced PpIX using LIFS are feasible and well tolerated by the patient.
(2) The in vivo pharmacokinetics of PpIX following intrauterine instillation of 5-ALA show strong in intra-patient and inter-patient variations: a) in the time corresponding to the maximum of the PpIX fluorescence and b) the PpIX fluorescence intensity. Indeed, in 3 of 9 patients, the maximal PpIX fluorescence intensity was measured earlier than 3 h after instillation. In addition, the maximal PpIX fluorescence intensity fluctuated by more than one order of magnitude between the patients. Moreover, the measurements revealed significant intra-patient variations of the PpIX fluorescence, these variations being in the order of 50%.
(3) No correlation between the inter- and intra-patient variations in the PpIX pharmacokinetics and the menopausal status and/or endometrial histology was observed. These three types of results are not in complete agreement with those reported by other groups as described below.
LIFS measurements LIFS artefacts can be due to the following reasons: variations in the tissue-probe contact, difference in the uterus length and width, anatomical variations in the uterus position, and contamination, and contamination of the probe tip (blood, secretions), among others. We observed a good correlation between the PpIX fluorescence intensities measured with LIFS and the observations by fluorescence hysteroscopy. This validates the LIFS measurements and rejects the possibility that the inter-patient variations in the PpIX intensity are due to LIFS artefacts.
Time of maximal PpIX fluorescence In their fluorescence microscopy study on human hysterectomy samples, Fehr et al. [8] found maximal PpIX fluorescence in the endometrium at 4-8 hours after intrauterine instillation of 5-ALA. Clinical PEA was typically performed at this time interval [7, 9, 10]. Similar time intervals between topical 5-ALA application and PpIX fluorescence maximum have been reported for other organs [11, 12]. However, our results indicated that this time interval might be too long or too short for a significant portion of patients. Performing PEA at this drug-light interval may lead to a reduced photodynamic reaction in the endometrium, thus negatively affecting the outcome of PEA. Fluorescence studies in non-human primates showed maximal 5-ALA induced PpIX fluorescence 3-5 hours after instillation [5]. However, the pharmacokinetics was based on a single animal only.
It should be noted that not all patients involved this study allowed the determination of the time interval between 5-ALA instillation and the PpIX fluorescence maximum. This is principally due to two reasons. 1) the pharmacokinetics measurements were interrupted during the patient's transfer to the operation theatre. Consequently, no data are available for the corresponding time interval. 2) Measurements were stopped at the time of hysteroscopy and no data are available for times longer than typically 4 hours.
Chapter 9 – Discussion and Future Prospects
181
Intra-patient variations The intra-patient variations observed in our pharmacokinetics study are likely to be due to (1) changes in the tissue-probe contact/distance related to movements of the patient ,and (2) inhomogeneous spatial distribution of the PpIX fluorescence in the endometrium. While the first factor may play a role in the measurements performed in the patient's room (in the following “room measurements”), the second will be dominant in the measurements performed in the operation theatre with the intrauterine optical probe put in slight contact with the uterine wall ("guided measurements"). The intra-patient variations observed in the in situ measurements (about 40%) are comparable to those observed in the guided measurements (about 50%). This suggests that the intra-patient variations associated to patient movements may related to inhomogeneous spatial distribution of PpIX fluorescence across the endometrium rather than to the fluctuations of the tissue-probe contact. Unfortunatly, the relative contribution of both factors to intra-patient variations of in situ measurements is difficult to determine, since these measurements were performed without any visual and tactile control.
Inhomogeneous spatial distribution of PpIX fluorescence across the endometrium has also been reported in literature. Gannon et al. reported significant inhomogeneities of topically 5-ALA induced PpIX fluorescence in a fluorescence microscopy study on human hysterectomy samples [13]. Unfortunately, no the authors gave only a qualitative description of the variations but did not quantify these inhomogeneities.
Not much is known on the origins of the inhomogeneous distribution of PpIX fluorescence observed in tissues after topical application of 5-ALA. Two principal mechanisms should be considered [14]: (1) inhomogeneities in the spatial distribution of the 5-ALA solution across the uterine cavity upon instillation, and (2) local variations in the cellular ALA metabolism. It should be noted that about half of all patients in our study, who showed high (> 50%) intra-patient variations, showed endometrial polyps, myomas or foci of hyperplasia during fluorescence hysteroscopy (data not shown). It has been reported that neoplastic endometrial cells show a higher PpIX fluorescence than normal endometrial cells [15]. Thus, it is very likely that measurements on polyps or myomas result in higher PpIX fluorescence than measurements performed in contact with the normal endometrium. However, significant intra-patient variations have also been observed in normal uteri. In these cases, it is possible that these inhomogeneities result from the intrauterine distribution of the 5-ALA solution after instillation.
Maximal PpIX fluorescence intensity Significant inter-patient variations in the PpIX fluorescence in the endometrium were also reported in other human studies. Fehr et al. reported variations of the PpIX fluorescence measured at a given time after instillation in the order of 50% [8]. The authors attributed these variations to the menopausal status and the phase of cycle of the patients at the time of instillation. Indeed, human endometrium undergoes rapid cycles of rejection and renewal, associated with significant changes in its histology, under the influence of sex hormones, principally oestrogen and progesterone. Thus, it seems likely that the phase of menstrual cycle and the endometrial histology may influence the pharmacokinetics of PpIX. Indeed, oestrogen stimulation has been reported to increase the fluorescence of dihematoporphyrin ether in rat endometrial cells [16]. Not much is known about the mechanism by which oestrogen and progesterone may influence PpIX metabolism in the human endometrium. Animal studies in rats [17] and non-human primates [4] showed that oestrogen is not required for the PpIX generation from 5-ALA. Similar results have been reported from in vitro studies on prostate cancer cell lines [18]. Cells treated with androgens prior to application of 5-ALA showed a significant increase in PpIX accumulation, while a pre-treatment with oestrogen had no effect

Chapter 9 – Discussion and Future Prospects
182
on the PpIX accumulation. Butowska et al. [19] reported an increased 5-ALA induced PpIX fluoresecence in normal human endometrial epithelial cells stimulated with estradiol and progesterone. In a qualitative fluorescence hysteroscopy study including more than 60 patients Wyss et al. observed strong inter-patient variations in the endometrial PpIX fluorescence 4 hours following intrauterine instillation of 5-ALA [20]. PpIX-related fluorescence was observed in only 50% of all patients. PpIX fluorescence was correlated to the phase of cycle and endometrial histology. Indeed, less than 17% of patients with atrophic and proliferating endometrium showd fluorescence, whereas more than 80% of patients in the secretory phase and hyperplasia showed PpIX fluorescence. These observations may be indeed related to the inter-patient variations in the PpIX pharmacokinetics observed in the study presented Here. Since the fluorescence hysteroscopy system used by Wyss et al. is less sensitive to PpIX fluorescence than the spectrofluorometer, patients with low fluorescence at the time of hysteroscopy might have been identified as "fluorescence negative" in the hysteroscopy study. However, the data obtained in our in vivo pharmacokinetics study did not reveal any correlation between the pharmacokinetics and the patient's menopausal status and/or endometrial histology. It should be noted that the number of patients and the data set in this first clinical study are limited compared to the data set of the study by Wyss.
Not much is known on the origins of the inhomogeneous distribution of PpIX fluorescence observed in tissues after topical application of 5-ALA. Two principal mechanisms should be considered [14]: (1) inhomogeneities in the spatial distribution of the 5-ALA solution across the uterine cavity upon instillation, and (2) local variations in the cellular ALA metabolism. It should be noted that about half of all patients in our study, who showed high (> 50%) intra-patient variations, showed endometrial polyps, myomas or foci of hyperplasia during fluorescence hysteroscopy (data not shown). It has been reported that neoplastic endometrial cells show a higher PpIX fluorescence than normal endometrial cells [15]. Thus, it is very likely that measurements on polyps or myomas result in higher PpIX fluorescence than measurements performed in contact with the normal endometrium. However, significant intra-patient variations have also been observed in normal uteri. In these cases, it is possible that these inhomogeneities result from the intrauterine distribution of the 5-ALA solution after instillation.
They may have a severe negative impact on the outcome of PEA. In a morphological clinical study, Wyss et al. [7] found incomplete or absent destruction of the endometrium after 5-ALA based PEA resulting from inhomogeneities in the PpIX distribution, among others. The results presented here strongly suggest that the outcome of PEA may strongly vary from one patient to another, even if a well-defined protocol is applied to all patients. Monitoring of the PpIX concentration and its spatial distribution across the endometrium prior to PDT may reduce the failure rate of PEA. In vivo drug concentration monitoring for the optimisation of PDT was reported for other sensitisers [21]. In the case of 5-ALA based PEA, such monitoring could be performed by measuring the endometrial PpIX fluorescence by hysteroscopy or LIFS measurements.
In this study, we demonstrated that in vivo LIFS measurements using an intrauterine optical probe are feasible even over long time periods. In contrast to hysteroscpy, LIFS does not require anaesthesia and is not associated with the typical side effects related to hysteroscopy. On the other hand, fluorescence hysteroscopy allows visualisation of the spatial distribution of the PpIX fluorescence across the uterine cavity. Both methods use blue-violet light around the PpIX absorption maximum for fluorescence excitation. Since blue-violet wavelengths do not penetrate deep into biological tissue, no information is obtained on the in-depth distribution of the PpIX fluorescence in the endometrium. The use of green excitation wavelength around 540 nm may provide more information on non-superficial PpIX
Chapter 9 – Discussion and Future Prospects
183
fluorescence [14]. Green wavelengths (500 nm – 550 nm) have higher penetrations depths than blue-violet light, thus exciting also PpIX in deeper endometrial layers.
9.2 Conclusions We presented a low invasive spectroscopic method to assess the PpIX build-up in the human endometrium. The pharmacokinetics of 5-ALA induced PpIX in the human endometrium showed strong inter-patient variations in both the time interval between instillation and the PpIX fluorescence maximum, and the PpIX fluorescence intensity. The 4 hours drug-light interval currently used in 5-ALA based PEA should thus be revised and individualised. These intra-patient variations potentially result from inhomogeneous distribution of PpIX across the endometrium. Our study did not reveal a correlation between the cycle phase/ menopausal status of the patient and the PpIX build-up. However, it cannot be excluded that the PpIX pharmacokinetics is influenced by sex hormones.
9.3 Future Prospects PpIX based PDT for the ablation of the endometrium to treat menorrhagia and/or hypermenorrhea may be optimized following different strategies.
PpIX build-up improvements may be achieved by changing the precursor formulation and derivation. Indeed, no systematic studies of the PpIX precursor concentration and formulation have been reported for this application according to our knowledge. This situation is surprising considering the critical rule played by these parameters in the bladder[12], and in dermatology [22]. LIFS is clearly a useful tool for this purpose. The study reported in this manuscript provides interesting informations in this context. ALA derivatives, particularly its esters, induce a more rapid build-up of PpIX than 5-ALA in several epithelia. PDT would be possible with significantly lower doses and shorter instillation time (typically < 2h) relative to ALA if the same effect is induced in the endometrium. Iron chelators, such as deferoxamine mesylate (DFO), decrease the quantity of PpIX that is transformed into haem. Therefore the administration of PpIX precursor in combination with DFO may significantly increase the PpIX concentration while reducing the instillation time.
A shorter drug-light interval is of high interest for PEA, in particular if it is used as an adjuvant treatment for other endometrial ablation techniques. PEA could easily be performed following the precursor instillation after a standard ablation within a short time. This approach is of interest since hyperthermal ablation techniques (thermal balloon devices, microwaves, Nd:YAG laser, rollerball, etc.) induce inflammatory reactions in the endometrium. Since inflammatory tissues are known to exhibit a high PpIX build-up, such a combined treatment is likely to provide optimal conditions for photodynamic destruction of the ablation margins. This might significantly improve the outcome of the standard therapies. One of the main advantages of PEA is that it can be performed without extensive anaesthesia. Thus, the additional physiological stress for the patient would remain minimal.
Hormone modulation of the endometrium may be another possibility to increase the PpIX build-up in the endometrium. This approach is relevant since it is well established that the metabolic activity strongly influence the PpXI built-up. One supplementary potential interest of this approach my be to significantly reduce the hormone-related inter-patient variations of the PpIX pharmacokinetics. However, as mentioned above, it is still unclear whether and how sexual hormones influence the pharmacokinetics of PpIX in the endometrium.
Further studies are needed in this field. It would be ideal to investigate the PpIX pharmacokinetics under different hormonal conditions in the same patient, e.g. over the

Chapter 9 – Discussion and Future Prospects
184
period of a menstrual cycle. However, repetitive instillation and intrauterine fluorescence measurements cause a physical stress to the patient that is medically hardly acceptable. Pharmacokinetics studies in patient groups with comparable hormonal conditions (hormonal contraceptives, same day of cycle and menopausal status) may be an alternative approach.
Monitoring the PpIX fluorescence build-up and getting information on its spatial distribution in the endometrium prior to PDT is likely to be crucial for the outcome of PEA. Light-induced fluorescence spectroscopy provides a minimal invasive method for monitoring the PpIX fluorescence in the uterus. A routine monitoring of the PpIX build-up requires a small, easy-to-use spectrofluorometer system. Such a system might be based on a small size USB spectrometer, combined with a small diode laser source.
For this study, we developped an optical probe with straight cut optical fibre, resulting in a point like measurement geometry. Using a spherical isotropic probe instead of the straight cut fibre will reduce the influence of the tissue-probe contact on the fluorescence measurements. Moreover, an isotropic detector will be less sensitive to small inhomogeneities of the endometrial PpIX distribution. Finally, small size isotropic optical probes are commercially available and may easily be integrated in a balloon-based catheter.

Chapter 9 – Discussion and Future Prospects
185
9.4 References [1] R. A. Steiner, Y. Tadir, B. J. Tromberg, T. Krasieva, A. T. Ghazains, P. Wyss and M. W. Berns, "Photosensitization of the rat endometrium following 5-aminolevulinic acid induced photodynamic therapy," Lasers in Surgery and Medicine 18(3), 301-308 (1996)
[2] M. K. Fehr, B. J. Tromberg, L. O. Svaasand, P. Ngo, M. W. Berns and Y. Tadir, "Structural and functional effects of endometrial photodynamic therapy in a rat model," American Journal of Obstetrics and Gynecology 175(1), 115-121 (1996)
[3] P. Wyss, B. J. Tromberg, M. T. Wyss, T. Krasieva, M. Schell, M. W. Berns and Y. Tadir, "Photodynamic destruction of endometrial tissue with topical 5-aminolevulinic acid in rats and rabbits," American Journal of Obstetrics and Gynecology 171(5), 1176-1183 (1994)
[4] D. A. van Vugt, A. Krzemien, R. L. Reid, B. N. Roy, W. A. Fletcher, W. Foster, S. Lundahl and S. L. Marcus, "Photodynamic endometrial ablation in the nonhuman primate," Journal of the Society for Gynecologic Investigation 7(2), 125-130 (2000)
[5] R. L. Reid, J. Z. Yang, D. A. Van Vugt, B. N. Roy, J. C. Kennedy and W. G. Foster, "Intrauterine 5-aminolevulinic acid induces selective endometrial fluorescence in the rhesus and cynomolgus monkey," Journal of the Society for Gynecologic Investigation 3(3), 152-157 (1996)
[6] M. J. Gannon, D. I. Vernon, J. A. Holroyd, M. R. Stringer, N. Johnson and S. B. Bronwn, "PDT of the endometrium using ALA," Proc. SPIE 2972(2-13 (1997)
[7] P. Wyss, R. Caduff, Y. Tadir, A. Degen, G. Wagnieres, V. Schwarz, U. Haller and M. Fehr, "Photodynamic endometrial ablation: morphological study," Lasers Surg Med 32(4), 305-309 (2003)
[8] M. K. Fehr, P. Wyss, B. J. Tromberg, T. Krasieva, P. J. DiSaia, F. Lin and Y. Tadir, "Selective photosensitizer localization in the human endometrium after intrauterine application of 5-aminolevulinic acid," American Journal of Obstetrics and Gynecology 175(5), 1253-1259 (1996)
[9] P. Wyss, M. Fehr, H. Van den Bergh and U. Haller, "Feasibility of photodynamic endometrial ablation without anesthesia," International Journal of Gynecology & Obstetrics 60(3), 287-288 (1998)
[10] A. F. Degen, T. Gabrecht, L. Mosimann, M. K. Fehr, R. Hornung, V. A. Schwarz, Y. Tadir, R. A. Steiner, G. Wagnieres and P. Wyss, "Photodynamic endometrial ablation for the treatment of dysfunctional uterine bleeding: a preliminary report," Lasers Surg Med 34(1), 1-4 (2004)
[11] C. Felley, P. Jornod, G. Dorta, T. Stepinac, N. Lange, T. Gabrecht, H. Van Den Bergh, G. Wagnières, C. Fontolliet, P. Grosjean, P. Monnier and G. VanMelle, "Endoscopic fluorescence detection of intraepithelial neoplasia in Barrett's esophagus after oral administration of aminolevulinic acid," Endoscopy 35(8), 663-668 (2003)
[12] N. Lange, P. Jichlinski, M. Zellweger, M. Forrer, L. Guillou, P. Kucera, G. Wagnières and H. van den Bergh, "Photodetection of early human bladder cancer based on the fluorescence of 5-aminolaevulinic acid hexylester-induced protoporphyrin IX: a pilot study," British Journal of Cancer 80(1/2), 185-193 (1999)
[13] M. J. Gannon, N. Johnson, D. J. H. Roberts, J. A. Holroyd, D. I. Vernon, S. B. Brown and R. J. Lilford, "Photosensitization of the endometrium with topical 5-aminolevulinic acid," American Journal of Obstetrics and Gynecology 173(6), 1826-1828 (1995)
[14] N. Dögnitz and W. G, "Determination of tissue optical properies by steady-state spatial frequency-domain reflectometry," Lasers in Medical and Science 13(55-65 (1998)
[15] M. T. Wyss-Desserich, P. Wyss, U. Haller, M. T. Wyss-Desserich, C. H. Sun, P. Wyss, C. S. Kurlawalla, M. W. Berns, Y. Tadir and Y. Tadir, "Accumulation of 5-aminolevulinic acid-induced protoporphyrin IX in normal and neoplastic human endometrial epithelial cells," Biochemical and Biophysical Research Communications 224(3), 819-824 (1996)
Chapter 9 – Discussion and Future Prospects
186
[16] A. L. Major, C. F. Chapman, B. J. Tromberg, T. B. Krasieva, Y. Tadir, M. W. Berns, A. L. Major, U. Haller, G. Scott Rose, P. J. Disaia, J. C. Hiserodt and A. L. Major, "In vivo fluorescence detection of ovarian cancer in the NuTu-19 epithelial ovarian cancer animal model using 5-aminolevulinic acid (ALA)," Gynecologic Oncology 66(1), 122-132 (1997)
[17] B. N. Roy, D. A. Van Vugt, G. E. Weagle, R. H. Pottier and R. L. Reid, "Effect of 5-aminolevulinic acid dose and estrogen on protoporphyrin ix concentrations in the rat uterus," Journal of the Society for Gynecologic Investigation 4(1), 40-46 (1997)
[18] T. Momma, M. R. Hamblin, T. Hasan and T. Momma, "Hormonal modulation of the accumulation of 5-aminolevulinic acid- induced protoporphyrin and phototoxicity in prostate cancer cells," International Journal of Cancer 72(6), 1062-1069 (1997)
[19] W. Butowska, W. Warcho?, E. Nowak-Markwitz and M. Wo?un?-Cholewa, "Effect of 5-aminolevulinic acid (ALA) doses and oestrogen/progesterone on protoporphyrin IX (ppIX) accumulation in human endometrial epithelial cells.," Roczniki Akademii Medycznej w Bialymstoku (1995) 49 Suppl 1(123-125 (2004)
[20] P. Wyss, A. Degen, R. Caduff, R. Hornung, U. Haller and M. Fehr, "Fluorescence hysteroscopy using 5-aminolevulinic: a descriptive study," Lasers Surg Med 33(3), 209-212 (2003)
[21] T. Glanzmann, C. Hadjur, M. Zellweger, P. Grosiean, M. Forrer, J. P. Ballini, P. Monnier, H. van den Bergh, C. K. Lim and G. Wagnieres, "Pharmacokinetics of tetra(m-hydroxyphenyl)chlorin in human plasma and individualized light dosimetry in photodynamic therapy," Photochem Photobiol 67(5), 596-602 (1998)
[22] Z. Huang, "A review of progress in clinical photodynamic therapy," Technology in Cancer Research and Treatment 4(3), 283-293 (2005)
187
ACKNOWLEDGEMENTS
Research in biomedical optics is a multidisciplinary domain and for this reason,many people have directly and indirectly contributed to this work.. I would like to thank them all though many arenot specifically mentioned below.
I am very grateful to Georges Wagnières and to Prof. Hubert van den Bergh for giving me the opportunity to be a PhD student in their laboratory. I appreciate their interest in my work, the freedom they have given me while conducting my research as well as their accessibility, allowing for many constructive discussions. Their advice has always proved useful and their sincerty for seaking out the best solution no matter what the problem has been of immeasurable value.
My colleagues in the LPAS have been invaluable. I would especially like to thank Francois Borle, a passionate paraglider and chemist with an apparently endless knowledge of chemistry and physics, for his advice, active assistance, and his private lessons on the basics of chemistry for an unknowing physicist. I would also like to thank Jean-Pierre Ballini who always provided an insightful answer to every question and who's positive approach to other people and to science made the work with him an enriching experience ; Didier Goujon who introduced me to the clinical and technical secrets of autofluorescence detection; Thomas Glanzmann for his always patience, advice and sensible answers to all my pertinent and non-pertinent questions; Jerôme Barge, whose open-minded attitude and inner balance make it a pleasure to work with him; and Eddy Forte for scientific, socio-economic and socio-linguistic discussions (Elkore danko!).
My fellow PhD students need my attention here. First of all, Blaise Lovisa the indefatigable corrector of all my thesis manuscripts and articles deserves special credit for his twenty-four-seven emergency commitment and imperturbable action to master the spleens of "Word" in critical situations - thank you very much for this. I also would like to extend special thanks to: Pascal Uehlinger, for sharing in the long hours of measurements in the hospital, as well as coffee-breaks at the EPFL and for always keeping his good humor and motivation; Patrycja Nowak-Sliwinska for her care and encouraging smiles in the final phase of my thesis, and great company both inside and outside the lab; Bernadette Pegaz, an indefatigable runner, for always being a slight step ahead of me during our lunch-time runs; Elodie Debefve, who made me realize, that French is not equal to (Belgium) French; Filippo Piffaretti, who always spreads some good humour around him and who is always ready to play a trick on someone, and finally Santhakumar Kannappan, who keeps his smile and sense of tranquility even in unpleasant situations.
I would like to thank my fellow coworkers of the LPAS, especially the photomedicine group who accompanied me during my thesis research: Nora Dögnitz, Mathieu Zellweger, Thomas Stepinac, Norbert Lange, Claude-André Porret, Ramiro Conde, and Laurent Descloux. I extend special appreciation to Véronique Bauler, Carine Vagnières and Stefania Tartaglia, who make the LPAS group running smoothly and who manage the more than 35 collaborators of the LPAS with ease.
188
Roland Bays and Alain Woodli deserve special thanks for sharing their endless knowledge base in fiber optics, and their unhesitant and patient assistance with the light diffusers.
Finally, the whole work would not have been possible without the excellent handcraft skills of Flavio Comino and the electronics engineering of André Studzinski.
Much of my research work was performed in the endoscopy department of the CHUV University Hospital in Lausanne, the Lungenklinik in Hemer (Germany) and the department for Obstetrics and Gynaecology of the University Hospital in Zurich.
The staff and physicians of the CHUV Hospital displayed much patience, tolerance and flexibility with our experiments. Special thanks go to Alexandre Radu and Pierre Grosjean who were always motivated and performed most of the autofluorescence measurements. My deep gratitude goes to Prof. Philippe Monnier, the head of the ENT clinics, whose commitment solidified the collaboration between the CHUV and the EPFL. I would also thank all the chiefs and resident physicians of the ENT clinics, especially Philippe Pasche, Florian Lange, Marie-Laure Monod and Enrico Musumeci. I extend my thanks also to the people of the urology department, namely Prof. Patrice Jichlinski and Daniela Aymon.
Though their daily work was frequently disturbed by our experiment, the people in the endoscopy department never stopped smiling and being patient. Thank you especially to Petra de Jonge, Sylvie Perret-Bakhouy, Deborah Hinchliffe, "Jean-Marc" Gianmarco Guglielmetti, "Pino" Guiseppe Andreoli, Louise Tissot, Brigitte Théry, Marzia Gassen, and Elsa Joao…..- I am sure I could extend the list with many other people.
Special thanks to Snezana Andrejevic-Blant, for her minute analysis of the bronchial biopsy samples and her excellent instruction on bronchial histopathologie.
The people in the Hemer Lungenklinik gave me and my strange systems a warm welcome. Special thanks go to Dr. Lutz Freitag, head of the endoscopy department and the research unit who enabled the privileged access to the endoscopy theatre. I would also like to acknowledge the competent and conscientious work of Günther Reichle who performed most of the autofluorescence bronchoscopies, and the cordiality and flexibility exhibited by the entire endoscopy team. It was also a real pleasure to work with the people from the cell research lab in Hemer who gave me a really hearty welcome. . Moreover I would like to thank Ilse Brightman for her assistance with the histopathologic analysis in Hemer. Some of the studies in Hemer were performed in collaboration with Dirk Hüttenberger a fellow PhD student from Kaiserslautern. He should be thanked here for his consistent cooperativeness and positive motivation, even when entangled in unpleasant tasks.
The same gratitude is extended to the people of the obstetrics and gynaecology department of the University Hospital in Zurich, namely Prof. Urs Haller, Pius Wyss, Matthias Fehr, and the "Gyn OPS" team. Two people of the Zurich hospital deserve special thanks here: Viola Schwarz merits compliments for her undeviating commitment to coordinate clinical routine and good clinical research; and Andrea Degen whose positive and always optimistic approach to the environment, the patients and medicine made for a pleasant and enriching experience.

189
I would like to thank my family and friends for their support, their care and their patience. I would not have made it without you all. My deepest gratitude goes to my mother who always encouraged me to continue on and make my plans become a reality. Although they could not accompany me until the end of my thesis, two people deserve my gratitude for what they taught me: my father and my grandfather, who have formed my approach to science and engineering. André my common-law spouse shared in the ups and downs of my years as a PhD student with a lot of patience and tolerance – thank you for that.

190

191
Appendix A Clinical cases with the DAFE system
he Richard Wolf’s DAFE system was designed following the results of the clinical study presented in Chapter 5.1. The system is described in detail in Chapter 5.2. The system has been widely used in the Endoscopy Department of the CHUV University
Hospital. 151 pneumology and ENT patients of the departement of the CHUV University Hospital in the period underwent AFB with the DAFE system in the between January 2002 and September 2005. Five typical examples of fluorescence positive lesions are shown here. The diameter of the endoscopic view is between 15 mm and 20 mm. For each case, the DAFE images on the left hand side is presented with its corresponding white light (WL) image. The location of the lesion within the tracheo-bronchial tree is illustrated in the attached graphics. Further images as well as short video sequences showing DAFE exams in the bronchi can be found on the Lausanne Photomedicine group’s website on http://lpas.epfl.ch/PDT/pdt_images.html.
T
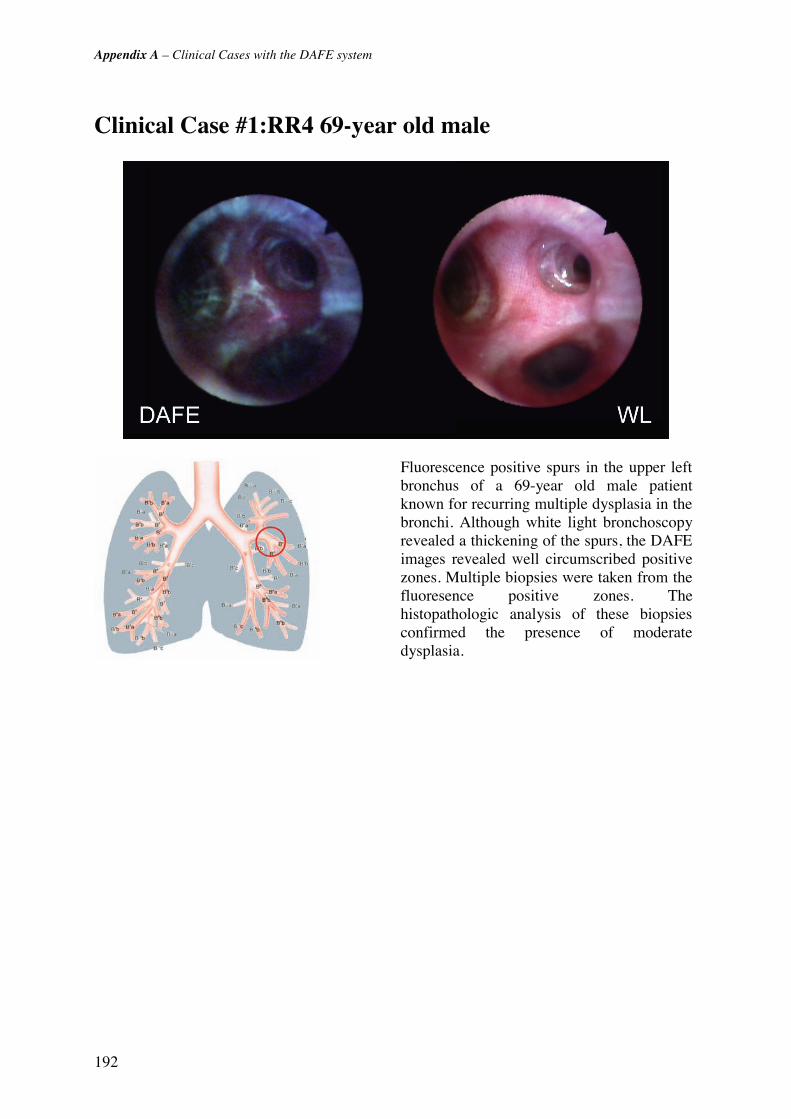
Appendix A – Clinical Cases with the DAFE system
192
Clinical Case #1:RR4 69-year old male
Fluorescence positive spurs in the upper left bronchus of a 69-year old male patient known for recurring multiple dysplasia in the bronchi. Although white light bronchoscopy revealed a thickening of the spurs, the DAFE images revealed well circumscribed positive zones. Multiple biopsies were taken from the fluoresence positive zones. The histopathologic analysis of these biopsies confirmed the presence of moderate dysplasia.
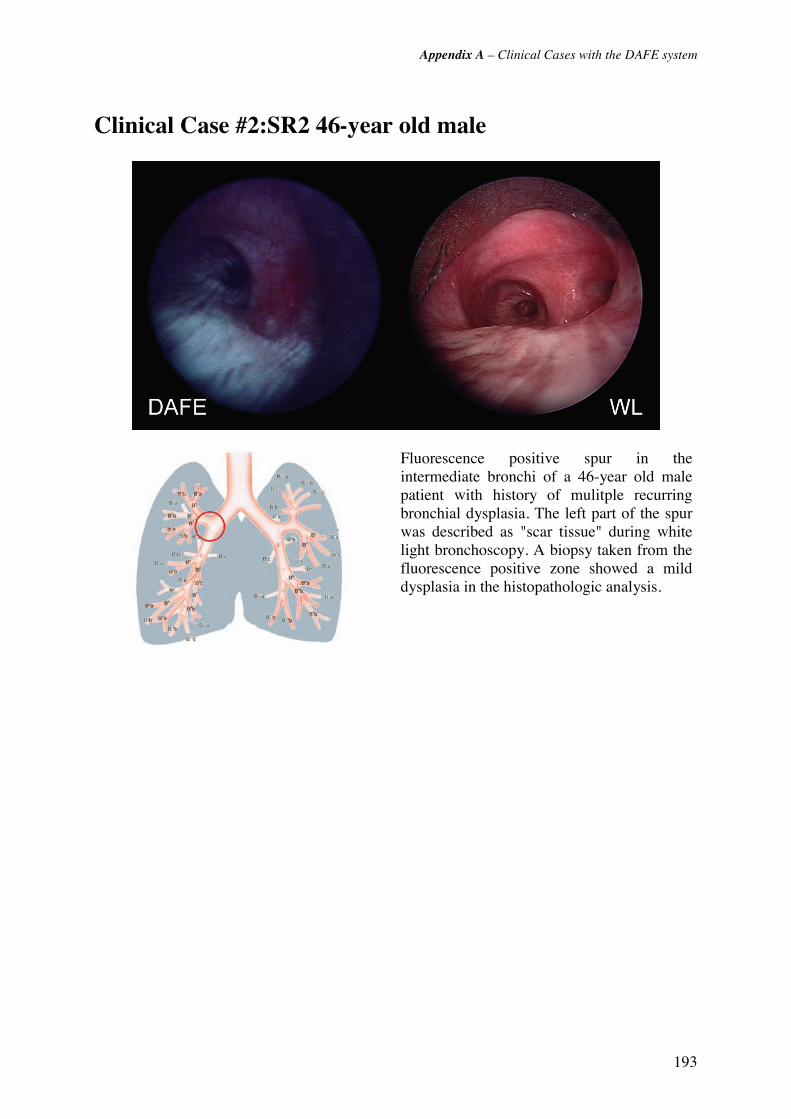
Appendix A – Clinical Cases with the DAFE system
193
Clinical Case #2:SR2 46-year old male
Fluorescence positive spur in the intermediate bronchi of a 46-year old male patient with history of mulitple recurring bronchial dysplasia. The left part of the spur was described as "scar tissue" during white light bronchoscopy. A biopsy taken from the fluorescence positive zone showed a mild dysplasia in the histopathologic analysis.

Appendix A – Clinical Cases with the DAFE system
194
Clinical Case #3:RR6: 69-year old male
The 69-year old male patient underwent panendoscopy and AFB for recurring multiple bronchial squamous dysplasia. Some of these dysplasia had been treated by PDT 12 month prior to this exam. AFB revealed a prolate red zone centered on the spur that had not been described in former bronchoscopies. The spur was classified as non-suspect with WL bronchoscopy. Two biopsies were taken from the fluoresence positive zone. The histopathologic analysis of these biopsies showed a mild squamous dysplasia.
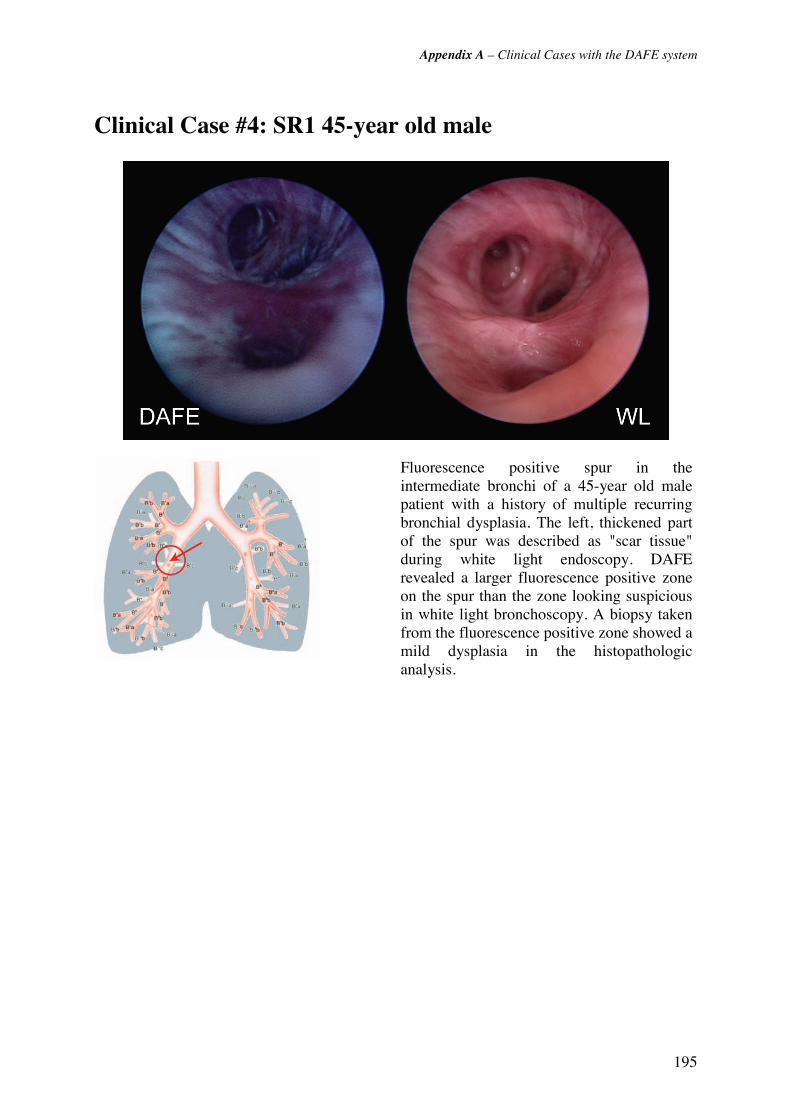
Appendix A – Clinical Cases with the DAFE system
195
Clinical Case #4: SR1 45-year old male
Fluorescence positive spur in the intermediate bronchi of a 45-year old male patient with a history of multiple recurring bronchial dysplasia. The left, thickened part of the spur was described as "scar tissue" during white light endoscopy. DAFE revealed a larger fluorescence positive zone on the spur than the zone looking suspicious in white light bronchoscopy. A biopsy taken from the fluorescence positive zone showed a mild dysplasia in the histopathologic analysis.
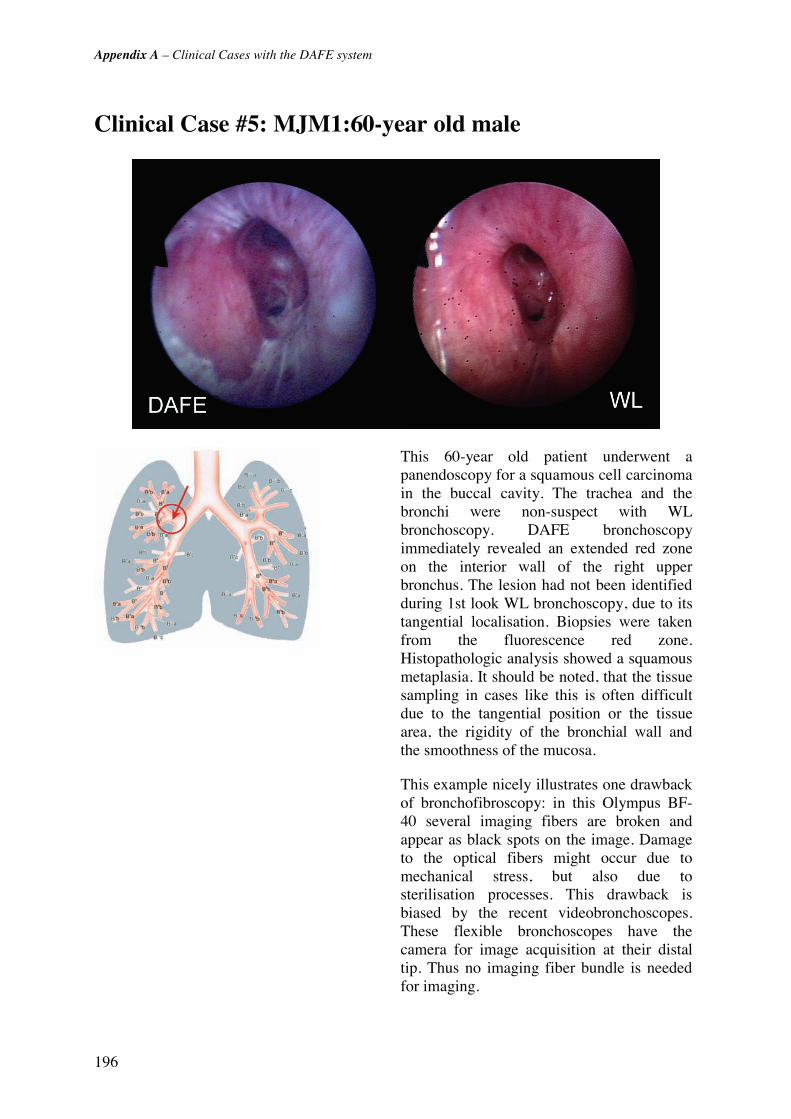
Appendix A – Clinical Cases with the DAFE system
196
Clinical Case #5: MJM1:60-year old male
This 60-year old patient underwent a panendoscopy for a squamous cell carcinoma in the buccal cavity. The trachea and the bronchi were non-suspect with WL bronchoscopy. DAFE bronchoscopy immediately revealed an extended red zone on the interior wall of the right upper bronchus. The lesion had not been identified during 1st look WL bronchoscopy, due to its tangential localisation. Biopsies were taken from the fluorescence red zone. Histopathologic analysis showed a squamous metaplasia. It should be noted, that the tissue sampling in cases like this is often difficult due to the tangential position or the tissue area, the rigidity of the bronchial wall and the smoothness of the mucosa.
This example nicely illustrates one drawback of bronchofibroscopy: in this Olympus BF-40 several imaging fibers are broken and appear as black spots on the image. Damage to the optical fibers might occur due to mechanical stress, but also due to sterilisation processes. This drawback is biased by the recent videobronchoscopes. These flexible bronchoscopes have the camera for image acquisition at their distal tip. Thus no imaging fiber bundle is needed for imaging.
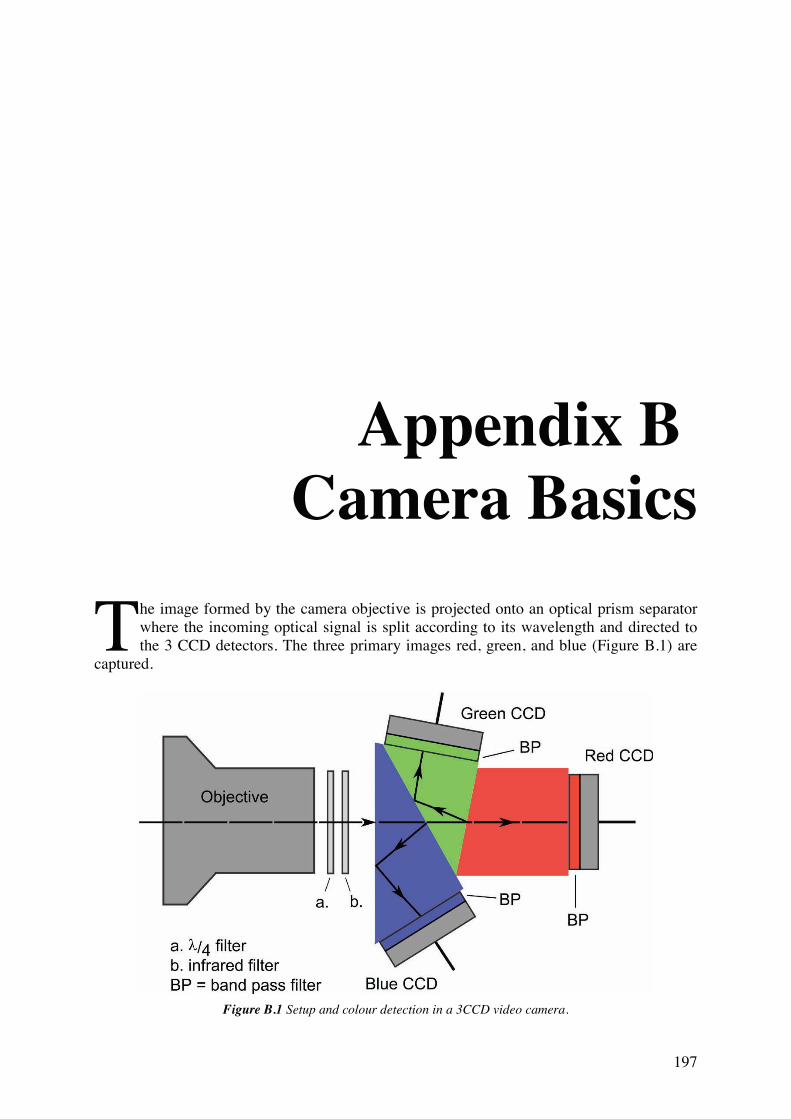
197
Appendix B Camera Basics
he image formed by the camera objective is projected onto an optical prism separator where the incoming optical signal is split according to its wavelength and directed to the 3 CCD detectors. The three primary images red, green, and blue (Figure B.1) are
captured.
Figure B.1 Setup and colour detection in a 3CCD video camera.
T
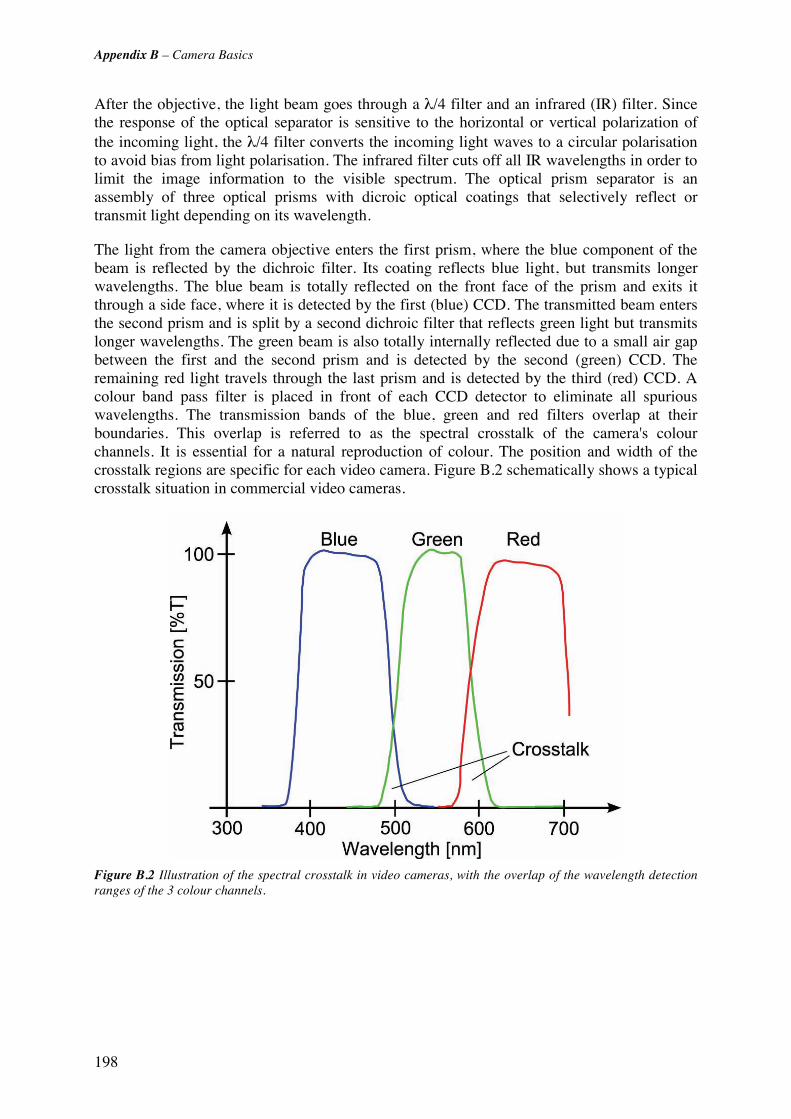
Appendix B – Camera Basics
198
After the objective, the light beam goes through a λ/4 filter and an infrared (IR) filter. Since the response of the optical separator is sensitive to the horizontal or vertical polarization of the incoming light, the λ/4 filter converts the incoming light waves to a circular polarisation to avoid bias from light polarisation. The infrared filter cuts off all IR wavelengths in order to limit the image information to the visible spectrum. The optical prism separator is an assembly of three optical prisms with dicroic optical coatings that selectively reflect or transmit light depending on its wavelength.
The light from the camera objective enters the first prism, where the blue component of the beam is reflected by the dichroic filter. Its coating reflects blue light, but transmits longer wavelengths. The blue beam is totally reflected on the front face of the prism and exits it through a side face, where it is detected by the first (blue) CCD. The transmitted beam enters the second prism and is split by a second dichroic filter that reflects green light but transmits longer wavelengths. The green beam is also totally internally reflected due to a small air gap between the first and the second prism and is detected by the second (green) CCD. The remaining red light travels through the last prism and is detected by the third (red) CCD. A colour band pass filter is placed in front of each CCD detector to eliminate all spurious wavelengths. The transmission bands of the blue, green and red filters overlap at their boundaries. This overlap is referred to as the spectral crosstalk of the camera's colour channels. It is essential for a natural reproduction of colour. The position and width of the crosstalk regions are specific for each video camera. Figure B.2 schematically shows a typical crosstalk situation in commercial video cameras.
Figure B.2 Illustration of the spectral crosstalk in video cameras, with the overlap of the wavelength detection ranges of the 3 colour channels.
199
Appendix C Fluorescence
in History

Appendix C – Fluorescence in History
200
Fluorescence in history
1500 B.C. Phenomenon corresponding to fluorescence and phosphorescence were described in Chinese literature.
1565 Nicolas Monardes (1493-1588) observed luminescence in extracts from Lignum nephriticum, a wood from a South American plant, used for the treatment of kidney stones.
1671 Athanasius Kirchner (1602-1680) described the luminescence phenomenon of extracts from Lignum nephriticum in water in his book "Ars Magna Lucis et Umbrae", Kirchner observed and described fluorescence for the first time in history.
1808 - 1810 Johann Wolfgang von Goethe (1749 - 1832) described fluorescence in his "Farbenlehre" (Theory of Colours), encouraging the reader to observe the fluorescence from horsechestnut (Aesculus hippocastanum) bark in water.
1833 Sir David Brewster described the red emission from chlorophyll.
1845 Sir John Frederick William Herschel discovered the phenomenon of fluorescence in an aqueous quinine solution.
1852 Sir Georges Gabriel Stokes named the luminescence phenomenon occurring from the mineral fluorite (calcium fluoride) "fluorescence". Stokes was the first to interpret the light-emitting phenomenon and formulated the "Stokes Law".
1911 Max Haitinger (1868 - 1946) introduced the term "fluorochrome" for fluorescence emitting molecules.
1911/13 Otto Heimstaedt and Heinrich Lehmann developed the first fluorescence microscope to investigate the autofluorescence of bacteria, protozoa, plant and animal tissues.
1935 Alexander Jablonski (1898 - 1980) established his model (Jablonski diagram) explaining the molecular and electronic origins of fluorescence.
1950 Albert Hewett Coons and Melvin Kaplan developed the immunofluorescence technique in biology.

201
Appendix D Bronchoscopy
ronchoscopy is the visualisation of the upper airways using flexible or rigid endoscopes that are introduced through the mouth or the nose. The first bronchoscopy was performed in 1897. The German ENT physician G. Kilian successfully examined
the trachea with an optical device for the eventual removal of a foreign body. The introduction of the rigid bronchoscopy techniques constituted and important event in the development of pneumology, since it allowed for the direct exploration of the tracheo-bronchial tree. The advent of the flexible bronchoscope (“bronchofibroscope”), designed by S. Ikeda in 1968, expanded the applications of bronchoscopy. Bronchofibroscopic explorations are much easier, faster and more comfortable for the patient than rigid bronchoscopy.
Rigid bronchoscopy is performed with a rigid, straight, hollow stainless steel tube called the bronchoscope that is inserted into the trachea through the patient's mouth. The bronchoscope's diameter can vary, but most bronchoscopes for adult patients have diameters between 8 mm and 14 mm. Visual inspection of the tracheo-bronchial tree is performed with a rod telescope that is inserted into the bronchoscope. Since most endoscopic rod-telescopes contain a lens optical system invented by Hopkins, they are often referred to as Hopkins optics. A fibre optic or liquid light guide delivers the light from an external endoscopic cold light source to the telescope where it illuminates the endoscopic site. Rigid bronchoscopy requires general anaesthesia, whereas local anaesthesia and sedation is often sufficient for bronchofibroscopy.
B
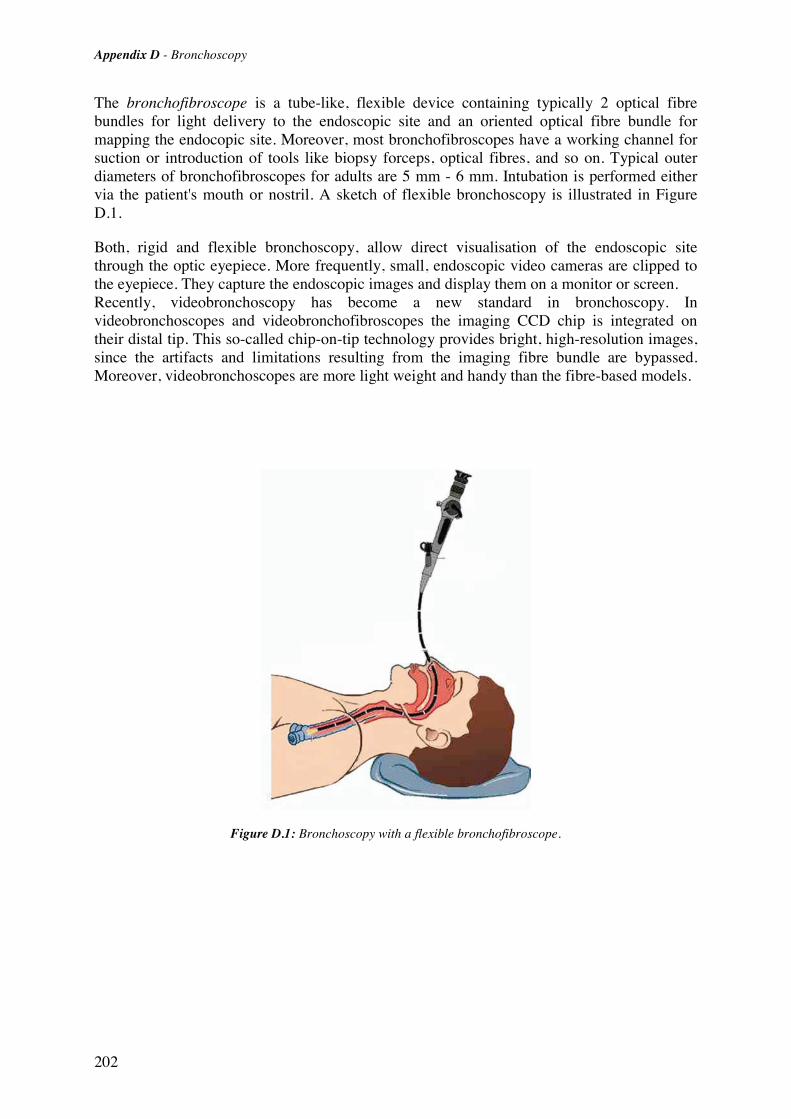
Appendix D - Bronchoscopy
202
The bronchofibroscope is a tube-like, flexible device containing typically 2 optical fibre bundles for light delivery to the endoscopic site and an oriented optical fibre bundle for mapping the endocopic site. Moreover, most bronchofibroscopes have a working channel for suction or introduction of tools like biopsy forceps, optical fibres, and so on. Typical outer diameters of bronchofibroscopes for adults are 5 mm - 6 mm. Intubation is performed either via the patient's mouth or nostril. A sketch of flexible bronchoscopy is illustrated in Figure D.1.
Both, rigid and flexible bronchoscopy, allow direct visualisation of the endoscopic site through the optic eyepiece. More frequently, small, endoscopic video cameras are clipped to the eyepiece. They capture the endoscopic images and display them on a monitor or screen. Recently, videobronchoscopy has become a new standard in bronchoscopy. In videobronchoscopes and videobronchofibroscopes the imaging CCD chip is integrated on their distal tip. This so-called chip-on-tip technology provides bright, high-resolution images, since the artifacts and limitations resulting from the imaging fibre bundle are bypassed. Moreover, videobronchoscopes are more light weight and handy than the fibre-based models.
Figure D.1: Bronchoscopy with a flexible bronchofibroscope.

203
Appendix E Glossary
24-bit RGB : Additive model in which three primary colours, namely red, green and blue, are combined in various ways to reproduce other colours. In numeric 24-bit RGB each primary is encoded in 8-bit, i.e. in integers from 0 to 255.
Accuracy : (1) freedom from mistake or error (correctness). (2) conformity to truth or to a standard model (exactness). (3) the degree of conformity of a measured/calculated quantity to its actual (true) value.
adjuvant : additional; completing.
AF : Autofluorescence; the tissue intrinsic fluorescence.
AFB : Autofluorescence Bronchoscopy
AGC : Automatic gain control.
Airway crypt : Invagination of the bronchial wall, often occurring in chronic inflammatory bronchi, and chronic bronchitis.
ALA : Aminolaevulinic acid.
Albedo : The ratio between the scattering and the total attenuation coefficient A=(μs)/(μt)= (μs)/(μa + μs), for A=0 the attenuation is exclusively due to absorption, whereas in the case of A=1 only scattering occurs.
AMD : Age-related macula dgeneration.
Aniline : Aniline, phenylamine or aminobenzene (C6H5NH2) is an organic chemical compound which is a primary aromatic amine consisting of a benzene ring and an amino group.
Apoptosis : One of the main types of programmed cell death. As such, it is a process of deliberate life relinquishment by an unwanted cell in a multi-cellular organism. In contrast to necrosis, which is a form of cell death that results from acute cellular injury, apoptosis is carried out in

204
an ordered process that generally confers advantages during an organism's life cycle. [source http://www.wikipedia.org]
Atelectasis : Collapse of the expanded lung.
Basement lamina : See: basement membrane
Basement membrane : A thin, delicate membranous layer of connective tissue underlying the epithelium of many organs. The basement membrane is also called basement lamina.
Benzidine : Benzidine is the trival name for 4,4'-diaminobiphenyl, this is a carcinogenic aromatic amine which has been used as part of a test for cyanide and also in the synthesis of dyes. It has been linked to bladder cancer. [source http://www.wikipedia.org]
Bronchoscope : Tubular illumination instrument used for inspecting or passing instruments into the bronchi; in rigid bronchoscopy, the telescope (Hopkins optics) is sometimes wrongly referred to a bronchoscope.
Carcinogene : In pathology, a carcinogen is any substance or agent that promotes cancer. Carcinogens are also often, but not necessarily, mutagens or teratogens. [source http://www.wikipedia.org]
Carcinogenesis : Carcinogenesis (meaning literally, the creation of cancer) is the process by which normal cells are transformed into cancer cells. [source http://www.wikipedia.org]
CCD : Chage-coupled device.
cervical :of or relating to a neck or a cervix
Chromosome : A threadlike linear strand of DNA and associated proteins in the nucleus of eukaryotic cells that carries the genes and functions in the transmission of hereditary information.
CIS : Carcinoma in situ.
Clavicle : Bone of the pectoral girdle that links the scapula and sternum. It is situated just above the first rib on either side of the neck, and has the form of a narrow elongated S; also called collarbone
Comorbidity : The presence of coexisting or additional diseases with reference to an initial diagnosis or with reference to the index condition that is the subject of study. Comorbidity may affect the ability of affected individuals to function and also their survival; it may be used as a prognostic indicator for length of hospital stay, cost factors, and outcome or survival.
Computed tomography : Radiography in which a three dimensional image of a body structure is constructed by computer from a series of plane cross-sectional image made along an axis
contralateral : the opposite side
Crisis : (1) Turning point or decisive moment in events. (2) A stage of the in vitro transformation of cells. It is characterized by reduced proliferation of the culture, abnormal mitotic figures, detachment of cells from the culture substrate, and the formation of multinucleated or giant cells. During this massive cultural degeneration, a small number of colonies usually, but not always, survive and give rise to a culture with an apparent unlimited in vitro lifespan.
CRT : Cathode Ray Tube; the traditional form of video and computer monitors
CT : See: Computed tomography
CXR : Chest X-ray.
DAFE : Diagnostic AutoFluorescence Endoscopy
Detection : (1) to discover the true character of. (2) to discover or determine the existence, presence, or fact of.
Diagnosis : (1) The process of identifying a disease by its signs, symptoms and results of various diagnostic procedures. (2) The decision reached by diagnosis.
Diagnostic testing : Evaluation of patients with signs or symptoms associated with cancer (blood in stool, fatigue, breast lump, weight loss).
Disorder : Abnormal physical or mental condition.
205
DV : Digital video.
Endoscope: Instrument for visualising the interior of a hollow organ
ENT: Abbreviation for ear, nose, and throat.
Epidemiology: Study of frequency of the disease in populations living under different conditions.
ERTS: Environmental tobacco smoke.
Erythrocytes: Red blood cells (RBCs). Erythrocytes consist mainly of hemoglobin, a complex molecule containing heme groups whose iron molecules temporarily link to oxygen molecules in the lungs or gills and release them throughout the body. Hemoglobin also carries some of the waste product carbon dioxide back from the tissues. (In humans, less than 2% of the total oxygen, and most of the carbon dioxide, are held in solution in the blood plasma). A related compound, myoglobin, acts to store oxygen in muscle cells. [source: http://www.wikipedia.org]
FAD : Flavin adenine dinucleotide (oxidised form).
FD : Fluorescence detection.
Fibroblast : A cell that gives rise to connective tissue.
fps :Frames per second; a measure for the frame rate in video.
Franck-Condon principle : Classically, the approximation that an electronic transition is most likely to occur without changes in the positions of the nuclei in a molecular entity and its environment. The resulting state is called a Franck-Condon state, and the transition involved is called a vertical transition. The quantum mechanical formulation of this principle is that the intensity of a vibronic transition is proportional to the square of the overlap integral between the vibrational wavefunctions of the two states involved in the transition. [IUPAC PHOTOCHEMICAL GLOSSARY (1988)].
FWHM : Full width half-maximum; expression of the extent of a function, given by the difference between the two extreme values of the independent variable at which the dependent variable is equal to half of its maximum value. FWHM is applied to such phenomena as the duration of pulse waveforms and the spectral width of sources.
Gamma : Here: gamma correction in video. A power-law relationship that approximates the relationship between the encoded luminance in a television system and the actual desired image brightness.
Genomics : The study of an organism's genome and the use of the genes. It deals with the systematic use of genome information, associated with other data, to provide answers in biology, medicine, and industry.
GI : gastro-intestinal (tract).
h-ALA : 5-hexylester-aminolaevulinic acid.
hilar : Relating to, affecting, or located near a hilum.
Hilum : A depression or fissure where vessels or nerves or ducts enter a bodily organ.
Hilus : See: hilum.
HPD : Haematoprophyrin dervative; a first generation photosensitiser.
Ipsilateral : the same side
Lamina Propria : A thin vascular layer of connective tissue beneath the epithelium of an organ; underlying covering epithelial tissues is a layer of connective tissue called lamina propria, which is bound to the epithelium by the basal lamina. The lamina propria not only serves to support the epithelium but also binds it to neighboring structures. The contact between epithelium and lamina propria is increased by irregularities in the surface in the form of evaginations called papillae.

206
Laser : Light Amplification by Stimulated Emission of Radiation; an optical source that emits photons in a coherent beam. Laser light is typically near-monochromatic, i.e. consisting of a single wavelength or hue, and emitted in a narrow beam. [source: http://www.wikipedia.org]
Lesion : An abnormal change in structure of an organ or part due to injury or disease
Lifetime probability : A statistical estimate of being diagnosed with a specified cancer during an individual’s lifetime, expressed as percent.
Lobe : (1) a more or less rounded projection of a body organ or part. (2) a division of a body organ (as the brain, lungs, or liver) marked off by a fissure on the surface
Magnetic resonance imaging : A non-invasive diagnostic technique that produces computerized images of internal body tissues and is based on nuclear magnetic resonance of atoms within the body induced by the application of radio waves
metachronous : occurring at different times
MRI : See: magnetic resonance imaging
Mucosa : (pl. mucosae) Linings of ectodermic origin, covered in epithelium, and are involved in absorption and secretion. They line various body cavities that are exposed to the external environment and internal organs. It is at several places continuous with skin: at the nostrils, the lips, the ears, the genital area, and the anus. Body cavities featuring mucous membrane include most of the respiratory tract, the entire gastrointestinal tract, including the rectum, the urethra, and various other organs. In addition, the vagina, cervix, the clitoris, the covering of the glans penis (head of the penis) and the inside of the prepuce (foreskin) is mucous membrane, not skin. [source: http://www.wikipedia.org]
Multiple Primary Cancers : (1) Two or more distinct tumors in the same organ, opposite side of paired organs, or different organs, regardless of time (sitespecific issues need to be addressed, clinical input is needed). (2) Two or more abnormal growths of tissue occurring simultaneously. The neoplasms are histologically different and may be found in the same or different sites. [source: http://www.dictionarybarn.com]
NADH : Nicotinamide adenine dinucleotide (reduced form).
NADPH : Nicotinamide adenine dinucleotide phosphate (reduced form).
Necrosis : Cell death resulting from acute cellular injury; comp. apoptosis
Negative predictive value : The probability that the patient will not have the disease when restricted to all patients who test negative. [source: http://www.wikipedia.org]
neoadjuvant : added before
neoadjuvant therapy : Treatment such as chemotherapy, radiation therapy, or hormone therapy which is given before the primary treatment.
Neoplasia : Abnormal, disorganized growth in a tissue or organ, usually forming a distinct mass.
Neoplasm : A new growth of tissue serving no physiological function
Non-small cell lung cancer : Non-small cell lung cancer (NSCLC) is a heterogeneous aggregate of at least 3 distinct histologies of lung cancer including epidermoid or squamous carcinoma, adenocarcinoma, and large cell carcinoma. [source: http://www.meds.com/pdq/nonsmallcell_pro.html#22]
Noxae : plural of noxa; see: noxa.
Noxa : Something that exerts a harmful effect on the body
NPV : See: negative predicitve value
NSCLC : See: Non-small cell lung cancer
Oestrogen : Any of several steroid hormones produced chiefly by the ovaries and responsible for promoting oestrus and the development and maintenance of female secondary sex characteristics.
207
Oncogene : A gene having the potential to cause a normal cell to become cancerous; An oncogene is a modified gene that increases the malignancy of a tumor cell. Some oncogenes, usually involved in early stages of cancer development, increase the chance that a normal cell develops into a tumor cell, possibly resulting in cancer. [source: http://wikipedia.org]
pack-years : Number of cigarette packs smoked per day multiplied with number of years of smoking.
PAL : Phase Altenating Line; the principal European video norm, based on 25 fps (or 50 fields) with 625 rows.
PDT : Photodynamic therapy.
PET : See: Positron emission tomography.
Pleomorphism : The quality or state of existing in or assuming different forms.
Pneumonitis : Disease characterised by the inflammation of the lung.
Positive predictive value : The positive predictive value (sometimes abbreviated as PPV) of a test is the probability that the patient has the disease when restricted to those patients who test positive. [source: http://www.wikipedia.org]
Positron emission tomography : Tomography in which an in vivo, non-invasive, cross-sectional image of regional metabolism is obtained by and susal colour-coded CRT representation of the distribution of gamma radiation given off in the collision of electrons in cells with positrons by radionuclides incorporated into metabolic substances.
PPV : See: positive predictive value.
Pp IX : Protoporphyrin IX; an endogenously induced photosensitiser and fluorochrome.
Precision : (1) The quality or state of being precise (exactness). (2) The degree of refinement with which an operation is performed or a measurement stated. Precision in engineering and science, is the degree to which further measurements or calculations will show the same or similar results. See also: accuracy
Progesteron : A steroid hormone secreted by the corpus luteum of the ovary and by the placenta, that acts to prepare the uterus for implantation of the fertilized ovum, to maintain pregnancy, and to promote development of the mammary glands.
Proliferation : Rapid and repeated production of new parts or of offspring (as in a mass of cells by a rapid succession of cell divisions
Proteomics : The large-scale study of proteins, particularly their structures and functions. This term was coined to make an analogy with genomics.[wiki]
Proto-oncogene : A normal gene that can become an oncogene, either after mutation or increased expression.
PS : Photosensitiser.
Radioluminescence : Luminescence caused by nuclear radiation. Older "glow-in-the-dark" watches used paint with radioactive and radioluminescent material.
RGB : Red-Green-Blue; the RGB colour model is an additive (light) model in which red, green and blue are combined in various ways to reproduce other colours.
SAM : Smoking-attributable mortality.
SCC : Squamous cell carcinoma.
Scalene : (1) of, relating to, or being a scalenus muscle. (2) See: scalenus
Scalenus : Any of usally three deeply situated muscles on each side of the neck of which each extends from the transverse processes of two or more cervical vertebrae too the first or second rib.
Screening : (1) Early detection of cancer/ premalignant disease in asymptomatic persons/ persons of risk. (2) Screening, in medicine, is a strategy used to identify disease in an unsuspecting population.
208
Secretory phase : The second half of the menstrual cycle after ovulation; the corpus luteum secretes progesterone which prepares the endometrium for the implantation of an embryo; if fertilization does not occur then menstrual flow begins
Sensitivity : The proportion of those cases having a positive test result of all positive cases (e.g., people with the disease) tested.
Shot noise : The noise that results from statistical fluctuations of current carrying particles across a junction or interface.
Specificity : The proportion of true negatives of all the negative samples tested
Specular reflection : Specular reflection is the perfect, mirror-like reflection of light from a surface, in which light from a single incoming direction is reflected onto a single outgoing direction. Such behaviour is described by the law of reflection, which states that the direction of outgoing reflected light and the direction of incoming light make the same angle with respect to the surface normal; this is commonly stated as θi= θr. This is in contrast to diffuse reflection, where incoming light is reflected in all directions equally. [source: http://www.wikipedia.org]
Squamous epithelium : Epithelium consisting of one or more cell layers, the most superficial of which is composed of flat, scalelike or platelike cells. These surface cells are irregularly shaped and very flat; so flat that the cell nucleus sometimes creates a bump in the surface of the cell.
Staging :T he determinationof the extent of disease for the purpose of grouping patinets with similare levels of disease for therapeutic and prognostic guidance.
Submucosa : Supporting layer of loose connective tissue directily under a mucous membrane.
supraclavicular : situated or occuring above the clavicle.
Surveillance : Follow-up screening for new evidence of cancer in patients who have already been diagnosed with/ treated for cancer/premalignant disease
synchronous : occurring at the same time
Telomere : Either end of a chromosome; a terminal chromosome.
Thermoluminescence : Luminescence triggert by heat; it should be noted, that heat is not the primary source of excitation, only the trigger for the release of the excitation energy from another source
TIFF : Tagged image file format
Triboluminescence : Luminescence triggert by mechanical action; also refers to electroluminescence excited by electricity generated by mechanical action. Triboluminescenc can be observed in several minerals.
Tumor markers : Substances produced by malignant tumours that can be found in the blood, proteins (proteomics), antigens (genomics), enzymes. Ideally: tumour markers should always be produced by same tumour type, indication of presence of tumour and sometimes its size.
Tumour : An abnormal mass of tissue that is not inflammatrory, arises from cells of preexistent tissue, and serves no useful purpose
Tunica Propria : See: lamina propria
Ultrasonography : Ultrasound-based diagnostic imaging technique used to visualize muscles and internal organs, their size, structure and any pathological lesions, making them useful for scanning the organs. The choice of frequency is a trade-off between the image spatial resolution and the penetration depth into the patient. Typical diagnostic sonography scanners operate in the frequency range of 2 to 13 megahertz
UPA : Units Per Anno, i.e. units per year; the number of cigarette packs (units) smoked per year
US : See: utrasonography

209
Xenon lamp : Artificial source of light that use ionized xenon gas to produce a bright white light that closely mimics natural daylight.
Xenon short arc lamp : See: Xenon lamp
YPLL : Years of potential life lost

210

211
CURRICULUM VITAE
Tanja Gabrecht Address: Rue du Lac 18 A 1020 Renens (Switzerland) Personal information: Profession: Physicist Date of Birth: 3 July 1972 Marital Status: Single Nationality: German
Contacts: Office: +41(0)21/693 5769 Home: +41(0)21/634 7049 Mobile: +41(0)79/254 1955 E-mail: [email protected] [email protected]
Education Jan, 2001 until present Swiss Federal Institute of Technology (EPFL)
Lausanne, Switzerland Doctoral Thesis: “Clinical fluorescence spectroscopy and imaging for the detection of early carcinoma by autofluorescence bronchoscopy and the study of the protoporphyrin IX pharmacokinetics in the endometrium”
Oct. 1998-Feb. 2000 Swiss Federal Institute of Technology (EPFL) Lausanne, Switzerland Master Thesis in Physics: “Development and Improvement of Photodynamic Therapy and Fluorescence Detection in the Female Genital Tract and the Anogenital Region with 5-Aminolaevulinic acid and its Hexylester”
Oct. 1992-Feb.2000 University of Bielefeld Germany Master of Physics
June 1992 St. Ursula Gymnasium Arnsberg, Germany
German "Abitur
Work Experience Since January 2001 Scientific Assistant at the Swiss Federal Institute of Technoloy
(ENAC-Photomedicine Group): Clinical and pre-clinical studies in the field of early cancer detection by autofluorescence imaging.
Apr. 2000- Dec. 2000 Scientific Assistant at the University Hospital Zürich at the Department of Obstetrics and Gynecology, Zürich, Switzerland: Coordination and realisation of clinical studies for the optimisation of the instillation and irradiation conditions for photodynamic therapy in the female genital tract.
212
1990 – 1992 Freelance Activity in the Department of Design and
Engineering at the WILA Leuchten GmbH, Iserlohn (Germany): Design and maintenance of a component supplier data bank
Additional Skills Languages: German (mother tongue) English (fluent written and spoken) French (fluent spoken) Computer Skills: MS Office, very good knowledge of PowerPoint MS Windows 2000, Linux, Mac OS9 and OS X Photo and Video Editing with Adobe Photoshop and Premiere Leisure Interests: Jogging, Snowboarding, Hiking, Cooking References Prof. Hubert van den Bergh EPFL/ENAC/LPAS Station 6 CH-1015 Lausanne Phone: +41 (0)21 693 3623 [email protected] Dr. Bernd-Claus Weber Richard Wolf Endoskope GmbH Pforzheimer Strasse 32 D-75438 Knittlingen Phone: +49 (0)7043 35 149 [email protected]
Dr. Georges Wagnières EPFL/SB/ISIC-GE Station 6 CH-1015 Lausanne Phone: +41 (0)21 693 3120 [email protected] Piv.Doz. Dr. Patrice Jichlinski, MD CHUV University Hospital Departement of Urology Rue du Bugnon 46 1011 Lausanne Phone: +41 (0)21 314 2983 [email protected]
213
Publications Peer-reviewed Publications Gabrecht T, Lovisa B, Borle F, Wagnières G, "Design of an Endoscopic Optical Reference to be used for Autofluorescence Bronchoscopy with the DAFE system", submitted
Gabrecht T, Lovisa B, van den Bergh H, Wagnières G, "In-vivo Quantification of the Inter-Patient Variations of the Tissue remitted Light Intensity during Autofluorescence Bronchoscopy", submitted
Gabrecht T, Andrejevic-Blant S, Wagnières G, "Blue-violet excited Autofluorecence Spectroscopy and Imaging of Normal and Cancerous Human Bronchial Tissue after Formalin-Fixation", submitted
Gabrecht T, Radu A, Grosjean P, Weber BC, Reichle G, Freitag L, Monnier Ph, van den Bergh H, Wagnières G, "Improvement of the Specificity or Cancer Detection by Autofluorescence Imanging in the Tracheo-Bronchial Tree using backscattered Violet Light", submitted
Uehlinger P, Glanzmann Th, Ballini JP, Radu A, Gabrecht T, Monnier Ph, van den Bergh H, Wagnieres G, "Time-Resolved Autofluorescence Spectroscopy of the Bronchial Mucosa for the Detection of Early Cancer: Ex vivo and Clinical Results", submitted.
Gabrecht T, Glanzmann Th, Freitag L, Weber BC, van den Bergh H, Wagnières G, "Optimised autofluorescence spectroscopy using additional backscattered red light", submitted
Degen AF, Gabrecht T, Mosimann L, Fehr MK, Hornung R, Schwarz VA, Tadir Y, Steiner RA, Wagnieres G, Wyss P, "Photodynamic Endometrial Ablation for the Treatment of Dysfunctional Uterine Bleeding: A Preliminary Report",Lasers in Surgery and Medicine, Vol. 34 (1), 2004, pp. 1-4
Ludicke F, Berclaz L, Major AL, Gabrecht T, Lange N, Wagnieres G, van den Bergh H, Major AL, "Photodynamic diagnosis of ovarian cancer using hexaminolaevulinate: A preclinical study",British Journal of Cancer, Vol. 88 (11), 2003, pp. 1780-1784
Felley C, Jornod P, Dorta G, Stepinac T, Lange N, Gabrecht T, van den Bergh H, Wagnieres G, Fontolliet C, Grosjean P, Monnier Ph, VanMelle G, "Endoscopic fluorescence detection of intraepithelial neoplasia in Barrett's esophagus after oral administration of aminolevulinic acid",Endoscopy, Vol. 35 (8) 2003, pp. 663-668 Non-reviewed Publications T. Gabrecht, P. Uehlinger, S. Andrejevic, P. Grosjean, A. Radu, Ph. Monnier, B.-C. Weber, H. van den Bergh, G. Wagnieres, "Influence of the excitation wavelength on the Tumor-to-Healthy Contrast in Autofluorescence Bronchoscopy - A Comprehensive Study", Proc SPIE, 5862, 2005.
Gabrecht T, Glanzmann Th, van den Bergh H, Wagnieres G, Freitag L, Grosjean P, Monnier P, Weber B, "Optimization of the spectral design used to detect early carcinoma in the human tracheo-bronchial tree by autofluorescence imaging", Proceedings of SPIE, Vol. 5141, 2003, pp. 1-7
Glanzmann TM, Uehlinger P, Ballini JP, Radu A, Gabrecht T, Monnier P, van den Bergh H, Wagnieres G, "Time-resolved autofluorescence spectroscopy of the bronchial mucosa for the detection of early cancer: Clinical results", Proceedings of SPIE, Vol. 4432, 2001, pp. 199-209

214
Goujon D, Glanzmann T, Gabrecht T, Zellweger M, Radu A, van den Bergh H, Monnier P, Wagnieres G, "Detection of early bronchial carcinoma by imaging of the tissue autofluorescence", Proceedings of SPIE, Vol. 4432, 2001, pp. 131-138
Works Gabrecht T, "Development and improvement of photodynamic therapy and fluorescence detection in the female genital tract and the anogenital region with 5-Aminolaevulinic acid and its hexylester", Master Thesis, Physics Department, University of Bielefeld (Germany) and Depart. for Rural Engeneering, Swiss Federal Institute of Technology, Lausanne, 2000 Oral Presentations Gabrecht T, Andrejevic-Blant S, Uehlinger P, Radu A, Grosjean P, Monnier Ph, van den Bergh H, Wagnières g, "Comprehensive Study of the Phenomenological Mechanisms involved in Autofluorescence Bronchoscopy" European Conference on Biomedical Optics (ECBO) 2005, June 2005, Munich (Germany)
Gabrecht T, Glanzmann Th, Freitag L, Grosjean P, Weber B, Monnier Ph, van den Bergh H, Wagnières G., "Optimization of the spectral design used to detect early carcinoma in the human tracheo-bronchial tree by autofluorescence imaging", European Conference on Biomedical Optics (ECBO) 2003, June 2002, Munich (Germany)
Gabrecht T, Glanzmann Th, Freitag L, Weber B, van den Bergh H, Wagnières G, "Détection du cancer bronchique par l’endoscopie à fluorescence – comparaison de différents types d’excitation", Diagnostic et Imagerie Optique en Médecine/Biologie OptDiag 2002, May 2002, Paris (France)
Poster Presentations Gabrecht T, Schwarz V, Degen A, Mosimann L, Wagnières G, Fehr M, van den Bergh H, Haller U, Wyss P, "In vivo fluorescence measurements for evaluation of the pharmacokinetic of ALA-induced protoporphyrin IX in the endometrium", Annual assembly of the Suisse Society for Gynecology and Obstetrics (SGGG) 2000, September 2000, Lugano (Switzerland) Patents German Patent Application DE10305599, Biological tissue diagnosic device, filed on August 26th 2004, by van den Bergh H., Glanzmann Th., Wagnières G., Pereira-Delgado N., Weber B.C., Dolt M., Eidner Ph., Goll Th., Gabrecht T., Mueller St.; European Application EP1447043 (A1)
German Patent Application DE10201005, Device for diagnostic imaging of tissues, filed October 2nd 2003, by Wagnières G., van den Bergh H., Glanzmann Th., Pereira-Delgado N., Weber B.-C., Goll Th., Eidner Ph., Gabrecht T., Mueller St., Schmidt O.; European Applications EP1327414 (A2) and EP1327414 (A3)
German Patent Application DE10153900, Device for the picture-providing diagnosis of tissue, filed June 6th 2003, by van den Bergh H., Wagnières G., Glanzmann Th., Pereira-Delgado N., Weber B.-C., Goll Th., Eidner Ph., Gabrecht T., Mueller St., Schmidt O.; European Application EP1308122 (A1)