clinical commissioning group: nhs haringey · pdf fileclinical commissioning group: nhs...
TRANSCRIPT
Commissioning for value focus pack
Clinical commissioning group
Focus area
Cardiovascular disease (CVD) pathway
NHS HARINGEY CCG
December 2014
Version 3 PHE publications gateway number 2014600
Conte
nts
1 Background and context
bull About the packs
bull Packs as part of transformation process what and how to change
2 Methodology
3 Summary messages
4 Analysis
bull Analysis by pathway stage
bull Local data bringing it all together
5 Annexes
bull Annexe 1 Detailed indicator spine charts
bull Annexe 2 CCG benchmarks
bull Annexe 3 Statistical methodology
bull Annexe 4 Data sources
bull Annexe 5 Glossary
Contents
2 This document is valid only when viewed via the internet If it is printed into hard copy or saved to another location you must first check that the version
number on your copy matches that of the one online Printed copies are uncontrolled copies
Backgro
und
bull This focus pack or deep dive looks at an agreed programme area (CVD) to
understand variation and improve the value of commissioned services across
the pathway
bull Commissioning for value insight packs were produced for every Clinical
Commissioning Group (CCG) in autumn 2013 by Public Health England
(PHE) NHS England and NHS Right Care These packs identified programme
areas with potential opportunities for improving outcome quality and efficiency
at CCG level for the ten areas of programme expenditure with the highest
spend These are available at
wwwenglandnhsukresourcesresources-for-ccgscomm-for-value
bull This CVD focus pack is available in two formats
‒ a downloadable PDF providing national benchmarked data for heart and
stroke together with a summary of key messages wwwncvinorguk
‒ an unbranded PowerPoint slide set that is available to CCGs on request to
add additional local information and comment Email the National
Cardiovascular Intelligence Network (NCVIN) to ask for a pack
ncvinphegovuk
About the packs
3
Backgro
und
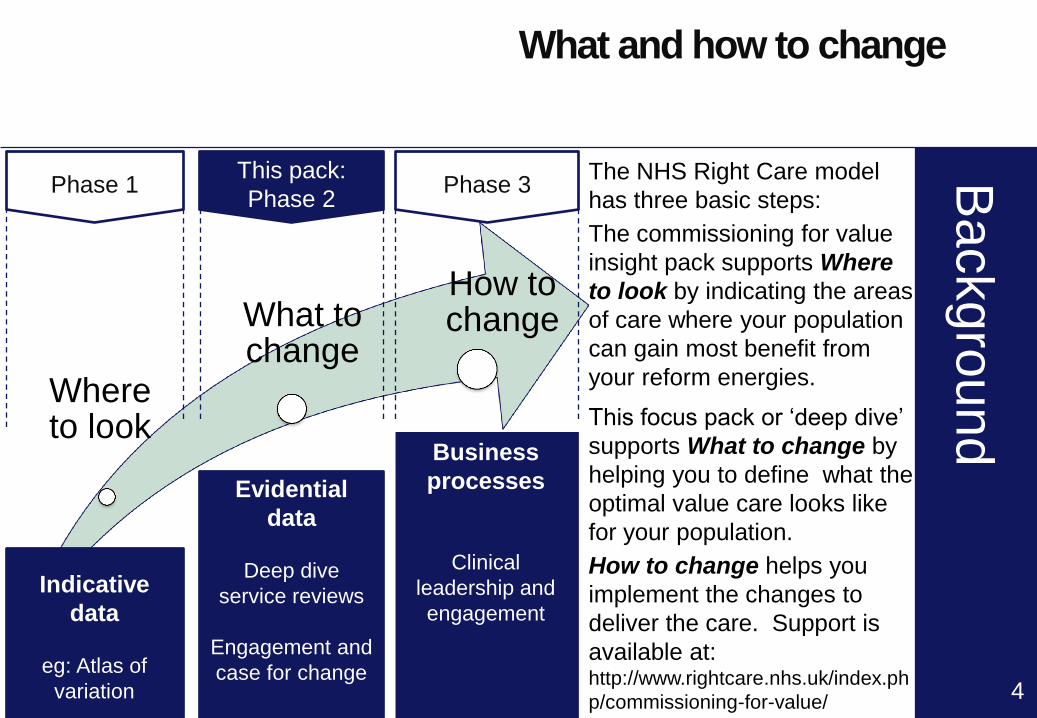
Where to look
What to change
How to change
Phase 1 This pack
Phase 2 Phase 3
The NHS Right Care model
has three basic steps
The commissioning for value
insight pack supports Where
to look by indicating the areas
of care where your population
can gain most benefit from
your reform energies
This focus pack or lsquodeep diversquo
supports What to change by
helping you to define what the
optimal value care looks like
for your population
How to change helps you
implement the changes to
deliver the care Support is
available at httpwwwrightcarenhsukindexph
pcommissioning-for-value
Indicative
data
eg Atlas of
variation
Evidential
data
Deep dive
service reviews
Engagement and
case for change
Business
processes
Clinical
leadership and
engagement
What and how to change
4
Meth
odolo
gy
Methodology used to
produce this pack
5
Analysed a wide range of indicators from across the pathway focussing on spend quality
and outcomes
bull Identified lsquocluster groupsrsquo of 10 CCGs with similar characteristics to the CCG (see slide
21)
bull Analysed wide range of national data to identify indicators where the CCG is below a
benchmark value in its cluster group for that indicator and thus has an opportunity to
improve
bull Identified indicators where the CCG is in the worst quintile within its cluster for that
indicator (see slide 22 for more information on methodology)
Identified key opportunities for value improvement and quantified potential impact
bull Quantified opportunity for the CCG if indicators below the benchmark were moved to
the benchmark
bull Quantification does not mean that the lsquosavingrsquo or improvement can actually be made
but may answer the question lsquoIs it going to be worth focussing on this arearsquo
Identified evidence based guidance quality standards and performance metrics for
people providing and commissioning health public health and social care services for the
prevention and management of CVD related conditions For more information see slide
15
Sum
mary
on a
page
Summary
overarching messages
6
Overarching messages for the CCG
Significant benefit to patients if improvement to primary care management
indicators were made
High cost for CVD elective admissions (male) CHD elective admissions (male)
angiography procedures (male)
High number of admissions for stroke emergency admissions (male) heart failure
emergency admissions
High length of stay for CVD elective admissions
Low percentage of stroke patients discharged to usual place of residence
Note 1 these opportunities represent indicators that are in the worst quintile of their cluster group Other opportunities may also be available These can
be found in Annexe 1
Note 2 opportunities highlight areas for further investigation as variation may reflect genuine differences due to local demography and service provision
Not all opportunities therefore may be achievable See indicator guide for further information on how the indicators were calculated
Sum
mary
Summary
prevention and prevalence
7
Prevention
4 out of 5 prevention indicators are worse than the benchmark
There are no indicators in the worst quintile
Prevalence
3 out of 3 of the observed to expected prevalence ratios are worse than the
benchmark
The prevalence in 5 disease groups out of 7 are higher than the benchmark
Note 3 These packs use two types of prevalence indicator The observed prevalence diagnosed on practice registers and the ratio of observed to
expected prevalence The expected prevalence is a modelled estimate of total prevalence (diagnosed and undiagnosed) which uses the characteristics
of the population to estimate the expected total prevalence of disease in that population A low ratio may indicate a higher level of undiagnosed cases of
disease and therefore unmet need
Sum
mary
Summary
primary care
8
Primary care
26 out of 27 primary care indicators are worse than the benchmark
QOF indicators have been used but exceptions have been included in the
denominator
12 indicators are in the worst quintile The ten with the biggest potential benefits
to patients based on achieving the benchmark are shown
hypertension patients last BP lt 15090 (822 more people)
hypertension patients lt= 79 years BP lt 14090 (821 more people)
stroke patients record of cholesterol (113 more people)
CHD patients last BP lt15090 (103 more people)
AF amp CHADS2 score gt1 anti-coagulation drug therapy (80 more people)
CHD patients alternative anti-platelet therapy taken (77 more people)
stroke patients BP lt15090 (71 more people)
stroke patients referred for further investigation (60 more people)
PAD patients record aspirin or anti-platelet taken (49 more people)
stroke patients with a record of anti-platelet agent (38 more people)
Note 4 For full QOF names see indicator guide
Sum
mary
Summary
secondary care
Secondary care
38 out of 54 secondary care indicators are worse than the benchmark
8 indicators are in the worst quintile The three in terms of money and the five
with the biggest potential savings in terms of admissionsprocedures are listed
below the potential savings based on achieving the benchmark are shown in
brackets
-CVD average cost per male elective admission (pound155K)
-Angiography procedures male average cost (pound145K)
-CHD average cost per male elective admission (pound122K)
-CVD average female elective LOS (616 fewer bed days)
-CVD average male elective LOS (443 fewer bed days)
-Heart failure male emergency admissions (DSR) (55 fewer admissions)
-Stroke male emergency admissions (DSR) (39 fewer admissions)
-Heart failure female emergency admissions (DSR) (38 fewer admissions)
9 Note 5 CCG length of stay averages may be influenced by extreme values Further analysis may be needed to determine achievability of any related
opportunity
Note 6 CABG indicators may be based on small numbers Caution is advised on the use of these indicators
Sum
mary
Summary
social care
10
Social care
1 out of 1 social care indicators are worse than the benchmark
1 indicator is in the worst quintile
of stroke patients discharged to usual place of residence is in the worst
quintile If the CCG were to reach the benchmark then there could be 54 more
stroke patients discharged to their usual place of residence
Analy
sis
Where does the CCG compare
poorly against its cluster group
Analysis by pathway stage (page 1 of 2)
11
Table1
below a benchmark value equal to the average of the top 5 ranked CCG values in their cluster group
Number of Indicators
where CCG has room
for improvement
Indicators in the worst quintile versus benchmark group - difference
between the CCG and the benchmark
Opportunity - if the CCG were
to equal the benchmark
No indicators in the worst quintile No indicators in the worst quintile
CHD ratio (-249 lower) 1570 people
Stroke ratio (-283 lower) 971 people
AF amp CHADS2 score of 1 anti-coagplatelet drug therapy (-24 lower) 9 people
AF amp CHADS2 score gt1 anti-coagulation drug therapy (-103 lower) 80 people
CHD patients last BP lt15090 (-24 lower) 103 people
CHD patients alternative anti-platelet therapy taken (-18 lower) 77 people
HF patients confirmed by echocardiogram (-34 lower) 30 people
hypertension patients last BP lt 15090 (-34 lower) 822 people
hypertension patients lt= 79 years BP lt 14090 (-44 lower) 821 people
stroke patients referred for further investigation (-58 lower) 60 people
stroke patients BP lt15090 (-33 lower) 71 people
stroke patients record of cholesterol (-54 lower) 113 people
stroke patients with a record of anti-platelet agent (-31 lower) 38 people
PAD patients record aspirin or anti-platelet taken (-66 lower) 49 people
45 prevention indicators
33 observed to expected
prevalence ratios
2627 primary care
indicators
Analy
sis
Analysis by pathway stage (page 2 of 2)
12
Table2
Where does the CCG compare
poorly against its cluster group
below a benchmark value equal to the average of the top 5 ranked CCG values in their cluster group
Number of Indicators
where CCG has room
for improvement
Indicators in the worst quintile versus benchmark group - difference
between the CCG and the benchmark
Opportunity - if the CCG were
to equal the benchmark
CVD average cost per male elective admission (125 higher) pound155K
CHD average cost per male elective admission (26 higher) pound122K
Stroke male emergency admissions (DSR) (321 higher) 39 admissions
Heart failure male emergency admissions (DSR) (53 higher) 55 admissions
Heart failure female emergency admissions (DSR) (378 higher) 38 admissions
CVD average male elective LOS (431 higher) 443 bed days
CVD average female elective LOS (898 higher) 616 bed days
Angiography procedures male average cost (199 higher) pound145K
11 social care indicators of stroke patients discharged to usual place of residence (-17868 lower) 54 patients
3854 secondary care
indicators
Analy
sis
Where to focus understanding practice variation
bull The NCVIN can provide practice level data for CCGs on request
ncvinphegovuk This will allow CCGs to better understand practice
variation Practices are clustered with other practices across the country with
similar populations The practice is then compared with the other practices
within that cluster for all the indicators where the data is available at practice
level
bull This information is not presented routinely in these packs as CCGs will want to
use it sensitively as the basis of a discussion with practices to better
understand the reasons for variation and the reduction of variation not
explained by clinical need
13
Analy
sis
Where to focus
adding local data
An unbranded power point slide set is available to CCGs on request to add additional
local information and comment These can be requested through the NCVIN
ncvinphegovuk
CCGs may want to consider adding local intelligence to triangulate with the intelligence in this pack This may include
bull Up to date intelligence from providers
bull Contract monitoring data
bull Local prescribing data
bull Joint Strategic Needs Assessment (JSNA)
bull Preventative activity commissioned by local authorities
bull Data on inequalities
Local data can be particularly useful when
bull Testing the size of the opportunities identified from the national data in this
pack
bull Linking to identified needs of the population
bull Testing whether plans introduced since this data was collected have worked
bull Testing whether commissioned services are accessed by those in greatest
need
14
Analy
sis
Bring it all together what works what could work
who should we speak to
15
NICE Guidance Quality Standards etc
Prevention of cardiovascular disease
Hypertension
Atrial fibrillation
Stroke
Chronic heart failure
Lipid modification
Myocardial infarction with ST segment elevation
Lower limb peripheral arterial disease
Smoking prevention and cessation
Obesity
Physical activity
Contact the NICE field team for
support and advice on
implementing NICE guidance
The quality and productivity
collection provides quality
assured examples of
improvements across NHS and
social care and include
cardiovascular and stroke
Look at NICE shared learning
examples from organisations
that have put guidance into
practice Examples include
peripheral arterial disease
hypertension and obesity
Annexes
Annexe 1 spine charts
16
Prevention
Prevalence
England worst England best
Worst quintile in cluster Key
For data sources used see slide 23
Worse outcome High prevalence Better outcome Low prevalence Opportunity
See indicator guide for methodology used to calculate the indicators
Percentage of adults with low levels of physical activity
Percentage of adults classified as overweight or obese
Estimated prevalence of adult healthy eating
Smoking prevalence
Estimated percentage of binge drinkers 4756 people8219 people-12374 people3373 people
CVD prevention register
Atrial fibrillation
Peripheral arterial disease
Heart Failure
Hypertension observed to expected prevalence ratio
Hypertension
Stroke observed to expected prevalence ratio
Stroke
CHD observed to expected prevalence ratio
CHD 75 people1570 people-971 people2403 people5096 people125 people28 people-421 people
Annexes
Annexe 1 spine charts
17
For data sources used see slide 23
England worst England best
Worst quintile in cluster Key
Worse outcome Better outcome Opportunity Primary care
See indicator guide for methodology used to calculate the indicators
PAD patients record aspirin or anti-platelet taken PAD patients total cholesterol lt 5 mmoll
PAD patients BP lt 15090 hypertension patients given lifestyle advice
new hypertension CVD risk assessment treated statins stroke patients with a record of anti-platelet agent
stroke patients influenza immunisation stroke patients total cholesterol lt 5mmoll
stroke patients record of cholesterol stroke patients BP lt15090
stroke patients referred for further investigation hypertension patients lt75 years brief intervention
hypertension patients lt75 years physical activity assessment hypertension patients lt= 79 years BP lt 14090
hypertension patients last BP lt 15090 patients gt= 40 who have a record of BP
HF patients due to LVSD treated with ACE-I or ARB and BB HF patients due to LVSD treated with ACE-I or ARB
HF patients confirmed by echocardiogram MI patients treated with ACE-I Anti-platelet BB statin
CHD patients alternative anti-platelet therapy taken CHD patients influenza immunisation
CHD patients total cholesterol lt 5mmoll CHD patients last BP lt15090
AF amp CHADS2 score gt1 anti-coagulation drug therapyAF amp CHADS2 score of 1 anti-coagplatelet drug therapy
AF patients stroke risk assessed using CHADS2 18 people9 people80 people103 people116 people79 people77 people13 people30 people1 person2 people1174 people822 people821 people199 people93 people60 people71 people113 people20 people61 people38 people-136 people21 people31 people49 people
Annexes
Annexe 1 spine charts
18
For data sources used see slide 23
England worst England best
Worst quintile in cluster Key
Worse outcome Better outcome Opportunity Secondary care
See indicator guide for methodology used to calculate the indicators
CHD average female elective LOSCHD average male elective LOS
CHD female elective admissions (DSR)CHD male elective admissions (DSR)
CHD average cost per female elective admissionCHD average cost per male elective admission
CHD average female emergency LOSCHD average male emergency LOS
CHD female emergency admissions (DSR)CHD male emergency admissions (DSR)
CHD average cost per female emergency admissionCHD average cost per male emergency admission
CVD average female elective LOSCVD average male elective LOS
CVD female elective admissions (DSR)CVD male elective admissions (DSR)
CVD average cost per female elective admissionCVD average cost per male elective admission
CVD average female emergency LOSCVD average male emergency LOS
CVD female emergency admissions (DSR)CVD male emergency admissions (DSR)
CVD average cost per female emergency admissionCVD average cost per male emergency admission -
-125 admissions64 admissions--pound155K pound22K --443 bed days616 bed days--54 admissions25 admissions-42 bed dayspound122K pound4K -15 admissions
110 bed days41 bed days
Annexes
Annexe 1 spine charts
19
For data sources used see slide 23
England worst England best
Worst quintile in cluster Key
Secondary care continued Worse outcome Better outcome Opportunity
See indicator guide for methodology used to calculate the indicators
CABG procedures female (LOS)CABG procedures male (LOS)
CABG procedures female (DSR)CABG procedures male (DSR)
CABG procedures female average costCABG procedures male average cost
Angioplasty procedures female LOSAngioplasty procedures male LOS
Angioplasty procedures female (DSR)Angioplasty procedures male (DSR)
Angioplasty procedures female average costAngioplasty procedures male average cost
Angiography procedures female LOSAngiography procedures male LOS
Angiography procedures female (DSR)Angiography procedures male (DSR)
Angiography procedures female average costAngiography procedures male average cost pound145K
pound20K 3 procedures68 procedures--pound15K pound1K --2 bed days-pound20K pound5K 12 procedureslt1 procedure76 bed days17 bed days
Annexes
Annexe 1 spine charts
20
Social care
For data sources used see slide 23
England worst England best
Worst quintile in cluster Key
Worse outcome Better outcome Opportunity Secondary care continued
See indicator guide for methodology used to calculate the indicators
Heart Failure average female emergency LOS
Heart Failure average male emergency LOS
Heart Failure Female emergency admissions (DSR)
Heart Failure male emergency admissions (DSR)
Heart Failure average cost per female emergency admission
Heart Failure average cost per male emergency admission
Stroke average female emergency LOS
Stroke average male emergency LOS
Stroke female emergency admissions (DSR)
Stroke male emergency admissions (DSR)
Stroke average cost per female emergency admission
Stroke average cost per male emergency admission pound28K pound11K 39 admissions27 admissions-162 bed dayspound14K pound8K 55 admissions38 admissions23 bed days16 bed days
stroke patients discharged usual residence 54 patients
Annexes
Annexe 2 similar CCGs
21
The 10 most similar CCGs to NHS HARINGEY CCG are
NHS GREENWICH CCG
NHS CROYDON CCG
NHS LEWISHAM CCG
NHS WALTHAM FOREST CCG
NHS ENFIELD CCG
NHS BRENT CCG
NHS CITY AND HACKNEY CCG
NHS ISLINGTON CCG
NHS WANDSWORTH CCG
NHS BARKING AND DAGENHAM CCG
For information on the methodology used to calculate the 10 most similar CCGS
please go to
httpwwwenglandnhsukresourcesresources-for-ccgscomm-for-value
Annexes
Annexe 3 Statistical methodology
22
Statistical methodology
The methodology used in this pack consisted of the following steps
For each indicator
bull Data were ranked within the cluster
bull A benchmark value was calculated as the average of the top 5 ranked CCG
values
bull The opportunity that could be gained if the CCG were to improve to the
benchmark value was calculated
bull The worst quintile was identified as the worst 2 ranked values
bull If the indicator lay in the worst quintile then it was highlighted as a potential area
for investigation
For more information see indicator guide
This is a non-parametric statistical approach which was designed to be easy to
understand and interpret While the comparison does not necessarily prove
statistical significance it does provide a robust indication of the most promising
areas for further investigation
Annexes
Annexe 4 Data sources
23
Data sources used
bull Quality and Outcomes Framework (QOF) 201314 Copyright copy 2014 Re-
used with the permission of the Health and Social Care Information Centre
All rights reserved
bull Number of Patients registered at a GP practice ndash April 2013 Copyright copy
2014 Re-used with the permission of the Health and Social Care
Information Centre All rights reserved
bull Modelled estimates of prevalence December 2011 East of England Public
Health Observatory
bull Mid-2012 Population Estimates for Clinical Commissioning Groups Office
for National Statistics (ONS) copy Crown Copyright 2014
bull Hospital Episode Statistics (HES) 201213 Copyright copy 2014 Re‐used
with the permission of The Health and Social Care Information Centre All
rights reserved
bull Model-based estimates (based on Health Survey for England) 2006-08 and
200708
bull Integrated Household Survey 2012
bull Active people survey Sport England 2012
Annexes
Annexe 5 Glossary
24
AF Atrial fibrillation
BP Blood pressure
CABG Coronary artery bypass graft
CCG Clinical Commissioning Group
CHADS2 A method of calculating the risk of stroke in patients
with atrial fibrillation (AF)
CHD Coronary heart disease
CVD Cardiovascular disease
DSR Directly standardised rate
LOS Length of stay
LVSD Left ventricular systolic dysfunction
PAD Peripheral Arterial Disease
QOF Quality Outcomes Framework
Conte
nts
1 Background and context
bull About the packs
bull Packs as part of transformation process what and how to change
2 Methodology
3 Summary messages
4 Analysis
bull Analysis by pathway stage
bull Local data bringing it all together
5 Annexes
bull Annexe 1 Detailed indicator spine charts
bull Annexe 2 CCG benchmarks
bull Annexe 3 Statistical methodology
bull Annexe 4 Data sources
bull Annexe 5 Glossary
Contents
2 This document is valid only when viewed via the internet If it is printed into hard copy or saved to another location you must first check that the version
number on your copy matches that of the one online Printed copies are uncontrolled copies
Backgro
und
bull This focus pack or deep dive looks at an agreed programme area (CVD) to
understand variation and improve the value of commissioned services across
the pathway
bull Commissioning for value insight packs were produced for every Clinical
Commissioning Group (CCG) in autumn 2013 by Public Health England
(PHE) NHS England and NHS Right Care These packs identified programme
areas with potential opportunities for improving outcome quality and efficiency
at CCG level for the ten areas of programme expenditure with the highest
spend These are available at
wwwenglandnhsukresourcesresources-for-ccgscomm-for-value
bull This CVD focus pack is available in two formats
‒ a downloadable PDF providing national benchmarked data for heart and
stroke together with a summary of key messages wwwncvinorguk
‒ an unbranded PowerPoint slide set that is available to CCGs on request to
add additional local information and comment Email the National
Cardiovascular Intelligence Network (NCVIN) to ask for a pack
ncvinphegovuk
About the packs
3
Backgro
und
Where to look
What to change
How to change
Phase 1 This pack
Phase 2 Phase 3
The NHS Right Care model
has three basic steps
The commissioning for value
insight pack supports Where
to look by indicating the areas
of care where your population
can gain most benefit from
your reform energies
This focus pack or lsquodeep diversquo
supports What to change by
helping you to define what the
optimal value care looks like
for your population
How to change helps you
implement the changes to
deliver the care Support is
available at httpwwwrightcarenhsukindexph
pcommissioning-for-value
Indicative
data
eg Atlas of
variation
Evidential
data
Deep dive
service reviews
Engagement and
case for change
Business
processes
Clinical
leadership and
engagement
What and how to change
4
Meth
odolo
gy
Methodology used to
produce this pack
5
Analysed a wide range of indicators from across the pathway focussing on spend quality
and outcomes
bull Identified lsquocluster groupsrsquo of 10 CCGs with similar characteristics to the CCG (see slide
21)
bull Analysed wide range of national data to identify indicators where the CCG is below a
benchmark value in its cluster group for that indicator and thus has an opportunity to
improve
bull Identified indicators where the CCG is in the worst quintile within its cluster for that
indicator (see slide 22 for more information on methodology)
Identified key opportunities for value improvement and quantified potential impact
bull Quantified opportunity for the CCG if indicators below the benchmark were moved to
the benchmark
bull Quantification does not mean that the lsquosavingrsquo or improvement can actually be made
but may answer the question lsquoIs it going to be worth focussing on this arearsquo
Identified evidence based guidance quality standards and performance metrics for
people providing and commissioning health public health and social care services for the
prevention and management of CVD related conditions For more information see slide
15
Sum
mary
on a
page
Summary
overarching messages
6
Overarching messages for the CCG
Significant benefit to patients if improvement to primary care management
indicators were made
High cost for CVD elective admissions (male) CHD elective admissions (male)
angiography procedures (male)
High number of admissions for stroke emergency admissions (male) heart failure
emergency admissions
High length of stay for CVD elective admissions
Low percentage of stroke patients discharged to usual place of residence
Note 1 these opportunities represent indicators that are in the worst quintile of their cluster group Other opportunities may also be available These can
be found in Annexe 1
Note 2 opportunities highlight areas for further investigation as variation may reflect genuine differences due to local demography and service provision
Not all opportunities therefore may be achievable See indicator guide for further information on how the indicators were calculated
Sum
mary
Summary
prevention and prevalence
7
Prevention
4 out of 5 prevention indicators are worse than the benchmark
There are no indicators in the worst quintile
Prevalence
3 out of 3 of the observed to expected prevalence ratios are worse than the
benchmark
The prevalence in 5 disease groups out of 7 are higher than the benchmark
Note 3 These packs use two types of prevalence indicator The observed prevalence diagnosed on practice registers and the ratio of observed to
expected prevalence The expected prevalence is a modelled estimate of total prevalence (diagnosed and undiagnosed) which uses the characteristics
of the population to estimate the expected total prevalence of disease in that population A low ratio may indicate a higher level of undiagnosed cases of
disease and therefore unmet need
Sum
mary
Summary
primary care
8
Primary care
26 out of 27 primary care indicators are worse than the benchmark
QOF indicators have been used but exceptions have been included in the
denominator
12 indicators are in the worst quintile The ten with the biggest potential benefits
to patients based on achieving the benchmark are shown
hypertension patients last BP lt 15090 (822 more people)
hypertension patients lt= 79 years BP lt 14090 (821 more people)
stroke patients record of cholesterol (113 more people)
CHD patients last BP lt15090 (103 more people)
AF amp CHADS2 score gt1 anti-coagulation drug therapy (80 more people)
CHD patients alternative anti-platelet therapy taken (77 more people)
stroke patients BP lt15090 (71 more people)
stroke patients referred for further investigation (60 more people)
PAD patients record aspirin or anti-platelet taken (49 more people)
stroke patients with a record of anti-platelet agent (38 more people)
Note 4 For full QOF names see indicator guide
Sum
mary
Summary
secondary care
Secondary care
38 out of 54 secondary care indicators are worse than the benchmark
8 indicators are in the worst quintile The three in terms of money and the five
with the biggest potential savings in terms of admissionsprocedures are listed
below the potential savings based on achieving the benchmark are shown in
brackets
-CVD average cost per male elective admission (pound155K)
-Angiography procedures male average cost (pound145K)
-CHD average cost per male elective admission (pound122K)
-CVD average female elective LOS (616 fewer bed days)
-CVD average male elective LOS (443 fewer bed days)
-Heart failure male emergency admissions (DSR) (55 fewer admissions)
-Stroke male emergency admissions (DSR) (39 fewer admissions)
-Heart failure female emergency admissions (DSR) (38 fewer admissions)
9 Note 5 CCG length of stay averages may be influenced by extreme values Further analysis may be needed to determine achievability of any related
opportunity
Note 6 CABG indicators may be based on small numbers Caution is advised on the use of these indicators
Sum
mary
Summary
social care
10
Social care
1 out of 1 social care indicators are worse than the benchmark
1 indicator is in the worst quintile
of stroke patients discharged to usual place of residence is in the worst
quintile If the CCG were to reach the benchmark then there could be 54 more
stroke patients discharged to their usual place of residence
Analy
sis
Where does the CCG compare
poorly against its cluster group
Analysis by pathway stage (page 1 of 2)
11
Table1
below a benchmark value equal to the average of the top 5 ranked CCG values in their cluster group
Number of Indicators
where CCG has room
for improvement
Indicators in the worst quintile versus benchmark group - difference
between the CCG and the benchmark
Opportunity - if the CCG were
to equal the benchmark
No indicators in the worst quintile No indicators in the worst quintile
CHD ratio (-249 lower) 1570 people
Stroke ratio (-283 lower) 971 people
AF amp CHADS2 score of 1 anti-coagplatelet drug therapy (-24 lower) 9 people
AF amp CHADS2 score gt1 anti-coagulation drug therapy (-103 lower) 80 people
CHD patients last BP lt15090 (-24 lower) 103 people
CHD patients alternative anti-platelet therapy taken (-18 lower) 77 people
HF patients confirmed by echocardiogram (-34 lower) 30 people
hypertension patients last BP lt 15090 (-34 lower) 822 people
hypertension patients lt= 79 years BP lt 14090 (-44 lower) 821 people
stroke patients referred for further investigation (-58 lower) 60 people
stroke patients BP lt15090 (-33 lower) 71 people
stroke patients record of cholesterol (-54 lower) 113 people
stroke patients with a record of anti-platelet agent (-31 lower) 38 people
PAD patients record aspirin or anti-platelet taken (-66 lower) 49 people
45 prevention indicators
33 observed to expected
prevalence ratios
2627 primary care
indicators
Analy
sis
Analysis by pathway stage (page 2 of 2)
12
Table2
Where does the CCG compare
poorly against its cluster group
below a benchmark value equal to the average of the top 5 ranked CCG values in their cluster group
Number of Indicators
where CCG has room
for improvement
Indicators in the worst quintile versus benchmark group - difference
between the CCG and the benchmark
Opportunity - if the CCG were
to equal the benchmark
CVD average cost per male elective admission (125 higher) pound155K
CHD average cost per male elective admission (26 higher) pound122K
Stroke male emergency admissions (DSR) (321 higher) 39 admissions
Heart failure male emergency admissions (DSR) (53 higher) 55 admissions
Heart failure female emergency admissions (DSR) (378 higher) 38 admissions
CVD average male elective LOS (431 higher) 443 bed days
CVD average female elective LOS (898 higher) 616 bed days
Angiography procedures male average cost (199 higher) pound145K
11 social care indicators of stroke patients discharged to usual place of residence (-17868 lower) 54 patients
3854 secondary care
indicators
Analy
sis
Where to focus understanding practice variation
bull The NCVIN can provide practice level data for CCGs on request
ncvinphegovuk This will allow CCGs to better understand practice
variation Practices are clustered with other practices across the country with
similar populations The practice is then compared with the other practices
within that cluster for all the indicators where the data is available at practice
level
bull This information is not presented routinely in these packs as CCGs will want to
use it sensitively as the basis of a discussion with practices to better
understand the reasons for variation and the reduction of variation not
explained by clinical need
13
Analy
sis
Where to focus
adding local data
An unbranded power point slide set is available to CCGs on request to add additional
local information and comment These can be requested through the NCVIN
ncvinphegovuk
CCGs may want to consider adding local intelligence to triangulate with the intelligence in this pack This may include
bull Up to date intelligence from providers
bull Contract monitoring data
bull Local prescribing data
bull Joint Strategic Needs Assessment (JSNA)
bull Preventative activity commissioned by local authorities
bull Data on inequalities
Local data can be particularly useful when
bull Testing the size of the opportunities identified from the national data in this
pack
bull Linking to identified needs of the population
bull Testing whether plans introduced since this data was collected have worked
bull Testing whether commissioned services are accessed by those in greatest
need
14
Analy
sis
Bring it all together what works what could work
who should we speak to
15
NICE Guidance Quality Standards etc
Prevention of cardiovascular disease
Hypertension
Atrial fibrillation
Stroke
Chronic heart failure
Lipid modification
Myocardial infarction with ST segment elevation
Lower limb peripheral arterial disease
Smoking prevention and cessation
Obesity
Physical activity
Contact the NICE field team for
support and advice on
implementing NICE guidance
The quality and productivity
collection provides quality
assured examples of
improvements across NHS and
social care and include
cardiovascular and stroke
Look at NICE shared learning
examples from organisations
that have put guidance into
practice Examples include
peripheral arterial disease
hypertension and obesity
Annexes
Annexe 1 spine charts
16
Prevention
Prevalence
England worst England best
Worst quintile in cluster Key
For data sources used see slide 23
Worse outcome High prevalence Better outcome Low prevalence Opportunity
See indicator guide for methodology used to calculate the indicators
Percentage of adults with low levels of physical activity
Percentage of adults classified as overweight or obese
Estimated prevalence of adult healthy eating
Smoking prevalence
Estimated percentage of binge drinkers 4756 people8219 people-12374 people3373 people
CVD prevention register
Atrial fibrillation
Peripheral arterial disease
Heart Failure
Hypertension observed to expected prevalence ratio
Hypertension
Stroke observed to expected prevalence ratio
Stroke
CHD observed to expected prevalence ratio
CHD 75 people1570 people-971 people2403 people5096 people125 people28 people-421 people
Annexes
Annexe 1 spine charts
17
For data sources used see slide 23
England worst England best
Worst quintile in cluster Key
Worse outcome Better outcome Opportunity Primary care
See indicator guide for methodology used to calculate the indicators
PAD patients record aspirin or anti-platelet taken PAD patients total cholesterol lt 5 mmoll
PAD patients BP lt 15090 hypertension patients given lifestyle advice
new hypertension CVD risk assessment treated statins stroke patients with a record of anti-platelet agent
stroke patients influenza immunisation stroke patients total cholesterol lt 5mmoll
stroke patients record of cholesterol stroke patients BP lt15090
stroke patients referred for further investigation hypertension patients lt75 years brief intervention
hypertension patients lt75 years physical activity assessment hypertension patients lt= 79 years BP lt 14090
hypertension patients last BP lt 15090 patients gt= 40 who have a record of BP
HF patients due to LVSD treated with ACE-I or ARB and BB HF patients due to LVSD treated with ACE-I or ARB
HF patients confirmed by echocardiogram MI patients treated with ACE-I Anti-platelet BB statin
CHD patients alternative anti-platelet therapy taken CHD patients influenza immunisation
CHD patients total cholesterol lt 5mmoll CHD patients last BP lt15090
AF amp CHADS2 score gt1 anti-coagulation drug therapyAF amp CHADS2 score of 1 anti-coagplatelet drug therapy
AF patients stroke risk assessed using CHADS2 18 people9 people80 people103 people116 people79 people77 people13 people30 people1 person2 people1174 people822 people821 people199 people93 people60 people71 people113 people20 people61 people38 people-136 people21 people31 people49 people
Annexes
Annexe 1 spine charts
18
For data sources used see slide 23
England worst England best
Worst quintile in cluster Key
Worse outcome Better outcome Opportunity Secondary care
See indicator guide for methodology used to calculate the indicators
CHD average female elective LOSCHD average male elective LOS
CHD female elective admissions (DSR)CHD male elective admissions (DSR)
CHD average cost per female elective admissionCHD average cost per male elective admission
CHD average female emergency LOSCHD average male emergency LOS
CHD female emergency admissions (DSR)CHD male emergency admissions (DSR)
CHD average cost per female emergency admissionCHD average cost per male emergency admission
CVD average female elective LOSCVD average male elective LOS
CVD female elective admissions (DSR)CVD male elective admissions (DSR)
CVD average cost per female elective admissionCVD average cost per male elective admission
CVD average female emergency LOSCVD average male emergency LOS
CVD female emergency admissions (DSR)CVD male emergency admissions (DSR)
CVD average cost per female emergency admissionCVD average cost per male emergency admission -
-125 admissions64 admissions--pound155K pound22K --443 bed days616 bed days--54 admissions25 admissions-42 bed dayspound122K pound4K -15 admissions
110 bed days41 bed days
Annexes
Annexe 1 spine charts
19
For data sources used see slide 23
England worst England best
Worst quintile in cluster Key
Secondary care continued Worse outcome Better outcome Opportunity
See indicator guide for methodology used to calculate the indicators
CABG procedures female (LOS)CABG procedures male (LOS)
CABG procedures female (DSR)CABG procedures male (DSR)
CABG procedures female average costCABG procedures male average cost
Angioplasty procedures female LOSAngioplasty procedures male LOS
Angioplasty procedures female (DSR)Angioplasty procedures male (DSR)
Angioplasty procedures female average costAngioplasty procedures male average cost
Angiography procedures female LOSAngiography procedures male LOS
Angiography procedures female (DSR)Angiography procedures male (DSR)
Angiography procedures female average costAngiography procedures male average cost pound145K
pound20K 3 procedures68 procedures--pound15K pound1K --2 bed days-pound20K pound5K 12 procedureslt1 procedure76 bed days17 bed days
Annexes
Annexe 1 spine charts
20
Social care
For data sources used see slide 23
England worst England best
Worst quintile in cluster Key
Worse outcome Better outcome Opportunity Secondary care continued
See indicator guide for methodology used to calculate the indicators
Heart Failure average female emergency LOS
Heart Failure average male emergency LOS
Heart Failure Female emergency admissions (DSR)
Heart Failure male emergency admissions (DSR)
Heart Failure average cost per female emergency admission
Heart Failure average cost per male emergency admission
Stroke average female emergency LOS
Stroke average male emergency LOS
Stroke female emergency admissions (DSR)
Stroke male emergency admissions (DSR)
Stroke average cost per female emergency admission
Stroke average cost per male emergency admission pound28K pound11K 39 admissions27 admissions-162 bed dayspound14K pound8K 55 admissions38 admissions23 bed days16 bed days
stroke patients discharged usual residence 54 patients
Annexes
Annexe 2 similar CCGs
21
The 10 most similar CCGs to NHS HARINGEY CCG are
NHS GREENWICH CCG
NHS CROYDON CCG
NHS LEWISHAM CCG
NHS WALTHAM FOREST CCG
NHS ENFIELD CCG
NHS BRENT CCG
NHS CITY AND HACKNEY CCG
NHS ISLINGTON CCG
NHS WANDSWORTH CCG
NHS BARKING AND DAGENHAM CCG
For information on the methodology used to calculate the 10 most similar CCGS
please go to
httpwwwenglandnhsukresourcesresources-for-ccgscomm-for-value
Annexes
Annexe 3 Statistical methodology
22
Statistical methodology
The methodology used in this pack consisted of the following steps
For each indicator
bull Data were ranked within the cluster
bull A benchmark value was calculated as the average of the top 5 ranked CCG
values
bull The opportunity that could be gained if the CCG were to improve to the
benchmark value was calculated
bull The worst quintile was identified as the worst 2 ranked values
bull If the indicator lay in the worst quintile then it was highlighted as a potential area
for investigation
For more information see indicator guide
This is a non-parametric statistical approach which was designed to be easy to
understand and interpret While the comparison does not necessarily prove
statistical significance it does provide a robust indication of the most promising
areas for further investigation
Annexes
Annexe 4 Data sources
23
Data sources used
bull Quality and Outcomes Framework (QOF) 201314 Copyright copy 2014 Re-
used with the permission of the Health and Social Care Information Centre
All rights reserved
bull Number of Patients registered at a GP practice ndash April 2013 Copyright copy
2014 Re-used with the permission of the Health and Social Care
Information Centre All rights reserved
bull Modelled estimates of prevalence December 2011 East of England Public
Health Observatory
bull Mid-2012 Population Estimates for Clinical Commissioning Groups Office
for National Statistics (ONS) copy Crown Copyright 2014
bull Hospital Episode Statistics (HES) 201213 Copyright copy 2014 Re‐used
with the permission of The Health and Social Care Information Centre All
rights reserved
bull Model-based estimates (based on Health Survey for England) 2006-08 and
200708
bull Integrated Household Survey 2012
bull Active people survey Sport England 2012
Annexes
Annexe 5 Glossary
24
AF Atrial fibrillation
BP Blood pressure
CABG Coronary artery bypass graft
CCG Clinical Commissioning Group
CHADS2 A method of calculating the risk of stroke in patients
with atrial fibrillation (AF)
CHD Coronary heart disease
CVD Cardiovascular disease
DSR Directly standardised rate
LOS Length of stay
LVSD Left ventricular systolic dysfunction
PAD Peripheral Arterial Disease
QOF Quality Outcomes Framework

Backgro
und
bull This focus pack or deep dive looks at an agreed programme area (CVD) to
understand variation and improve the value of commissioned services across
the pathway
bull Commissioning for value insight packs were produced for every Clinical
Commissioning Group (CCG) in autumn 2013 by Public Health England
(PHE) NHS England and NHS Right Care These packs identified programme
areas with potential opportunities for improving outcome quality and efficiency
at CCG level for the ten areas of programme expenditure with the highest
spend These are available at
wwwenglandnhsukresourcesresources-for-ccgscomm-for-value
bull This CVD focus pack is available in two formats
‒ a downloadable PDF providing national benchmarked data for heart and
stroke together with a summary of key messages wwwncvinorguk
‒ an unbranded PowerPoint slide set that is available to CCGs on request to
add additional local information and comment Email the National
Cardiovascular Intelligence Network (NCVIN) to ask for a pack
ncvinphegovuk
About the packs
3
Backgro
und
Where to look
What to change
How to change
Phase 1 This pack
Phase 2 Phase 3
The NHS Right Care model
has three basic steps
The commissioning for value
insight pack supports Where
to look by indicating the areas
of care where your population
can gain most benefit from
your reform energies
This focus pack or lsquodeep diversquo
supports What to change by
helping you to define what the
optimal value care looks like
for your population
How to change helps you
implement the changes to
deliver the care Support is
available at httpwwwrightcarenhsukindexph
pcommissioning-for-value
Indicative
data
eg Atlas of
variation
Evidential
data
Deep dive
service reviews
Engagement and
case for change
Business
processes
Clinical
leadership and
engagement
What and how to change
4
Meth
odolo
gy
Methodology used to
produce this pack
5
Analysed a wide range of indicators from across the pathway focussing on spend quality
and outcomes
bull Identified lsquocluster groupsrsquo of 10 CCGs with similar characteristics to the CCG (see slide
21)
bull Analysed wide range of national data to identify indicators where the CCG is below a
benchmark value in its cluster group for that indicator and thus has an opportunity to
improve
bull Identified indicators where the CCG is in the worst quintile within its cluster for that
indicator (see slide 22 for more information on methodology)
Identified key opportunities for value improvement and quantified potential impact
bull Quantified opportunity for the CCG if indicators below the benchmark were moved to
the benchmark
bull Quantification does not mean that the lsquosavingrsquo or improvement can actually be made
but may answer the question lsquoIs it going to be worth focussing on this arearsquo
Identified evidence based guidance quality standards and performance metrics for
people providing and commissioning health public health and social care services for the
prevention and management of CVD related conditions For more information see slide
15
Sum
mary
on a
page
Summary
overarching messages
6
Overarching messages for the CCG
Significant benefit to patients if improvement to primary care management
indicators were made
High cost for CVD elective admissions (male) CHD elective admissions (male)
angiography procedures (male)
High number of admissions for stroke emergency admissions (male) heart failure
emergency admissions
High length of stay for CVD elective admissions
Low percentage of stroke patients discharged to usual place of residence
Note 1 these opportunities represent indicators that are in the worst quintile of their cluster group Other opportunities may also be available These can
be found in Annexe 1
Note 2 opportunities highlight areas for further investigation as variation may reflect genuine differences due to local demography and service provision
Not all opportunities therefore may be achievable See indicator guide for further information on how the indicators were calculated
Sum
mary
Summary
prevention and prevalence
7
Prevention
4 out of 5 prevention indicators are worse than the benchmark
There are no indicators in the worst quintile
Prevalence
3 out of 3 of the observed to expected prevalence ratios are worse than the
benchmark
The prevalence in 5 disease groups out of 7 are higher than the benchmark
Note 3 These packs use two types of prevalence indicator The observed prevalence diagnosed on practice registers and the ratio of observed to
expected prevalence The expected prevalence is a modelled estimate of total prevalence (diagnosed and undiagnosed) which uses the characteristics
of the population to estimate the expected total prevalence of disease in that population A low ratio may indicate a higher level of undiagnosed cases of
disease and therefore unmet need
Sum
mary
Summary
primary care
8
Primary care
26 out of 27 primary care indicators are worse than the benchmark
QOF indicators have been used but exceptions have been included in the
denominator
12 indicators are in the worst quintile The ten with the biggest potential benefits
to patients based on achieving the benchmark are shown
hypertension patients last BP lt 15090 (822 more people)
hypertension patients lt= 79 years BP lt 14090 (821 more people)
stroke patients record of cholesterol (113 more people)
CHD patients last BP lt15090 (103 more people)
AF amp CHADS2 score gt1 anti-coagulation drug therapy (80 more people)
CHD patients alternative anti-platelet therapy taken (77 more people)
stroke patients BP lt15090 (71 more people)
stroke patients referred for further investigation (60 more people)
PAD patients record aspirin or anti-platelet taken (49 more people)
stroke patients with a record of anti-platelet agent (38 more people)
Note 4 For full QOF names see indicator guide
Sum
mary
Summary
secondary care
Secondary care
38 out of 54 secondary care indicators are worse than the benchmark
8 indicators are in the worst quintile The three in terms of money and the five
with the biggest potential savings in terms of admissionsprocedures are listed
below the potential savings based on achieving the benchmark are shown in
brackets
-CVD average cost per male elective admission (pound155K)
-Angiography procedures male average cost (pound145K)
-CHD average cost per male elective admission (pound122K)
-CVD average female elective LOS (616 fewer bed days)
-CVD average male elective LOS (443 fewer bed days)
-Heart failure male emergency admissions (DSR) (55 fewer admissions)
-Stroke male emergency admissions (DSR) (39 fewer admissions)
-Heart failure female emergency admissions (DSR) (38 fewer admissions)
9 Note 5 CCG length of stay averages may be influenced by extreme values Further analysis may be needed to determine achievability of any related
opportunity
Note 6 CABG indicators may be based on small numbers Caution is advised on the use of these indicators
Sum
mary
Summary
social care
10
Social care
1 out of 1 social care indicators are worse than the benchmark
1 indicator is in the worst quintile
of stroke patients discharged to usual place of residence is in the worst
quintile If the CCG were to reach the benchmark then there could be 54 more
stroke patients discharged to their usual place of residence
Analy
sis
Where does the CCG compare
poorly against its cluster group
Analysis by pathway stage (page 1 of 2)
11
Table1
below a benchmark value equal to the average of the top 5 ranked CCG values in their cluster group
Number of Indicators
where CCG has room
for improvement
Indicators in the worst quintile versus benchmark group - difference
between the CCG and the benchmark
Opportunity - if the CCG were
to equal the benchmark
No indicators in the worst quintile No indicators in the worst quintile
CHD ratio (-249 lower) 1570 people
Stroke ratio (-283 lower) 971 people
AF amp CHADS2 score of 1 anti-coagplatelet drug therapy (-24 lower) 9 people
AF amp CHADS2 score gt1 anti-coagulation drug therapy (-103 lower) 80 people
CHD patients last BP lt15090 (-24 lower) 103 people
CHD patients alternative anti-platelet therapy taken (-18 lower) 77 people
HF patients confirmed by echocardiogram (-34 lower) 30 people
hypertension patients last BP lt 15090 (-34 lower) 822 people
hypertension patients lt= 79 years BP lt 14090 (-44 lower) 821 people
stroke patients referred for further investigation (-58 lower) 60 people
stroke patients BP lt15090 (-33 lower) 71 people
stroke patients record of cholesterol (-54 lower) 113 people
stroke patients with a record of anti-platelet agent (-31 lower) 38 people
PAD patients record aspirin or anti-platelet taken (-66 lower) 49 people
45 prevention indicators
33 observed to expected
prevalence ratios
2627 primary care
indicators
Analy
sis
Analysis by pathway stage (page 2 of 2)
12
Table2
Where does the CCG compare
poorly against its cluster group
below a benchmark value equal to the average of the top 5 ranked CCG values in their cluster group
Number of Indicators
where CCG has room
for improvement
Indicators in the worst quintile versus benchmark group - difference
between the CCG and the benchmark
Opportunity - if the CCG were
to equal the benchmark
CVD average cost per male elective admission (125 higher) pound155K
CHD average cost per male elective admission (26 higher) pound122K
Stroke male emergency admissions (DSR) (321 higher) 39 admissions
Heart failure male emergency admissions (DSR) (53 higher) 55 admissions
Heart failure female emergency admissions (DSR) (378 higher) 38 admissions
CVD average male elective LOS (431 higher) 443 bed days
CVD average female elective LOS (898 higher) 616 bed days
Angiography procedures male average cost (199 higher) pound145K
11 social care indicators of stroke patients discharged to usual place of residence (-17868 lower) 54 patients
3854 secondary care
indicators
Analy
sis
Where to focus understanding practice variation
bull The NCVIN can provide practice level data for CCGs on request
ncvinphegovuk This will allow CCGs to better understand practice
variation Practices are clustered with other practices across the country with
similar populations The practice is then compared with the other practices
within that cluster for all the indicators where the data is available at practice
level
bull This information is not presented routinely in these packs as CCGs will want to
use it sensitively as the basis of a discussion with practices to better
understand the reasons for variation and the reduction of variation not
explained by clinical need
13
Analy
sis
Where to focus
adding local data
An unbranded power point slide set is available to CCGs on request to add additional
local information and comment These can be requested through the NCVIN
ncvinphegovuk
CCGs may want to consider adding local intelligence to triangulate with the intelligence in this pack This may include
bull Up to date intelligence from providers
bull Contract monitoring data
bull Local prescribing data
bull Joint Strategic Needs Assessment (JSNA)
bull Preventative activity commissioned by local authorities
bull Data on inequalities
Local data can be particularly useful when
bull Testing the size of the opportunities identified from the national data in this
pack
bull Linking to identified needs of the population
bull Testing whether plans introduced since this data was collected have worked
bull Testing whether commissioned services are accessed by those in greatest
need
14
Analy
sis
Bring it all together what works what could work
who should we speak to
15
NICE Guidance Quality Standards etc
Prevention of cardiovascular disease
Hypertension
Atrial fibrillation
Stroke
Chronic heart failure
Lipid modification
Myocardial infarction with ST segment elevation
Lower limb peripheral arterial disease
Smoking prevention and cessation
Obesity
Physical activity
Contact the NICE field team for
support and advice on
implementing NICE guidance
The quality and productivity
collection provides quality
assured examples of
improvements across NHS and
social care and include
cardiovascular and stroke
Look at NICE shared learning
examples from organisations
that have put guidance into
practice Examples include
peripheral arterial disease
hypertension and obesity
Annexes
Annexe 1 spine charts
16
Prevention
Prevalence
England worst England best
Worst quintile in cluster Key
For data sources used see slide 23
Worse outcome High prevalence Better outcome Low prevalence Opportunity
See indicator guide for methodology used to calculate the indicators
Percentage of adults with low levels of physical activity
Percentage of adults classified as overweight or obese
Estimated prevalence of adult healthy eating
Smoking prevalence
Estimated percentage of binge drinkers 4756 people8219 people-12374 people3373 people
CVD prevention register
Atrial fibrillation
Peripheral arterial disease
Heart Failure
Hypertension observed to expected prevalence ratio
Hypertension
Stroke observed to expected prevalence ratio
Stroke
CHD observed to expected prevalence ratio
CHD 75 people1570 people-971 people2403 people5096 people125 people28 people-421 people
Annexes
Annexe 1 spine charts
17
For data sources used see slide 23
England worst England best
Worst quintile in cluster Key
Worse outcome Better outcome Opportunity Primary care
See indicator guide for methodology used to calculate the indicators
PAD patients record aspirin or anti-platelet taken PAD patients total cholesterol lt 5 mmoll
PAD patients BP lt 15090 hypertension patients given lifestyle advice
new hypertension CVD risk assessment treated statins stroke patients with a record of anti-platelet agent
stroke patients influenza immunisation stroke patients total cholesterol lt 5mmoll
stroke patients record of cholesterol stroke patients BP lt15090
stroke patients referred for further investigation hypertension patients lt75 years brief intervention
hypertension patients lt75 years physical activity assessment hypertension patients lt= 79 years BP lt 14090
hypertension patients last BP lt 15090 patients gt= 40 who have a record of BP
HF patients due to LVSD treated with ACE-I or ARB and BB HF patients due to LVSD treated with ACE-I or ARB
HF patients confirmed by echocardiogram MI patients treated with ACE-I Anti-platelet BB statin
CHD patients alternative anti-platelet therapy taken CHD patients influenza immunisation
CHD patients total cholesterol lt 5mmoll CHD patients last BP lt15090
AF amp CHADS2 score gt1 anti-coagulation drug therapyAF amp CHADS2 score of 1 anti-coagplatelet drug therapy
AF patients stroke risk assessed using CHADS2 18 people9 people80 people103 people116 people79 people77 people13 people30 people1 person2 people1174 people822 people821 people199 people93 people60 people71 people113 people20 people61 people38 people-136 people21 people31 people49 people
Annexes
Annexe 1 spine charts
18
For data sources used see slide 23
England worst England best
Worst quintile in cluster Key
Worse outcome Better outcome Opportunity Secondary care
See indicator guide for methodology used to calculate the indicators
CHD average female elective LOSCHD average male elective LOS
CHD female elective admissions (DSR)CHD male elective admissions (DSR)
CHD average cost per female elective admissionCHD average cost per male elective admission
CHD average female emergency LOSCHD average male emergency LOS
CHD female emergency admissions (DSR)CHD male emergency admissions (DSR)
CHD average cost per female emergency admissionCHD average cost per male emergency admission
CVD average female elective LOSCVD average male elective LOS
CVD female elective admissions (DSR)CVD male elective admissions (DSR)
CVD average cost per female elective admissionCVD average cost per male elective admission
CVD average female emergency LOSCVD average male emergency LOS
CVD female emergency admissions (DSR)CVD male emergency admissions (DSR)
CVD average cost per female emergency admissionCVD average cost per male emergency admission -
-125 admissions64 admissions--pound155K pound22K --443 bed days616 bed days--54 admissions25 admissions-42 bed dayspound122K pound4K -15 admissions
110 bed days41 bed days
Annexes
Annexe 1 spine charts
19
For data sources used see slide 23
England worst England best
Worst quintile in cluster Key
Secondary care continued Worse outcome Better outcome Opportunity
See indicator guide for methodology used to calculate the indicators
CABG procedures female (LOS)CABG procedures male (LOS)
CABG procedures female (DSR)CABG procedures male (DSR)
CABG procedures female average costCABG procedures male average cost
Angioplasty procedures female LOSAngioplasty procedures male LOS
Angioplasty procedures female (DSR)Angioplasty procedures male (DSR)
Angioplasty procedures female average costAngioplasty procedures male average cost
Angiography procedures female LOSAngiography procedures male LOS
Angiography procedures female (DSR)Angiography procedures male (DSR)
Angiography procedures female average costAngiography procedures male average cost pound145K
pound20K 3 procedures68 procedures--pound15K pound1K --2 bed days-pound20K pound5K 12 procedureslt1 procedure76 bed days17 bed days
Annexes
Annexe 1 spine charts
20
Social care
For data sources used see slide 23
England worst England best
Worst quintile in cluster Key
Worse outcome Better outcome Opportunity Secondary care continued
See indicator guide for methodology used to calculate the indicators
Heart Failure average female emergency LOS
Heart Failure average male emergency LOS
Heart Failure Female emergency admissions (DSR)
Heart Failure male emergency admissions (DSR)
Heart Failure average cost per female emergency admission
Heart Failure average cost per male emergency admission
Stroke average female emergency LOS
Stroke average male emergency LOS
Stroke female emergency admissions (DSR)
Stroke male emergency admissions (DSR)
Stroke average cost per female emergency admission
Stroke average cost per male emergency admission pound28K pound11K 39 admissions27 admissions-162 bed dayspound14K pound8K 55 admissions38 admissions23 bed days16 bed days
stroke patients discharged usual residence 54 patients
Annexes
Annexe 2 similar CCGs
21
The 10 most similar CCGs to NHS HARINGEY CCG are
NHS GREENWICH CCG
NHS CROYDON CCG
NHS LEWISHAM CCG
NHS WALTHAM FOREST CCG
NHS ENFIELD CCG
NHS BRENT CCG
NHS CITY AND HACKNEY CCG
NHS ISLINGTON CCG
NHS WANDSWORTH CCG
NHS BARKING AND DAGENHAM CCG
For information on the methodology used to calculate the 10 most similar CCGS
please go to
httpwwwenglandnhsukresourcesresources-for-ccgscomm-for-value
Annexes
Annexe 3 Statistical methodology
22
Statistical methodology
The methodology used in this pack consisted of the following steps
For each indicator
bull Data were ranked within the cluster
bull A benchmark value was calculated as the average of the top 5 ranked CCG
values
bull The opportunity that could be gained if the CCG were to improve to the
benchmark value was calculated
bull The worst quintile was identified as the worst 2 ranked values
bull If the indicator lay in the worst quintile then it was highlighted as a potential area
for investigation
For more information see indicator guide
This is a non-parametric statistical approach which was designed to be easy to
understand and interpret While the comparison does not necessarily prove
statistical significance it does provide a robust indication of the most promising
areas for further investigation
Annexes
Annexe 4 Data sources
23
Data sources used
bull Quality and Outcomes Framework (QOF) 201314 Copyright copy 2014 Re-
used with the permission of the Health and Social Care Information Centre
All rights reserved
bull Number of Patients registered at a GP practice ndash April 2013 Copyright copy
2014 Re-used with the permission of the Health and Social Care
Information Centre All rights reserved
bull Modelled estimates of prevalence December 2011 East of England Public
Health Observatory
bull Mid-2012 Population Estimates for Clinical Commissioning Groups Office
for National Statistics (ONS) copy Crown Copyright 2014
bull Hospital Episode Statistics (HES) 201213 Copyright copy 2014 Re‐used
with the permission of The Health and Social Care Information Centre All
rights reserved
bull Model-based estimates (based on Health Survey for England) 2006-08 and
200708
bull Integrated Household Survey 2012
bull Active people survey Sport England 2012
Annexes
Annexe 5 Glossary
24
AF Atrial fibrillation
BP Blood pressure
CABG Coronary artery bypass graft
CCG Clinical Commissioning Group
CHADS2 A method of calculating the risk of stroke in patients
with atrial fibrillation (AF)
CHD Coronary heart disease
CVD Cardiovascular disease
DSR Directly standardised rate
LOS Length of stay
LVSD Left ventricular systolic dysfunction
PAD Peripheral Arterial Disease
QOF Quality Outcomes Framework
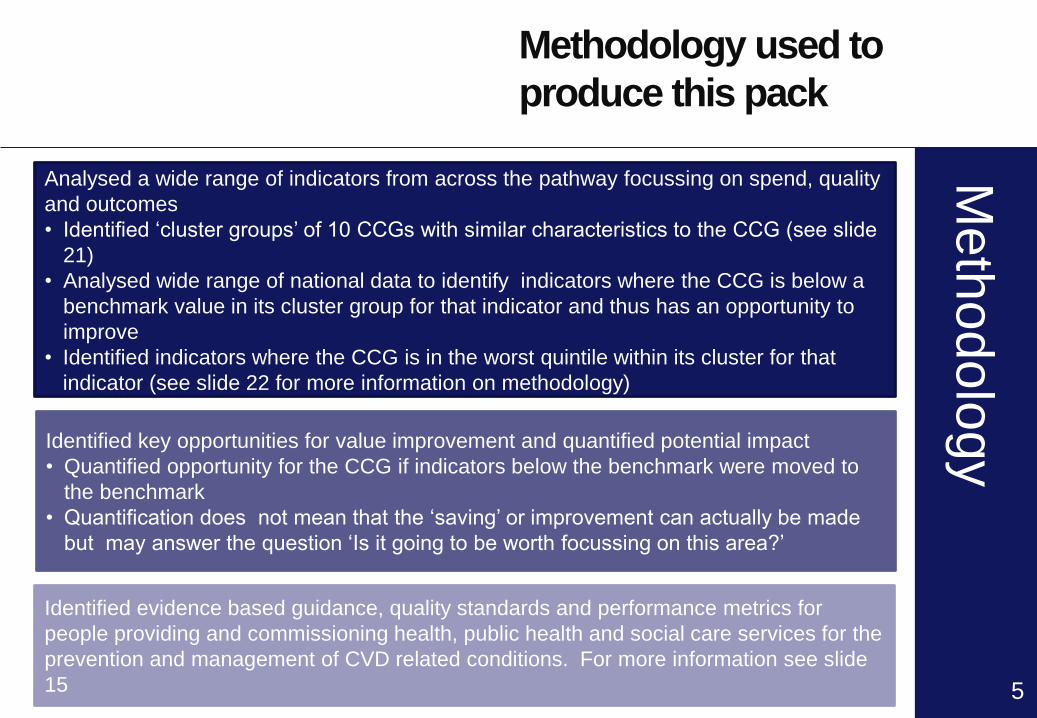
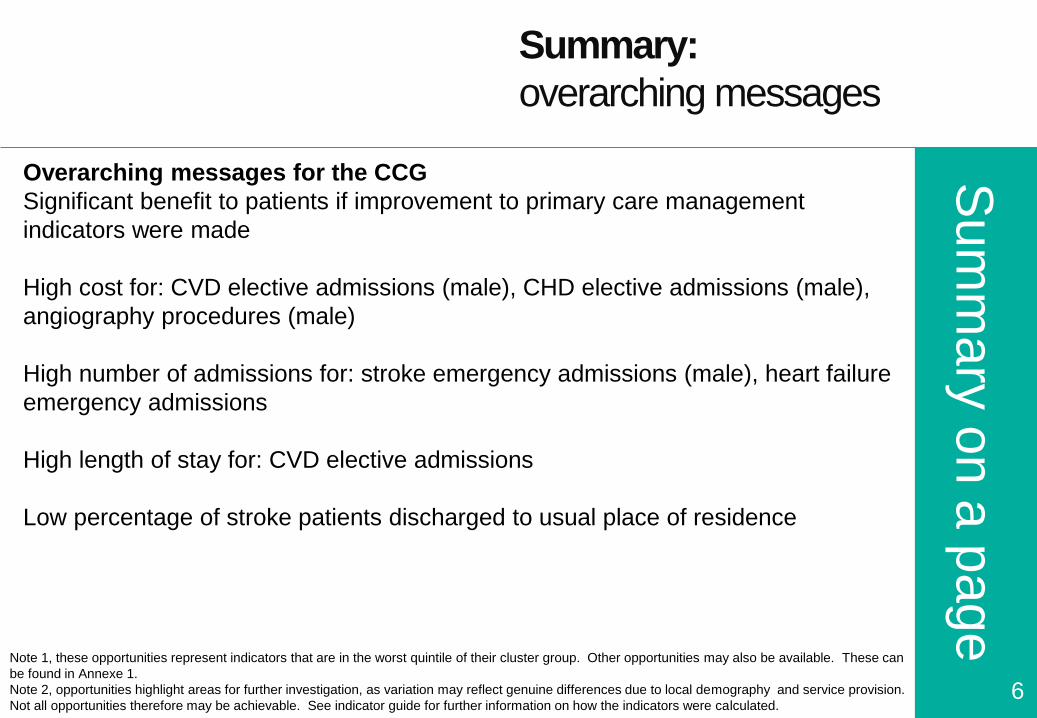
Sum
mary
on a
page
Summary
overarching messages
6
Overarching messages for the CCG
Significant benefit to patients if improvement to primary care management
indicators were made
High cost for CVD elective admissions (male) CHD elective admissions (male)
angiography procedures (male)
High number of admissions for stroke emergency admissions (male) heart failure
emergency admissions
High length of stay for CVD elective admissions
Low percentage of stroke patients discharged to usual place of residence
Note 1 these opportunities represent indicators that are in the worst quintile of their cluster group Other opportunities may also be available These can
be found in Annexe 1
Note 2 opportunities highlight areas for further investigation as variation may reflect genuine differences due to local demography and service provision
Not all opportunities therefore may be achievable See indicator guide for further information on how the indicators were calculated
Sum
mary
Summary
prevention and prevalence
7
Prevention
4 out of 5 prevention indicators are worse than the benchmark
There are no indicators in the worst quintile
Prevalence
3 out of 3 of the observed to expected prevalence ratios are worse than the
benchmark
The prevalence in 5 disease groups out of 7 are higher than the benchmark
Note 3 These packs use two types of prevalence indicator The observed prevalence diagnosed on practice registers and the ratio of observed to
expected prevalence The expected prevalence is a modelled estimate of total prevalence (diagnosed and undiagnosed) which uses the characteristics
of the population to estimate the expected total prevalence of disease in that population A low ratio may indicate a higher level of undiagnosed cases of
disease and therefore unmet need
Sum
mary
Summary
primary care
8
Primary care
26 out of 27 primary care indicators are worse than the benchmark
QOF indicators have been used but exceptions have been included in the
denominator
12 indicators are in the worst quintile The ten with the biggest potential benefits
to patients based on achieving the benchmark are shown
hypertension patients last BP lt 15090 (822 more people)
hypertension patients lt= 79 years BP lt 14090 (821 more people)
stroke patients record of cholesterol (113 more people)
CHD patients last BP lt15090 (103 more people)
AF amp CHADS2 score gt1 anti-coagulation drug therapy (80 more people)
CHD patients alternative anti-platelet therapy taken (77 more people)
stroke patients BP lt15090 (71 more people)
stroke patients referred for further investigation (60 more people)
PAD patients record aspirin or anti-platelet taken (49 more people)
stroke patients with a record of anti-platelet agent (38 more people)
Note 4 For full QOF names see indicator guide
Sum
mary
Summary
secondary care
Secondary care
38 out of 54 secondary care indicators are worse than the benchmark
8 indicators are in the worst quintile The three in terms of money and the five
with the biggest potential savings in terms of admissionsprocedures are listed
below the potential savings based on achieving the benchmark are shown in
brackets
-CVD average cost per male elective admission (pound155K)
-Angiography procedures male average cost (pound145K)
-CHD average cost per male elective admission (pound122K)
-CVD average female elective LOS (616 fewer bed days)
-CVD average male elective LOS (443 fewer bed days)
-Heart failure male emergency admissions (DSR) (55 fewer admissions)
-Stroke male emergency admissions (DSR) (39 fewer admissions)
-Heart failure female emergency admissions (DSR) (38 fewer admissions)
9 Note 5 CCG length of stay averages may be influenced by extreme values Further analysis may be needed to determine achievability of any related
opportunity
Note 6 CABG indicators may be based on small numbers Caution is advised on the use of these indicators
Sum
mary
Summary
social care
10
Social care
1 out of 1 social care indicators are worse than the benchmark
1 indicator is in the worst quintile
of stroke patients discharged to usual place of residence is in the worst
quintile If the CCG were to reach the benchmark then there could be 54 more
stroke patients discharged to their usual place of residence
Analy
sis
Where does the CCG compare
poorly against its cluster group
Analysis by pathway stage (page 1 of 2)
11
Table1
below a benchmark value equal to the average of the top 5 ranked CCG values in their cluster group
Number of Indicators
where CCG has room
for improvement
Indicators in the worst quintile versus benchmark group - difference
between the CCG and the benchmark
Opportunity - if the CCG were
to equal the benchmark
No indicators in the worst quintile No indicators in the worst quintile
CHD ratio (-249 lower) 1570 people
Stroke ratio (-283 lower) 971 people
AF amp CHADS2 score of 1 anti-coagplatelet drug therapy (-24 lower) 9 people
AF amp CHADS2 score gt1 anti-coagulation drug therapy (-103 lower) 80 people
CHD patients last BP lt15090 (-24 lower) 103 people
CHD patients alternative anti-platelet therapy taken (-18 lower) 77 people
HF patients confirmed by echocardiogram (-34 lower) 30 people
hypertension patients last BP lt 15090 (-34 lower) 822 people
hypertension patients lt= 79 years BP lt 14090 (-44 lower) 821 people
stroke patients referred for further investigation (-58 lower) 60 people
stroke patients BP lt15090 (-33 lower) 71 people
stroke patients record of cholesterol (-54 lower) 113 people
stroke patients with a record of anti-platelet agent (-31 lower) 38 people
PAD patients record aspirin or anti-platelet taken (-66 lower) 49 people
45 prevention indicators
33 observed to expected
prevalence ratios
2627 primary care
indicators
Analy
sis
Analysis by pathway stage (page 2 of 2)
12
Table2
Where does the CCG compare
poorly against its cluster group
below a benchmark value equal to the average of the top 5 ranked CCG values in their cluster group
Number of Indicators
where CCG has room
for improvement
Indicators in the worst quintile versus benchmark group - difference
between the CCG and the benchmark
Opportunity - if the CCG were
to equal the benchmark
CVD average cost per male elective admission (125 higher) pound155K
CHD average cost per male elective admission (26 higher) pound122K
Stroke male emergency admissions (DSR) (321 higher) 39 admissions
Heart failure male emergency admissions (DSR) (53 higher) 55 admissions
Heart failure female emergency admissions (DSR) (378 higher) 38 admissions
CVD average male elective LOS (431 higher) 443 bed days
CVD average female elective LOS (898 higher) 616 bed days
Angiography procedures male average cost (199 higher) pound145K
11 social care indicators of stroke patients discharged to usual place of residence (-17868 lower) 54 patients
3854 secondary care
indicators
Analy
sis
Where to focus understanding practice variation
bull The NCVIN can provide practice level data for CCGs on request
ncvinphegovuk This will allow CCGs to better understand practice
variation Practices are clustered with other practices across the country with
similar populations The practice is then compared with the other practices
within that cluster for all the indicators where the data is available at practice
level
bull This information is not presented routinely in these packs as CCGs will want to
use it sensitively as the basis of a discussion with practices to better
understand the reasons for variation and the reduction of variation not
explained by clinical need
13
Analy
sis
Where to focus
adding local data
An unbranded power point slide set is available to CCGs on request to add additional
local information and comment These can be requested through the NCVIN
ncvinphegovuk
CCGs may want to consider adding local intelligence to triangulate with the intelligence in this pack This may include
bull Up to date intelligence from providers
bull Contract monitoring data
bull Local prescribing data
bull Joint Strategic Needs Assessment (JSNA)
bull Preventative activity commissioned by local authorities
bull Data on inequalities
Local data can be particularly useful when
bull Testing the size of the opportunities identified from the national data in this
pack
bull Linking to identified needs of the population
bull Testing whether plans introduced since this data was collected have worked
bull Testing whether commissioned services are accessed by those in greatest
need
14
Analy
sis
Bring it all together what works what could work
who should we speak to
15
NICE Guidance Quality Standards etc
Prevention of cardiovascular disease
Hypertension
Atrial fibrillation
Stroke
Chronic heart failure
Lipid modification
Myocardial infarction with ST segment elevation
Lower limb peripheral arterial disease
Smoking prevention and cessation
Obesity
Physical activity
Contact the NICE field team for
support and advice on
implementing NICE guidance
The quality and productivity
collection provides quality
assured examples of
improvements across NHS and
social care and include
cardiovascular and stroke
Look at NICE shared learning
examples from organisations
that have put guidance into
practice Examples include
peripheral arterial disease
hypertension and obesity
Annexes
Annexe 1 spine charts
16
Prevention
Prevalence
England worst England best
Worst quintile in cluster Key
For data sources used see slide 23
Worse outcome High prevalence Better outcome Low prevalence Opportunity
See indicator guide for methodology used to calculate the indicators
Percentage of adults with low levels of physical activity
Percentage of adults classified as overweight or obese
Estimated prevalence of adult healthy eating
Smoking prevalence
Estimated percentage of binge drinkers 4756 people8219 people-12374 people3373 people
CVD prevention register
Atrial fibrillation
Peripheral arterial disease
Heart Failure
Hypertension observed to expected prevalence ratio
Hypertension
Stroke observed to expected prevalence ratio
Stroke
CHD observed to expected prevalence ratio
CHD 75 people1570 people-971 people2403 people5096 people125 people28 people-421 people
Annexes
Annexe 1 spine charts
17
For data sources used see slide 23
England worst England best
Worst quintile in cluster Key
Worse outcome Better outcome Opportunity Primary care
See indicator guide for methodology used to calculate the indicators
PAD patients record aspirin or anti-platelet taken PAD patients total cholesterol lt 5 mmoll
PAD patients BP lt 15090 hypertension patients given lifestyle advice
new hypertension CVD risk assessment treated statins stroke patients with a record of anti-platelet agent
stroke patients influenza immunisation stroke patients total cholesterol lt 5mmoll
stroke patients record of cholesterol stroke patients BP lt15090
stroke patients referred for further investigation hypertension patients lt75 years brief intervention
hypertension patients lt75 years physical activity assessment hypertension patients lt= 79 years BP lt 14090
hypertension patients last BP lt 15090 patients gt= 40 who have a record of BP
HF patients due to LVSD treated with ACE-I or ARB and BB HF patients due to LVSD treated with ACE-I or ARB
HF patients confirmed by echocardiogram MI patients treated with ACE-I Anti-platelet BB statin
CHD patients alternative anti-platelet therapy taken CHD patients influenza immunisation
CHD patients total cholesterol lt 5mmoll CHD patients last BP lt15090
AF amp CHADS2 score gt1 anti-coagulation drug therapyAF amp CHADS2 score of 1 anti-coagplatelet drug therapy
AF patients stroke risk assessed using CHADS2 18 people9 people80 people103 people116 people79 people77 people13 people30 people1 person2 people1174 people822 people821 people199 people93 people60 people71 people113 people20 people61 people38 people-136 people21 people31 people49 people
Annexes
Annexe 1 spine charts
18
For data sources used see slide 23
England worst England best
Worst quintile in cluster Key
Worse outcome Better outcome Opportunity Secondary care
See indicator guide for methodology used to calculate the indicators
CHD average female elective LOSCHD average male elective LOS
CHD female elective admissions (DSR)CHD male elective admissions (DSR)
CHD average cost per female elective admissionCHD average cost per male elective admission
CHD average female emergency LOSCHD average male emergency LOS
CHD female emergency admissions (DSR)CHD male emergency admissions (DSR)
CHD average cost per female emergency admissionCHD average cost per male emergency admission
CVD average female elective LOSCVD average male elective LOS
CVD female elective admissions (DSR)CVD male elective admissions (DSR)
CVD average cost per female elective admissionCVD average cost per male elective admission
CVD average female emergency LOSCVD average male emergency LOS
CVD female emergency admissions (DSR)CVD male emergency admissions (DSR)
CVD average cost per female emergency admissionCVD average cost per male emergency admission -
-125 admissions64 admissions--pound155K pound22K --443 bed days616 bed days--54 admissions25 admissions-42 bed dayspound122K pound4K -15 admissions
110 bed days41 bed days
Annexes
Annexe 1 spine charts
19
For data sources used see slide 23
England worst England best
Worst quintile in cluster Key
Secondary care continued Worse outcome Better outcome Opportunity
See indicator guide for methodology used to calculate the indicators
CABG procedures female (LOS)CABG procedures male (LOS)
CABG procedures female (DSR)CABG procedures male (DSR)
CABG procedures female average costCABG procedures male average cost
Angioplasty procedures female LOSAngioplasty procedures male LOS
Angioplasty procedures female (DSR)Angioplasty procedures male (DSR)
Angioplasty procedures female average costAngioplasty procedures male average cost
Angiography procedures female LOSAngiography procedures male LOS
Angiography procedures female (DSR)Angiography procedures male (DSR)
Angiography procedures female average costAngiography procedures male average cost pound145K
pound20K 3 procedures68 procedures--pound15K pound1K --2 bed days-pound20K pound5K 12 procedureslt1 procedure76 bed days17 bed days
Annexes
Annexe 1 spine charts
20
Social care
For data sources used see slide 23
England worst England best
Worst quintile in cluster Key
Worse outcome Better outcome Opportunity Secondary care continued
See indicator guide for methodology used to calculate the indicators
Heart Failure average female emergency LOS
Heart Failure average male emergency LOS
Heart Failure Female emergency admissions (DSR)
Heart Failure male emergency admissions (DSR)
Heart Failure average cost per female emergency admission
Heart Failure average cost per male emergency admission
Stroke average female emergency LOS
Stroke average male emergency LOS
Stroke female emergency admissions (DSR)
Stroke male emergency admissions (DSR)
Stroke average cost per female emergency admission
Stroke average cost per male emergency admission pound28K pound11K 39 admissions27 admissions-162 bed dayspound14K pound8K 55 admissions38 admissions23 bed days16 bed days
stroke patients discharged usual residence 54 patients
Annexes
Annexe 2 similar CCGs
21
The 10 most similar CCGs to NHS HARINGEY CCG are
NHS GREENWICH CCG
NHS CROYDON CCG
NHS LEWISHAM CCG
NHS WALTHAM FOREST CCG
NHS ENFIELD CCG
NHS BRENT CCG
NHS CITY AND HACKNEY CCG
NHS ISLINGTON CCG
NHS WANDSWORTH CCG
NHS BARKING AND DAGENHAM CCG
For information on the methodology used to calculate the 10 most similar CCGS
please go to
httpwwwenglandnhsukresourcesresources-for-ccgscomm-for-value
Annexes
Annexe 3 Statistical methodology
22
Statistical methodology
The methodology used in this pack consisted of the following steps
For each indicator
bull Data were ranked within the cluster
bull A benchmark value was calculated as the average of the top 5 ranked CCG
values
bull The opportunity that could be gained if the CCG were to improve to the
benchmark value was calculated
bull The worst quintile was identified as the worst 2 ranked values
bull If the indicator lay in the worst quintile then it was highlighted as a potential area
for investigation
For more information see indicator guide
This is a non-parametric statistical approach which was designed to be easy to
understand and interpret While the comparison does not necessarily prove
statistical significance it does provide a robust indication of the most promising
areas for further investigation
Annexes
Annexe 4 Data sources
23
Data sources used
bull Quality and Outcomes Framework (QOF) 201314 Copyright copy 2014 Re-
used with the permission of the Health and Social Care Information Centre
All rights reserved
bull Number of Patients registered at a GP practice ndash April 2013 Copyright copy
2014 Re-used with the permission of the Health and Social Care
Information Centre All rights reserved
bull Modelled estimates of prevalence December 2011 East of England Public
Health Observatory
bull Mid-2012 Population Estimates for Clinical Commissioning Groups Office
for National Statistics (ONS) copy Crown Copyright 2014
bull Hospital Episode Statistics (HES) 201213 Copyright copy 2014 Re‐used
with the permission of The Health and Social Care Information Centre All
rights reserved
bull Model-based estimates (based on Health Survey for England) 2006-08 and
200708
bull Integrated Household Survey 2012
bull Active people survey Sport England 2012
Annexes
Annexe 5 Glossary
24
AF Atrial fibrillation
BP Blood pressure
CABG Coronary artery bypass graft
CCG Clinical Commissioning Group
CHADS2 A method of calculating the risk of stroke in patients
with atrial fibrillation (AF)
CHD Coronary heart disease
CVD Cardiovascular disease
DSR Directly standardised rate
LOS Length of stay
LVSD Left ventricular systolic dysfunction
PAD Peripheral Arterial Disease
QOF Quality Outcomes Framework
Sum
mary
Summary
secondary care
Secondary care
38 out of 54 secondary care indicators are worse than the benchmark
8 indicators are in the worst quintile The three in terms of money and the five
with the biggest potential savings in terms of admissionsprocedures are listed
below the potential savings based on achieving the benchmark are shown in
brackets
-CVD average cost per male elective admission (pound155K)
-Angiography procedures male average cost (pound145K)
-CHD average cost per male elective admission (pound122K)
-CVD average female elective LOS (616 fewer bed days)
-CVD average male elective LOS (443 fewer bed days)
-Heart failure male emergency admissions (DSR) (55 fewer admissions)
-Stroke male emergency admissions (DSR) (39 fewer admissions)
-Heart failure female emergency admissions (DSR) (38 fewer admissions)
9 Note 5 CCG length of stay averages may be influenced by extreme values Further analysis may be needed to determine achievability of any related
opportunity
Note 6 CABG indicators may be based on small numbers Caution is advised on the use of these indicators
Sum
mary
Summary
social care
10
Social care
1 out of 1 social care indicators are worse than the benchmark
1 indicator is in the worst quintile
of stroke patients discharged to usual place of residence is in the worst
quintile If the CCG were to reach the benchmark then there could be 54 more
stroke patients discharged to their usual place of residence
Analy
sis
Where does the CCG compare
poorly against its cluster group
Analysis by pathway stage (page 1 of 2)
11
Table1
below a benchmark value equal to the average of the top 5 ranked CCG values in their cluster group
Number of Indicators
where CCG has room
for improvement
Indicators in the worst quintile versus benchmark group - difference
between the CCG and the benchmark
Opportunity - if the CCG were
to equal the benchmark
No indicators in the worst quintile No indicators in the worst quintile
CHD ratio (-249 lower) 1570 people
Stroke ratio (-283 lower) 971 people
AF amp CHADS2 score of 1 anti-coagplatelet drug therapy (-24 lower) 9 people
AF amp CHADS2 score gt1 anti-coagulation drug therapy (-103 lower) 80 people
CHD patients last BP lt15090 (-24 lower) 103 people
CHD patients alternative anti-platelet therapy taken (-18 lower) 77 people
HF patients confirmed by echocardiogram (-34 lower) 30 people
hypertension patients last BP lt 15090 (-34 lower) 822 people
hypertension patients lt= 79 years BP lt 14090 (-44 lower) 821 people
stroke patients referred for further investigation (-58 lower) 60 people
stroke patients BP lt15090 (-33 lower) 71 people
stroke patients record of cholesterol (-54 lower) 113 people
stroke patients with a record of anti-platelet agent (-31 lower) 38 people
PAD patients record aspirin or anti-platelet taken (-66 lower) 49 people
45 prevention indicators
33 observed to expected
prevalence ratios
2627 primary care
indicators
Analy
sis
Analysis by pathway stage (page 2 of 2)
12
Table2
Where does the CCG compare
poorly against its cluster group
below a benchmark value equal to the average of the top 5 ranked CCG values in their cluster group
Number of Indicators
where CCG has room
for improvement
Indicators in the worst quintile versus benchmark group - difference
between the CCG and the benchmark
Opportunity - if the CCG were
to equal the benchmark
CVD average cost per male elective admission (125 higher) pound155K
CHD average cost per male elective admission (26 higher) pound122K
Stroke male emergency admissions (DSR) (321 higher) 39 admissions
Heart failure male emergency admissions (DSR) (53 higher) 55 admissions
Heart failure female emergency admissions (DSR) (378 higher) 38 admissions
CVD average male elective LOS (431 higher) 443 bed days
CVD average female elective LOS (898 higher) 616 bed days
Angiography procedures male average cost (199 higher) pound145K
11 social care indicators of stroke patients discharged to usual place of residence (-17868 lower) 54 patients
3854 secondary care
indicators
Analy
sis
Where to focus understanding practice variation
bull The NCVIN can provide practice level data for CCGs on request
ncvinphegovuk This will allow CCGs to better understand practice
variation Practices are clustered with other practices across the country with
similar populations The practice is then compared with the other practices
within that cluster for all the indicators where the data is available at practice
level
bull This information is not presented routinely in these packs as CCGs will want to
use it sensitively as the basis of a discussion with practices to better
understand the reasons for variation and the reduction of variation not
explained by clinical need
13
Analy
sis
Where to focus
adding local data
An unbranded power point slide set is available to CCGs on request to add additional
local information and comment These can be requested through the NCVIN
ncvinphegovuk
CCGs may want to consider adding local intelligence to triangulate with the intelligence in this pack This may include
bull Up to date intelligence from providers
bull Contract monitoring data
bull Local prescribing data
bull Joint Strategic Needs Assessment (JSNA)
bull Preventative activity commissioned by local authorities
bull Data on inequalities
Local data can be particularly useful when
bull Testing the size of the opportunities identified from the national data in this
pack
bull Linking to identified needs of the population
bull Testing whether plans introduced since this data was collected have worked
bull Testing whether commissioned services are accessed by those in greatest
need
14
Analy
sis
Bring it all together what works what could work
who should we speak to
15
NICE Guidance Quality Standards etc
Prevention of cardiovascular disease
Hypertension
Atrial fibrillation
Stroke
Chronic heart failure
Lipid modification
Myocardial infarction with ST segment elevation
Lower limb peripheral arterial disease
Smoking prevention and cessation
Obesity
Physical activity
Contact the NICE field team for
support and advice on
implementing NICE guidance
The quality and productivity
collection provides quality
assured examples of
improvements across NHS and
social care and include
cardiovascular and stroke
Look at NICE shared learning
examples from organisations
that have put guidance into
practice Examples include
peripheral arterial disease
hypertension and obesity
Annexes
Annexe 1 spine charts
16
Prevention
Prevalence
England worst England best
Worst quintile in cluster Key
For data sources used see slide 23
Worse outcome High prevalence Better outcome Low prevalence Opportunity
See indicator guide for methodology used to calculate the indicators
Percentage of adults with low levels of physical activity
Percentage of adults classified as overweight or obese
Estimated prevalence of adult healthy eating
Smoking prevalence
Estimated percentage of binge drinkers 4756 people8219 people-12374 people3373 people
CVD prevention register
Atrial fibrillation
Peripheral arterial disease
Heart Failure
Hypertension observed to expected prevalence ratio
Hypertension
Stroke observed to expected prevalence ratio
Stroke
CHD observed to expected prevalence ratio
CHD 75 people1570 people-971 people2403 people5096 people125 people28 people-421 people
Annexes
Annexe 1 spine charts
17
For data sources used see slide 23
England worst England best
Worst quintile in cluster Key
Worse outcome Better outcome Opportunity Primary care
See indicator guide for methodology used to calculate the indicators
PAD patients record aspirin or anti-platelet taken PAD patients total cholesterol lt 5 mmoll
PAD patients BP lt 15090 hypertension patients given lifestyle advice
new hypertension CVD risk assessment treated statins stroke patients with a record of anti-platelet agent
stroke patients influenza immunisation stroke patients total cholesterol lt 5mmoll
stroke patients record of cholesterol stroke patients BP lt15090
stroke patients referred for further investigation hypertension patients lt75 years brief intervention
hypertension patients lt75 years physical activity assessment hypertension patients lt= 79 years BP lt 14090
hypertension patients last BP lt 15090 patients gt= 40 who have a record of BP
HF patients due to LVSD treated with ACE-I or ARB and BB HF patients due to LVSD treated with ACE-I or ARB
HF patients confirmed by echocardiogram MI patients treated with ACE-I Anti-platelet BB statin
CHD patients alternative anti-platelet therapy taken CHD patients influenza immunisation
CHD patients total cholesterol lt 5mmoll CHD patients last BP lt15090
AF amp CHADS2 score gt1 anti-coagulation drug therapyAF amp CHADS2 score of 1 anti-coagplatelet drug therapy
AF patients stroke risk assessed using CHADS2 18 people9 people80 people103 people116 people79 people77 people13 people30 people1 person2 people1174 people822 people821 people199 people93 people60 people71 people113 people20 people61 people38 people-136 people21 people31 people49 people
Annexes
Annexe 1 spine charts
18
For data sources used see slide 23
England worst England best
Worst quintile in cluster Key
Worse outcome Better outcome Opportunity Secondary care
See indicator guide for methodology used to calculate the indicators
CHD average female elective LOSCHD average male elective LOS
CHD female elective admissions (DSR)CHD male elective admissions (DSR)
CHD average cost per female elective admissionCHD average cost per male elective admission
CHD average female emergency LOSCHD average male emergency LOS
CHD female emergency admissions (DSR)CHD male emergency admissions (DSR)
CHD average cost per female emergency admissionCHD average cost per male emergency admission
CVD average female elective LOSCVD average male elective LOS
CVD female elective admissions (DSR)CVD male elective admissions (DSR)
CVD average cost per female elective admissionCVD average cost per male elective admission
CVD average female emergency LOSCVD average male emergency LOS
CVD female emergency admissions (DSR)CVD male emergency admissions (DSR)
CVD average cost per female emergency admissionCVD average cost per male emergency admission -
-125 admissions64 admissions--pound155K pound22K --443 bed days616 bed days--54 admissions25 admissions-42 bed dayspound122K pound4K -15 admissions
110 bed days41 bed days
Annexes
Annexe 1 spine charts
19
For data sources used see slide 23
England worst England best
Worst quintile in cluster Key
Secondary care continued Worse outcome Better outcome Opportunity
See indicator guide for methodology used to calculate the indicators
CABG procedures female (LOS)CABG procedures male (LOS)
CABG procedures female (DSR)CABG procedures male (DSR)
CABG procedures female average costCABG procedures male average cost
Angioplasty procedures female LOSAngioplasty procedures male LOS
Angioplasty procedures female (DSR)Angioplasty procedures male (DSR)
Angioplasty procedures female average costAngioplasty procedures male average cost
Angiography procedures female LOSAngiography procedures male LOS
Angiography procedures female (DSR)Angiography procedures male (DSR)
Angiography procedures female average costAngiography procedures male average cost pound145K
pound20K 3 procedures68 procedures--pound15K pound1K --2 bed days-pound20K pound5K 12 procedureslt1 procedure76 bed days17 bed days
Annexes
Annexe 1 spine charts
20
Social care
For data sources used see slide 23
England worst England best
Worst quintile in cluster Key
Worse outcome Better outcome Opportunity Secondary care continued
See indicator guide for methodology used to calculate the indicators
Heart Failure average female emergency LOS
Heart Failure average male emergency LOS
Heart Failure Female emergency admissions (DSR)
Heart Failure male emergency admissions (DSR)
Heart Failure average cost per female emergency admission
Heart Failure average cost per male emergency admission
Stroke average female emergency LOS
Stroke average male emergency LOS
Stroke female emergency admissions (DSR)
Stroke male emergency admissions (DSR)
Stroke average cost per female emergency admission
Stroke average cost per male emergency admission pound28K pound11K 39 admissions27 admissions-162 bed dayspound14K pound8K 55 admissions38 admissions23 bed days16 bed days
stroke patients discharged usual residence 54 patients
Annexes
Annexe 2 similar CCGs
21
The 10 most similar CCGs to NHS HARINGEY CCG are
NHS GREENWICH CCG
NHS CROYDON CCG
NHS LEWISHAM CCG
NHS WALTHAM FOREST CCG
NHS ENFIELD CCG
NHS BRENT CCG
NHS CITY AND HACKNEY CCG
NHS ISLINGTON CCG
NHS WANDSWORTH CCG
NHS BARKING AND DAGENHAM CCG
For information on the methodology used to calculate the 10 most similar CCGS
please go to
httpwwwenglandnhsukresourcesresources-for-ccgscomm-for-value
Annexes
Annexe 3 Statistical methodology
22
Statistical methodology
The methodology used in this pack consisted of the following steps
For each indicator
bull Data were ranked within the cluster
bull A benchmark value was calculated as the average of the top 5 ranked CCG
values
bull The opportunity that could be gained if the CCG were to improve to the
benchmark value was calculated
bull The worst quintile was identified as the worst 2 ranked values
bull If the indicator lay in the worst quintile then it was highlighted as a potential area
for investigation
For more information see indicator guide
This is a non-parametric statistical approach which was designed to be easy to
understand and interpret While the comparison does not necessarily prove
statistical significance it does provide a robust indication of the most promising
areas for further investigation
Annexes
Annexe 4 Data sources
23
Data sources used
bull Quality and Outcomes Framework (QOF) 201314 Copyright copy 2014 Re-
used with the permission of the Health and Social Care Information Centre
All rights reserved
bull Number of Patients registered at a GP practice ndash April 2013 Copyright copy
2014 Re-used with the permission of the Health and Social Care
Information Centre All rights reserved
bull Modelled estimates of prevalence December 2011 East of England Public
Health Observatory
bull Mid-2012 Population Estimates for Clinical Commissioning Groups Office
for National Statistics (ONS) copy Crown Copyright 2014
bull Hospital Episode Statistics (HES) 201213 Copyright copy 2014 Re‐used
with the permission of The Health and Social Care Information Centre All
rights reserved
bull Model-based estimates (based on Health Survey for England) 2006-08 and
200708
bull Integrated Household Survey 2012
bull Active people survey Sport England 2012
Annexes
Annexe 5 Glossary
24
AF Atrial fibrillation
BP Blood pressure
CABG Coronary artery bypass graft
CCG Clinical Commissioning Group
CHADS2 A method of calculating the risk of stroke in patients
with atrial fibrillation (AF)
CHD Coronary heart disease
CVD Cardiovascular disease
DSR Directly standardised rate
LOS Length of stay
LVSD Left ventricular systolic dysfunction
PAD Peripheral Arterial Disease
QOF Quality Outcomes Framework
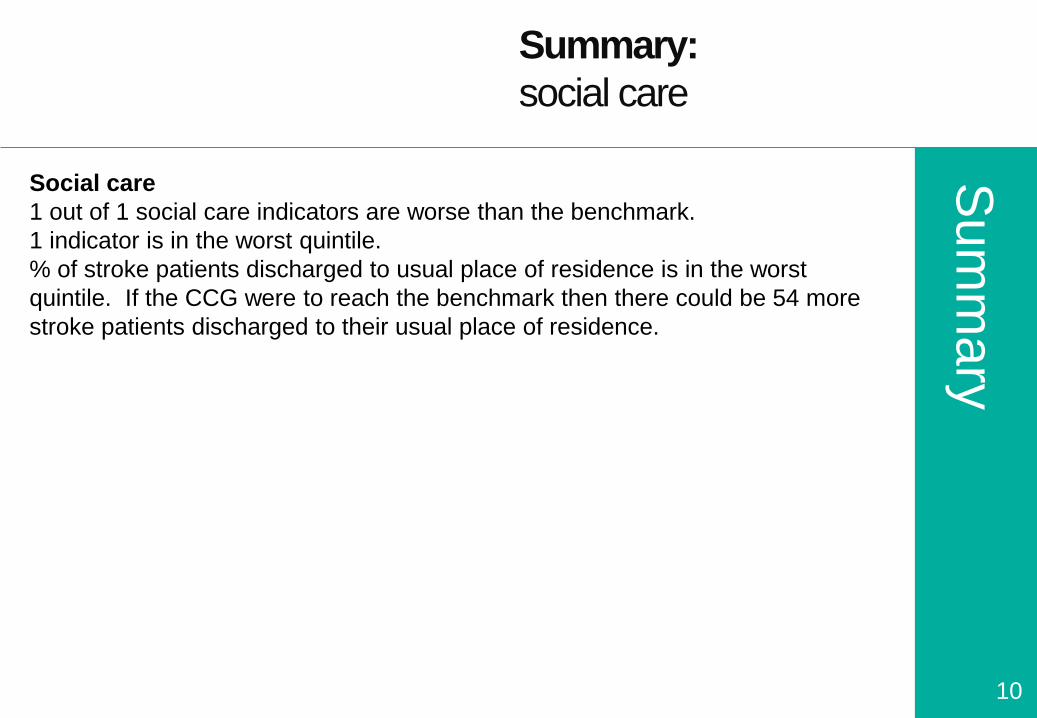
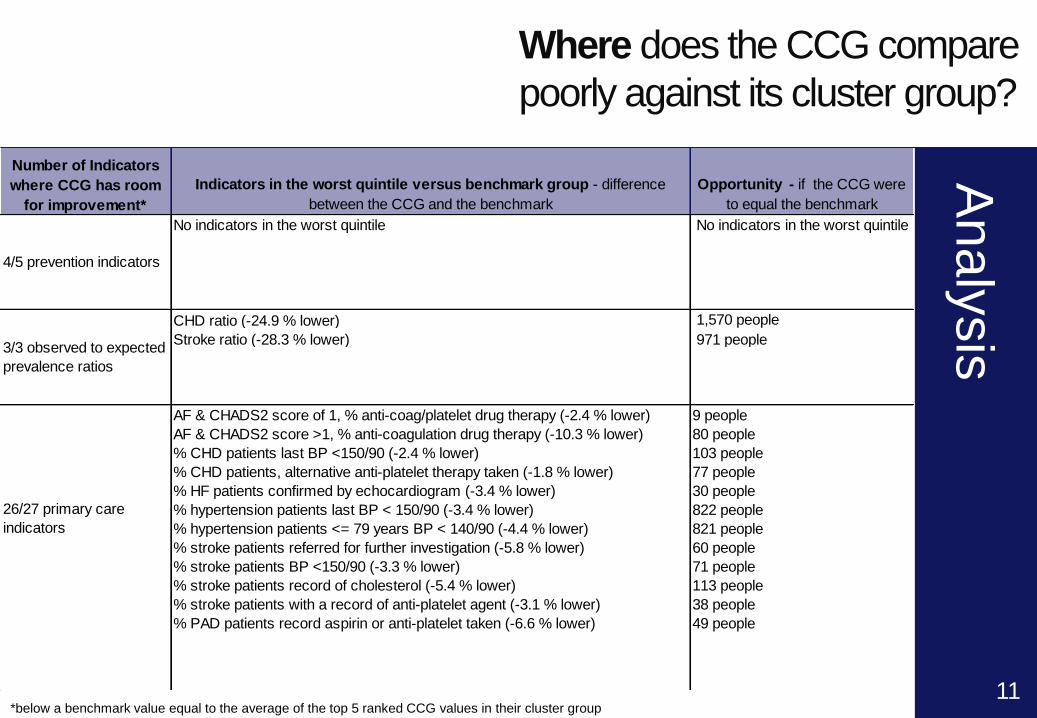
Analy
sis
Where does the CCG compare
poorly against its cluster group
Analysis by pathway stage (page 1 of 2)
11
Table1
below a benchmark value equal to the average of the top 5 ranked CCG values in their cluster group
Number of Indicators
where CCG has room
for improvement
Indicators in the worst quintile versus benchmark group - difference
between the CCG and the benchmark
Opportunity - if the CCG were
to equal the benchmark
No indicators in the worst quintile No indicators in the worst quintile
CHD ratio (-249 lower) 1570 people
Stroke ratio (-283 lower) 971 people
AF amp CHADS2 score of 1 anti-coagplatelet drug therapy (-24 lower) 9 people
AF amp CHADS2 score gt1 anti-coagulation drug therapy (-103 lower) 80 people
CHD patients last BP lt15090 (-24 lower) 103 people
CHD patients alternative anti-platelet therapy taken (-18 lower) 77 people
HF patients confirmed by echocardiogram (-34 lower) 30 people
hypertension patients last BP lt 15090 (-34 lower) 822 people
hypertension patients lt= 79 years BP lt 14090 (-44 lower) 821 people
stroke patients referred for further investigation (-58 lower) 60 people
stroke patients BP lt15090 (-33 lower) 71 people
stroke patients record of cholesterol (-54 lower) 113 people
stroke patients with a record of anti-platelet agent (-31 lower) 38 people
PAD patients record aspirin or anti-platelet taken (-66 lower) 49 people
45 prevention indicators
33 observed to expected
prevalence ratios
2627 primary care
indicators
Analy
sis
Analysis by pathway stage (page 2 of 2)
12
Table2
Where does the CCG compare
poorly against its cluster group
below a benchmark value equal to the average of the top 5 ranked CCG values in their cluster group
Number of Indicators
where CCG has room
for improvement
Indicators in the worst quintile versus benchmark group - difference
between the CCG and the benchmark
Opportunity - if the CCG were
to equal the benchmark
CVD average cost per male elective admission (125 higher) pound155K
CHD average cost per male elective admission (26 higher) pound122K
Stroke male emergency admissions (DSR) (321 higher) 39 admissions
Heart failure male emergency admissions (DSR) (53 higher) 55 admissions
Heart failure female emergency admissions (DSR) (378 higher) 38 admissions
CVD average male elective LOS (431 higher) 443 bed days
CVD average female elective LOS (898 higher) 616 bed days
Angiography procedures male average cost (199 higher) pound145K
11 social care indicators of stroke patients discharged to usual place of residence (-17868 lower) 54 patients
3854 secondary care
indicators
Analy
sis
Where to focus understanding practice variation
bull The NCVIN can provide practice level data for CCGs on request
ncvinphegovuk This will allow CCGs to better understand practice
variation Practices are clustered with other practices across the country with
similar populations The practice is then compared with the other practices
within that cluster for all the indicators where the data is available at practice
level
bull This information is not presented routinely in these packs as CCGs will want to
use it sensitively as the basis of a discussion with practices to better
understand the reasons for variation and the reduction of variation not
explained by clinical need
13
Analy
sis
Where to focus
adding local data
An unbranded power point slide set is available to CCGs on request to add additional
local information and comment These can be requested through the NCVIN
ncvinphegovuk
CCGs may want to consider adding local intelligence to triangulate with the intelligence in this pack This may include
bull Up to date intelligence from providers
bull Contract monitoring data
bull Local prescribing data
bull Joint Strategic Needs Assessment (JSNA)
bull Preventative activity commissioned by local authorities
bull Data on inequalities
Local data can be particularly useful when
bull Testing the size of the opportunities identified from the national data in this
pack
bull Linking to identified needs of the population
bull Testing whether plans introduced since this data was collected have worked
bull Testing whether commissioned services are accessed by those in greatest
need
14
Analy
sis
Bring it all together what works what could work
who should we speak to
15
NICE Guidance Quality Standards etc
Prevention of cardiovascular disease
Hypertension
Atrial fibrillation
Stroke
Chronic heart failure
Lipid modification
Myocardial infarction with ST segment elevation
Lower limb peripheral arterial disease
Smoking prevention and cessation
Obesity
Physical activity
Contact the NICE field team for
support and advice on
implementing NICE guidance
The quality and productivity
collection provides quality
assured examples of
improvements across NHS and
social care and include
cardiovascular and stroke
Look at NICE shared learning
examples from organisations
that have put guidance into
practice Examples include
peripheral arterial disease
hypertension and obesity
Annexes
Annexe 1 spine charts
16
Prevention
Prevalence
England worst England best
Worst quintile in cluster Key
For data sources used see slide 23
Worse outcome High prevalence Better outcome Low prevalence Opportunity
See indicator guide for methodology used to calculate the indicators
Percentage of adults with low levels of physical activity
Percentage of adults classified as overweight or obese
Estimated prevalence of adult healthy eating
Smoking prevalence
Estimated percentage of binge drinkers 4756 people8219 people-12374 people3373 people
CVD prevention register
Atrial fibrillation
Peripheral arterial disease
Heart Failure
Hypertension observed to expected prevalence ratio
Hypertension
Stroke observed to expected prevalence ratio
Stroke
CHD observed to expected prevalence ratio
CHD 75 people1570 people-971 people2403 people5096 people125 people28 people-421 people
Annexes
Annexe 1 spine charts
17
For data sources used see slide 23
England worst England best
Worst quintile in cluster Key
Worse outcome Better outcome Opportunity Primary care
See indicator guide for methodology used to calculate the indicators
PAD patients record aspirin or anti-platelet taken PAD patients total cholesterol lt 5 mmoll
PAD patients BP lt 15090 hypertension patients given lifestyle advice
new hypertension CVD risk assessment treated statins stroke patients with a record of anti-platelet agent
stroke patients influenza immunisation stroke patients total cholesterol lt 5mmoll
stroke patients record of cholesterol stroke patients BP lt15090
stroke patients referred for further investigation hypertension patients lt75 years brief intervention
hypertension patients lt75 years physical activity assessment hypertension patients lt= 79 years BP lt 14090
hypertension patients last BP lt 15090 patients gt= 40 who have a record of BP
HF patients due to LVSD treated with ACE-I or ARB and BB HF patients due to LVSD treated with ACE-I or ARB
HF patients confirmed by echocardiogram MI patients treated with ACE-I Anti-platelet BB statin
CHD patients alternative anti-platelet therapy taken CHD patients influenza immunisation
CHD patients total cholesterol lt 5mmoll CHD patients last BP lt15090
AF amp CHADS2 score gt1 anti-coagulation drug therapyAF amp CHADS2 score of 1 anti-coagplatelet drug therapy
AF patients stroke risk assessed using CHADS2 18 people9 people80 people103 people116 people79 people77 people13 people30 people1 person2 people1174 people822 people821 people199 people93 people60 people71 people113 people20 people61 people38 people-136 people21 people31 people49 people
Annexes
Annexe 1 spine charts
18
For data sources used see slide 23
England worst England best
Worst quintile in cluster Key
Worse outcome Better outcome Opportunity Secondary care
See indicator guide for methodology used to calculate the indicators
CHD average female elective LOSCHD average male elective LOS
CHD female elective admissions (DSR)CHD male elective admissions (DSR)
CHD average cost per female elective admissionCHD average cost per male elective admission
CHD average female emergency LOSCHD average male emergency LOS
CHD female emergency admissions (DSR)CHD male emergency admissions (DSR)
CHD average cost per female emergency admissionCHD average cost per male emergency admission
CVD average female elective LOSCVD average male elective LOS
CVD female elective admissions (DSR)CVD male elective admissions (DSR)
CVD average cost per female elective admissionCVD average cost per male elective admission
CVD average female emergency LOSCVD average male emergency LOS
CVD female emergency admissions (DSR)CVD male emergency admissions (DSR)
CVD average cost per female emergency admissionCVD average cost per male emergency admission -
-125 admissions64 admissions--pound155K pound22K --443 bed days616 bed days--54 admissions25 admissions-42 bed dayspound122K pound4K -15 admissions
110 bed days41 bed days
Annexes
Annexe 1 spine charts
19
For data sources used see slide 23
England worst England best
Worst quintile in cluster Key
Secondary care continued Worse outcome Better outcome Opportunity
See indicator guide for methodology used to calculate the indicators
CABG procedures female (LOS)CABG procedures male (LOS)
CABG procedures female (DSR)CABG procedures male (DSR)
CABG procedures female average costCABG procedures male average cost
Angioplasty procedures female LOSAngioplasty procedures male LOS
Angioplasty procedures female (DSR)Angioplasty procedures male (DSR)
Angioplasty procedures female average costAngioplasty procedures male average cost
Angiography procedures female LOSAngiography procedures male LOS
Angiography procedures female (DSR)Angiography procedures male (DSR)
Angiography procedures female average costAngiography procedures male average cost pound145K
pound20K 3 procedures68 procedures--pound15K pound1K --2 bed days-pound20K pound5K 12 procedureslt1 procedure76 bed days17 bed days
Annexes
Annexe 1 spine charts
20
Social care
For data sources used see slide 23
England worst England best
Worst quintile in cluster Key
Worse outcome Better outcome Opportunity Secondary care continued
See indicator guide for methodology used to calculate the indicators
Heart Failure average female emergency LOS
Heart Failure average male emergency LOS
Heart Failure Female emergency admissions (DSR)
Heart Failure male emergency admissions (DSR)
Heart Failure average cost per female emergency admission
Heart Failure average cost per male emergency admission
Stroke average female emergency LOS
Stroke average male emergency LOS
Stroke female emergency admissions (DSR)
Stroke male emergency admissions (DSR)
Stroke average cost per female emergency admission
Stroke average cost per male emergency admission pound28K pound11K 39 admissions27 admissions-162 bed dayspound14K pound8K 55 admissions38 admissions23 bed days16 bed days
stroke patients discharged usual residence 54 patients
Annexes
Annexe 2 similar CCGs
21
The 10 most similar CCGs to NHS HARINGEY CCG are
NHS GREENWICH CCG
NHS CROYDON CCG
NHS LEWISHAM CCG
NHS WALTHAM FOREST CCG
NHS ENFIELD CCG
NHS BRENT CCG
NHS CITY AND HACKNEY CCG
NHS ISLINGTON CCG
NHS WANDSWORTH CCG
NHS BARKING AND DAGENHAM CCG
For information on the methodology used to calculate the 10 most similar CCGS
please go to
httpwwwenglandnhsukresourcesresources-for-ccgscomm-for-value
Annexes
Annexe 3 Statistical methodology
22
Statistical methodology
The methodology used in this pack consisted of the following steps
For each indicator
bull Data were ranked within the cluster
bull A benchmark value was calculated as the average of the top 5 ranked CCG
values
bull The opportunity that could be gained if the CCG were to improve to the
benchmark value was calculated
bull The worst quintile was identified as the worst 2 ranked values
bull If the indicator lay in the worst quintile then it was highlighted as a potential area
for investigation
For more information see indicator guide
This is a non-parametric statistical approach which was designed to be easy to
understand and interpret While the comparison does not necessarily prove
statistical significance it does provide a robust indication of the most promising
areas for further investigation
Annexes
Annexe 4 Data sources
23
Data sources used
bull Quality and Outcomes Framework (QOF) 201314 Copyright copy 2014 Re-
used with the permission of the Health and Social Care Information Centre
All rights reserved
bull Number of Patients registered at a GP practice ndash April 2013 Copyright copy
2014 Re-used with the permission of the Health and Social Care
Information Centre All rights reserved
bull Modelled estimates of prevalence December 2011 East of England Public
Health Observatory
bull Mid-2012 Population Estimates for Clinical Commissioning Groups Office
for National Statistics (ONS) copy Crown Copyright 2014
bull Hospital Episode Statistics (HES) 201213 Copyright copy 2014 Re‐used
with the permission of The Health and Social Care Information Centre All
rights reserved
bull Model-based estimates (based on Health Survey for England) 2006-08 and
200708
bull Integrated Household Survey 2012
bull Active people survey Sport England 2012
Annexes
Annexe 5 Glossary
24
AF Atrial fibrillation
BP Blood pressure
CABG Coronary artery bypass graft
CCG Clinical Commissioning Group
CHADS2 A method of calculating the risk of stroke in patients
with atrial fibrillation (AF)
CHD Coronary heart disease
CVD Cardiovascular disease
DSR Directly standardised rate
LOS Length of stay
LVSD Left ventricular systolic dysfunction
PAD Peripheral Arterial Disease
QOF Quality Outcomes Framework

Analy
sis
Analysis by pathway stage (page 2 of 2)
12
Table2
Where does the CCG compare
poorly against its cluster group
below a benchmark value equal to the average of the top 5 ranked CCG values in their cluster group
Number of Indicators
where CCG has room
for improvement
Indicators in the worst quintile versus benchmark group - difference
between the CCG and the benchmark
Opportunity - if the CCG were
to equal the benchmark
CVD average cost per male elective admission (125 higher) pound155K
CHD average cost per male elective admission (26 higher) pound122K
Stroke male emergency admissions (DSR) (321 higher) 39 admissions
Heart failure male emergency admissions (DSR) (53 higher) 55 admissions
Heart failure female emergency admissions (DSR) (378 higher) 38 admissions
CVD average male elective LOS (431 higher) 443 bed days
CVD average female elective LOS (898 higher) 616 bed days
Angiography procedures male average cost (199 higher) pound145K
11 social care indicators of stroke patients discharged to usual place of residence (-17868 lower) 54 patients
3854 secondary care
indicators
Analy
sis
Where to focus understanding practice variation
bull The NCVIN can provide practice level data for CCGs on request
ncvinphegovuk This will allow CCGs to better understand practice
variation Practices are clustered with other practices across the country with
similar populations The practice is then compared with the other practices
within that cluster for all the indicators where the data is available at practice
level
bull This information is not presented routinely in these packs as CCGs will want to
use it sensitively as the basis of a discussion with practices to better
understand the reasons for variation and the reduction of variation not
explained by clinical need
13
Analy
sis
Where to focus
adding local data
An unbranded power point slide set is available to CCGs on request to add additional
local information and comment These can be requested through the NCVIN
ncvinphegovuk
CCGs may want to consider adding local intelligence to triangulate with the intelligence in this pack This may include
bull Up to date intelligence from providers
bull Contract monitoring data
bull Local prescribing data
bull Joint Strategic Needs Assessment (JSNA)
bull Preventative activity commissioned by local authorities
bull Data on inequalities
Local data can be particularly useful when
bull Testing the size of the opportunities identified from the national data in this
pack
bull Linking to identified needs of the population
bull Testing whether plans introduced since this data was collected have worked
bull Testing whether commissioned services are accessed by those in greatest
need
14
Analy
sis
Bring it all together what works what could work
who should we speak to
15
NICE Guidance Quality Standards etc
Prevention of cardiovascular disease
Hypertension
Atrial fibrillation
Stroke
Chronic heart failure
Lipid modification
Myocardial infarction with ST segment elevation
Lower limb peripheral arterial disease
Smoking prevention and cessation
Obesity
Physical activity
Contact the NICE field team for
support and advice on
implementing NICE guidance
The quality and productivity
collection provides quality
assured examples of
improvements across NHS and
social care and include
cardiovascular and stroke
Look at NICE shared learning
examples from organisations
that have put guidance into
practice Examples include
peripheral arterial disease
hypertension and obesity
Annexes
Annexe 1 spine charts
16
Prevention
Prevalence
England worst England best
Worst quintile in cluster Key
For data sources used see slide 23
Worse outcome High prevalence Better outcome Low prevalence Opportunity
See indicator guide for methodology used to calculate the indicators
Percentage of adults with low levels of physical activity
Percentage of adults classified as overweight or obese
Estimated prevalence of adult healthy eating
Smoking prevalence
Estimated percentage of binge drinkers 4756 people8219 people-12374 people3373 people
CVD prevention register
Atrial fibrillation
Peripheral arterial disease
Heart Failure
Hypertension observed to expected prevalence ratio
Hypertension
Stroke observed to expected prevalence ratio
Stroke
CHD observed to expected prevalence ratio
CHD 75 people1570 people-971 people2403 people5096 people125 people28 people-421 people
Annexes
Annexe 1 spine charts
17
For data sources used see slide 23
England worst England best
Worst quintile in cluster Key
Worse outcome Better outcome Opportunity Primary care
See indicator guide for methodology used to calculate the indicators
PAD patients record aspirin or anti-platelet taken PAD patients total cholesterol lt 5 mmoll
PAD patients BP lt 15090 hypertension patients given lifestyle advice
new hypertension CVD risk assessment treated statins stroke patients with a record of anti-platelet agent
stroke patients influenza immunisation stroke patients total cholesterol lt 5mmoll
stroke patients record of cholesterol stroke patients BP lt15090
stroke patients referred for further investigation hypertension patients lt75 years brief intervention
hypertension patients lt75 years physical activity assessment hypertension patients lt= 79 years BP lt 14090
hypertension patients last BP lt 15090 patients gt= 40 who have a record of BP
HF patients due to LVSD treated with ACE-I or ARB and BB HF patients due to LVSD treated with ACE-I or ARB
HF patients confirmed by echocardiogram MI patients treated with ACE-I Anti-platelet BB statin
CHD patients alternative anti-platelet therapy taken CHD patients influenza immunisation
CHD patients total cholesterol lt 5mmoll CHD patients last BP lt15090
AF amp CHADS2 score gt1 anti-coagulation drug therapyAF amp CHADS2 score of 1 anti-coagplatelet drug therapy
AF patients stroke risk assessed using CHADS2 18 people9 people80 people103 people116 people79 people77 people13 people30 people1 person2 people1174 people822 people821 people199 people93 people60 people71 people113 people20 people61 people38 people-136 people21 people31 people49 people
Annexes
Annexe 1 spine charts
18
For data sources used see slide 23
England worst England best
Worst quintile in cluster Key
Worse outcome Better outcome Opportunity Secondary care
See indicator guide for methodology used to calculate the indicators
CHD average female elective LOSCHD average male elective LOS
CHD female elective admissions (DSR)CHD male elective admissions (DSR)
CHD average cost per female elective admissionCHD average cost per male elective admission
CHD average female emergency LOSCHD average male emergency LOS
CHD female emergency admissions (DSR)CHD male emergency admissions (DSR)
CHD average cost per female emergency admissionCHD average cost per male emergency admission
CVD average female elective LOSCVD average male elective LOS
CVD female elective admissions (DSR)CVD male elective admissions (DSR)
CVD average cost per female elective admissionCVD average cost per male elective admission
CVD average female emergency LOSCVD average male emergency LOS
CVD female emergency admissions (DSR)CVD male emergency admissions (DSR)
CVD average cost per female emergency admissionCVD average cost per male emergency admission -
-125 admissions64 admissions--pound155K pound22K --443 bed days616 bed days--54 admissions25 admissions-42 bed dayspound122K pound4K -15 admissions
110 bed days41 bed days
Annexes
Annexe 1 spine charts
19
For data sources used see slide 23
England worst England best
Worst quintile in cluster Key
Secondary care continued Worse outcome Better outcome Opportunity
See indicator guide for methodology used to calculate the indicators
CABG procedures female (LOS)CABG procedures male (LOS)
CABG procedures female (DSR)CABG procedures male (DSR)
CABG procedures female average costCABG procedures male average cost
Angioplasty procedures female LOSAngioplasty procedures male LOS
Angioplasty procedures female (DSR)Angioplasty procedures male (DSR)
Angioplasty procedures female average costAngioplasty procedures male average cost
Angiography procedures female LOSAngiography procedures male LOS
Angiography procedures female (DSR)Angiography procedures male (DSR)
Angiography procedures female average costAngiography procedures male average cost pound145K
pound20K 3 procedures68 procedures--pound15K pound1K --2 bed days-pound20K pound5K 12 procedureslt1 procedure76 bed days17 bed days
Annexes
Annexe 1 spine charts
20
Social care
For data sources used see slide 23
England worst England best
Worst quintile in cluster Key
Worse outcome Better outcome Opportunity Secondary care continued
See indicator guide for methodology used to calculate the indicators
Heart Failure average female emergency LOS
Heart Failure average male emergency LOS
Heart Failure Female emergency admissions (DSR)
Heart Failure male emergency admissions (DSR)
Heart Failure average cost per female emergency admission
Heart Failure average cost per male emergency admission
Stroke average female emergency LOS
Stroke average male emergency LOS
Stroke female emergency admissions (DSR)
Stroke male emergency admissions (DSR)
Stroke average cost per female emergency admission
Stroke average cost per male emergency admission pound28K pound11K 39 admissions27 admissions-162 bed dayspound14K pound8K 55 admissions38 admissions23 bed days16 bed days
stroke patients discharged usual residence 54 patients
Annexes
Annexe 2 similar CCGs
21
The 10 most similar CCGs to NHS HARINGEY CCG are
NHS GREENWICH CCG
NHS CROYDON CCG
NHS LEWISHAM CCG
NHS WALTHAM FOREST CCG
NHS ENFIELD CCG
NHS BRENT CCG
NHS CITY AND HACKNEY CCG
NHS ISLINGTON CCG
NHS WANDSWORTH CCG
NHS BARKING AND DAGENHAM CCG
For information on the methodology used to calculate the 10 most similar CCGS
please go to
httpwwwenglandnhsukresourcesresources-for-ccgscomm-for-value
Annexes
Annexe 3 Statistical methodology
22
Statistical methodology
The methodology used in this pack consisted of the following steps
For each indicator
bull Data were ranked within the cluster
bull A benchmark value was calculated as the average of the top 5 ranked CCG
values
bull The opportunity that could be gained if the CCG were to improve to the
benchmark value was calculated
bull The worst quintile was identified as the worst 2 ranked values
bull If the indicator lay in the worst quintile then it was highlighted as a potential area
for investigation
For more information see indicator guide
This is a non-parametric statistical approach which was designed to be easy to
understand and interpret While the comparison does not necessarily prove
statistical significance it does provide a robust indication of the most promising
areas for further investigation
Annexes
Annexe 4 Data sources
23
Data sources used
bull Quality and Outcomes Framework (QOF) 201314 Copyright copy 2014 Re-
used with the permission of the Health and Social Care Information Centre
All rights reserved
bull Number of Patients registered at a GP practice ndash April 2013 Copyright copy
2014 Re-used with the permission of the Health and Social Care
Information Centre All rights reserved
bull Modelled estimates of prevalence December 2011 East of England Public
Health Observatory
bull Mid-2012 Population Estimates for Clinical Commissioning Groups Office
for National Statistics (ONS) copy Crown Copyright 2014
bull Hospital Episode Statistics (HES) 201213 Copyright copy 2014 Re‐used
with the permission of The Health and Social Care Information Centre All
rights reserved
bull Model-based estimates (based on Health Survey for England) 2006-08 and
200708
bull Integrated Household Survey 2012
bull Active people survey Sport England 2012
Annexes
Annexe 5 Glossary
24
AF Atrial fibrillation
BP Blood pressure
CABG Coronary artery bypass graft
CCG Clinical Commissioning Group
CHADS2 A method of calculating the risk of stroke in patients
with atrial fibrillation (AF)
CHD Coronary heart disease
CVD Cardiovascular disease
DSR Directly standardised rate
LOS Length of stay
LVSD Left ventricular systolic dysfunction
PAD Peripheral Arterial Disease
QOF Quality Outcomes Framework
Analy
sis
Where to focus
adding local data
An unbranded power point slide set is available to CCGs on request to add additional
local information and comment These can be requested through the NCVIN
ncvinphegovuk
CCGs may want to consider adding local intelligence to triangulate with the intelligence in this pack This may include
bull Up to date intelligence from providers
bull Contract monitoring data
bull Local prescribing data
bull Joint Strategic Needs Assessment (JSNA)
bull Preventative activity commissioned by local authorities
bull Data on inequalities
Local data can be particularly useful when
bull Testing the size of the opportunities identified from the national data in this
pack
bull Linking to identified needs of the population
bull Testing whether plans introduced since this data was collected have worked
bull Testing whether commissioned services are accessed by those in greatest
need
14
Analy
sis
Bring it all together what works what could work
who should we speak to
15
NICE Guidance Quality Standards etc
Prevention of cardiovascular disease
Hypertension
Atrial fibrillation
Stroke
Chronic heart failure
Lipid modification
Myocardial infarction with ST segment elevation
Lower limb peripheral arterial disease
Smoking prevention and cessation
Obesity
Physical activity
Contact the NICE field team for
support and advice on
implementing NICE guidance
The quality and productivity
collection provides quality
assured examples of
improvements across NHS and
social care and include
cardiovascular and stroke
Look at NICE shared learning
examples from organisations
that have put guidance into
practice Examples include
peripheral arterial disease
hypertension and obesity
Annexes
Annexe 1 spine charts
16
Prevention
Prevalence
England worst England best
Worst quintile in cluster Key
For data sources used see slide 23
Worse outcome High prevalence Better outcome Low prevalence Opportunity
See indicator guide for methodology used to calculate the indicators
Percentage of adults with low levels of physical activity
Percentage of adults classified as overweight or obese
Estimated prevalence of adult healthy eating
Smoking prevalence
Estimated percentage of binge drinkers 4756 people8219 people-12374 people3373 people
CVD prevention register
Atrial fibrillation
Peripheral arterial disease
Heart Failure
Hypertension observed to expected prevalence ratio
Hypertension
Stroke observed to expected prevalence ratio
Stroke
CHD observed to expected prevalence ratio
CHD 75 people1570 people-971 people2403 people5096 people125 people28 people-421 people
Annexes
Annexe 1 spine charts
17
For data sources used see slide 23
England worst England best
Worst quintile in cluster Key
Worse outcome Better outcome Opportunity Primary care
See indicator guide for methodology used to calculate the indicators
PAD patients record aspirin or anti-platelet taken PAD patients total cholesterol lt 5 mmoll
PAD patients BP lt 15090 hypertension patients given lifestyle advice
new hypertension CVD risk assessment treated statins stroke patients with a record of anti-platelet agent
stroke patients influenza immunisation stroke patients total cholesterol lt 5mmoll
stroke patients record of cholesterol stroke patients BP lt15090
stroke patients referred for further investigation hypertension patients lt75 years brief intervention
hypertension patients lt75 years physical activity assessment hypertension patients lt= 79 years BP lt 14090
hypertension patients last BP lt 15090 patients gt= 40 who have a record of BP
HF patients due to LVSD treated with ACE-I or ARB and BB HF patients due to LVSD treated with ACE-I or ARB
HF patients confirmed by echocardiogram MI patients treated with ACE-I Anti-platelet BB statin
CHD patients alternative anti-platelet therapy taken CHD patients influenza immunisation
CHD patients total cholesterol lt 5mmoll CHD patients last BP lt15090
AF amp CHADS2 score gt1 anti-coagulation drug therapyAF amp CHADS2 score of 1 anti-coagplatelet drug therapy
AF patients stroke risk assessed using CHADS2 18 people9 people80 people103 people116 people79 people77 people13 people30 people1 person2 people1174 people822 people821 people199 people93 people60 people71 people113 people20 people61 people38 people-136 people21 people31 people49 people
Annexes
Annexe 1 spine charts
18
For data sources used see slide 23
England worst England best
Worst quintile in cluster Key
Worse outcome Better outcome Opportunity Secondary care
See indicator guide for methodology used to calculate the indicators
CHD average female elective LOSCHD average male elective LOS
CHD female elective admissions (DSR)CHD male elective admissions (DSR)
CHD average cost per female elective admissionCHD average cost per male elective admission
CHD average female emergency LOSCHD average male emergency LOS
CHD female emergency admissions (DSR)CHD male emergency admissions (DSR)
CHD average cost per female emergency admissionCHD average cost per male emergency admission
CVD average female elective LOSCVD average male elective LOS
CVD female elective admissions (DSR)CVD male elective admissions (DSR)
CVD average cost per female elective admissionCVD average cost per male elective admission
CVD average female emergency LOSCVD average male emergency LOS
CVD female emergency admissions (DSR)CVD male emergency admissions (DSR)
CVD average cost per female emergency admissionCVD average cost per male emergency admission -
-125 admissions64 admissions--pound155K pound22K --443 bed days616 bed days--54 admissions25 admissions-42 bed dayspound122K pound4K -15 admissions
110 bed days41 bed days
Annexes
Annexe 1 spine charts
19
For data sources used see slide 23
England worst England best
Worst quintile in cluster Key
Secondary care continued Worse outcome Better outcome Opportunity
See indicator guide for methodology used to calculate the indicators
CABG procedures female (LOS)CABG procedures male (LOS)
CABG procedures female (DSR)CABG procedures male (DSR)
CABG procedures female average costCABG procedures male average cost
Angioplasty procedures female LOSAngioplasty procedures male LOS
Angioplasty procedures female (DSR)Angioplasty procedures male (DSR)
Angioplasty procedures female average costAngioplasty procedures male average cost
Angiography procedures female LOSAngiography procedures male LOS
Angiography procedures female (DSR)Angiography procedures male (DSR)
Angiography procedures female average costAngiography procedures male average cost pound145K
pound20K 3 procedures68 procedures--pound15K pound1K --2 bed days-pound20K pound5K 12 procedureslt1 procedure76 bed days17 bed days
Annexes
Annexe 1 spine charts
20
Social care
For data sources used see slide 23
England worst England best
Worst quintile in cluster Key
Worse outcome Better outcome Opportunity Secondary care continued
See indicator guide for methodology used to calculate the indicators
Heart Failure average female emergency LOS
Heart Failure average male emergency LOS
Heart Failure Female emergency admissions (DSR)
Heart Failure male emergency admissions (DSR)
Heart Failure average cost per female emergency admission
Heart Failure average cost per male emergency admission
Stroke average female emergency LOS
Stroke average male emergency LOS
Stroke female emergency admissions (DSR)
Stroke male emergency admissions (DSR)
Stroke average cost per female emergency admission
Stroke average cost per male emergency admission pound28K pound11K 39 admissions27 admissions-162 bed dayspound14K pound8K 55 admissions38 admissions23 bed days16 bed days
stroke patients discharged usual residence 54 patients
Annexes
Annexe 2 similar CCGs
21
The 10 most similar CCGs to NHS HARINGEY CCG are
NHS GREENWICH CCG
NHS CROYDON CCG
NHS LEWISHAM CCG
NHS WALTHAM FOREST CCG
NHS ENFIELD CCG
NHS BRENT CCG
NHS CITY AND HACKNEY CCG
NHS ISLINGTON CCG
NHS WANDSWORTH CCG
NHS BARKING AND DAGENHAM CCG
For information on the methodology used to calculate the 10 most similar CCGS
please go to
httpwwwenglandnhsukresourcesresources-for-ccgscomm-for-value
Annexes
Annexe 3 Statistical methodology
22
Statistical methodology
The methodology used in this pack consisted of the following steps
For each indicator
bull Data were ranked within the cluster
bull A benchmark value was calculated as the average of the top 5 ranked CCG
values
bull The opportunity that could be gained if the CCG were to improve to the
benchmark value was calculated
bull The worst quintile was identified as the worst 2 ranked values
bull If the indicator lay in the worst quintile then it was highlighted as a potential area
for investigation
For more information see indicator guide
This is a non-parametric statistical approach which was designed to be easy to
understand and interpret While the comparison does not necessarily prove
statistical significance it does provide a robust indication of the most promising
areas for further investigation
Annexes
Annexe 4 Data sources
23
Data sources used
bull Quality and Outcomes Framework (QOF) 201314 Copyright copy 2014 Re-
used with the permission of the Health and Social Care Information Centre
All rights reserved
bull Number of Patients registered at a GP practice ndash April 2013 Copyright copy
2014 Re-used with the permission of the Health and Social Care
Information Centre All rights reserved
bull Modelled estimates of prevalence December 2011 East of England Public
Health Observatory
bull Mid-2012 Population Estimates for Clinical Commissioning Groups Office
for National Statistics (ONS) copy Crown Copyright 2014
bull Hospital Episode Statistics (HES) 201213 Copyright copy 2014 Re‐used
with the permission of The Health and Social Care Information Centre All
rights reserved
bull Model-based estimates (based on Health Survey for England) 2006-08 and
200708
bull Integrated Household Survey 2012
bull Active people survey Sport England 2012
Annexes
Annexe 5 Glossary
24
AF Atrial fibrillation
BP Blood pressure
CABG Coronary artery bypass graft
CCG Clinical Commissioning Group
CHADS2 A method of calculating the risk of stroke in patients
with atrial fibrillation (AF)
CHD Coronary heart disease
CVD Cardiovascular disease
DSR Directly standardised rate
LOS Length of stay
LVSD Left ventricular systolic dysfunction
PAD Peripheral Arterial Disease
QOF Quality Outcomes Framework
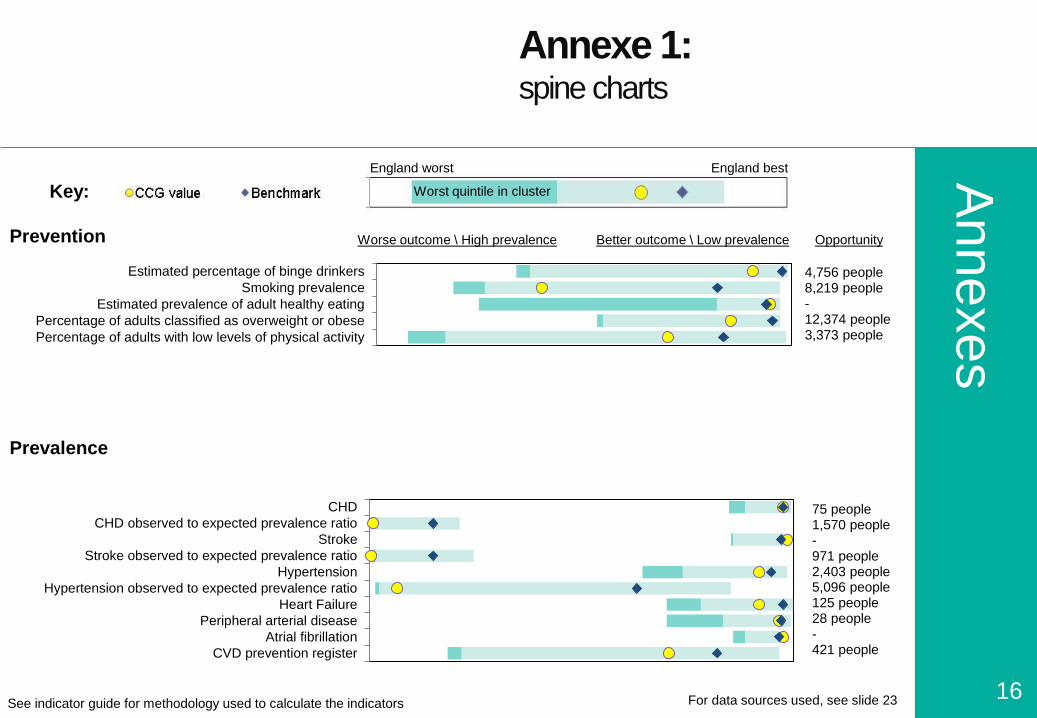
Annexes
Annexe 1 spine charts
16
Prevention
Prevalence
England worst England best
Worst quintile in cluster Key
For data sources used see slide 23
Worse outcome High prevalence Better outcome Low prevalence Opportunity
See indicator guide for methodology used to calculate the indicators
Percentage of adults with low levels of physical activity
Percentage of adults classified as overweight or obese
Estimated prevalence of adult healthy eating
Smoking prevalence
Estimated percentage of binge drinkers 4756 people8219 people-12374 people3373 people
CVD prevention register
Atrial fibrillation
Peripheral arterial disease
Heart Failure
Hypertension observed to expected prevalence ratio
Hypertension
Stroke observed to expected prevalence ratio
Stroke
CHD observed to expected prevalence ratio
CHD 75 people1570 people-971 people2403 people5096 people125 people28 people-421 people
Annexes
Annexe 1 spine charts
17
For data sources used see slide 23
England worst England best
Worst quintile in cluster Key
Worse outcome Better outcome Opportunity Primary care
See indicator guide for methodology used to calculate the indicators
PAD patients record aspirin or anti-platelet taken PAD patients total cholesterol lt 5 mmoll
PAD patients BP lt 15090 hypertension patients given lifestyle advice
new hypertension CVD risk assessment treated statins stroke patients with a record of anti-platelet agent
stroke patients influenza immunisation stroke patients total cholesterol lt 5mmoll
stroke patients record of cholesterol stroke patients BP lt15090
stroke patients referred for further investigation hypertension patients lt75 years brief intervention
hypertension patients lt75 years physical activity assessment hypertension patients lt= 79 years BP lt 14090
hypertension patients last BP lt 15090 patients gt= 40 who have a record of BP
HF patients due to LVSD treated with ACE-I or ARB and BB HF patients due to LVSD treated with ACE-I or ARB
HF patients confirmed by echocardiogram MI patients treated with ACE-I Anti-platelet BB statin
CHD patients alternative anti-platelet therapy taken CHD patients influenza immunisation
CHD patients total cholesterol lt 5mmoll CHD patients last BP lt15090
AF amp CHADS2 score gt1 anti-coagulation drug therapyAF amp CHADS2 score of 1 anti-coagplatelet drug therapy
AF patients stroke risk assessed using CHADS2 18 people9 people80 people103 people116 people79 people77 people13 people30 people1 person2 people1174 people822 people821 people199 people93 people60 people71 people113 people20 people61 people38 people-136 people21 people31 people49 people
Annexes
Annexe 1 spine charts
18
For data sources used see slide 23
England worst England best
Worst quintile in cluster Key
Worse outcome Better outcome Opportunity Secondary care
See indicator guide for methodology used to calculate the indicators
CHD average female elective LOSCHD average male elective LOS
CHD female elective admissions (DSR)CHD male elective admissions (DSR)
CHD average cost per female elective admissionCHD average cost per male elective admission
CHD average female emergency LOSCHD average male emergency LOS
CHD female emergency admissions (DSR)CHD male emergency admissions (DSR)
CHD average cost per female emergency admissionCHD average cost per male emergency admission
CVD average female elective LOSCVD average male elective LOS
CVD female elective admissions (DSR)CVD male elective admissions (DSR)
CVD average cost per female elective admissionCVD average cost per male elective admission
CVD average female emergency LOSCVD average male emergency LOS
CVD female emergency admissions (DSR)CVD male emergency admissions (DSR)
CVD average cost per female emergency admissionCVD average cost per male emergency admission -
-125 admissions64 admissions--pound155K pound22K --443 bed days616 bed days--54 admissions25 admissions-42 bed dayspound122K pound4K -15 admissions
110 bed days41 bed days
Annexes
Annexe 1 spine charts
19
For data sources used see slide 23
England worst England best
Worst quintile in cluster Key
Secondary care continued Worse outcome Better outcome Opportunity
See indicator guide for methodology used to calculate the indicators
CABG procedures female (LOS)CABG procedures male (LOS)
CABG procedures female (DSR)CABG procedures male (DSR)
CABG procedures female average costCABG procedures male average cost
Angioplasty procedures female LOSAngioplasty procedures male LOS
Angioplasty procedures female (DSR)Angioplasty procedures male (DSR)
Angioplasty procedures female average costAngioplasty procedures male average cost
Angiography procedures female LOSAngiography procedures male LOS
Angiography procedures female (DSR)Angiography procedures male (DSR)
Angiography procedures female average costAngiography procedures male average cost pound145K
pound20K 3 procedures68 procedures--pound15K pound1K --2 bed days-pound20K pound5K 12 procedureslt1 procedure76 bed days17 bed days
Annexes
Annexe 1 spine charts
20
Social care
For data sources used see slide 23
England worst England best
Worst quintile in cluster Key
Worse outcome Better outcome Opportunity Secondary care continued
See indicator guide for methodology used to calculate the indicators
Heart Failure average female emergency LOS
Heart Failure average male emergency LOS
Heart Failure Female emergency admissions (DSR)
Heart Failure male emergency admissions (DSR)
Heart Failure average cost per female emergency admission
Heart Failure average cost per male emergency admission
Stroke average female emergency LOS
Stroke average male emergency LOS
Stroke female emergency admissions (DSR)
Stroke male emergency admissions (DSR)
Stroke average cost per female emergency admission
Stroke average cost per male emergency admission pound28K pound11K 39 admissions27 admissions-162 bed dayspound14K pound8K 55 admissions38 admissions23 bed days16 bed days
stroke patients discharged usual residence 54 patients
Annexes
Annexe 2 similar CCGs
21
The 10 most similar CCGs to NHS HARINGEY CCG are
NHS GREENWICH CCG
NHS CROYDON CCG
NHS LEWISHAM CCG
NHS WALTHAM FOREST CCG
NHS ENFIELD CCG
NHS BRENT CCG
NHS CITY AND HACKNEY CCG
NHS ISLINGTON CCG
NHS WANDSWORTH CCG
NHS BARKING AND DAGENHAM CCG
For information on the methodology used to calculate the 10 most similar CCGS
please go to
httpwwwenglandnhsukresourcesresources-for-ccgscomm-for-value
Annexes
Annexe 3 Statistical methodology
22
Statistical methodology
The methodology used in this pack consisted of the following steps
For each indicator
bull Data were ranked within the cluster
bull A benchmark value was calculated as the average of the top 5 ranked CCG
values
bull The opportunity that could be gained if the CCG were to improve to the
benchmark value was calculated
bull The worst quintile was identified as the worst 2 ranked values
bull If the indicator lay in the worst quintile then it was highlighted as a potential area
for investigation
For more information see indicator guide
This is a non-parametric statistical approach which was designed to be easy to
understand and interpret While the comparison does not necessarily prove
statistical significance it does provide a robust indication of the most promising
areas for further investigation
Annexes
Annexe 4 Data sources
23
Data sources used
bull Quality and Outcomes Framework (QOF) 201314 Copyright copy 2014 Re-
used with the permission of the Health and Social Care Information Centre
All rights reserved
bull Number of Patients registered at a GP practice ndash April 2013 Copyright copy
2014 Re-used with the permission of the Health and Social Care
Information Centre All rights reserved
bull Modelled estimates of prevalence December 2011 East of England Public
Health Observatory
bull Mid-2012 Population Estimates for Clinical Commissioning Groups Office
for National Statistics (ONS) copy Crown Copyright 2014
bull Hospital Episode Statistics (HES) 201213 Copyright copy 2014 Re‐used
with the permission of The Health and Social Care Information Centre All
rights reserved
bull Model-based estimates (based on Health Survey for England) 2006-08 and
200708
bull Integrated Household Survey 2012
bull Active people survey Sport England 2012
Annexes
Annexe 5 Glossary
24
AF Atrial fibrillation
BP Blood pressure
CABG Coronary artery bypass graft
CCG Clinical Commissioning Group
CHADS2 A method of calculating the risk of stroke in patients
with atrial fibrillation (AF)
CHD Coronary heart disease
CVD Cardiovascular disease
DSR Directly standardised rate
LOS Length of stay
LVSD Left ventricular systolic dysfunction
PAD Peripheral Arterial Disease
QOF Quality Outcomes Framework
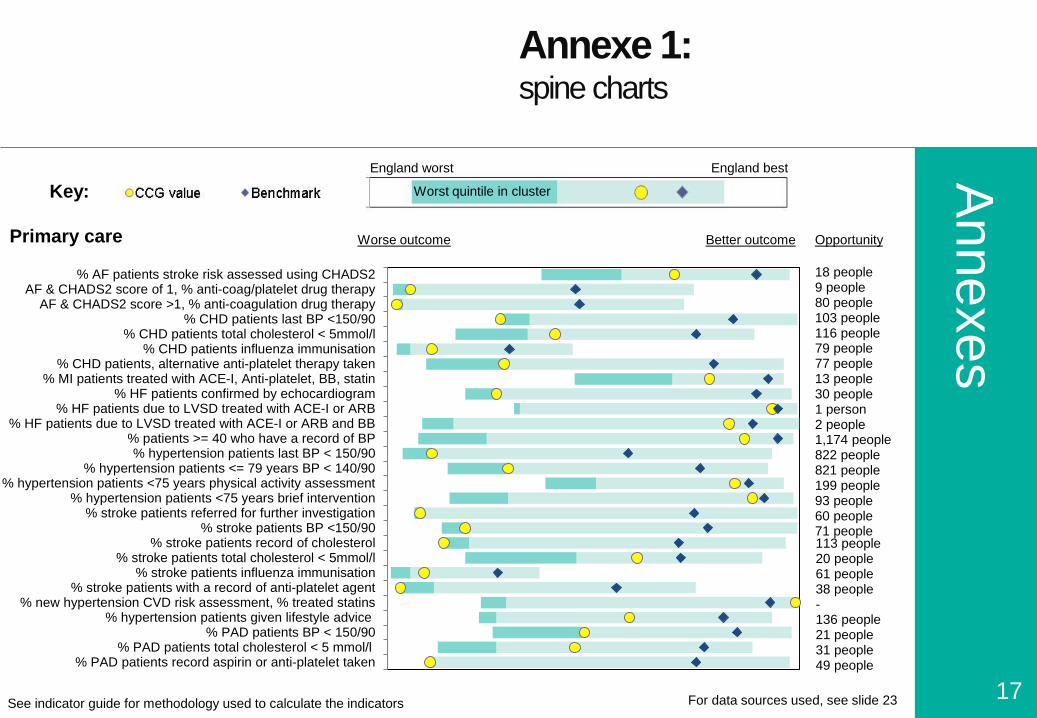
Annexes
Annexe 1 spine charts
17
For data sources used see slide 23
England worst England best
Worst quintile in cluster Key
Worse outcome Better outcome Opportunity Primary care
See indicator guide for methodology used to calculate the indicators
PAD patients record aspirin or anti-platelet taken PAD patients total cholesterol lt 5 mmoll
PAD patients BP lt 15090 hypertension patients given lifestyle advice
new hypertension CVD risk assessment treated statins stroke patients with a record of anti-platelet agent
stroke patients influenza immunisation stroke patients total cholesterol lt 5mmoll
stroke patients record of cholesterol stroke patients BP lt15090
stroke patients referred for further investigation hypertension patients lt75 years brief intervention
hypertension patients lt75 years physical activity assessment hypertension patients lt= 79 years BP lt 14090
hypertension patients last BP lt 15090 patients gt= 40 who have a record of BP
HF patients due to LVSD treated with ACE-I or ARB and BB HF patients due to LVSD treated with ACE-I or ARB
HF patients confirmed by echocardiogram MI patients treated with ACE-I Anti-platelet BB statin
CHD patients alternative anti-platelet therapy taken CHD patients influenza immunisation
CHD patients total cholesterol lt 5mmoll CHD patients last BP lt15090
AF amp CHADS2 score gt1 anti-coagulation drug therapyAF amp CHADS2 score of 1 anti-coagplatelet drug therapy
AF patients stroke risk assessed using CHADS2 18 people9 people80 people103 people116 people79 people77 people13 people30 people1 person2 people1174 people822 people821 people199 people93 people60 people71 people113 people20 people61 people38 people-136 people21 people31 people49 people
Annexes
Annexe 1 spine charts
18
For data sources used see slide 23
England worst England best
Worst quintile in cluster Key
Worse outcome Better outcome Opportunity Secondary care
See indicator guide for methodology used to calculate the indicators
CHD average female elective LOSCHD average male elective LOS
CHD female elective admissions (DSR)CHD male elective admissions (DSR)
CHD average cost per female elective admissionCHD average cost per male elective admission
CHD average female emergency LOSCHD average male emergency LOS
CHD female emergency admissions (DSR)CHD male emergency admissions (DSR)
CHD average cost per female emergency admissionCHD average cost per male emergency admission
CVD average female elective LOSCVD average male elective LOS
CVD female elective admissions (DSR)CVD male elective admissions (DSR)
CVD average cost per female elective admissionCVD average cost per male elective admission
CVD average female emergency LOSCVD average male emergency LOS
CVD female emergency admissions (DSR)CVD male emergency admissions (DSR)
CVD average cost per female emergency admissionCVD average cost per male emergency admission -
-125 admissions64 admissions--pound155K pound22K --443 bed days616 bed days--54 admissions25 admissions-42 bed dayspound122K pound4K -15 admissions
110 bed days41 bed days
Annexes
Annexe 1 spine charts
19
For data sources used see slide 23
England worst England best
Worst quintile in cluster Key
Secondary care continued Worse outcome Better outcome Opportunity
See indicator guide for methodology used to calculate the indicators
CABG procedures female (LOS)CABG procedures male (LOS)
CABG procedures female (DSR)CABG procedures male (DSR)
CABG procedures female average costCABG procedures male average cost
Angioplasty procedures female LOSAngioplasty procedures male LOS
Angioplasty procedures female (DSR)Angioplasty procedures male (DSR)
Angioplasty procedures female average costAngioplasty procedures male average cost
Angiography procedures female LOSAngiography procedures male LOS
Angiography procedures female (DSR)Angiography procedures male (DSR)
Angiography procedures female average costAngiography procedures male average cost pound145K
pound20K 3 procedures68 procedures--pound15K pound1K --2 bed days-pound20K pound5K 12 procedureslt1 procedure76 bed days17 bed days
Annexes
Annexe 1 spine charts
20
Social care
For data sources used see slide 23
England worst England best
Worst quintile in cluster Key
Worse outcome Better outcome Opportunity Secondary care continued
See indicator guide for methodology used to calculate the indicators
Heart Failure average female emergency LOS
Heart Failure average male emergency LOS
Heart Failure Female emergency admissions (DSR)
Heart Failure male emergency admissions (DSR)
Heart Failure average cost per female emergency admission
Heart Failure average cost per male emergency admission
Stroke average female emergency LOS
Stroke average male emergency LOS
Stroke female emergency admissions (DSR)
Stroke male emergency admissions (DSR)
Stroke average cost per female emergency admission
Stroke average cost per male emergency admission pound28K pound11K 39 admissions27 admissions-162 bed dayspound14K pound8K 55 admissions38 admissions23 bed days16 bed days
stroke patients discharged usual residence 54 patients
Annexes
Annexe 2 similar CCGs
21
The 10 most similar CCGs to NHS HARINGEY CCG are
NHS GREENWICH CCG
NHS CROYDON CCG
NHS LEWISHAM CCG
NHS WALTHAM FOREST CCG
NHS ENFIELD CCG
NHS BRENT CCG
NHS CITY AND HACKNEY CCG
NHS ISLINGTON CCG
NHS WANDSWORTH CCG
NHS BARKING AND DAGENHAM CCG
For information on the methodology used to calculate the 10 most similar CCGS
please go to
httpwwwenglandnhsukresourcesresources-for-ccgscomm-for-value
Annexes
Annexe 3 Statistical methodology
22
Statistical methodology
The methodology used in this pack consisted of the following steps
For each indicator
bull Data were ranked within the cluster
bull A benchmark value was calculated as the average of the top 5 ranked CCG
values
bull The opportunity that could be gained if the CCG were to improve to the
benchmark value was calculated
bull The worst quintile was identified as the worst 2 ranked values
bull If the indicator lay in the worst quintile then it was highlighted as a potential area
for investigation
For more information see indicator guide
This is a non-parametric statistical approach which was designed to be easy to
understand and interpret While the comparison does not necessarily prove
statistical significance it does provide a robust indication of the most promising
areas for further investigation
Annexes
Annexe 4 Data sources
23
Data sources used
bull Quality and Outcomes Framework (QOF) 201314 Copyright copy 2014 Re-
used with the permission of the Health and Social Care Information Centre
All rights reserved
bull Number of Patients registered at a GP practice ndash April 2013 Copyright copy
2014 Re-used with the permission of the Health and Social Care
Information Centre All rights reserved
bull Modelled estimates of prevalence December 2011 East of England Public
Health Observatory
bull Mid-2012 Population Estimates for Clinical Commissioning Groups Office
for National Statistics (ONS) copy Crown Copyright 2014
bull Hospital Episode Statistics (HES) 201213 Copyright copy 2014 Re‐used
with the permission of The Health and Social Care Information Centre All
rights reserved
bull Model-based estimates (based on Health Survey for England) 2006-08 and
200708
bull Integrated Household Survey 2012
bull Active people survey Sport England 2012
Annexes
Annexe 5 Glossary
24
AF Atrial fibrillation
BP Blood pressure
CABG Coronary artery bypass graft
CCG Clinical Commissioning Group
CHADS2 A method of calculating the risk of stroke in patients
with atrial fibrillation (AF)
CHD Coronary heart disease
CVD Cardiovascular disease
DSR Directly standardised rate
LOS Length of stay
LVSD Left ventricular systolic dysfunction
PAD Peripheral Arterial Disease
QOF Quality Outcomes Framework
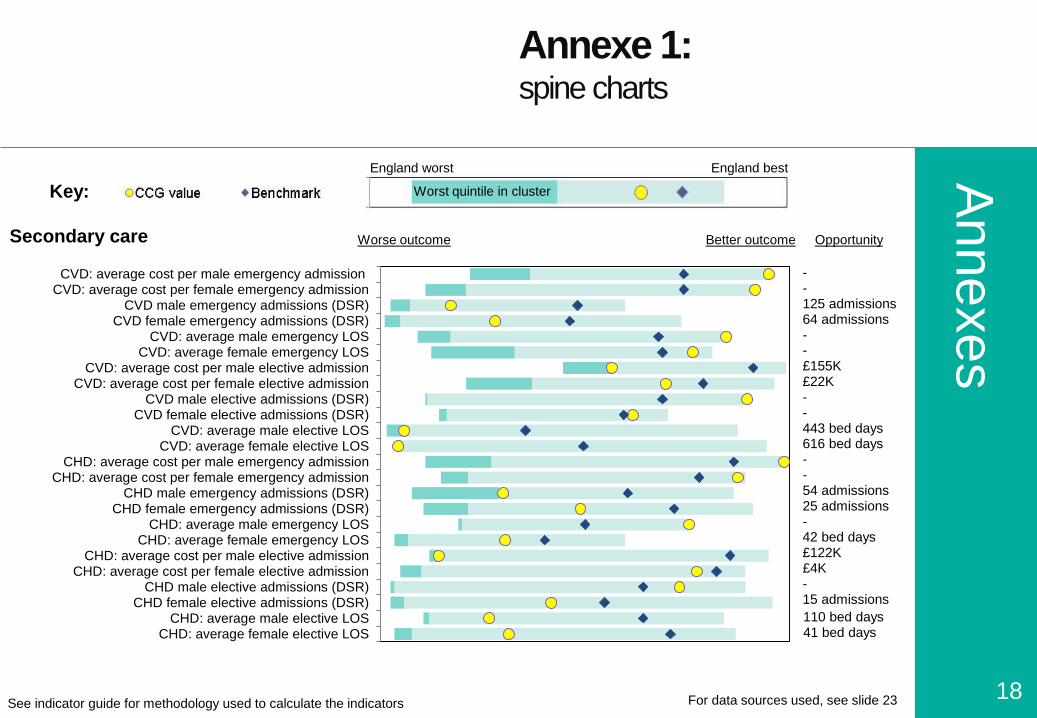
Annexes
Annexe 1 spine charts
20
Social care
For data sources used see slide 23
England worst England best
Worst quintile in cluster Key
Worse outcome Better outcome Opportunity Secondary care continued
See indicator guide for methodology used to calculate the indicators
Heart Failure average female emergency LOS
Heart Failure average male emergency LOS
Heart Failure Female emergency admissions (DSR)
Heart Failure male emergency admissions (DSR)
Heart Failure average cost per female emergency admission
Heart Failure average cost per male emergency admission
Stroke average female emergency LOS
Stroke average male emergency LOS
Stroke female emergency admissions (DSR)
Stroke male emergency admissions (DSR)
Stroke average cost per female emergency admission
Stroke average cost per male emergency admission pound28K pound11K 39 admissions27 admissions-162 bed dayspound14K pound8K 55 admissions38 admissions23 bed days16 bed days
stroke patients discharged usual residence 54 patients
Annexes
Annexe 2 similar CCGs
21
The 10 most similar CCGs to NHS HARINGEY CCG are
NHS GREENWICH CCG
NHS CROYDON CCG
NHS LEWISHAM CCG
NHS WALTHAM FOREST CCG
NHS ENFIELD CCG
NHS BRENT CCG
NHS CITY AND HACKNEY CCG
NHS ISLINGTON CCG
NHS WANDSWORTH CCG
NHS BARKING AND DAGENHAM CCG
For information on the methodology used to calculate the 10 most similar CCGS
please go to
httpwwwenglandnhsukresourcesresources-for-ccgscomm-for-value
Annexes
Annexe 3 Statistical methodology
22
Statistical methodology
The methodology used in this pack consisted of the following steps
For each indicator
bull Data were ranked within the cluster
bull A benchmark value was calculated as the average of the top 5 ranked CCG
values
bull The opportunity that could be gained if the CCG were to improve to the
benchmark value was calculated
bull The worst quintile was identified as the worst 2 ranked values
bull If the indicator lay in the worst quintile then it was highlighted as a potential area
for investigation
For more information see indicator guide
This is a non-parametric statistical approach which was designed to be easy to
understand and interpret While the comparison does not necessarily prove
statistical significance it does provide a robust indication of the most promising
areas for further investigation
Annexes
Annexe 4 Data sources
23
Data sources used
bull Quality and Outcomes Framework (QOF) 201314 Copyright copy 2014 Re-
used with the permission of the Health and Social Care Information Centre
All rights reserved
bull Number of Patients registered at a GP practice ndash April 2013 Copyright copy
2014 Re-used with the permission of the Health and Social Care
Information Centre All rights reserved
bull Modelled estimates of prevalence December 2011 East of England Public
Health Observatory
bull Mid-2012 Population Estimates for Clinical Commissioning Groups Office
for National Statistics (ONS) copy Crown Copyright 2014
bull Hospital Episode Statistics (HES) 201213 Copyright copy 2014 Re‐used
with the permission of The Health and Social Care Information Centre All
rights reserved
bull Model-based estimates (based on Health Survey for England) 2006-08 and
200708
bull Integrated Household Survey 2012
bull Active people survey Sport England 2012
Annexes
Annexe 5 Glossary
24
AF Atrial fibrillation
BP Blood pressure
CABG Coronary artery bypass graft
CCG Clinical Commissioning Group
CHADS2 A method of calculating the risk of stroke in patients
with atrial fibrillation (AF)
CHD Coronary heart disease
CVD Cardiovascular disease
DSR Directly standardised rate
LOS Length of stay
LVSD Left ventricular systolic dysfunction
PAD Peripheral Arterial Disease
QOF Quality Outcomes Framework
Annexes
Annexe 2 similar CCGs
21
The 10 most similar CCGs to NHS HARINGEY CCG are
NHS GREENWICH CCG
NHS CROYDON CCG
NHS LEWISHAM CCG
NHS WALTHAM FOREST CCG
NHS ENFIELD CCG
NHS BRENT CCG
NHS CITY AND HACKNEY CCG
NHS ISLINGTON CCG
NHS WANDSWORTH CCG
NHS BARKING AND DAGENHAM CCG
For information on the methodology used to calculate the 10 most similar CCGS
please go to
httpwwwenglandnhsukresourcesresources-for-ccgscomm-for-value
Annexes
Annexe 3 Statistical methodology
22
Statistical methodology
The methodology used in this pack consisted of the following steps
For each indicator
bull Data were ranked within the cluster
bull A benchmark value was calculated as the average of the top 5 ranked CCG
values
bull The opportunity that could be gained if the CCG were to improve to the
benchmark value was calculated
bull The worst quintile was identified as the worst 2 ranked values
bull If the indicator lay in the worst quintile then it was highlighted as a potential area
for investigation
For more information see indicator guide
This is a non-parametric statistical approach which was designed to be easy to
understand and interpret While the comparison does not necessarily prove
statistical significance it does provide a robust indication of the most promising
areas for further investigation
Annexes
Annexe 4 Data sources
23
Data sources used
bull Quality and Outcomes Framework (QOF) 201314 Copyright copy 2014 Re-
used with the permission of the Health and Social Care Information Centre
All rights reserved
bull Number of Patients registered at a GP practice ndash April 2013 Copyright copy
2014 Re-used with the permission of the Health and Social Care
Information Centre All rights reserved
bull Modelled estimates of prevalence December 2011 East of England Public
Health Observatory
bull Mid-2012 Population Estimates for Clinical Commissioning Groups Office
for National Statistics (ONS) copy Crown Copyright 2014
bull Hospital Episode Statistics (HES) 201213 Copyright copy 2014 Re‐used
with the permission of The Health and Social Care Information Centre All
rights reserved
bull Model-based estimates (based on Health Survey for England) 2006-08 and
200708
bull Integrated Household Survey 2012
bull Active people survey Sport England 2012
Annexes
Annexe 5 Glossary
24
AF Atrial fibrillation
BP Blood pressure
CABG Coronary artery bypass graft
CCG Clinical Commissioning Group
CHADS2 A method of calculating the risk of stroke in patients
with atrial fibrillation (AF)
CHD Coronary heart disease
CVD Cardiovascular disease
DSR Directly standardised rate
LOS Length of stay
LVSD Left ventricular systolic dysfunction
PAD Peripheral Arterial Disease
QOF Quality Outcomes Framework

Annexes
Annexe 5 Glossary
24
AF Atrial fibrillation
BP Blood pressure
CABG Coronary artery bypass graft
CCG Clinical Commissioning Group
CHADS2 A method of calculating the risk of stroke in patients
with atrial fibrillation (AF)
CHD Coronary heart disease
CVD Cardiovascular disease
DSR Directly standardised rate
LOS Length of stay
LVSD Left ventricular systolic dysfunction
PAD Peripheral Arterial Disease
QOF Quality Outcomes Framework