clinical assessment of hand-arm … j. med. sci. 57 (suppi.). 27 - 41, 1994 clinical assessment of...
TRANSCRIPT
Nagoya J. Med. Sci. 57 (SuppI.). 27 - 41, 1994
CLINICAL ASSESSMENT OF HAND-ARMVIBRATION SYNDROME
PETER L. PELMEAR1 and ROBERT KUSIAK2
J Department of Occupational and Environmental Health, St. Michael's Hospital, Toronto, Ontario,Canada, 2Health and Safety Policy Branch, Ministry of Labour, Toronto, Ontario, Canada
ABSTRACT
The clinical assessment of patients thought to be suffering from hand-arm vibration syndrome (HAYS)requires the use of multiple vascular and sensory tests. In a family physician's office, Adson's, Allen's andcold water immersion of the hands are the only feasible vascular tests, while the sensory tests have to belimited to assessing impairment of skin sensitivity and manipulative dexterity. This paper reviews the laboratory tests deemed to be useful in a hospital or clinic facility, and reports on the investigation of 364 patientsexposed to hand-arm vibration who were examined in Toronto, Canada during the period 1989-92. A statistical clustering algorithm was used to categorise 138 male subjects according to the results of their diagnostic tests. From the cluster analysis, four vascular and four sensorineural categories of impairment were recognised in patients suffering from HAYS. The Stockholm vascular classification stages and the four vascularclusters were found to correspond. The Stockholm sensorineural classification (Stages 1, 2, and 3) correlatedwith clusters formed from the sensory tests evaluating the sensitivity of the nerve endings and the distal digital branches of the median and ulnar nerves. When the myelinated nerve fibres were affected, as detected byabnormal Tinel's, Phalen's, and nerve conduction tests, an additional cluster group emerged. The subjectswith abnormal nerve conduction test results constituted a distinct group with increased impairment, so thereis a need for them to be categorised separately i.e. as a Stage 4. It is suggested that a Stage 4 be included inthe Stockholm sensorineural classification.
Key words: Hand-arm vibration syndrome, Stockholm classification, Clinical assessment, Clinical tests
INTRODUCTION
The diagnosis of hand-arm vibration syndrome (HAVS) is based initially on a history of
hand-arm vibration (HAV) exposure and the exclusion of other causes of Raynaud's phenome
non i.e. Primary Raynaud's phenomenon (Raynaud's disease or constitutional white finger), and
Secondary Raynaud's phenomenon from local trauma to the digital vessels, thoracic outlet syn
drome, drugs, peripheral vascular disease, and collagen diseases, including scleroderma. The di
agnosis of HAVS is confirmed and the severity assessed by stage from the results of laboratorytests. 1-4)
In a family physician's office, the only feasible vascular tests are (1) Adson's,5) to determine
thoracic outlet obstruction (2) A1len's,6) to check the effectiveness of the circulation in the
superficial and deep palmer arches, and (3) immersion of the hands in cold water to stimulate
blanching. Often the latter will be unsuccessful because central body cooling is usually required
in addition to hand cooling. The sensory tests which are feasible for the family physician to use
to detect diminished skin sensitivity are pin prick, cotton wool, or monofilament hairs (von Frey
or Semmes-Weinstein); together with callipers for two-point discrimination.
To confirm the diagnosis and grade the severity, sophisticated tests in clinics or hospital
Correspondence: Dr. Peter L. Pelmear, Department of Occupational & Environmental Health, St. Michael's
Hospital, 30 Bond Street, Toronto, Ontario M5B 1W8, Canada
27

28
P.L. Pelmear et al.
departments will be required. The vascular tests should include most or all of the following, i.e.Doppler and Duplex studies (to check the patency and the blood pressure ratios in the peripheral vessels), plethysmography (to evaluate the pulse waves before and after cold stress), fingersystolic pressure measurement (to compare the blood pressure of an affected digit pre- andpost-cold stress with the thumb, which is not usually affected), and cold water provocation tests(immersion of the digits in water for 2 to 10 minutes with recording of skin temperature) to noteany reactive hyperaemia while immersed, and delay in recovery afterwards.
The sensorineural tests should include depth sense and two-point discrimination using vonFrey or Semmes-Weinstein monofilament hairs, callipers, or plastic blocks with split levels andwidening grooves,?) and one or more of the following subjective tests i.e. (1) finger tip vibrationthreshold measurement (8 to 500 Hz with vibrometer instrumentation8)), (2) thermal hot/coldperception (using Minnesota thermal discs9) or instrumentation lO)), and (3) current perceptionthreshold (detection of a 0 to 10 milliamperes current at 5, 250 and 200 Hz!I)). Objective nerveconduction tests12
) should be undertaken to confirm the presence and severity of the neuropathy, which in HAVS patients often affects both median and ulnar nerves. I)
MATERIALS AND METHODS
A laboratory designated to the evaluation of the vascular and sensorineural effects of HAVon workers was established in Toronto, Ontario in 1988 and the case data has been entered in acomputer database. The medical assessment included completion of a history questionnaire; amedical examination of the upper torso, cardiovascular and central nervous systems; andmultiple clinical and laboratory tests (including urine and blood analyses to identify any systemicdiseases). The vascular test results included in the computer database were Adson's, Allen's,doppler pressure measurements (arms and digits), digital plethysmography (pre- and post-coldstress), Digimatic systolic pressures, and digit temperature recording (cooling to lOT for 10minutes). The neurological test results recorded included two-point and depth sense aesthesiometry, grip strength, vibrotactile sensation, current perception neurometry, and nerve conduction latency and velocity. For each subject, the type of tools used, the mean vibration levels, andthe exposure time were recorded.
METHODOLOGY
A Stockholm staging (history) for each hand, based upon the history information alone, wasrecorded. Following a review of all the test results the hand severity impairment was regradedand the Stockholm staging (diagnostic) was recorded.
Adson's testS) was conducted in the traditional manner with the head rotated to both sides todetermine thoracic outlet obstruction, also Allen's test6) to evaluate arterial circulation at or distal to the wrist.
Photocell Plethysmography - tracings from all digits of both hands were obtained in thewarm state, and the test was repeated following 2 minutes immersion in water at lOT. The tracings are interpreted as showing abnormality (mild, moderate, severe) or no abnormality pre- andpost-cold stress.
Finger Systolic Pressure (FSP) Test - this test was performed according to the proceduresuggested by Nielsen and Lassen. 13) The blood pressure of the middle or worst finger was recorded at 30T, then again following 5 minutes ischaemia at lOT. The reference digit used was
29
CLINICAL ASSESSMENT OF VIBRATION SYNDROME
the thumb. A FSP%lQ of 60% or less was used as the discriminating threshold between normaland abnormal as suggested by Bovenzi. 14) If the result was normal at room temperature the patient was wrapped in a cooling blanket at lOT for 15 minutes and the test repeated.
Cold Water Immersion Test - thermocouples were attached to the tips of each digit to record the threshold skin temperatures for 5 minutes. The hands were then immersed in a coldwater bath for 10 minutes and a sphygmomanometer was inflated around each wrist for the initial 5 minutes. In order to monitor reaction while immersed and during the recovery phase, theskin temperatures of the digits were recorded throughout the immersion period and for a further15 minutes following immersion. The data from the thermocouples was continuously recordedusing a portable temperature recorder, and a digital computer output with graphs was producedfor analysis. In the normal subject after the sphygmomanometer cuff is released, there is a reactive hyperaemia while immersed, and rapid recovery following immersion. As vasospasm to coldincreases in severity there is less hyperaemic reaction, and recovery is increasingly prolonged. 15)
All the following sensory tests were conducted after a vibration free interval of 16 hours.Depth sense aesthesiometry and two-point discrimination was conducted using the technique ofCarlson et a1..7) Grip strength was measured by means of a dynamometer. Tinel'sI6) andPhalen's!?) tests were used to detect median nerve compression neuropathy.
Vibrotactile Perception Threshold Test - this test was conducted using a Bruel & Kjaer Vibrometer type 1800/WH 1763 with hand switch. The 5 mm tip was counterbalanced so as toexert a uniform pressure of 0.5 Newtons on the test finger (middle) and the perception threshold at the 8, 16,31.5,65, 125,250, and 500 Hz frequencies was recorded using the techniqueadvised by the manufacturer and Lundborg et al.. 18)
Current Perception Threshold Test - using a neurometer (supplied by Neurotron Inc., Baltimore, Maryland.) and the method described by Katims et al.,!9) a constant alternating current ofo to 10 rnA intensity at 5, 250 and 2000 Hz was transmitted to the index and little fingers ofboth hands to determine the detection threshold. Normative values are used for a computerizedmethod of grading the severity of any median and ulnar nerve neuropathy. 20)
Nerve Conduction Test - the electrodiagnostic tests were conducted with a TECA TD5Electromylograph using a standard protocol. The latency of the sensory and motor componentsof the median and ulnar nerves was· determined across the wrist, then the motor latency fromabove the elbow. Subsequently, the motor conduction velocity in the forearms was derived. Theresults reflect the state of the largest most rapidly conducting myelinated fibres, both motor andsensory.
SUBJECf SELECfION AND ANALYSIS
The results obtained from 364 subjects examined during the period 1989-1992 have beenanalysed. All subjects who had been exposed to significant hand-arm vibration away from work;who had suffered significant injuries or disease - cardiovascular, neurological, rheumatoid, connective tissue, Dupuytren's contracture, or constitutional white finger (Raynaud's disease); thoseon cardiovascular medication; those who had the cold water immersion test prior to the use ofthe portable temperature recorder in February 1990; or who were female were excluded, leaving173 men available for analysis.
The current perception threshold test was introduced as an additional sensory test in October1990, much later than the others, so the cluster analysis of the sensory test results do not includethese results. For the cluster analysis by the SAS FASTCLUS procedure, the results from eachhand were used separately. The diagnostic tests were normalised to have means of zero and

30
P.L. Pelmear et al.
standard deviations of one before being used in the FASTCLUS procedure. The cluster analysiswas used to determine how many clusters could be found utilizing the vascular test results alone,and the sensorineural test results alone in each hand. To be included in a cluster each subjectwas required to have a complete set of vascular or sensory test results. For this reason the subject totals varied slightly between hands and clusters. As part of the cluster analysis, a discriminant analysis was done to confirm the results of the cluster analysis. The discriminant analysiscalculated weighted sums of the results of the diagnostic tests which could be used to determinethe cluster to which a subject should be assigned.
RESULTS
The agreement between the history and diagnostic Stockholm staging in this group of subjects, as reported elsewhere!) was low. For the vascular component, agreement was 35% and thehistory staging was more severe than the diagnostic staging in 39%. For the sensorineural component, the corresponding percentages were 37% and 17% respectively.
The results of the cluster analysis show that the subjects could be classified, utilizing the vascular tests, into four clusters with the right hand data and three with the left. Using the sensorytests, four clusters were obtained with both hands. Tables l(a) and l(b) compare the vascularclusters with the Stockholm history (SH) and Stockholm diagnostic (SD) vascular staging in theseparate hands. The results for the hands combined reveal a strong correlation with the SD(p=4 X 10-11
) but not with the SH stages (p=0.3). Tables 2(a) and 2(b) compare the sensoryclusters with the SH and SD sensorineural staging. Similarly, there is a strong correlation between the sensory clusters and the SD (p=3 X 10-14
), and unlike the vascular clusters there is acorrelation with the SH stages (p=9 X 10⁻⁸). The totals in Tables 1 and 2 differ because theanalysis was restricted, as mentioned earlier, to those subjects having complete sensory or vascular test results.
Tables 3(a) and (b) compare the vascular and sensory clusters for the right and left hands. Acorrelation between these two categories could not be found for the right hand (p=OA) or bothhands combined (p=0.2), although a weak correlation may be present in the left hand (p=0.04).It must be appreciated that the subjects in the vascular cluster 1 differ from the subjects in thesensory cluster 1, and this applies to the other clusters as well. For example, although 68 men invascular clusters 2 and 4 suffered severe vascular effects (Table 3(a)) only 14 of the 68, the menin sensory clusters 3 and 4, suffered severe sensory effects.
Table 4 compares the temperature changes in degrees centigrade at 3 minutes following immersion in the cold water bath, for the middle finger in both hands by vascular cluster. Since theright hand has a cluster at 140C which does not have a corresponding cluster in the left hand, itappears that in this series of cases the left hand has suffered more vascular impairment than theright. As can be seen from the Table, for each cluster the remaining mean temperature changesin the right and left hands compare well.
In general, the data analysis shows that the mean sensory test values of the sensory clusters ofthe right and left hands correspond. Table 5 compares the vibrometer means for low (8 to 125Hz) and high (250 and 500 Hz) frequency groupings. In both the low and high frequencygroups, the mean vibrometer thresholds in the left and right hands are very similar for the menwho are mildly, severely and very severely affected. In the moderately affected men, the meanvibrometer scores for both the low and high frequency groups appear to be lower for the lefthand. It also appears that the low frequency vibrometer thresholds for the left hand define fourdistinct degrees of sensory impairment. In the high frequency group in the left hand and in both

31
CLINICAL ASSESSMENT OF VIBRATION SYNDROME
Table l(a). Comparison of vascular clusters with Stockholm History and Diagnostic Vascular Stagings - right
hand.
34
10
17
48
109
TotalSeverity
(Vascular Verycluster) severe
(4)
Mild 0 4 5(1)
Moderate 0 5 2(3)
Severe 0 16 7 10(2)
Very severe 0 9 5 14(4)
Total 0 35 17 34
Chi-square for test of no association between vascular clusters and Stockholm history vascular staging is 5.2 on
9 degrees of freedom, P=0.8.
34
10
17
48
109
TotalSeverity
(Vascular Verycluster) severe
(4)
Mild 0 2 0(1)
Moderate 0 6 0 0(3)
Severe 0 8 34 2(2)
Very severe 0 0 10 15(4)
Total 0 15 62 21
Chi-square for test of no association between vascular clusters and Stockholm history vascular staging is 59.6 on
9 degrees of freedom, P=2X 10⁻⁹•
frequency groups in the right hand, there are only 3 distinct sensory impairment groups.Tables 6(a) and 6(b) compare the current perception test thresholds for the median and ulnar
nerves at 2000, 250 and 5 Hz. It should be noted, as stated earlier, that this test was not included in the analysis for the cluster group separation. When the clusters are ranked by themean total score for each nerve, they have the same severity ranking order as the sensory

32
P.L. Pelmear eta!'
Table 1(b). Comparison of vascular clusters with Stockholm History and Diagnostic Vascular Stagings - left
hand.
Severity(Vascularcluster)
Moderate(1)
Severe(2)
Very severe(3)
Total
Total
16
51
43
110
Chi-square for test of no association between vascular clusters and Stockholm history vascular staging is 4.8 on
6 degrees of freedom, P=0.6.
43
51
16
110
TotalSeverity
(Vascular Verycluster) (0) severe
(4)
Moderate 0 7 0(1)
Severe 0 5 36 3(2)
Very severe 0 2 17 16(3)
Total 0 14 62 23
Chi-square for test of no association between vascular clusters and Stockholm history vascular staging is 34.1 on
6 degrees of freedom, P=6xlO-6•
clusters derived from the other sensory tests. At the higher frequencies the mean severity scorescorrespond to the severity of sensory impairment with both the median and ulnar nerves. But atthe low frequency (5 Hz) the mean severity scores appear to be weakly related to the sensoryclusters.
Table 7 compares the cluster groupings at 250 Hz thresholds for the vibrometer and currentperception tests. The vibrometer thresholds for the median nerve appear to correlate well withthe current perception scores. This is less so with the ulnar nerve.
Table 8 compares the clusters by nerve conduction latencies. This test clearly identifies as adistinct group the most severely affected subjects, i.e. a cluster 4.

33
CLINICAL ASSESSMENT OF VIBRATION SYNDROME
Table 2(a). Comparison of sensory clusters with Stockholm History and Diagnostic Sensorineural Stagings
right hand.
14
18
38
68
138
TotalSeverity(Sensory Verycluster) (0) severe
(X)
Mild 0 13 4(2)
Moderate 0 2 40 10(1 )
Severe 0 0 3 4(3)
Very severe 0 0 3 5(4)
Total 0 8 37 69
Chi-square for test of no association between sensory clusters and Stockholm history sensorineural staging is
23.5 on 9 degrees of freedom, P=0.005.
Severity(Sensorycluster)
Mild(2)
Moderate(1)
Severe(3)
Very severe(4)
Total
Total
38
68
18
14
138
Chi-square for test of no association between sensory clusters and Stockholm history sensorineural staging is
30.7 on 9 degrees of freedom, P=0.0003.
Table 9 compares the clusters by grip strength, and the clusters correspond in order of severity with all the sensory tests, except nerve conduction latency.
DISCUSSION
The evaluation of HAV exposed subjects and their grading according to the Stockholm
34
P.L. Pelmear et al.
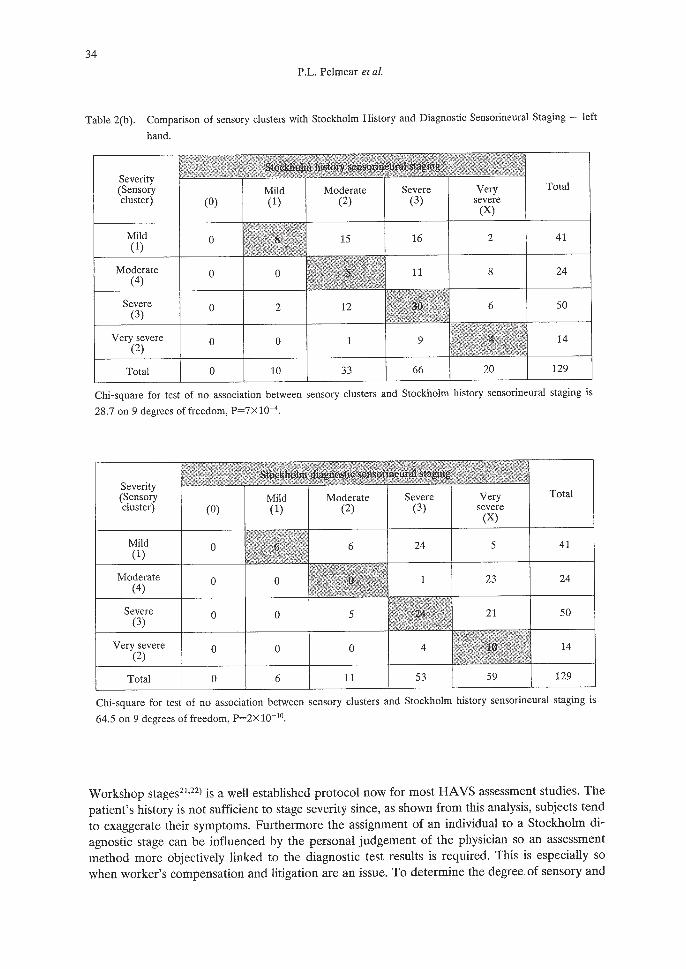
Table 2(b). Comparison of sensory clusters with Stockholm History and Diagnostic Sensorineural Staging - left
hand.
14
50
24
41
129
TotalSeverity(Sensory Verycluster) (0) severe
(X)
Mild 0 16 2(1)
Moderate 0 0 11 8(4)
Severe 0 2 6(3)
Very severe 0 0 9(2)
Total 0 10 33 66
Chi-square for test of no association between sensory clusters and Stockholm history sensorineural staging is
28.7 on 9 degrees offreedom, P=7xlO-4•
Severity(Sensorycluster)
Mild(1)
Moderate(4)
Severe(3)
Very severe(2)
Total
Total
41
24
50
14
129
Chi-square for test of no association between sensory clusters and Stockholm history sensorineural staging is
64.5 on 9 degrees of freedom, P=2x 10⁻¹⁰•
Workshop stages21 ,22) is a well established protocol now for most HAVS assessment studies, Thepatient's history is not sufficient to stage severity since, as shown from this analysis, subjects tendto exaggerate their symptoms. Furthermore the assignment of an individual to a Stockholm diagnostic stage can be influenced by the personal judgement of the physician so an assessmentmethod more objectively linked to the diagnostic test results is required. This is especially sowhen worker's compensation and litigation are an issue. To determine the degree of sensory and

35
CLINICAL ASSESSMENT OF VIBRATION SYNDROME
Table 3(a). Comparison of vascular and sensory clusters - right hand.
Severity(Vascularcluster)
Mild(2)
Moderate(1)
Mild(1 )
4
8
Moderate(3)
3
Severe(2)
17
17
Verysevere
(4)
5
15
Total
27
43
Severe(3)
Very severe(4)
Total
2
15
2
7
12
8
90
Chi-square for test of no association between sensory and vascular clusters is 9.2 on 9 degrees of freedom,
P=O.4.
Table 3(b). Comparison of vascular and sensory clusters - left hand.
Severity(Vascularcluster)
Mild(1 )
Moderate(1)
6
Severe(2)
14
Verysevere
(3)
14
Total
34
Moderate(4)
Severe(3)
Very severe(2)
Total
10
33
9
86
Chi-square for test of no association between sensory and vascular cluster is 13.4 on 6 degrees of
freedom, P=0.04.
vascular impairment it is preferable to reference the results of tests. The mean values of tests inthe vascular and sensory clusters could be used for this purpose. The cluster analysis, as used inthis study, permits the objective separation of individuals based upon their individual and collective diagnostic test results.
The results from the analysis clearly indicate that significantly different categories (clusters) of

36
P.L. Pelmear et al.
Table 4. Comparison of vascular clusters by mean temperature change in degrees centigrade at 3 minutes follow
ing immersion - middle fingers.
Hand
Right
Left
Mild
14T
Moderate
12'C
l1'C
Severe
6'C
7'C
Verysevere
3'C
4T
Table 5. Comparison of sensory clusters by mean of thresholds at low frequencies (8 to 125 Hz) and at high fre
quencies (250 and 500 Hz).
Hand & frequency Mild Moderate Severe Very(R2/Ll) (Rl/IA) (R4/L3) severe
(R3/L2)
Right Low 111.1 129.0 131.0 141.6
Left Low 111.8 117.5 131.1 141.4
Right High 122.4 149.0 153.6 155.6
Left High 124.8 140.7 152.4 155.4
Key: R = right hand
L = left hand
1 to 4 = cluster
subjects suffering from HAVS exist. When separated into two groups, vascular and sensory, fourcluster groups differing in rank order emerged with each group of tests. The mean values of thediagnostic tests in the vascular test and sensory test clusters differed between the two groupings,as did the order of severity.23) For example, in the sensory group clusters, the temperaturechanges of the middle finger three minutes after removal from the cold water bath were similar(p=O.8), while for the vascular group clusters they were markedly different (p < 10-5).23) Thisconfirms that although there is an association between the vascular and sensorineural components of HAVS, the two components appear to both occur and progress independently of eachother.
Another result from the analysis is that, within the vascular and sensory group clusters, theorder of severity of the clusters differed between the different tests. The ranking order in thedepth sense, two-point, current perception, vibrometer and grip strength tests was found to becomparable (Tables 5, 6, 7 and 9) in order of increasing severity in the respective hands i.e.clusters 2,1+4,3 right hand, and 1,4,3,2 left hand. Thus this group of tests would seem to beevaluating impairment and severity on the same basis. If the sensory cluster analysis had beenlimited to these tests, the number of clusters would have been no more than three. However

37
CLINICAL ASSESSMENT OF VIERATION SYNDROME
Table 6(a). Median nerve - comparison of sensory clusters by mean current perception hypoesthesia severity
score.
p values
Frequency Mild Moderate Severe Very (R/L)(R2IL4) (RlILl) (R4/L3) severe
(R3/L2)
2000 Hz 1.07/0.72 1.50/0.54 1.35/1.39 1.86/2.27 0.4/8xlO-4
250 Hz 0.41/0.72 1.80/0.92 1.31/1.56 2.21/1.91 5xlO-4/0.06
5 Hz 0.96/1.28 0.50/1.58 1.25/1.42 1.86/2.00 0.3/0.6
Totals 2.44/2.72 3.80/3.04 3.91/4.37 5.93/6.18 7xlO-3/O.02
Key: R = right hand
L = left hand
1 to 4 = cluster
Table 6(b). Ulnar nerve - comparison of sensory clusters by mean current perception hypoesthesia severity
score.
p values
Frequency Mild Moderate Severe Very (R/L)(R2/Ll) (RlIL4) (R4/L3) severe
(R3/L2)
2000 Hz 0.26/0.29 0.82/0.67 0.80/1.07 1.57/2.18 9x 1O-3/2X 10-4
250 Hz 0.59/0.63 1.12/0.89 1.50/1.59 2.07/1.91 0.02/0.03
5 Hz 1.11/1.33 1.2211.11 1.30/1.73 2.00/1.91 0.210.4
Totals 1.9612.25 3.16/2.67 3.60/4.39 5.64/6.00 2xlO-3/O.01
Key: R = right hand
L = left hand
1 to 4 = cluster
when the sensory nerve conduction (latency) test (Table 8) is incorporated, a more severe cluster 4 emerges. This test strongly influences the ranking order of subjects in the right hand whenall the sensory tests are included. The ranking order now becomes 2,1,3,4 in the right hand,while in the left the ranking order remains the same. The inclusion of nerve conduction tests inthe cluster analysis clearly shows that the tests designed to evaluate the function of myelinatednerve fibres add a new dimension to the sensorineural grading, thus indicating the need for aforth sensory category.
It is usual when evaluating the merits of clinical tests to consider sensitivity and specificity.The usual gold standard is the presence or absence of disease. In respect to HAVS there are

38
P.L. Pelmear et al.
Table 7. Comparison of sensory clusters at 250 Hz - current perception and vibrometer.
VibrometerdB
250 Hz
CurrentPerception
score
250 Hz
CurrentPerception
score
250 Hz
Key: R = right hand
L = left hand
1 to 4 = cluster
117/118
0.41/0.72
0.59/0.63
146/134
1.25/0.91
1.12/0.89
Severe(R4/L3)
151/151
1.50/1.56
1.50/1.59
Verysevere
(R3/L2)
155/154
1.86/2.27
2.07/1.91
p values
< 10-51 < 10-5
p values
5xlO-4/0.06
p values
0.02/0.03
grades of severity which are identified by the different tests. Hence the sensitivity and specificityof a specific test will depend on the severity grade e.g. plethysmography is highly sensitive andspecific for early vascular impairment,1) whereas Digimatic systolic pressure and nerve conduction tests are highly sensitive and specific only in the severe stages. These issues will be considered in a further paper.
CONCLUSION
1. By the use of cluster analysis, four vascular and four sensorineural categories of impairment can be recognised in patients suffering from HAVS.
2. There is an association between the Stockholm diagnostic stages and the clusters found inthis survey for both vascular and sensory effects. The vascular stages and clusters correspondwell, and it appears that the Stockholm vascular classification Stages 1, 2, 3, and 4 equate to thediagnostic vascular clusters 1, 3, 2,4 (Tables l(a) and (b)). Although it is more difficult to equate four sensory clusters and three sensorineural Stockholm stages (Tables 2(a) and (b)), there is

39
CLINICAL ASSESSMENT OF VIBRATION SYNDROME
Table 8. Comparison of sensory clusters by nerve conduction latencies.
MotorLatencym. secs
MotorLatencym. secs
SensoryLatencym. sees
Key: R = right hand
L = left hand
1 to 4 = cluster
3.5/3.3
2.6/2.47
3.1/2.99
3.7/3.6
2.6/2.49
3.2/3.12
3.7/3.7
2.6/2.52
3.213.15
5.3/4.2
3.0/2.83
4.1/3.77
p values
< 10-5/ <10-5
p values
p values
<10-5 / <10-5
Table 9. Comparison of sensory clusters by grip strength.
GripStrength
48.1/47.95 44.9/46.98 42.1/42.32
p values
32.3/22.32 5xlO-4 / < 10-5
an association between them. It appears that the Stockholm sensorineural classification Stages 1,2, 3 equate to clusters formed from all the sensory tests evaluating the sensitivity of the nerveendings and the distal digital branches of the median and ulnar nerves.
3. When the myelinated nerve fibres are affected as detected by abnormal Tinel's, Phalen's,and nerve conduction tests, an additional cluster group emerges (Table 8). The subjects with

40
CLINICAL ASSESSMENT OF VIBRATION SYNDROME
abnormal nerve conduction test results constitute a distinct group with further sensorineural impairment. A Stage 4 SN (noted as X in Table 2(a) and (b» is suggested, requiring a revision ofthe Stockholm sensorineural classification.
4. The outcome of the analysis of this survey confirms that multiple tests are required todetermine the severity of HAYS. The data obtained in this survey shows that both vascular andsensory changes occur in subjects with HAYS. Each component may occur and progress independently.
REFERENCES
1) Pelmear, P.L., Wong, L. and Dembek, B.: Laboratory tests for the evaluation of Hand-arm Vibration Syndrome. In Proceedings 6th International Conference on Hand-Arm Vibration, edited by Dupuis, H., Christ,E., Sandover, D.1., Taylor, W. and Okada, A., pp.817-827 (1993), Hauptverband der gewerblichen Berufsgenossenschaften, Sankt Augustin, Germany.
2) Pelmear, P.L. and Taylor, W.: Hand-arm Vibration Syndrome - Clinical evaluation. J. Occup. Med., 33(11),1144-1149 (1991).
3) Pelmear, P.L. and Taylor, W.: Clinical evaluation. In Hand-Arm Vibration: A Comprehensive Guide, editedby Pelmear, P.L., Taylor, W. and Wasserman, D.E., pp.77-91 (1992), Van Nostrand Reinhold, New York.
4) McGeoch, K.L., Taylor, W. and Gilmour, W.H.: The use of objective tests as an aid to the assessment ofHand-arm Vibration Syndrome by the Stockholm classification. In Proceedings 6th International Conferenceon Hand-Arm Vibration, edited by Dupuis, H., Christ, E., Sandover, D.1., Taylor, W. and Okada, A.,pp.783-792 (1993), Hauptverband der gewerblichen Berufsgenossenschaften, Sankt Augustin, Germany.
5) Adson, A.W.: Surgical treatment for symptoms produced by cervical ribs and the scalenus anticus muscle.Surg. Gynecol. Obstet., 85, 687-700 (1947).
6) Ashbell, T.S., Kutz, J.E. and Kleinert, H.E.: The digital Allen test. Plast. Reconstr. Surg., 39, 311-312(1967).
7) Carlson, W.S., Samueloff, S., Taylor, W. and Wasserman, D.E.: Instrumentation for measurement of sensoryloss in the fingertips. J. Occup. Med., 21(4), 260-264 (1979).
8) Lundborg, G., Lie-Stenstrom, A., Sollerman, C, Stroberg, T. and Pyykko I.: Digital vibrogram: A new diagnostic tool for sensory testing in compression neuropathy. J. Hand Surgery, 11A(5), 693-699 (1986).
9) Dyck, P.1., Curtis, D.1., Bushek, W. and Offord, K.: Description of Minnesota thermal dices and normalvalues of thermal discrimination in man. Neurology, 24(4), 325-330 (1974).
10) Ekenvall, L., Nilsson, B.Y. and Gustavsson, P.: Temperature and vibration thresholds in vibration syndrome.Br. J. Ind. Med., 43, 825-829 (1986).
11) Katims, J.1., Naviasky, E.H., Rendell, M.S., Ng, L.K.Y. and Bleecker, M.L.: New screening device for assessment of peripheral neuropathy. J. Occup. Med., 28(]2), ]2]9-1221 (]986).
]2) Araki, S., Yokoyama, K., Aono, H. and Murata, K.: Determination of the distribution of nerve conductionvelocities in chain saw operators. Br. J. Ind. Med., 45, 341-344 (]988).velocities in chain saw operators. Br.J. Ind. Med., 45, 341-344 (]988).
13) Nielsen, S.L. and Lassen, N.A.: Measurement of digital blood pressure after local cooling. J. Appl. Physiol.,43,907-910 (1977).
14) Bovenzi, M.: Finger systolic pressure during local cooling in normal subjects aged 20 to 60 years: referencevalues for the assessment of digital vasospasm in Raynaud's phenomenon of occupational origin. Int. Arch.Occup. Environ. Health, 61,179-181 (1988).
15) Pelmear, P.L., Roos, J., Leong, D. and Wong, L.: Cold provocation test results from a 1985 survey of hardrock miners in Ontario. Scand. J. Work Health, 13,343-347 (1987).
16) Mossman, S.S. and Blau, J.N.: Tinel's sign and carpal tunnel syndrome. BMJ., 294, 680 (]987).17) Heller, L., Ring, H., Costeff, H. and Solzi, P.: Evaluation of Tinel's and Phalen's signs in diagnosis of carpal
tunnel syndrome. Ear Neurol., 25,40-42 (1986).18) Lundborg, G., Sollerman, C., Stromberg, T., Pyykko I. and Rosen, B.: A new principle for assessing vibro
tactile sense in vibration-induced neuropathy. Scand. J. Work Environ. Health, 13, 375-379 (1987).19) Katims, J.J., Naviasky, E.H., Rendell, M.S., Ng, L.K.Y. and Bleecker, M.L.: Constant current sine wave
transcutaneous nerve stimulation for the evaluation of peripheral neuropathy. Arch. Phy. Med. Rehab., 68,210-213 (]987).

41
P.L. Pelmear et al.
20) Katims, J.J., Rouvelas, P., Sadler, B.T. and Weseley, S.A.: Current perception threshold. Reproducibility andcomparison with nerve conduction in evaluation of carpal tunnel syndrome. Trans. Amer. Soc. Art. Int. Org.,35, 180-284 (1989).
21) Gemne, G., Pyykkii I., Taylor, W. and Pelmear, P.L.: The Stockholm Workshop scale for the classification ofcold-induced Raynaud's phenomenon in the hand-arm syndrome (revision of the Taylor-Pelmear scale).Scand. J. Work Environ. Health, 13,275-278 (1987).
22) Brammer, AJ., Taylor, W. and Lundborg, G.: Sensorineural stages of the hand-arm vibration syndrome.Scand. J. Work Environ. Health, 13,279-283 (1987).
23) Pelmear, P.L., Kusiak, R. and Dembek, B.: Cluster analysis of laboratory tests used for the evaluation ofhand-arm vibration syndrome. J. Low Freq. Noise Vib., 12(3),98-109 (1993).