cline google earth lessons using marine data · today is a good day to go ... “need more...
TRANSCRIPT

Google Earth Lessons using Marine Data:A Demonstration Project
Amy Holt ClineTeaching with New Geoscience Tools: Visualizations,Models, and Online DataFebruary 11,2008

Presentation Outline
Project OverviewLesson OverviewWhy Google EarthWorkshop TrainingTeacher FeedbackConclusion
http://research.usm.maine.edu/nmeaconference2007/?page_id=12

Overarching Goal:To work with a team of people in demonstrating that
marine data can be integrated into Google Earthtechnology and can be effectively used in the
classroom
Key components:
Project Overview
• UNH Coastal Observing Center• GoMOOS• Census of Marine Life
Gulf of Maine Program
+ ++
Data Partnerships Google Earth Teachers

Time Line: Three MonthsIdea planning started in February 2007Proposal submitted March 1, 2007Proposal accepted April 15, 2007 Planning began soon afterMet twice a month in May-June-JulyPresented to teachers mid July
Team Members:• Scientist from Census of Marine LIfe;• GIS Tech: CoML;• Informal Educ: CoML;• Program Mgr GoMOOS:• Informal Educ: UNH Coastal Observing Center
Collaboration, brainstorming, lesson writing, revisions, discussions, datarequirements, more revisions.
Project Overview

Lesson Overview
Goal:Identify 3 kinds ofchanges that occur inthe marineenvironment overlong periods of time,geologic, historic andrecent timeData: movies of sealevel rise, NMFS dataof groundfish species,change in diversity ofmarine habitats
Goal:Identify changes insea surfacetemperature andchlorophyllconcentrations invarious markedregions of the Gulfof MaineData: SatelliteImages
Goal:Identify short termchanges that occurover a 24 hour periodover the coastalocean
Data: OceanographicBuoy data - graphs
Long TermChanges
Inter-annualChanges
Daily Changes

Region of Study: Gulf of Maine
Project Overview

Lesson Overview
Website Links to:• Lesson Plans online and in PDF format• Google Earth background information• PDF tutorials of how to use the Tools• KML files that contain the Marine ScienceData sets
Lessons posted on the Web
http://research.usm.maine.edu/nmeaconference2007/?page_id=12

Lesson Overview Daily Changes
Goal:Identify short termchanges that occurover a 24 hour periodover the coastalocean; Think like amarinerData:Oceanographic Buoydata - graphs
Daily Changes
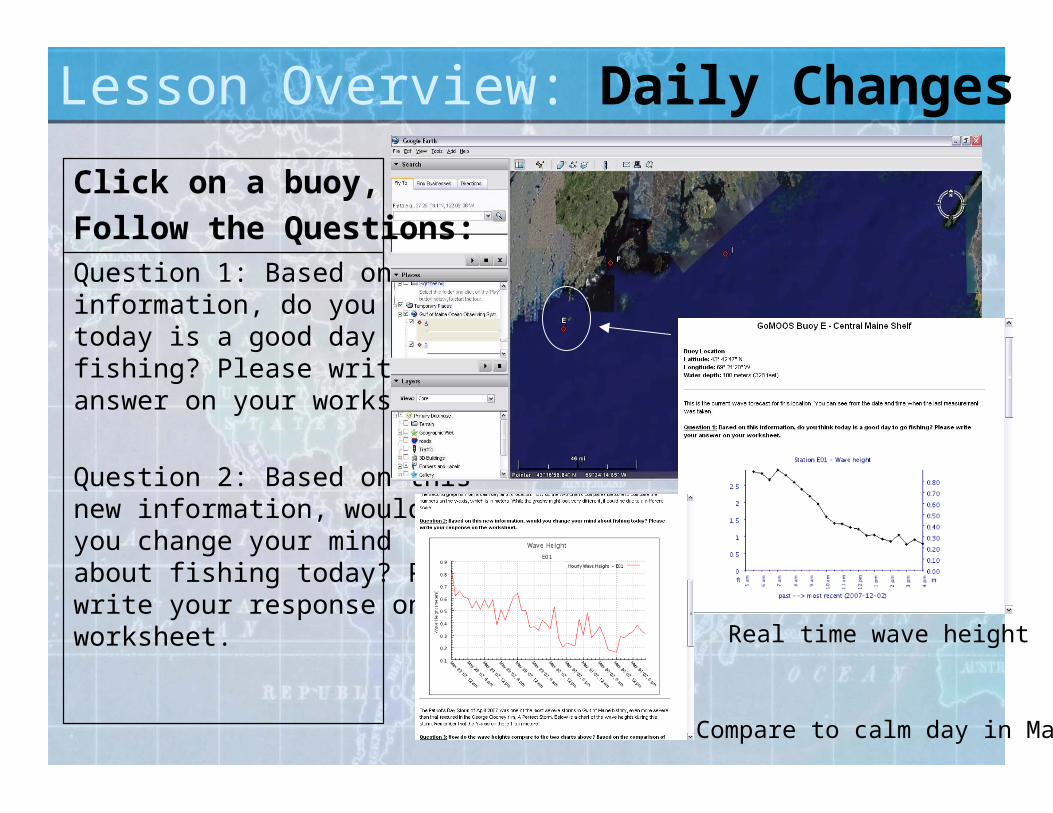
Lesson Overview: Daily Changes
Question 1: Based on thisinformation, do you thinktoday is a good day to gofishing? Please write youranswer on your worksheet.
Question 2: Based on thisnew information, wouldyou change your mindabout fishing today? Pleasewrite your response on theworksheet.
Click on a buoy,Follow the Questions:
Real time wave height
Compare to calm day in May
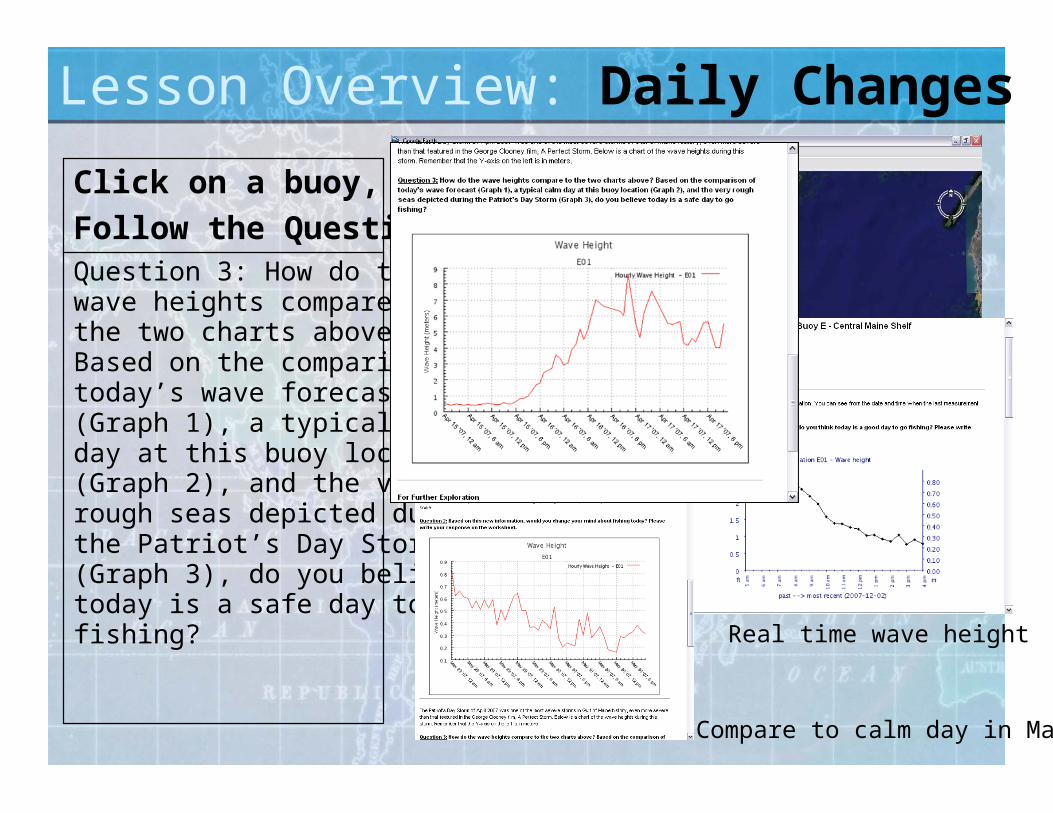
Lesson Overview: Daily Changes
Question 3: How do thewave heights compare tothe two charts above?Based on the comparison oftoday’s wave forecast(Graph 1), a typical calmday at this buoy location(Graph 2), and the veryrough seas depicted duringthe Patriot’s Day Storm(Graph 3), do you believetoday is a safe day to gofishing?
Click on a buoy,Follow the Questions:
Real time wave height
Compare to calm day in May

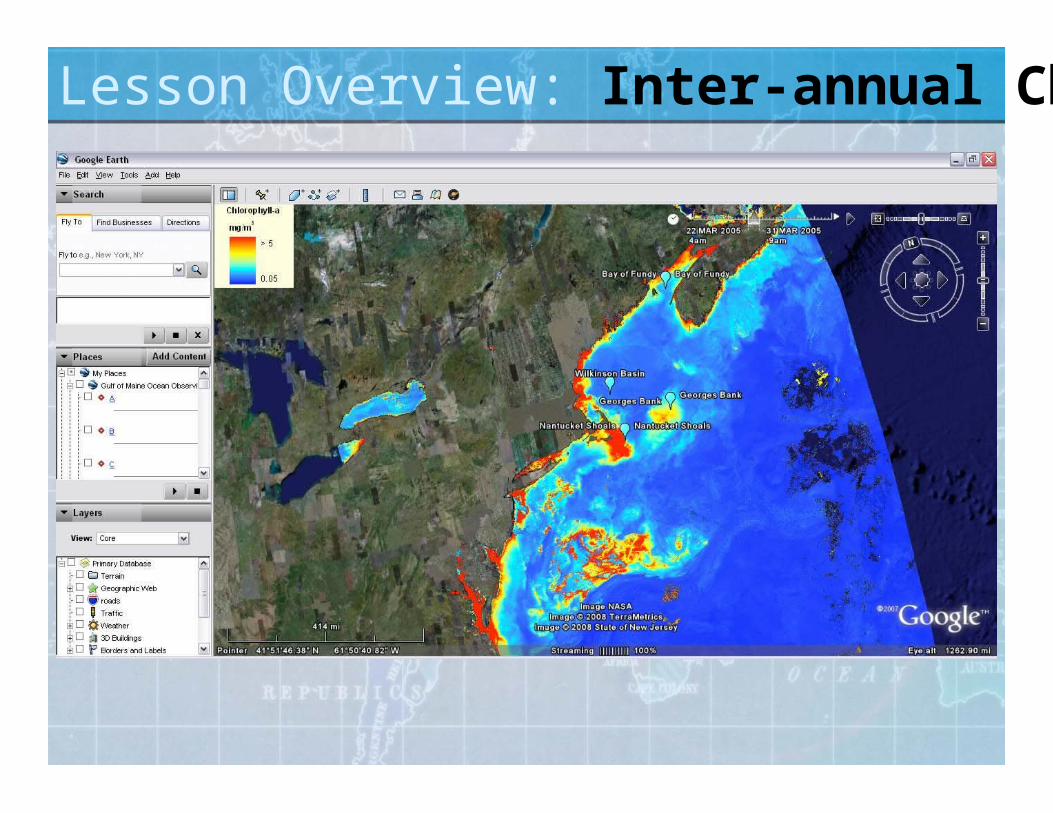
Lesson Overview: Inter-annual Changes
Goal:Identify changes insea surfacetemperature andchlorophyllconcentrations invarious markedregions of the Gulfof MaineData: SatelliteImages
Inter-annualChanges

Movie Snapshots showing 8day composites of Chlorophyll
Lesson Overview: Inter-annual Changes
Focus Questions:• What causes a phytoplankton
bloom in the ocean?• By watching ‘movies’
showing chlorophyll levelsfrom space, can you identifywhen the springphytoplankton bloom beginsand ends in the Gulf ofMaine?
• Can you identify when theheight of the spring bloomoccurs in the Gulf of Maine?
• How are satellite imagesshowing chlorophyll relatedto satellite images showingsea surface temperature?
Inter-annual Changes
Lesson Overview: Inter-annual Changes

Lesson Overview: Inter-annual Changes
Lesson Overview: Inter-annual Changes
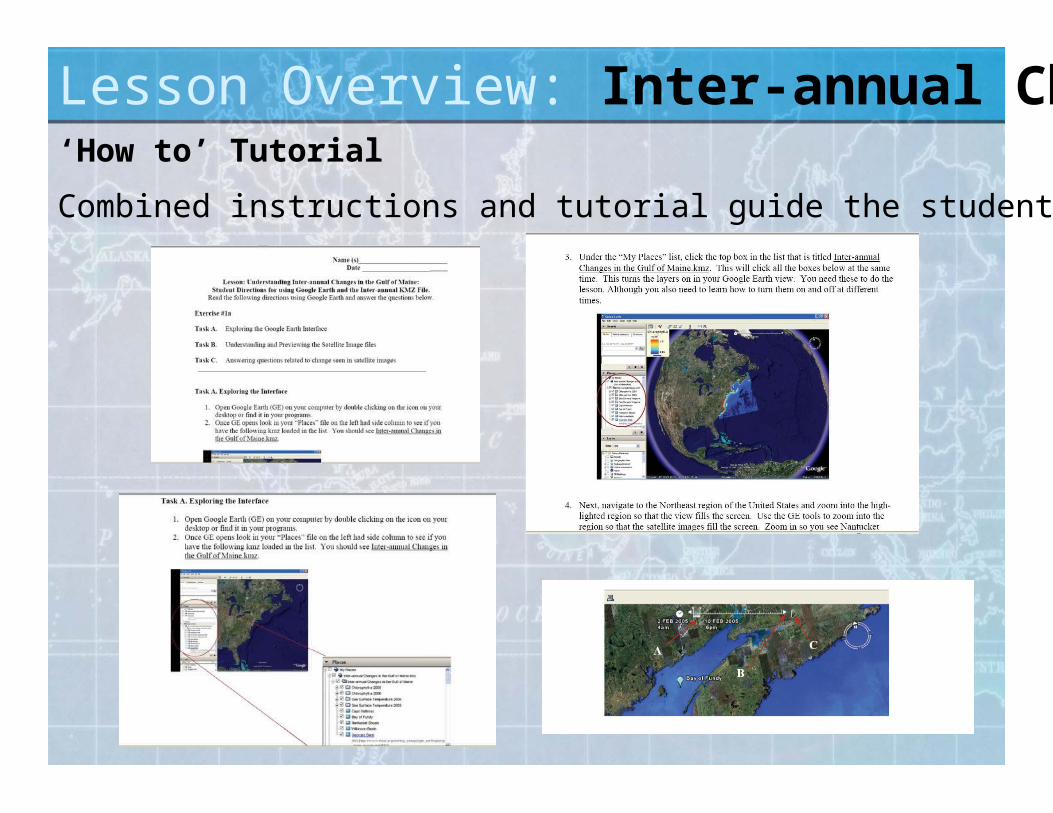
Combined instructions and tutorial guide the student through the lesson
‘How to’ Tutorial
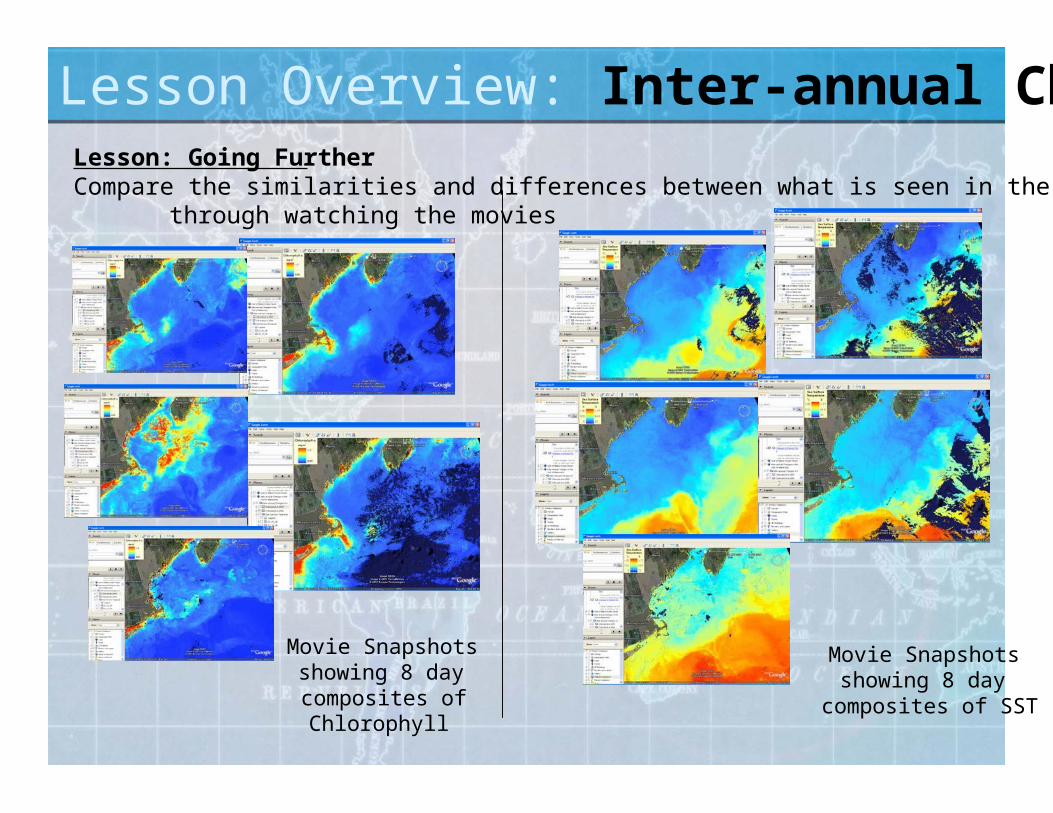
Lesson Overview: Inter-annual Changes
Movie Snapshotsshowing 8 day
composites of SST
Movie Snapshotsshowing 8 daycomposites ofChlorophyll
Lesson: Going Further Compare the similarities and differences between what is seen in the chl and sst images
through watching the movies

Lesson Overview: Long Term Changes
Goal: Identify 3 kinds of changesthat occur in the marineenvironment over long periods oftime, geologic, historic and recenttime, e.g., rise in sea level height,change in distribution andabundance of codfish in the Gulfof Maine, change in diversity ofmarine habitats over decades andyears.
Data: sea level height; NMFScod fish distribution maps; marinediversity maps
Long Term Changes

Why Google Earth?
• Free software• Easy to download• Intuitive to use• Click and fly navigation• Can explore your backyard to new countries• Fairly high resolution images on land• Already used by millions• Google Ocean “coming soon” ?
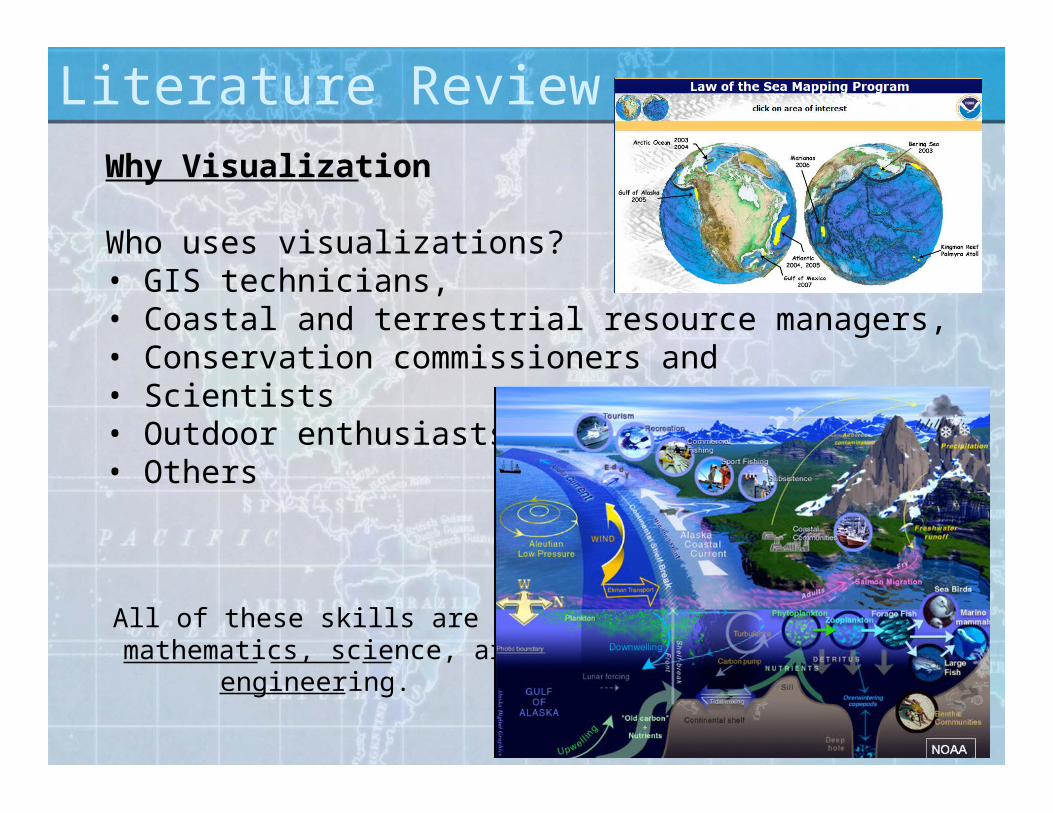
Literature ReviewWhy Visualization
Who uses visualizations?• GIS technicians,• Coastal and terrestrial resource managers, • Conservation commissioners and • Scientists• Outdoor enthusiasts• Others
All of these skills are related to: mathematics, science, art, and
engineering.

Visualizations enable Collaboration
• Boundary Objects – provide clarity and meaning• Inscriptions are central to science because of what they relay• Cleaned, transformed, labeled, etc
Bowen & Roth, 1998, 2005
2005 Shallow water survey 2001 CCOM
Literature Review
Technologically Literate Citizens

Literature ReviewWhy Visualization
The Challenge:• “Spatial visualization is not one of the usual components of the school curriculum – primarily informally acquired”
• But spatial literacy is a main component of problem solving and seen throughout many tasks in the work force
Positive Contribution to the Solution:• Lesson plans using data and a mapping software that is 3D and interactive integrated into the formal classroom
Ben-Chaim, Lappan, Houang 1988
National Academy of Sciences

Literature ReviewPresenting Visualizations to Students
• Overwhelmed quickly- learners need timeto talk, process
• Information overload- practice, familiaritygoes a long way
• Learning can be improved through the useof visualizations; although, teachers need tolearn to incorporate this new approach
“Spatial visualization, a particularsubset of spatial skills, is the ability tomentally manipulate, rotate, twist orinvert a pictorially presented stimulus
object.”Ben-Chaim, Lappan, Houang 1988

Teacher PreparationTeachers need:• training, support and practice using technology in new ways• to know the technology but don’t feel they have the skills• more experience and additionally need practice working with
graphs and data, specifically pre-service teachers
Literature Review
Glen, 1997
Bowen & Roth, 2005

Pedagogy• Content and skills need to be scaffolded so information can be
realistically absorbed• Content should be closely connected• Use of technology should require problem solving in some way• Teacher moves away from center of attention• Recommended to find out what their students do and do not know
about major concepts and skills
Literature Review
Von Secker, 1999

Teacher Training• National Marine Educators Association Meeting Portland, ME July
• 1:30 session time frame, 15 turned in surveys
• Introductions, Google Earth Training, Lessons

What they saidBefore the teacher training of Google Earth:• 7 teachers said they used GE “a little on their own”• 5 said “not at all”• 3 were “very familiar”
After the tutorial:• 8 said that “I feel, with practice, I can use Google Earth”• 1 teacher said “I don’t feel confident in my ability to use this
program”

What they saidLesson Feedback:• Glad to use the tool with alesson immediately after
• Thought the effort and theideas were useful
• Group teachers together bylevel of familiarity with thetool
What’s Needed:• More time to explore, absorbinformation, read, follow along etc
• Some provided very specificinformation on data layers withinGE (helpful)
• Need background informationon Long term changes wasimbedded within GE

What they saidLesson Feedback: Overall comments?
“I love the idea and am so happy people are doing what you are doing, Ineed to explore more!”
“Good platform for future use”
“Love the idea. Amount of chaos the way multiple users swam thecomputer make this still impractical for my classroom,unfortunately. Great stuff – keep working on it!
“Anything that could have potential answers, give teachers the answersso they know what to expect.”

What they saidLesson Feedback:Will the Google Earth files help you to teach others about the changing
ocean?• 14 teachers said “yes” or “definitely yes”• All said will use them in the future in some way – all or part, or will
try• Weather/climate, likely SST
Do you think you might use these lessons in the future?• 13 teachers said “yes” at some level• Teachers say they will use the lessons in some way• Many said “great idea”

What they saidLesson Feedback: Overall comments?
“Outstanding concepts and utility”
“Keep pushing ocean data”
“I think it is important and timely. It is critical to enhance studentunderstanding of the ocean and changes: natural and humaninduced”
“Need more presentation to teach the k-12 teachers”
“The use of Google Earth/GIS in the classroom is a must and can happenin all disciplines.”

What to do now?
• More background information inall lessons
• Expand on future lessons• Collaborate, feature more marine data sets•Lesson 2 and 3 are being divided into more lessons dueto amount of content
• More Data layers in kml/kmzform
• Prepare for Google Ocean!•
• Teacher trainings - longer timeperiod, more time with tool, morecontent instruction, more time forteachers to work together
• How-to tutorials need to becreated for lesson 3, and possiblylesson 1
• Test with teachers again

Any Questions
Thank you to: Census of Marine Life: University of Southern Maine team University of New Hampshire Coastal Observing Center SERC – New tool conference 08