climatological study of the southwestern region of saudi ... · m. a. abdullah*, m. a. al-mazroui...
TRANSCRIPT

Vol. 9: 213-223,1998 CLIMATE RESEARCH
Clim Res
I Published February 27
Climatological study of the southwestern region of Saudi Arabia. I. Rainfall analysis
M. A. Abdullah*, M. A. Al-Mazroui
Faculty of Meteorology, King Abdul Aziz University, PO Box 9034, Jeddah 21413, Saudi Arabia
ABSTRACT. The annual rainfall in the southwestern region of Saudi Arabia was analyzed. The study area was divided into regions and subregions depending on the altitude above mean sea level and mean annual rainfall. The classification was supported by comprehensive statistical analysis. The results showed that spring is the main season for rainfall, followed by summer. The gamma distribution was found to provide the best fit, followed by the normal distribution. The analysis of interannual and relative interannual variability showed that regions I and V (adjacent to and furthest away from the coast, respectively, in the southern part of the study area) can be classified as arid, while regions 11, 111 and IV (between and to the north of regions 1 and V) are classified as semi-arid.
KEY WORDS: Saudi Arabia . Asir . Statistical analysis . Rainfall. Annual rainfall distribution. Rainfall variability . Arid and semi-arid regions
1. INTRODUCTION
The amount of rainfall received over an area is an important factor in assessing the amount of water available to meet the various demands of agriculture, industry, and other human activities. Therefore, the study of the distribution of rainfall in time and space is very important for the welfare of the national economy.
Many applications of rainfall data are enhanced by a knowledge of the actual distribution of rainfall rather than relying on simple summary statistics. A large number of studies investigating the use of particular distributions to represent the actual rainfall patterns have been employed. Waylen et al. (1996), in a study of spatial variability of annual rainfall in Costa Rica for 100 stations, found that rainfall frequency can be rep- resented by a normal distribution. They used a good- ness-of-fit procedure to test the significance of the distribution using the Kolmogorov-Smirnov test. Also, they reported that the normal distribution provides an adequate description of annual rainfall frequency at different sites. Eltahir (1992) found in central and west- ern Sudan, that in cases in which the normal distribu- tion did not adequately describe annual rainfall, the
'E-mail: [email protected]
0 Inter-Research 1998
gamma distribution was a possible alternative. Rodhe & Virji (1976) noted that deviations from normality were common at low-rainfall stations in northern Kenya. Odumodu (1983). in his study of average monthly rainfall amounts for the high plateau in Nige- ria, found that these were approximately normally dis- tributed. On this basis, he calculated the probabilities of receiving discrete amount of rainfall in that area. Chow (1954), in his investigation of the lognormal dis- tribution, suggested relationships for calculating the mean and variance without taking the logarithms of all the data. Brakensiek (1958) also discussed a least squares procedure for estimating the parameters of the lognormal distribution. On the other hand, the gamma distribution has been widely used in climatol- ogy and hydrology. Rainfall probabilities for durations of days, weeks, months and years have been docu- mented using the gamma distribution (Haan 1979).
2. DESCRIPTION AND TOPOGRAPHY OF THE STUDY AREA
The southwestern region of the Kingdom of Saudi Arabia extends from 16.5" to 22" N and from 40" to 43.5" E. The area is bounded by the Red Sea on the

214 Clim Res 9: 213-223, 1998
Fig. 1. Saudi Arabia, showing the location of the study area in the southwestern region
west. On the east, the region is bounded by the Najd Plateau and the Empty Quarter. The Hijaz Plateau bounds the region from the north (Fig. I ) . The region is delineated by the Asir escarpment which runs par- allel to the Red Sea coast, approximately 70 to 100 km inland. The western slope of the Asir escarpment is very steep. The area to the east of the escarpment is characterized by large catchments with a milder slope (Fig. 2 ) .
3. SYNOPTIC CLIMATOLOGY OF SAUDI ARABIA
3.1. Winter
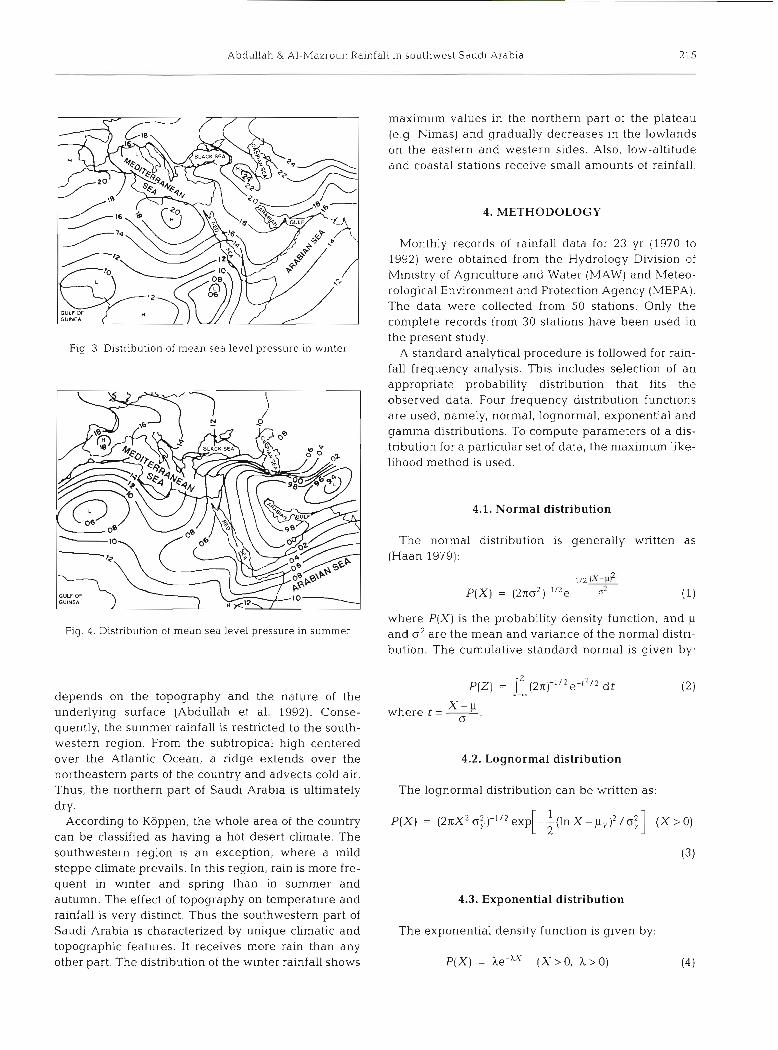
In this season, the climate of Saudi Arabia is con- trolled by the interaction of Siberian high pressure, the Mediterranean lows and the Sudan trough (Fig. 3). The Mediterranean cyclones, which migrate from west to east in association with upper troughs and active phases of subtropical and polar jets, are consid- ered the main rain-producing synoptic systems. Their potential generally decreases from north to south except for the mountainous areas, where uplift motion acts as a regional factor. The ridge of the Siberian high which advects cold and dry air extends into the north- eastern regions of Saudi Arabia. The trough of the Sudan low advects warm humid air in the lower atmospheric layer to the southwestern parts of the country. When the cold air which is associated with the Siberian ridge extends especially far into the southern region and the humid air from the Sudan trough is concentrated along the Red Sea, the rainfall that occurs in this case is due to both instability and orography.
3.2. Summer
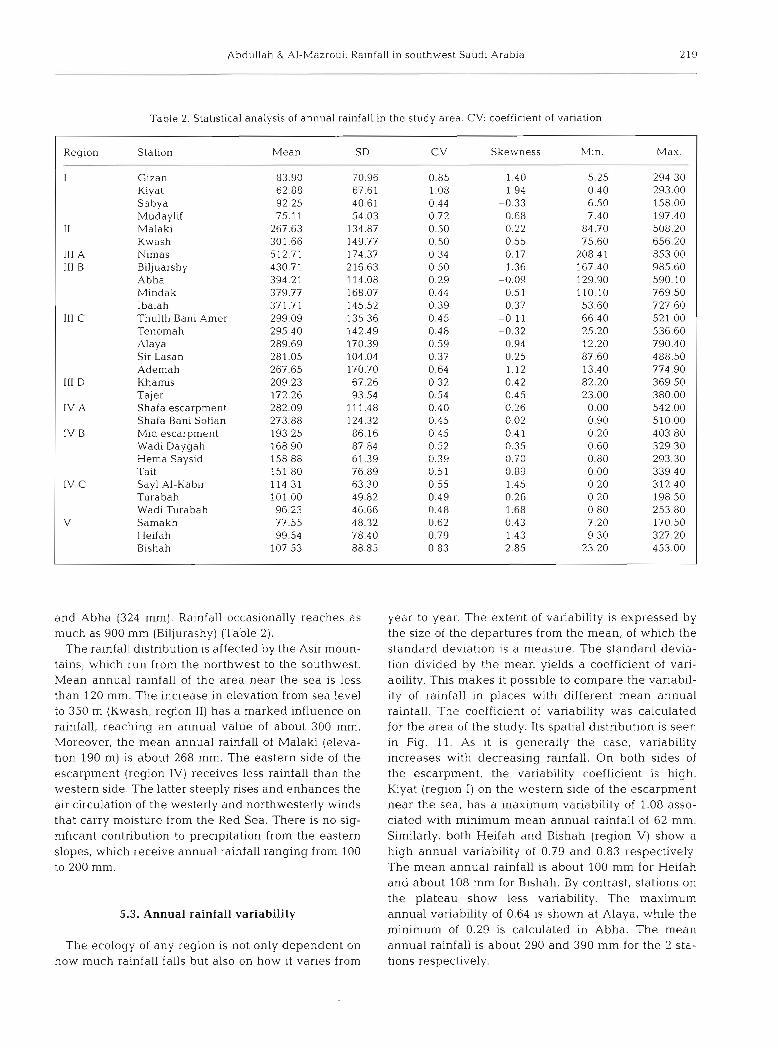
In this season the whole circulation pattern is altered. The middle latitude disturbances of the extra- tropical type do not affect the area any more. Saudi Arabia's climate is governed by a thermal low which is, in fact, an extension of the Indian monsoon low cen- tered over Asia (Fig. 4 ) . The southern parts of the country are under the influence of the monsoon trough. This trough brings southwesterlies which are conditionally unstable, and their potential for rainfall
WESTERN DRAINAGE SYSTEM EASTERN DRAINAGE SYSTEM
Meters 2000 -
Locat~on of the
1000 -
R,,, = Surface Runoff
RG = Groundwater Recharge
Sea Level Fig. 2. Topography of the southwestern
region (after Abdulrazzak et al. 1995)
.4bdullah & AI-Mazroui: Rainfall In soutliwest Sdudl Arabia
Fig. 3 . Distribution of mean sea level pressure in winter
maximum values in the northern part of the plateau (e.g Nimas) and gradually decreases in the lowlands on the eastern and western sides. Also, low-altitude and coastal stations receive small amounts of rainfall.
4. METHODOLOGY
Monthly records of rainfall data for 23 yr (1970 to 1992) were obtained from the Hydrology Division of Ministry of Agriculture and Water (MAW) and Meteo- rological Environment and Protection Agency (MEPA). The data were collected from 50 stations. Only the complete records from 30 stations have been used in the present study.
A standard analytical procedure is followed for rain- fall frequency analysis. This includes selection of an appropriate probability distribution that fits the observed data. Four frequency distribution functions are used, namely, normal, lognormal, exponential and gamma distributions. To compute parameters of a dis- tribution for a particular set of data, the maximum like- lihood method is used.
4.1. Normal distribution
The normal distribution is generally written as (Haan 1979):
- I n &
P(X) = (2x02)-1'2e a2 (1)
where P(x) is the probability density function, and p Fig. 4. Distribution of mean sea level pressure in summer and o 2 are the mean and variance of the normal distri-
bution. The cumulative standard normal is given by,
P(Z) = (2x)-1'2e-121z d t depends on the topography and the nature of the -
X - P underlying surface (Abdullah et al. 1992). Conse- where t = - 0 '
quently, the summer rainfall is restricted to the south- western region. From the subtropical high centered over the Atlantic Ocean, a ridge extends over the northeastern parts of the country and advects cold air. Thus, the northern part of Saudi Arabia is ultimately dry.
According to Koppen, the whole area of the country can be classified as having a hot desert climate. The southwestern region is an exception, where a mild steppe climate prevails. In this region, rain is more fre- quent in winter and spring than in summer and autumn. The effect of topography on temperature and rainfall is very distinct. Thus the southwestern part of Saudi Arabia is characterized by unique climatic and topographic features. It receives more rain than any other part. The distribution of the winter rainfall shows
4.2. Lognormal distribution
The lognormal distribution can be written as:
P(X) = (2nx2 o;)-ll2 exp --(In X - p,,)' /G:] (X > 0) [ :
4.3. Exponential distribution
The exponential density function is given by:
P(X) = he-Ax ( X >O, h > 0)

Clim Res 9: 213-223, 1998
and the cumulative exponential distribution bv,
The mean and variance of the exponential distribu- tion are l / h and l/h2.
4.4. Gamma distribution
The gamma density function is given by:
P(X) = hn X"-' e-jX/ T ( ~ ) ( X > 0) (6)
Also, the cumulative gamma distribution can be written as:
where T (q) is the gamma function. q is the shape para- meter. It can be estimated as i, which is given by:
where y is 1nX - and A{ IS a correction term. A is the scale parameter. It can be estimated as iwhich is given by:
The observed rainfall data and those obtained from the previously discussed probability distributions are subjected to a test of goodness-of-fit using the chi- squared test.
In this study, SAS and SPSS statistical packages were used to analyze the data. The contour maps were
Table 1. Names and locations of the stations in the study area
Stn Stn name Code Eleva- Long. Lat. no. tion (m) (deg) (deg)
1 G ~ z a n GIZ 7 42.58 16.88 2 K~ya t KlY 30 41.40 18.73 3 Sabya SAB 40 42.62 17.17 4 Mudaylif MUD 53 41.05 19.53 5 Malaki lMAL 190 42.95 17.05 6 Kwash KWA 350 41.88 19.00 7 Nimas NIM 2600 42.15 19.10 8 Biljuarshy BIL 2400 41.55 19.87 9 Abha ABH 2190 42.48 18.20 10 Mindak MIN 2400 41.33 20.10 11 lbalah IBA 2480 42.25 18.68 12 Thulth Bani Amer THU 2000 41.98 19.47 13 Tenomah TEN 2100 42.17 18.92 14 Aiaya ALA 1850 41.90 19.53 15 Sir Lasan SIR 2100 42.60 18.25 16 Ademah ADE 1715 41.93 19.75 17 Kharnis KHA 2056 42.80 18.30 18 Tajer TAJ 2300 42.38 18.52 19 Shafa escarpment SHE 2190 40.30 21.08 20 Shafa Bani Sofian SBS 2130 40.32 21.12 21 Mid escarpment MIDE 910 40.22 21.35 22 Wadi Daygah WDAY 540 40.12 21.22 23 Hema Saysid HEM 1497 40.50 21.30 24 Taif TAIF 1530 40.45 21.40 25 Say1 /U-Kabir SAY 1230 40.42 21.62 26 Turabah TUR 1130 41.67 21.18 27 Wadi Turabah WTUR 1310 41.37 20.82 28 Samakh SAM 1480 42.80 19.33 29 Heifah HEIF 1090 42.53 19.87 30 Bishah BSH 1020 42.60 20.02
plotted by SURFER version 6.0.4. This uses the Krig- ing method for the grid points.
Fig. 5. Three-dimensional orography diagram of the study area

Abduliah & Al-Mdzroui: Rainfall in southwest Saudi Arabia 217
22.0 gests that it can be divided into 5 regions (Fig. 7). It may be noticed that both regions 111 and IV have a wide range of annual rain-
21.5 fall between stations. Accordingly, each of these regions may be divided into subre- gions depending on mean annual rainfall
21 .O and its variation. Analysis of variance
(ANOVA) was performed using 2 tests, namely least significant difference (LSD)
20.5 and Duncan's new n~ultiple range (Steel & Torrie 1980, Damon & Harvey 1987). These classify the stations into groups according to
20.0 the significance level of the variation of the
A
W means. A statistical package (SAS) was W
K 19.5 used for this purpose. A 10% level of signif- 2 icance for variation between the means was n V taken as a base for regionalization. Prior to
g 19.0 using ANOVA, assumptions of normality 3 and homogeneity of variances in each k F region were investigated. It was found that 4 18.5 all the stations fit the normal distribution
adequately (see Table 5). The Bartlett test (Steel & Torrie 1980) was used to check the
18.0 homogeneity of variances. The analysis shows that regions I and I1 are homogeneous at the 5% level of significance using the
17.5 observed data. Square root and logarithmic transformations failed to meet the homo- geneity requirements for region 111. This is
17.0 probably due to the nature of the orography of this region (Fig. 5). As this region is one of
16.5 the important agricultural regions in the
40.0 40.5 41.0 41.5 42.0 42.5 43.0 43.5 area of the study, further investigation was LONGITUDE ( D E G R E E ) performed to identify the stations which
caused nonhomogeneity. Excluding Khamis Fig. 6. Contour map (100 m intervals) of the study area and Tajer, due to their locality, the test
showed homogeneity at the 5 % level of significance.
5. RESULTS AND DISCUSSION In this study, it was decided to use data of all the sta- tions in region 111. In further studies, the previously
5.1. Classification of the study area into regions and mentioned 2 stations may be dealt with separately. subregions Both the observed and transformed data were tested
and showed the same results concerning the subdivi- The altitude of the 30 stations representing the area sions of the regions. Figs. 8 & 9 show regions 111 and IV
ranges from mean sea level up to 2600 m (Table 1). A with their subregions. 3-dimensional diagram for the orography of the south- western region is shown in Fig. 5. The region appears as a cliff toward the Red Sea, then the escarpment 5.2. Mean annual rainfall distribution of the gradually slopes eastward. The figure also shows dis- study area tinctive elevations at the top of the escarpment. A con- tour map of the study area is shown in Fig. 6. The Annual rainfall is probably the most important sim- large gradient on the map is an indication of how ple climatic indicator of productivity. Fig. 10 shows the steep the cliff is. mean annual rainfall for the area of the study. The
A preliminary classification based on the topogra- maximum mean annual rainfall appears on region 111 phy of the area and the elevation of the stations sug- specifically at Nimas (512 mm), Biljurashy (430 mm)

2!
LATI
TUD
E wZ!
LATI
TUD
E
9
A
A
- -
- N
N
N
hl
N
z 1~
- A
A
d
- A
- N
N
N
N
A
N
?=' m
U
4
W
!=' 9
g P
a
y
+m
m
o
4~
g
v
:
"b :
0
VI
0
0
V,
VI
0
L,
VI
0
L
"b a
m
g g
lp
g,
X c
5'
E m
"c
" 9
cn
P
5'2
L 2
P
Q
0
VI
C
g 5.
0
W.
P
-g
P
iii:
- A
52
0
2 ip
*
: 9.
-0
0
'-2
z
e 0
-
z L
$
22
gL
, .I,; ,
'D S' ,.
c Q
3
-4
aE
;*
5'
ON
g
s
SE
g
g m
0
3-0
m
0
E, U
)
g E
iq
0
0
-"S
P
S. z
N
N
60
g<
W
0
SW
<
5'2
P
m $
e
"E
g
33
g
(D
-a
S.
O
P
: 5
P
2 m
'"7
D%
LATI
TUD
E (D
EGR
EE)
d
N
F0
VI
gI
.0
V1
0
LATI
TUD
E A
-
d
A
U
01
CD
ID
VI
0
W
0
W
'L)
Abdullah & Al-Mazroui: Ralnfall in southwest Saudi Arabia 219
Table 2. Statistical analysis of annual rainfall in the study area. CV: coefficient of variation
Region Station Mean Skewness Min Max
I G ~ z a n Kiyat Sabya Mudaylif Malaki Kwash Nimas Biljuarshy Abha Mindak Ibalah Thulth Bani Amer Tenomah Alaya Sir Lasan Ademah Khamis Tajer Shafa escarpment Shafa Bani Sofian Mid escarpment Wad1 Daygah Hema Saysid Taif Say1 AI-Kabir Turabah Wadi Turabah Samakh Heifah Bishah
and Abha (324 mm). Rainfall occasionally reaches as much as 900 mm (Biljurashy) (Table 2).
The rainfall distribution is affected by the Asir moun- tains, which run from the northwest to the southwest. Mean ann.ual rainfall of the area near the sea is less than 120 mm. The increase in elevation from sea level to 350 m (Kwash, region 11) has a marked influence on rainfall, reaching an annual value of about 300 mm. Moreover, the mean annual rainfall of Malaki (eleva- tion 190 m) is about 268 mm. The eastern side of the escarpment (region IV) receives less rainfall than the western side. The latter steeply rises and enhances the air circulation of the westerly and northwesterly winds that carry moisture from the Red Sea. There is no sig- nificant contribution to precipitation from the eastern slopes, which receive annual rainfall ranging from 100 to 200 mm.
5.3. Annual rainfall variability
The ecology of any region is not only dependent on how much rainfall falls but also on how it varies from
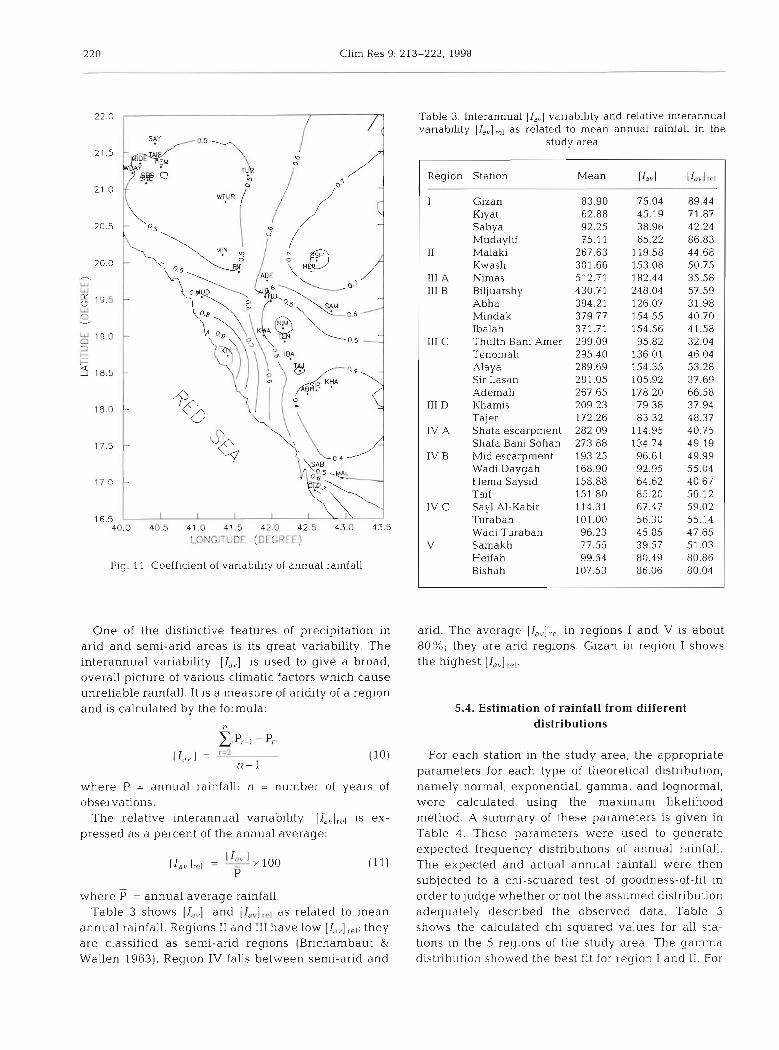
year to year. The extent of variability is expressed by the size of the departures from the mean, of which the standard deviation is a measure. The standard devia- tion divided by the mean yields a coefficient of vari- ability. This makes it possible to compare the variabil- ity of rainfall in places with different mean annual rainfall. The coefficient of variability was calculated for the area of the study. Its spatial distribution is seen in Fig. 11. As it is generally the case, variability increases with decreasing rainfall. On both sides of the escarpment, the variability coefficient is high. Kiyat (region I) on the western side of the escarpment near the sea, has a maximum variability of 1.08 asso- ciated with minimum mean annual rainfall of 62 mm. Similarly, both Heifah and Bishah (region V) show a high annual variability of 0.79 and 0.83 respectively. The mean annual rainfall is about 100 mm for Heifah and about 108 mm for Bishah. By contrast, stations on the plateau show less variability. The maximum annual variability of 0.64 is shown at Alaya, while the minimum of 0.29 is calculated in Abha. The mean annual rainfall is about 290 and 390 mm for the 2 sta- tions respectively.
220 Clim Res 9: 213-223, 1998
LONGITUDE (DEGREE)
Fig. 11. Coefficient of variability of annual rainfall
Table 3. Interannual [I,,] variability and relative interannual variability [I,,,jrel as related to mean annual rainfall in the
study area
Region Station Mean [ I a ~ i [ ~ . v ] w I
I Gizan 83.90 75.04 89.44 Klyat 62.88 45.19 71.87 Sabya 92.25 38.96 42.24 Mudaylif 75.11 65.22 86.83
I1 Malaki 267.63 119.58 44.68 Kwash 301.66 153.08 50.75
111 A Nimas 512.71 182.44 35.58 111 B Biljuarshy 430.71 248.04 57.59
Abha 394.21 126.07 31.98 Mindak 379.77 154.55 40.70 Ibalah 371.71 154.56 41.58
I11 C Thulth Bani Amer 299.09 95.82 32.04 Tenomah 295.40 136.01 46.04 Alaya 289.69 154.35 53.28 Sir Lasan 281.05 105.92 37.69 Ademah 267.65 178.20 66.58
I11 D Khamis 209.23 79.38 37.94 Tajer 172.26 83.32 48.37
IV A Shafa escarpment 282.09 114.95 40.75 Shafa Bani Sofian 273.88 134.74 49.19
IV B Mid escarpment 193.25 96.61 49.99 Wadi Daygah 1.68.90 92.95 55.04 Herna Saysid 1.58.88 64.62 40 67 Taif 151.80 85.20 56 12
IV C Say1 AI-Kabir 114.31 67.47 59.02 Turabah 101.00 56.30 55.14 Wadi Turabah 96.23 45.85 47.65
V Samakh 77.55 39.57 51.03 Heifah 99.54 80.49 80.86 Bishah 107.53 86.06 80.04
One of the distinctive features of precipitation in arid. The average [ Ia , ] , , I in regions I and V is about arid and semi-arid areas is its great variability. The 80%; they are arid regions. Gizan in region I shows interannual variability [ I , , ] is used to give a broad, the highest overall picture of various cl.imatic factors which cause unreliable rainfall. It is a measure of aridity of a region and is calculated by the formula: 5.4. Estimation of rainfall from different
distributions GIP,-, - P,I
[Id,, 1 = r=2 (10) For each, station in the study area, the appropriate n - l parameters for each type of theoretical distribution,
where P = annual rainfall; n = number of years of observations.
The relative interannual variability [I,, ,jrel is ex- pressed as a percent of the annual average:
where P = annual average rainfall. Table 3 shows [I,,] and (Ia,] , , l as related to mean
annual rainfall. Regions I1 and 111 have low [I,,] ,,,; they are classified as semi-arid regions (Brichambaut & Wallen 1963). Region IV falls between semi-arid and
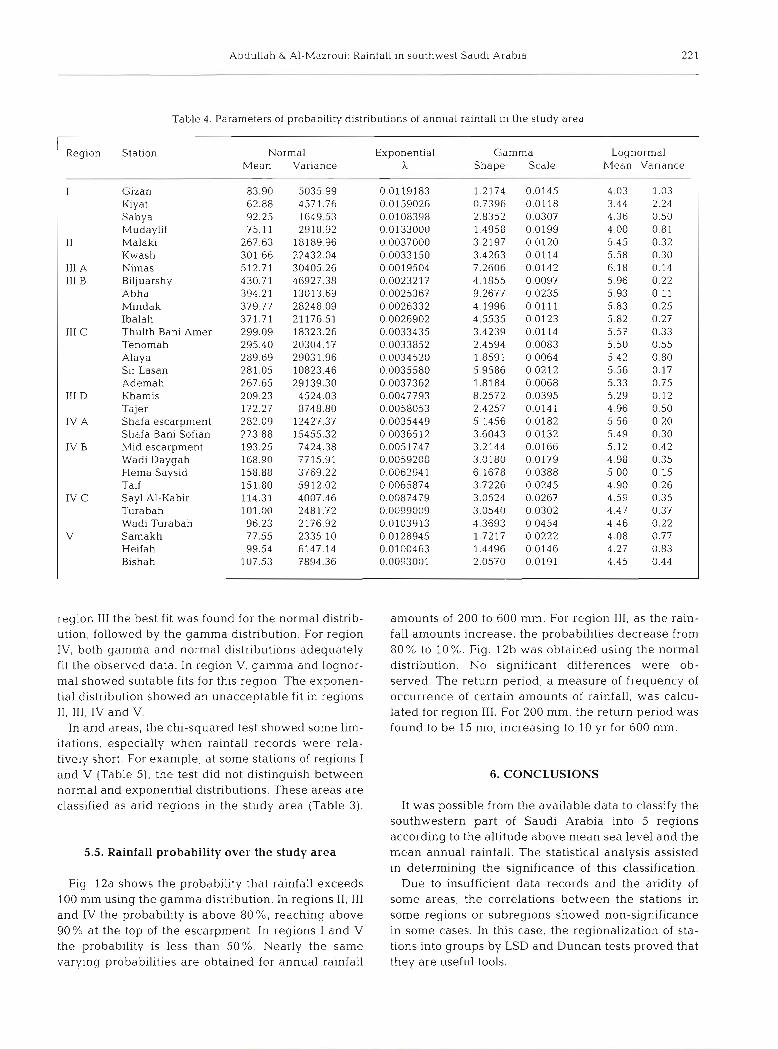
namely normal, exponential, gamma, and lognormal, were calculated using the maximum likelihood method. A summary of these parameters is given in Table 4. These parameters were used to generate expected frequency distributions of annual rainfall. The expected and actual annual rainfall were then subjected to a chi-squared test of goodness-of-fit in order to judge whether or not the assumed distribution adequately described the observed data Table 5 shows the calculated chi-squared values for all sta- tions in the 5 regions of the study area. The gamma distribution showed the best fit for region I and 11. For
Abdullah & Al-Mazroui: Rainfall in south\vest Saudi Arabia
Table 4. Parameters of probability distributions of annual rainfall in the study area
Region Station Normal Exponential Gamma Mean Variance h Shape Scale
I Gizan 83.90 5035.99 0.01 19183 1.2174 0.0145 Kiyat 62.88 4571.76 0.0159026 0.7396 0.0118 Sabya 92.25 1649.53 0.0108398 2.8352 0.0307 Mudaylif 75.11 2918.92 0.0133000 1.4958 0.0199 1 11 Malaki 267.63 18189.96 0.0037000 3.2197 0.0120 Kwash 301.66 22432.04 0.0033 150 3.4263 0.01 14
111 A Nimas 512.71 30405.26 0.0019504 7.2606 0.0142 111 B Biljuarshy 430.71 46927.38 0.0023217 4.1855 0.0097
Abha 394.21 13013.69 0.0025367 9.2677 0.0235 Mindak 379.77 28248.09 0.0026332 4.1996 0.0111 Ibalah 371.71 21176.51 0.0026902 4.5535 0.0123
111 C Thulth Bani Amer 299.09 18323.26 0.0033435 3.4239 0.0114 Tenomah 295.40 20304.17 0.0033852 2.4594 0.0083 Alaya 289.69 29031.96 0.0034520 1.8591 0.0064 Sir Lasan 281.05 10823.46 0.0035580 5.9586 0.0212 Ademah 267.65 29139.30 0.0037362 1.8184 0.0068
111 D Khamis 209 23 4524.03 0.0047793 8.2572 0.0395 Tajer 172 27 8748.80 0.0058053 2.4257 0.0141
IV A Shafa escarpment 282 09 12427.37 0.0035449 5.1456 0.0182 Shafa Bani Sofian 273.88 15455.32 0.0036512 3.6043 0.0132
IV B Mid escarpment 193.25 7424.38 0.0051747 3.2144 0.0166 Wadi Daygah 168.90 7715.91 0.0059208 3.0180 0.0179 Hema Saysid 158.88 3769.22 0.006294 1 6.1678 0.0388 Taif 151.80 5912.02 0.0065874 3.7226 0.0245
IV C Sayl Al-Kabir 114.31 4007.46 0.0087479 3.0524 0.0267 Turabah 101.00 2481.72 0.0099009 3.0540 0.0302 Wadi Turabah 96.23 2176.92 0.0103913 4.3693 0.0454
V Samakh 77.55 2335.10 0.0128945 17217 0.0222 Heifah 9954 6147.14 0.0100463 14496 0.0146
I
Lognormal Mean Variance
4.03 1.03 3 44 2.24 4 36 0.50 4 0 0 0.81 5 45 0.32 5.58 0.30 6.18 0.14 5.96 0.22 5.93 0.11 5.83 0.25 5.82 0.27 5.57 0.33 5.50 0.55 5.42 0.80 5.56 0.17 5 33 0.75 5 29 0.12 4 96 0.50 5 56 0.20 5.49 0.30 5.12 0.42 4.98 0.35 5.00 0.15 4.90 0.26 4.59 0.35 4.47 0.37 4.46 0.22 4.08 0.77 4.27 0.83
Bishah
region 111 the best fit was found for the normal distrib- ution, followed by the gamma distribution. For region IV, both gamma and normal distributions adequately fit the observed data. In region V, gamma and lognor- mal showed suitable fits for this region. The exponen- tial distribution showed an unacceptable fit in regions 11, 111, IV and V.
In arid areas, the chi-squared test showed some lim- itations, especially when rainfall records were rela- tively short. For example, at some stations of regions I and V (Table 5), the test did not distinguish between normal and exponential distributions. These areas are classified as arid regions in the study area (Table 3).
5 .5 . Rainfall probability over the study area
Fig 12a shows the probability that rainfall exceeds 100 mm using the gamma distribution. In regions 11, I11 and IV the probability is above 80%, reaching above 90% at the top of the escarpment. In regions I and V the probability is less than 50%. Nearly the same varying probabilities are obtained for annual rainfall
amounts of 200 to 600 mm. For region 111, as the rain- fall amounts increase, the probabilities decrease from 80% to 10%. Fig. 12b was obtained using the normal distribution. No significant differences were ob- served. The return period, a measure of frequency of occurrence of certain amounts of rainfall, was calcu- lated for region 111. For 200 mm, the return period was found to be 15 mo, increasing to 10 yr for 600 mm.
6. CONCLUSIONS
It was possible from the available data to classify the southwestern part of Saudi Arabia into 5 regions according to the altitude above mean sea level and the mean annual rainfall. The statistical analysis assisted in determining the significance of this classification.
Due to insufficient data records and the aridity of some areas, the correlations between the stations in some regions or subregions showed non-significance in some cases. In this case, the regionalization of sta- tions into groups by LSD and Duncan tests proved that they are useful tools.
Clim Res 9: 213-223, 1998
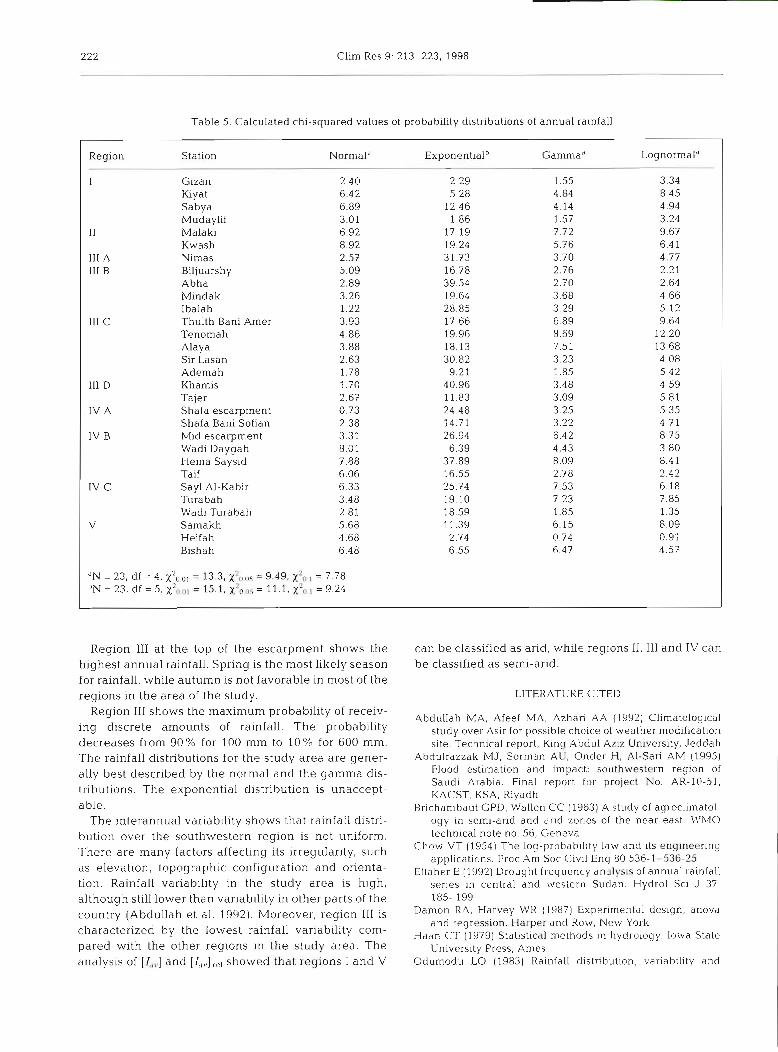
Table 5. Calculated chi-squared values of probability d~stributions of annual rainfall
Region Station Normal" ~ x ~ o n e n t i a l ~ Gamma* Lognormala
I Gizan 2.40 2.29 1.55 3.34 Kiyat 6.42 5.28 4.84 8.45 Sabya 6.89 12.46 4.14 4.94 Mudaylif 3.01 1.86 1.57 3.24
11 Malaki 6.92 17.19 7.72 9.67 Kwash 8.92 19.24 5.76 6.4 1
111 A Nimas 2.57 31.73 3.70 4.77 111 B Biljuarshy 5.09 16.78 2.76 2.21
Abha 2.89 39.54 2.70 2.64 Mindak 3.26 19.64 3.68 4 66 Ibalah 1.22 28.85 3.29 5 12
111 C Thulth Bani Arner 3.93 17 66 6.89 9 64 Tenornah 4.86 19 96 8.69 12 20 Alaya 3.88 18 13 7.51 13 68 Sir Lasan 2.63 30 82 3.23 4.08 Ademah 1.78 9.21 1.85 5.42
I11 D Khamis 1.70 40.96 3.48 4.59 Tajer 2.67 11.83 3.09 5.81
IV A Shafa escarpment 0.73 24.48 3.25 5.35 Shafa Bani Sofian 2.38 14.71 3.22 4.71
IV B Mid escarpment 3.31 26.94 6.42 8.75 Wadi Daygah 8.01 6.39 4.43 3.80 Hema Saysid 7.88 37.89 8.09 8.41 Taif 6.06 16.55 2.78 2.42
1V C Say1 Al-Kabir 6.33 25.74 7.53 6.18 Turabah 3.48 19.10 7.23 7.85 Wadi Turaban 2.81 18.59 1.85 1.35
V Sarnakh 5.68 11.39 6.15 8.09 Heifah 4.68 2.74 0.74 0.91 Bishah 6.48 6.55 6.47 4.57
"N = 23, df = 4 . x ~ ~ . ~ ~ = 13.3, ~ ~ 0 0 5 = 9.49, xZo 1 = 7.78 b N = 2 3 , d f = 5 , ~ 2 0 0 1 = 1 5 . 1 , ~ 2 ~ ~ ~ = 1 1 . 1 , ~ Z ~ ~ ~ = 9 . 2 4
Region I11 at the top of the escarpment shows the highest annual rainfall. Spring is the most likely season for rainfall, while autumn is not favorable in most of the regions in the area of the study.
Region I11 shows the maximum probability of receiv- ing discrete amounts of rainfall. The probability decreases from 90% for 100 mm to 10% for 600 mm. The rai.nfal1 distributions for the study area are gener- ally best described by the normal and the gamma dis- tributions. The exponential distribution is unaccept- able.
The interannual variability shows that rainfall distri- bution over the southwestern region is not uniform. There are many factors dffecting its irregularity, such as elevation, topographic configuration and orienta- tion. Rainfall variability in the study area is high, although still lower than variability in other parts of the country (Abdullah et al. 1992). Moreover, region I11 is characterized by the lowest rainfall variability com- pared with the other regions in the study area. The analysis of [I,,.] and [I,,,] ,,, showed that regions I and V
can be classified as arid, while regions 11. I11 and IV can be classified as semi-arid.
LITERATURE CITED
Abdullah MA, Afeef MA, Azhari AA (1992) Clirnatologlcal study over Asir for possible cholce of weather modification site. Technical report, King Abdul A z ~ z University, Jeddah
Abdulrazzak MJ, Sorman AU, Onder H, AI-Sari AM (1995) Flood estimation and impact: southwestern region of Saudi Arabia. Final report for prolect No. AR-10-51, KACST, KSA, k y a d h
Brichambaut GPD, Wallen C C (1963) A study of agroclimatol- ogy in semi-arid and dnd zones of the near east. WMO technical note no. 56, Geneva
Chow VT (1954) The log-probab~lity law and its engineering applications. Proc Am Soc C i v ~ l Eng 80536-1-536-25
Eltaher E (1992) Drought frequency analysis of annual rainfall series in central and western Sudan. Hydrol Sci J 37: 185-199
Damon RA, Harvey WR (1987) Experimental deslgn, anova and regression. Harper and Row, New York
Haan C T (1979) Statistical methods in hydrology, lowa Stale University Press, Arnes
Odumodu L 0 (1983) Rainfall d~strtbution, variability anu

6
U
m;
-
%E
" d "
!,CO
?
m
- v
-;
h5
::m
S;;;??
W 5
GZ>.Z
7%
c
nm
3
2;
6
; 2
.., a
,0i
g2
; P
zZ
ng
z
;22
+
Q,
,-
"%
m>
-c
da
cn
a,
m
mc
cp
:
c c
;;:;g 9
, g
$ o
,--3
c
3 2
z-
g&
g
4-
a? 2
22
3 2 z N
=
El2
$
g
h-
- 2
$5
52
3
z
I)
?*
2
25
3::
;jr: c *
2g
"o:z
0%
"2
-m
5
0
z 2 a
E
Q <