climatic fluctuations and homogenization of...
TRANSCRIPT

CLIMATIC FLUCTUATIONS AND HOMOGENIZATION OF NORTHEAST BRAZIL USING PRECIPITATION DATA 1
S. JEEVANANDA REDDY
ABSTRACT - In order lo assess lhe cyclic variations In lhe precipitation series and to homogenize the precipitation regimes of lhe Norlheast Brazil 70-years annual precipitatior* data of 105-locations were subjected lo power spectrum analysis. In lerms aí some cycles the regions above and below 8S lal. differ significantly. Also regions between 480S lat. are different in some respects from regions above 405 la, This Is true with respect lo coefficient of variation of annual precipitation. The auto-regres-sion aí Fortaleza data of 1849 to 1981 revealed lhe presence of four cycles, namely 52, 26,13 and 6.5 years, The integrated curve of lhese four cycles is compared with lhe observed precipitalion. The agreement In general is good with few exceptions. The sarne predicted curve is also used lo compare with lhe observed precipitation at few other locations. The agreement is good only for few regions. The çoefficient of variation of annual precipitation presented a non-homogeneity over regions above 805 lat. compared to regions below 80$ tal. This is also true even with the observed cycles. This type of discrepancy is attributed to the non-homogeneity in the data series, which is also substantiated with few examples. Tbis study demonstrates that the basic precipitation data must be corrected for homogeneily before they are actually used in lhe agricuttural productivity estimates ar planning strategies using regression approach.
Index tems: cycles, power apectrum
FLUTUAÇÕES CLIMÁTICAS E HOMOGENEIZAÇÃO DO NORDESTE DO BRASIL UTILIZANDO DADOS DE PRECIPITAÇÃO
RESUMO - Objetivando conhecer a variação cíclica nas séries de precipitação e homogeneidade do re-gime pluviométrico do Nordeste do Brasil, dados de 70 anos de precipitação anual de 105 locais fo-ram submetidos a análise do poder de espectro. Em termQs de alguns ciclos as regiões acima e abaixo de 80 de latitude diferem significativamente. Também regiões entre 4.80 de latitude são diferentes em relação as regiões acima de 40 de latitude em alguns aspectos. Isto certamente também é correto com relação ao coeficiente de variação da precipitação anual. A auto-regressão dos dados de Fortaleza de 1 849 a 1981 indica a presença de quatro ciclos, normalmente de 52, 26, 13 e 6,5 anos. A curva inte-grada deste quatro ciclos é comparada com a precipitação observada. A precisão em geral é boa, cm poucas exceções. A mesma curva estimada é também usada para comparar com precipitações observa-das em outros locais. A precisão é boa somente para poucas regiões. O coeficiente de variação da pre-cipitação anual apresenta uma não-homogeneidade sobre regiões acima de 80 da latitude comparado a regiões abaixo de 80 de latitude. Isto certamente também é correto. Este tipo de discrepáncia é atri-buído à não-homogeneidade da série de dados, a qual é também evidenciada com poucos exemplos. Este estudo demonstra que os dados básicos de precipitação deve ser corretamente homogeneizado, antes de ser utilizado em estimativa de produtividade agrícola ou estratégias de planejamento, utili-zando métodos de regressão.
Termos para indexação; ciclos, poder de espectro.
INTRODUCTION
The objective of the wider study of w}sich this
paper is only one component is lo divide the
Northeast Brazil into Agronomically relevant
zones in terma of crops/cropping pattern and land
and water management practices. Traditional
crops, varieties and croping systems often do
Accepted for publication on March 7, 1984. Presented at "tu Congresso Brasileiro de Agrometeoro-logia" held at Instituto Agronômico de Campinas, SP, during 17 lo 22 July 1983. Consultant (Agroclimatology) EMBRAPA/LICA, Cen-tro de Pesquisa Agropecuária do Trópico Semi-Árido (CPATSA), Caixa Postal 23, CEP 56300 Petrolina, PE, Brazil.
not make fuil and efficient use of available
soil and water resources. li the climate presents
significant cyclic variation with time with alternati-
ve long dry and humid periods, the suggested new
improved farming systems should be flexible
according to these variations.
Among the several climatic parameters, the
precipitation has dose bearing on the agricultural
productivity of a region in the tropics. Also, several dimatic parameters are directly related to
the precipitation over the Northeast Brazil; for
example, potential evapotranspiration that defines the water need ata place (Reddy & Amorim 1984)
and global solar radiation (Reddy et ai. 1984).
Pesq. agropec. bras., Brasilia, 19(5);529-543. maio 1984.

530
S.J. REDDY
Therefore, the study of cydic variation in the precipitation is wry important in the tropics for appropriate long term planning of agriculture.
In the pan some efforts have been made to under-stand the cyclic variations in the precipitation of the Northeast Brazil (Strang 1979, Girardi 1983, Carlos et ai. 1982). Majority of these studies used Fortaleza data series only. However, the precipita-tion patterns in terma of seasonal variation and commencement of humid period present high variations with latitude and longitude over the Northeast Brazil (Reddy & Amorim 1983).
Therefore, the specific objective of this study is to identify periodicities ia the long series ofpreci-pitation data over different parIs ofthe Northeast Brazil and homogenize the precipitation regimes according to identified cycles and point out thc non-homogeneity in the precipitation series of the Northeast Brazil. For this study 70-years annual precipitation data of lOS-locations over the Northeast Brazil (excluding Maranhão and Piauí) were used.
MATERIAL AND METHODS
The basic data consists of 70-year annual precipitation for lhe duration of 1912-1981 for about 105 locations over Northeast Brazil (Fig. 1 and Table 1). The data were supplied by the SUDENE (Recife). If only one or two-month data were missing, then these were filied with the average monthly values. In the case of Fortaleza, the data are from 1849 to 1981.
The annual precipitation data were subjected to power speclrum analysis of Blackman & Tukey (1958) as presented in World Meleorological Organization (1966) technical note no. 77. To achieve satisfaclory resolution ia the spectrum a maximum lag o! 25 was chosen. Tbe spectral estimates were smoothed by "1-lanning method" with weighls 0.23, 0.54 and 0.23. The spectra exhibit many peaks and troughs. To lest whether lhese peaks are accidental due to sainpling effecls or lhe sedes indlcate any significanl tendency lo osciliate, the sampling theory o! Tukey (1950) was used. The nuli hypothesis for this purpose are considered in accordance wilh the fact thal lhe series revealed any persistency or not. 1f lhe persisten-o is o! the "Markov linear type", lhe appropriate red--noise spectrum and the associated 99, 95 and 90% limits were calculated and lhe individual peaks were tested with reference lo lhese limits. If the lag 1 correia-lion was significanlly greater in magnitude than zero bul higher lag correlalions did nol tapei oU exponentially, the spectral estimates in lhe fjrst haif was lesled with reference lo the red-noise speclrum and lhe rest against white noise. In the absence of any persislency, lhe spectral estimales were lested againsl white-noise spectruzn. Oul o! 105 localions 47 presenled persistence. Such banda can
Pesq. agropec. liras., Brasília, 19(5):529-543, maio 1984.
•2.' t'.l
s' •2' e 'A
e- - 'o
•4J
"é" 35'
• 44 1 . 43. 46' - -
:2.67
4. ir *1
.3
jg
li?
.20 '21 • g 43
24 2-4 3 . 61•
.:
FIO. 1. Ljsl of localions.
cause errors in the spectral eslimates where there i$ lesa power (Jenkins & Walls 1968),It may be advantageous to filter lhe data aigilally in order to improve the estiinates at these frequencies. iii the present study the lime series represenl only 70 values. It is, lherefore, nol allempted lo filIei lhe data series using either 'Band pass filie?' ar "difference filter", as lhis process reduces the number of data poinls available for spectrum analysis. Also, there is no dffference belween lhe pattern of speclrum either with red-noise or white-noise.
RESULTS
Table 2 presents the significant cycles at the 105 locations over Northeast Brazil. In this table the numbers 1, 2 and 3 respectively stand for lhe 90, 95 and 99% leveis of significance. The periods or cycles (in years) that correspond to different harmonics along with the class interval are present-cd iii Table 3. Table 3 also presents the number

CLIMATIC FLUCTUATIONS
531
TABLE 1. List ef locations used in the analysis.
Numbers Name Stage o
Latitude Longitude • o
Altitude
(m)
1 Sertânia Pernambuco 08 05 31 16 605 2 Brejo da Madre de Deus Pernambuco 08 09 36 23 646 3 Salgueiro Pernambuco 08 04 39 07 415 4 Bom Jardim Pernambuco 07 48 35 35 325 5 Timbaúba Pernambuco 07 31 35 19 190 6 Belém de S. Francisco Pernambuco 08 46 38 58 305 7 També Pernambuco 09 23 40 30 376 8 Petrolina Pernambuco 09 23 40 30 376 9 Mundo Novo Bahia 11 51 40 28 480
10 Paratinga Bahia 12 42 43 10 420 11 Andaraí Bahia 12 49 41 20 386 12 Brumado Bahia 14 12 41 40 457 13 Condeúba Bahia 14 52 41 59 695 14 Barra Bahia 11 05 43 09 410 15 Curaçá Bahia 08 59 39 54 341 16 Casa Nova Bahia 09 24 41 08 380 17 Patamuté Bahia 09 25 39 29 400 18 Juazeiro Bahia 09 25 40 30 371 19 Remanso Bahia 09 41 42 04 378 20 (Jauá Bahia 09 50 39 29 439 21 Pilão Arcado Bahia 10 10 42 26 -
22 Monte Santo Bahia 10 26 39 20 489 23 Senhor do Bonfim Bahia 10 27 40 11 544 24 Euclidesda Cunha Bahia 10 30 39 01 523 25 Cícero Dantas Bahia 10 36 33 22 420 26 Araci Bahia 11 20 38 57 212 27 Morro do Chapéu Bahia 11 32 41 08 1012 28 Serrinha Bahia 11 39 39 00 377 29 Rio de Contas Bahia 13 34 41 49 1002 30 Ituaçu Bahia 13 49 41 18 527 31 Caetité Bahia 14 04 42 29 826 32 Paripiranga Bahia 10 41 37 51 430 33 Brejo do Cruz Paraíba 06 21 37 30 190 34 CatolÕ do Rocha Paraíba 06 21 37 45 250 35 Cajazeiras Paraíba 06 53 38 34 291 36 Antenor Navarro Paraíba 06 44 38 27 240 37 Pombal Paraíba 06 46 37 49 178 38 Santa Luzia Paraíba 06 52 36 56 290 39 Picui Paraíba 06 31 36 22 450 40 Araruna Paraíba 06 31 35 44 580 41 Bananeiras Paraíba 06 46 35 38 552 42 Areia Paraíba 06 58 35 42 445 43 S. João do Cariri Paraiba 07 24 36 32 445 44 Soledade Paraíba 07 04 36 22 560 45 Alagoa Nova Paraíba 07 04 35 47 500 46 Ingá Paraíba 07 17 35 37 144 47 Itabaiana Paraíba 07 20 35 20 45 48 Conceição Paraíba 07 33 38 31 370 49 Princesa Isabel Paraíba 07 44 38 01 660 50 Areia Branca Rio G. do Norte 04 51 37 08 5 51 Gov. Dix-Sept Rosado Rio G. do Norte 05 28 37 31 36 52 Touros Rio G. do Norte 05 12 35 28 4
Pesq. agropcc. bras., Brasília, 19 (5) :529-543, maio 1984.

532 S.J, EEDDY
TABLE 1. Continuation
Numbers Name Stage Latitude Longitude Altitude (m)
53 Caraúbas Rio G.do Norte 05 47 37 34 - - 146 54 Augusto Severo Rio G.do Norte 05 51 37 19 65 55 Angicos Rio G. do Norte 05 40 36 36 109 56 Santana do Matos Rio G. do Norte 05 58 36 39 140 57 Taipu Rio G. do Norte 05 37 35 36 50 58 Jardim de Angicos Rio G. do Norte 05 39 36 00 150 59 Luis Gomes Rio G. do Norte 08 25 38 24 640 60 Martins Rio G.do Norte 06 05 37 55 645 61 Pçrto Real do Colégio • Alagoas 10 11 36 50 30 62 Nossa Senhora da Glória Sergipe 10 13 37 27 290 63 Simôes Dias Sergipe 10 44 37 48 283 64 S.J. do Jaguaribe Ceará 05 17 38 16 60 65 Mombaça Ceará 05 45 39 38 223 66 Assaré Ceará 06 52 39 52 435 67 Santana do Cariri Ceará 07 33 39 44 480 68 Crato Ceará 07 13 39 23 69 Brejo Santo Ceará 07 29 38 59 490 70 Porteiras Ceará 07 31 39 08 520 71 Jardim Ceará 07 35 39 17 630 72 Camocim Ceará 02 54 40 50 5 73 Acaraú Ceará 02 53 40 07 . 7 74 Granja Ceará 03 07 40 50 9 75 Meruoca Ceará 03 27 40 29 450 76 Viçosa do Ceará Ceará 03 34 41 05 685 77 Tianguá < Ceará 03 44 40 59 795 78 Ubajara Ceará 03 51 40 56 870 79 lbiapina Ceará 03 55 40 53 885 80 lpaguassu Ceará 03 30 40 .16 75 81 Tamboril Ceará 04 50 40 20 360 82 Arpc4fiaçu Ceará 03 53 40 02 190 83 S. Benedig Ceará 04 03 40 52 903 84 Guaraciaba jq Norte Ceará 04 11 40 45 380 85 Bonito Ceará 04 21 40 36 170 86 Ipueiras Ceará 04 33 40 43 238 87 Tamboril Ceará 04 50 40 20 360 88 Paracuru Ceará 03 23 39 05 10 89 Itapipoca Ceará 03 30 . 39 35 98 90 ltapagé Ceara 03 41 39 35 280 91 Irauçuba Ceará 03 44 39 41 190 92 S. Luiz do Curu Ceará 03 40 39 14 35 93 Caucaia Ceará 03 44 38 39 32 94 Fortaleza (Central) Ceará 03 44 38 32 26 95 Maranguape Ceará 03 53 38 41 67 96 Aquariz Ceará 03 54 38 23 30 97 Acarape Ceará 04 13 38 43 76 98 Baturité Ceará 04 20 38 53 123 99 Cascavel Ceará 04 08 38 14 30
100 Cedro Ceará 04 58 39 04 190 101 Caio Prado Ceará 04 39 38 58 111 102 Santa Antônio de Russas Ceará 04 50 38 10 40 103 Araripe Ceará 07 13 40 08 605 104 Boa Viagem Ceará 05 08 39 44 235 105 Uruquê Ceará 05 09 39 10 214
Pesq, agropec. liras., Brasília, 19 (5):529-543. maio 1984,

CLIMATIC FLUCTuATI0NS
533
Lo
ri e"
e"
0 ('4 1
o
o,
N
o
LO
* t 'e c o E
ri
1
('1
o ri C4
o CflNNri t .' 1ri e,'
CO
co
ririe. '-('.1 e.'- e,'t4 Ne'le'IN
'e
ri
+ o e, - tiri- ri -, e.riririe', ri ri ri ri
o e. O CO ri O N ri O LO O (O LO 1 CO LO N 0 ri 00- O ri ,- O) O N CO e,' 'e ri e. 'e ri 'e'eri'eri'eri'e'eririri'e'eriririe'e'e'eriri'e'e'eriri'e'e'e'eLOri
N
riel'e LO(00OCOOre,''e NCOONriLOri'eLfl OONCO(ØN,O.-' NLO'e'eOei e. e. e. e. e. CO CO CO 00 O O e. e. e. CO 00 CO CO CO 0000 CO CO CO 00 O 000 LO LO
1-• oJ
Pesq. agropec. bras., Brasúia, 19(5):529-543, maio 1984.

534 S.J. REDDY
lo - ei ei
ei
e) ei
ei ei
ei ei
o — ei
ei
9 —e.
lo • eieiei .ei • 'ei
• • ' — 'ei ei, -- c — o É - 1
- te ei
N
l) ei-eiei ei eieiei -. ei ei 1')
fl C1 {')tei eieiflei , ei C')Nt) , eiei 1')
ei • "eieiei ei ,N fleiei r',O fleieiflfl
- .eiei't) " • ei ei C) eifl' eiei e) ei
+ O
.2 eiN000,c0co—r-- o ot ei - 1'—e'o)
• z E
C, no lolOt)eiOO),.t',eiOONNWLONt)LOWWLOloNOOOflCOOOOOCO
3 E IOCOIOIOIOLOLOe)nLO.tnCOe)flflfleinnVWtflWO NN o. - -Jc
Pesq. agropec. bras., Brasília, 19(5):529-543, maio 1984.

Lo ri
e ri
ti
ri ri
ti
o ti
o,
CO
N
O
LO
e
e,
ri
o
o,
co
N
O
'O
e
e,
ri
+ o
•0 c o E 1
.2
-E
8 ti
E-.
* e co>
3E o,
CLIMATIC ELUCTUATIONS
ri
ri
ri
ti
ti ,riri.
-e,,
ri ri
ti
ti ,e,t), ti rie,.,- ,(lri t')Cfltiriri rie,) -
- --- ,- e,, • e,) Clflti ri-' ri
QQZ QQQCLC±
CO 1') e e, LO ri LO O CO LO O) O) LO O e LO ,- N O e) o. LO ri LO ri LO CO LO LO e
LO LO CO e e e CO LO e e e CO O e,. CO O CO O) CO e,. 00 N CO o e,. CO 00 CO N
rioLocor-oocoo rie,rieLorinee,oNc000-c,ori-e, tiCøtiOririritic')CD,»Orititi .'Cfl'
I'esq. agropec. bus., Brasília, 19(5) :529-543,
535
e o tu
co
- O) e O) a - 0
o.. o e a, 2 . O) a,- -
° a a2
o
a; o t a
i . . CC e
.9 3
• •
fio 1984.

536
S.J. REDDY
TABLE 3, Harmonics and the correspondíng periods'.
I-farmonic numbers
Significant number of locations (%) F'&jo (class interval) (years)
O 38(36.2) 999.99 (1000.0 - 100.0) 1 41(39.0) 50.00( 100.0- 33.3) 2 45 (42.9) 25.00( 33.3 20.0) 3 21(20.0) 16.67 1 20.0- 14.3) 4 50 (47.6) 12.50( 14.3' 11.1) 5 38(36.2) 10.001 11.1- 9.1) 6 6(05.7) 8.33 ( 9.1 - 7.7) 7 1(01.0) 7.14 ( 1.7 - 6.7) 8 4(03.8) 6.25 ( 6.7- 5.9) 9 21(20.0) 5.56( 5.9 5.3)
10 14(13.3) 5.00( 5.3- 4.8) li 18 (17 . 1) 4.551 4.8- 4.3) 12 23(21.9) 4.17( 4.3- 4.0) 13 17 (16.2) 3.85( 4.0. 3.7) 14 16(15.2) 3.57 ( 37. 34) 15 23(21.9) 3.33( 3.4- 3.2) 16 2(01.9) 3.13( 3.2- 3.0) 17 1(01.0) 2.94( 3.0- 2.9) 18 0(00.0) 2.78( 2.9- 2.7) 19 5(04.8) 2.63 ( 27- 2.6) 20 7(063) 2.50( 2.6. 2.4) 21 7(06.7) 2.38( 2.4- 2.3) 22 4(03.8) 2.27 ( 2.3- 2.2) 23 2(01.9) 2.17( 2.2- 2.1) 24 7 (06,7) 2.08( 2.1 2.0) 25 3(02.9) 2.00( 2.0' 2.0)
data points - 70 and Iags • 25
of locations (iii percent) are significant out ofthe 105 locations in different harmonics.
Harmonics 0, 1, 2 and 4-5 are stgnificant at more than 35% of locations (Table 3). Harmonics 9-15 and 3 are significant at more than 10% of iocations. The band 9-12 liarmonics are more confined to northwestern parta; while the band 12-15 harmonics are more confined to central parts. The very high harmonics (16-25) are more confined to southern parts. The persistence and the harmonics '0' and '1' are more confined to regions above 100S latitude, whiie the harmonic '2' is significant at many locations below 50S lat 3 .
The harmonics 4-5 are significant at locations above 100S lat
Here above and below certain value ot latitude refer to towards the equator and towards south pele respec-tively.
Pesq. agropec. bras., Brasília, 19(5):529-543, maio 1984.
Eig. 2 depicts the rnean annual precipitation and its coefficient of varíations (CV) at 105 loca-tions. The CV's are uniíormly lower in South Bahia State. The CV's are irregular over 4-8°S lat, belt.
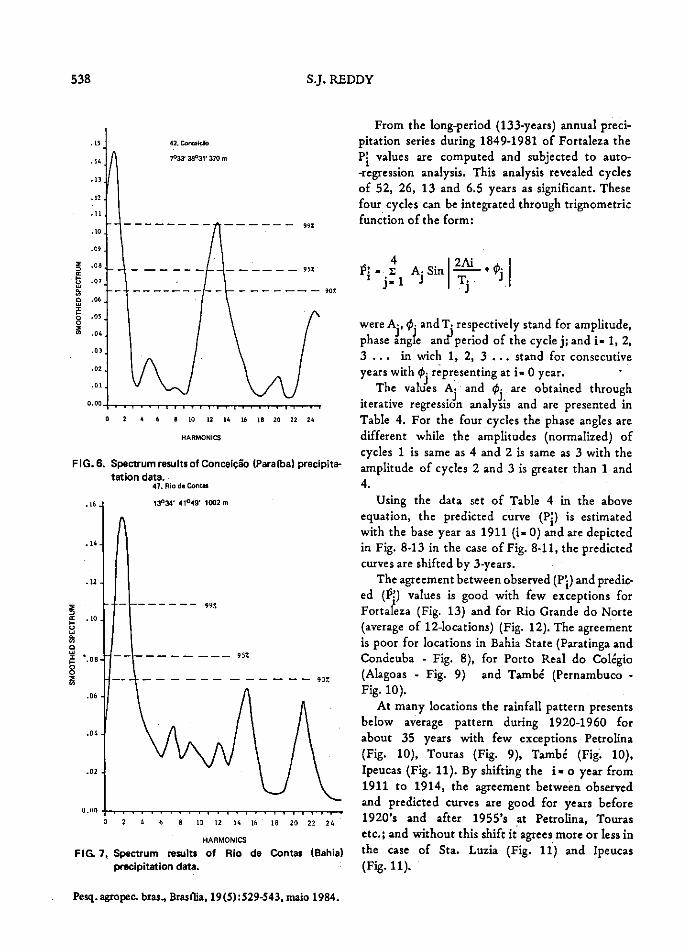
Fig. 3-7 depict the detailed spectruni resutts at few seiected locations. The data series present white--noise at Fortaleza and Taipu red-noise at the other three locations, In alt these diagrams the significant leveis (90, 95 and 99%) represent that of white--noise. In fact, the significant leveis for red-noise decrease exponentiaily from O harmonic with incresing harmonics. Hence, at Conceiçâo and Rio de Contas, respectiveily, the peaks at harmonics 24, 15 and 44,which are not statisticaliy signiflcant according to white-noise leveis, are significant at red-nojse leveis, At Fortaleza, in addition to 0, 1, 2 harnionics, 4 is also significakit. At Itabaiana, hamonics 1, 2, 20 and 25 are signíficant. At Taipu,

CLIMATIC FLUCTUATIONS
537
7°20• 35020' 45..
0 yii/*t • 0
0 )fr j;y3 • j-,o131 ,EAt °
, •"1 .M
30f44 •1iI"1t15'45l .'0;çÇ4 1
5,/% scfis
,sPJ 4y+f 3p/ sZn 4Z/4J
t4';o 4f35 j)1 (7/
•09.t dg$?/37
FIG.2. Locations at which harmonics 16-25 are signíf 1-cant (v) and mean annual precipitation and Ite C.V.
2.0
1 84. FOÇIIZI
0.9 1 3°44
998 3 0.2
'0.2
50 25 02.0 6.23 4.00 2.20 1.50 1.0
CYCLLS v,r,0
2 4 4 840 02 1406 182022 24HARMONICS
FIG. 3. Spectrun, resulte of Fortaleza (Ceará) precipIta-tion data.
0.00
O 2 4 6 a o 02 0 04 00 20 22 24
HA4MONIcS -
FIG. 4. Spectrum resulte of Itabaiana (Paraíba) precipita-tion data.
57. Taipa.
0.1)9
0.00
0.07
0.06
0.00
0,04
0.03 =
0.02 o
0.02
0.05
0.00
O 4 6 8 12 02 04 06 18 20 22 24
HARMONICS
FIG. 5. Spectrurn resulte of Taipu (Rio Grande do Norte) precipitation data.
harnonics 1, 2,3 and 15 are significant. At Concei-ção, the harmonics 0,1,2, 13 and 24 are significant wide at Rio de Contas harmonics 1, 2, 15 and 21 are signiflcant.
Fíg. 8-13 depict doe time series of precipitation expressed as doe ratio of average precipitation te. - [(P 1 -P)/PJ, where Pi is the precipitation of year 1, and P is the average precipitation of doe series at few select locations. These series are compared with the predicted curve estimated as foliows:
)8
Pesq agxopec. bras. 9 Brasília, I9(5)529-543, maio 1984.
538
S.J. REDDY
42. Conceiçio
703 38°31 37Cm
.13
.11
90] .10
09
.08 - -- -- —!.--1 ------95]
.07
--4. — — — — — — — -- — — - -------90] O .06 =
.05 o
.04
.01
.02
O 2 4 é $ 10 II 14 16 15 20 22 24
KARMONICS
FIG 6. Spectrum resuits of Concelçflo (Paraíba) precipita-tation data.
41. Rio de Conta
o
1- o L&J o. 10 o 16 a o o 10
0.
O 2 4 8 lO 12 54 16 IS 20 22 24
HARMONICS
FIG. 1. Spectrum reaolts of Rio de Contas (Bahia) p1ecipitation data.
Pesq.agropec. bras., Brasília, 19(5):529-543, maio 1984.
From the long-period (133-years) annual preci-pitation serits during 1849-1981 of Fortaleza the
values are computed and subjected to auto--regression analysis. This analysis revealed cycles of 52, 26, 13 and 6.5 years as significant. These four cycles can be integrated through trignometric function of the form:
A.Sin Oi li-li 1 11i
were A 5 Ø. andT. respectively stand for amplitude, phase ange andperiod of the cyclej; and i- 1, 2, 3 . . - in wich 1, 2, 3 stand for consecutive yearswith Q5j representing at i. 0 year.
T}ie valuesA. andare obtained through iterative regression analysis and are presented in Table 4. For the four cycles the phase angles are different while the amplitudes (normalized) of cycles 1 is sarne as 4 and 2 is same as 3 with the amplitude of cycles 2 and 3 is greater than 1 and 4.
Using the data set of Table 4 in the above equation, the predicted curve (P) is estirnated with the base year as 1911 (i-0) and are depicted in Fig 8-13 in the case of Fig. 8-11, the predicted curves are shifted by 3-years.
The agreement between observed ('i) and predio-ed (P) values is good with few exceptions for Fortaza (Fig. 13) and for Rio Grande do Norte (average of 12-locations) (Fig. 12). The agreement is poor for locations in Bahia State (Paratinga and Condeuba - Fig 8), for Porto Real do Colégio (Alagoas - Fig. 9) and També (Pernambuco - Fig. 10).
At many locations the rainfail pattern presents below average pattern during 1920-1960 for about 35 years with few exceptions Petrolina (Fig. 10), Touras (Fig. 9), També (Fig. 10), Ipeucas (Fig. li). By shifting the ia o year from 1911 to 1914, the agreement between observed and predicted curves are good for years before 1920's anti after 1955's at Petrolina, Touras etc.; and without this shift it agrees more or less in the case of Sta. Luzia (Fig. 11) and Ipeucas (Fig. 11).

CLIMATIC FLUCTUATIONS
539
13. Paratinga (Bahia)
10. Condeuba (Bahia)
12042' 430 10 420m 743 mm
14052' 4159' 695 m 757 mmm
1.0
0.8
0.6
w O < 0.4
LII > < 0.2
0.0
—0.2 o
0.4
- 0.6
- 0.8
- 1.0
1912 1932 1952
1972 1992 1912
1932 1952 1912 1992
FIC, 8. Time Genes of Paratinga and Condeuba precipitation.
61. Porto Real do Colégio (Alagoas)
52. Touras (Rio Grande do Norte)
100 11'36050 30m 899 mm
50 12' 35028 4m 1015mm
0.6
0.4
0.2 III O
0.4 III
C 0.2
o
LI.
o, 2 2 - 0.2
- 0.4 o
- 0.6
- 0.8
- 1.0
1912 1932 1952 1972 1992 1912 1932 1952 1972 1992
F IG. 9. Time senies of Porto Real do Colégio and Touras precipitation.
Pesq. agropec. bras., Braslia, 19(5):529-543, maio 1984.

Lu 0.4
0,2
0.0 o a. ti) - z o
-0.4
1.0
0.8
0,6
> 0.6
- 0.8
1.0
540
S.J. REDDY
8. Petrolina (Pernambuco)
7. Tambe (Pernambuco)
9023' 40030' 376 m
7025' 3507' 190m
1.0
0.8
0.6
ai o 0.4
W 0.2
0.0 o LI.
- 0.2 z o
- 0.6
- 0.8
- 1.0
1912 1932 1952 1972 1992
1912 1932 1952 1972 1992
Fia 10. Time penes of Petroíina and Tambe precipitation.
38. Sta. Luzia (Paraiba)
86. lpeucd (Cearé)
6°52' 36°56' 290 m 4033' 40043' 238 m
1912 1932 1952 1972 1992
1912 1932 1952 1972 1992
FIO. 11. Time Seria. of Sta. Luzia and ipeuca, precipitation.
Pesq.agropec.bras.,Bras(lia, 19(5):529.543,ntaio 1984.

CLIMATIC FLUCTUATIONS
541
DISCUSSION
0.
o. 4
o.
z o
O.
>
Lii.: 4°5? ti 6°43 L.og.t 350710 38° Alt.: 01 lo 906 II 9. Jardim do &rjdê
2. 5, Jota do sinal 3. Oa. N.gro do moro. 4.NooiCroi O, 0.tjotr,oim. 9. Ar. ii Br ii, aí 7. Rolado 9.C.r.úb.i 9. Tmaoo
lO. Loja Oot,o. 91.0, Mjoual
O
0900 1932 951 111 991
VEARO
FIG. 12. Time series ei the precipitation averages of 12 locations from Rio Grande do Norte.
Eventhough at many locations the data series present persistence, the spectral density pattern did not show much difíerence between locations with persistence and without persistence (Table 2). The difference lii the spectral density patterns among the nearby locations is more associated with non-homogeneity in the data series. This character is alio revealed in the coeffficient of variation (CV) of annual precipitation as irregular beliavior (Fig. 2) lii general CV decreases with increasing precipitation. These features are clearly evident iii annual rainfall pattern presented in Fig. 14 and 15. Therefore, it is very important to isolate alt those locations that do not fit into the general pattern of the surrounding locations and correct thern using regression approach or grid method of extrapolation. The best way of identifying the non-homogeneous locations Is through principal
Lat.: 3046' Long.; 38034' 30 m
1
o
w o
w >
o o cc Lo-
'o -0 2 o
o
1-•
> w - o
-0
.1
1849 1870 1890 1910 1930 1950 1970 1990 2010
VEARS
FIG. 13. Time serias of Fortaleza (Ceará) precipitation.
Pesq. agropec. lixas.. Brasília, 19(5):529-543, maio 1984.

3l00
009
0DINII
se %l .9fl
542 S.J. REDDY
TABLE 4. Amplitudes and phases of different cycles iii Fortaleza data.
Cycle Amplitude Phase 1 (Vears) (degrees)
52 0.1875 6.923 26 0.3125 318.462 13 0.3125 110.769 6.5 0.1875 0.000
4
• Normalized amplitude presents the deviations frorn the avorage as a ratio o! average.
" This phase angle corresponds to 1911 at Fortaleza.
T.n.4,,, .11.40. P9111... P9111911. 1411 .1191
P.dn9I .0.1,.., LS.00001. 49260 191199
'00.
1111 4119
V 1i'111
900 r 1M1
,
109 9 ,
300
II
3)0 PIAUI
100
'lan
FIO. 14. Annual rainfali pattern at Patamute and Bom Jardim.
component analysis this is nat attempted in this study.
In terms aí significant cycles, the Nortlieast Brazil can be divided into three hornogeneous zones, namely:
Region 1- locations above 4 0 S lat. Region II - locations itt between 4.80S lat. Region III - lacations below 8°S lat. The boundaries of individual regians are variable
between 4-5 and 8-10°S lat. In ali these regions, harmonics O, 1 and 2 are
significant at many locations. 1-Iarmonics 4-5 are signiflcant at many locations above 8100S lat. (i.e. Regions 1 and II). Simiiarly, harmonics 9-12 and 13-15 are mainly canfined to Regians 1 and II; while liarmonic 9-12 is more prominent in
Pesq. agropec. bras., Brasília, 19(5):529-543, maia 1984.
1613 1931 1926 1937 641 1913 1961 949
VIARI
FIO. 15. Annual rainfall pattern for twa growps ai loca-tians In Piauí.
Region 1 and harmonic 13-15 is more prominent in Region II. The harmanic 16-25 (QBO) is mainly significant itt Regian III. In Region III, the CV af annual precipitation is more uniform and presents slightly lower values compared to ather regions. The CV is highly irregular in Region II and next in arder comes Region 1.
The auto-regressian analysis af 133-year data series 0f Fortaleza (Region 1) during 1849-1981 revealed faur cycles, namely 52, 26, 13 e 6.5 years. The first tliree cycles are closer ta harmonics 1, 2 and 4; while the faurth cycle (6.5 years) is slightly different (ram harmonic 9-12 (Fig. 3) the latter cycie is nat significant in spectrum analysis of Fortaleza data series. Through iterative regression the normalized amplitudes and phase angles for tliese four cycles are found (Table 4). It is seert from Table 4 that the amplitudes aí cycles 26 and 13 years are slighty higlier than thase aí 52 and 6.5 years cycles. Strang (1979) reparted a 13-year cycle in Fortaleza data. Gjrardi (1983) reparted 26-year cycle. Carlos et al. (1982) faund cycles 26 and 13 years as significant. 1-lawever, they stated that these twa cycles explained anly 24% af variance in the data series. Reddy (1977) faund cycle af 52-years itt the data aí anset aí mansaan aver a law latitude Kerala Coast (Incha). However, this cycle lags behind about 15-years ta Fortaleza data. In the case aí South Africa at

CLIMATIC FLUCTUATIONS
543
a slightly higher latitude zone cycles of 60, 30, 20 and 10 are significant (Reddy & Singh 1981).
The integrated curve from these four cycles (Table 4) matches well with 4iose locations in Region 1 and II. The matching is very poor ia the case of Region lii. Few locations present good agreement between observed and predicted curves prior to 1920's and tater 1955's. There is a discre-pency during 1920's to 1955's. Fig. 15 depicts the rainfail pattern of two groups of locations ia Piauí. During 1920's to 1955's the two groups present opposite behaviour. Similar pattern is also evident iii Rio Grande do Norte. However, the average pattern presents the solid une pattern (Fig. 12).
The observed cydic variations in the climatic parameters were attributed to several forms of solar and lunar phenomena However, the present data series did not show any relation to either single or double sunspot cycles.
The major differences iii the observed cycles in Region III when compared to Regions 1 and II may be due to the differences in the mechanisms that bring precipitation over these regions of the Northeast Brazil.
CONCLUSIONS
1. According to the cycles that are present in the annual precipitation data, the Northeast Brazil (excluding Maranhão and Piauí) could be divided into three homogeneous zones, namely: Region 1 comprises regions above 4-5S lat.; Region III comprises of regions below 8-10°S lat.; and in between these two regions Region II.
2. li is evident from the auto-regression analysis that in Region 1, the dry period (below average precipitation) commenced ia 1979 may continue upto 1995 with a break for three years in 1988-1990. The wet period (above average precipita-doa) may commence in 1996 and terminate ia 2003. Similar patterns are not evident clearly in Regions II and III, eventhough Region II resembies Region 1.
3. The precipitation data of some locations present a non-homogeneity with time. This emphasises the importance of the checking and correcting the data series of different stations
of the Northeast Brasil before they are actually used in any study.
4. The differences in the observed periodicities ia tlie precipitation data may be due to either non--homogeneity iii the data series or due to the dif-ferences in the mechanisms that bring precipita-tion to different parts of the Northeast Brazil or both.
REFERENCES
BLkCKMAN, R.B. & TUKEY, J.W. The measurement of power spectra. New York, Dover pubi. Inc., 1958.
CARLOS, A.N.; HORÁCIO, H.Y. & COLUNA, C.F.Y. Previsão de secas no Nordeste pelo método das peno-dicidades: uso e abusos, si,, INPE, 1982. (INPE 2344, RPE, 407).
GIRARDI, C. Previsão acertada: A seca do Nordeste já dura cinco anos e reabilita o prognóstico do Centro Técnico Aeroespacial. Veja, 26(1):60-1, 1983.
JENKINS, G,M. & WATTS, D.G. Spectral analysis and itsapplications. California, Holdan-Day Inc., 1968.
REDDY, Si. Forecasting the onset of southwest monsoon over ICerala. Indian J. Meteoro!. Hydrol. Geophys., 28:1134,1977.
REDDY, S.J. & AMORIM, M. da S. A method for the estimation of potential evapotranspiration and/ar open pan evaporation over Brazil. Pesq. agropec. bras,, Brasília, 19(3):247-67,max, 1984.
REDDY, S.J. & AMORIM, M. da S. Dados climatológi-a» da precipitação, evapotranspiração potencial, radiação global solar e classificação da climática do Nordeste do BrasiL sI., EMBRAPA-CPATSA, 1983.
REDDY, SI.; AMORIM, M. da S. & ELPIDIO, M. da G. da S. A simple method for the estimation of global solar radiation over northeast Brazil. Pesq. agropec. bras., Brasília, 19(4):391-405, abr. 1984.
REDDY, S.J. & SINGH, S. Climate and saiE of the semi-'and tropical regions of the would. s.n.t. Proceedings of Summer Institute on Production Physiology of dryland crops, beM at APAU/ICAR, Rajendranagar, A.P., India, 1981.
STRANG, D. MAC, G.D. Utilização dos dados pulvio' métricos de Fortaleza, CE, visando determinar pro-babilidades de anos secos e chuvosos. São José dos Campos, SP, CIA/IAE, 1979. Relatório Técnico ECA - 03179.
TUKEY, J.M. Sampling theory of power spectrum estimates. ln: SYMI'. ON APPL. AUTO-CORRE. ANALYSIS TO PHYSICAL PROBLEMS. Washinton, D.C., 1950. p.47-67. VS Nary Research, NAVE XOS-P-735.
WORLD METEOROLOGICAL ORGANIZATION. Clima-tic Otange. Geneva, Switzerland, 1966. WMO Teclani-cal Note, 79, WMO, 195 TI' 100.
Pesq. agropec. bras., Brasília, 19(5):529-543, maio 1984.