climate statistics, uae
TRANSCRIPT

Climate Statistics, UAE 2019

2
Key statistics and data for global competitiveness
and sustainable development in the UAE.
The data presented in this report collected from official sources in
the UAE.
For more information, please contact us:
@FCSAUAE
www.fcsa.gov.ae

3
Climate Statistics, UAE 2019 Statistics describing climate include temperature, precipitation, humidity, pressure, wind speed,
solar radiation, and more. Climate is described by these elements over a long period for a specific
area. Weather phenomenon describe weather conditions over a specific area over a short period.
Weather conditions are usually recorded by countries through a network of monitoring stations
to monitor climate elements.
Important Notes: 1- The report contains statistics obtained from the National Center of Meteorology.
2 - The report includes the stations that managed by the National Meteorological Center
Key Points
During the period 2003-2019, the monthly average of the highest temperature recorded in
July reached about 35.8 ° C, and the highest average maximum temperature in July also
reached 42.2 ° C, and the lowest average minimum temperature in January was about 13.1 °
C.
In 2019, the highest monthly average temperature in June was 35.8 ° C, while the maximum
temperature reached 51.8 ° C in June making it the hottest month of the year, while the
lowest minimum temperature was 1.1 ° C in March.
The average amount of rain reached 101.1 mm in 2019, an increase of about 20.1 mm over
the annual rate for the years 2003-2019.
The highest average maximum relative humidity reached 86% in January, and its highest
average reached 64% in January as well. Minimum relative humidity reached its lowest levels
in the summer months, especially in May, when it reached 17%.
The highest value of air pressure in 2019 reached 1025 hPa at Al Ain Airport Station in
January, and most of the major state stations and airports recorded the lowest air pressure
in July.
The highest average wind speed of the main stations in 2019 was 20 km / hour, at Abu Dhabi
Airport Station in March, and the highest average wind speed was 44 km / hour in October
at Al Ain Airport Station.
The highest average hours of brightness were in June and July, and the average hours of
solar brightness for major stations is about 9.6 hours /day.
In 2019, most natural phenomena, such as fog, thunderstorms and sandstorms, occurred in
March surrounding most of the main stations.

4
Climate Monitoring Stations
The number of operational climate monitoring stations in 2019 reached 89, with an
increase of 13 stations over 2016.
These stations distributed in all the Emirates of the country, with more than 57% of
stations located in the Emirate of Abu Dhabi, where the total number of stations is to 51.
This is because Abu Dhabi is the largest Emirate in terms of area and the most diverse in
geographical nature.
The location distribution of the stations showed that the coverage sites are, land areas,
airports, islands and mountains. Land-based stations formed 81% of the stations,
followed by airports (8%) then mountain and islands stations (5.6%) for each of them.
This large number of stations and their distribution in all regions shows the interest of the
UAE in monitoring the elements of climate. The monitoring and assessing of these climatic
conditions is essential for the protection measures that taken, in regards to the UAE’s natural
resources.
Percentage Distribution of the Number of Climate Monitoring Stations by Emirate. 2019
Percentage Distribution of Climate Monitoring Stations Number by Location. 2019
57.3
9.06.7
2.22.2
14.6
7.9
Abu Dhabi Dubai Sharjah Ajman Umm Al-Quwain Ras Al-Khaimah Fujairah
80.9
7.9
5.65.6
land Airport Islands Mountain

5
Air Temperature
The National Center of Meteorology data indicate that the monthly average temperature
during the years 2003-2019 was the highest in July and reached about 35.8 ° C, and the
highest average maximum temperature reached also in July reached about 42.2 ° C, and
the lowest average minimum temperature in January was about 13.1°.
Mean Temperature, by Month, 2003-2019
When comparing the monthly mean minimum temperature for 2019 with the average
minimum temperature for the past seventeen years (2003-2019), it was very close with a
slight increase in the summer months of June and September, while the same is true for
the winter months of January and December.
Comparison of Mean Minimum Temperature for 2019 with Monthly Average for Years 2003-2019 (° C)
0
5
10
15
20
25
30
35
40
45
Jan. Feb. March April May June July August Sept. Oct. Nov. Dec.
Tem
per
atu
re
Month
Minimum TemperatureAverage
Average temperature
Maximum temperaturAverage
0.0
5.0
10.0
15.0
20.0
25.0
30.0
35.0
Jan. Feb. March April May June July August Sept. Oct. Nov. Dec.
Monthley Mean2019-2003
2019

6
The average temperature in 2019 was also close with the average temperature for the
years 2003-2019, but with a slight increase (less than one degree) in the summer months
of June and January and December as well.
Comparison of Mean Temperature for 2019 with Month Average for Years 2003-2019 (° C)
As for the average maximum temperature in 2019, it was slightly higher than the average
maximum temperature for the past seventeen years in June by 1.5 ° C in the summer
months and in January by 2.3 ° C above the average for the years 2003-2019.
Comparison of Mean Maximum Temperature for 2019 with Month Average for Years 2003-2019 (° C)
0.0
5.0
10.0
15.0
20.0
25.0
30.0
35.0
40.0
Jan. Feb. March April May June July August Sept. Oct. Nov. Dec.
2019
0.0
5.0
10.0
15.0
20.0
25.0
30.0
35.0
40.0
45.0
Jan. Feb. March April May June July August Sept. Oct. Nov. Dec.
2019
Monthley Mean 2019-2003

7
Rainfall
Annual rainfall rates showed a great variation over the years 2003-2019, and there is
variation in the distribution of rain to different regions in the country.
The data showed that the rate of recorded rain in 2019 is twice the rate of rain in 2018, it
reached about 101.1 mm, it is about 20.1 millimeters higher than the annual average
amount of rain in the country (2003-2019.
Mean annual rainfall during the years 2003-2019 (mm)
Relative Humidity
The relative humidity average, minimum and maximum during the years 2003-2019
indicate a high humidity levels in the winter months. The highest maximum rate was 86%
in January, and the highest average reached 64% in January as well. The minimum
reached the lowest levels in the summer months, especially May. As it reached 17%, this
situation is consistent with increasing temperatures in summer months.
Mean Relative Humidity by Month, 2003- 2019
0.0
20.0
40.0
60.0
80.0
100.0
120.0
140.0
20
03
20
04
20
05
20
06
20
07
20
08
20
09
20
10
20
11
20
12
20
13
20
14
20
15
20
16
20
17
20
18
20
19
0102030405060708090
Jan
.
Fe
b.
Ma
rch
Ap
ril
Ma
y
Jun
e
July
Au
gu
st
Se
pt.
Oct.
No
v.
De
c.
%
Month
Minimum RealtiveHumidity Mean
Realtive HumidityMean
Maximum RealtiveHumidity Mean

8
Atmospheric Pressure
Data of the main stations in the country showed that the highest value of air pressure in
2019 reached 1025 Hectopascal (hPa). It was at Al Ain Airport Station in January, and
most of main stations and airports of the country recorded the lowest air pressure in
July. The lowest air pressure (990.5 hPa) recorded at Abu Dhabi Airport Station in
August. Al Ain Airport Station recorded the highest average air pressure in January, at
1019.8 hPa.
Mean Air pressure by month for Main Stations by Month, 2019 (hPa)
Wind Speed
The data of the main stations in the country showed that the highest average wind speed
in 2019, was in Abu Dhabi Airport station, reached 20 km / hour in March, and the highest
average highest wind speed reached 44 km / hour in October at Al Ain Airport Station.
The results of the main stations in 2019 also showed that the average wind speed in most
months of the year for main stations in the country was close to 12.5 km / hour.
Mean Wind speed of Main Stations by Month in 2019 (km / h)
970.0
980.0
990.0
1,000.0
1,010.0
1,020.0
1,030.0
Mean air pressure
Min.air pressure
Max.air pressure
0
5
10
15
20
25
30
35
Jan
.
Feb
.
Mar
ch
Ap
ril
May
Jun
e
July
Au
gust
Sep
t.
Oct
.
No
v.
Dec
.
Mean max Wind Speed
Mean Wind Speed
9
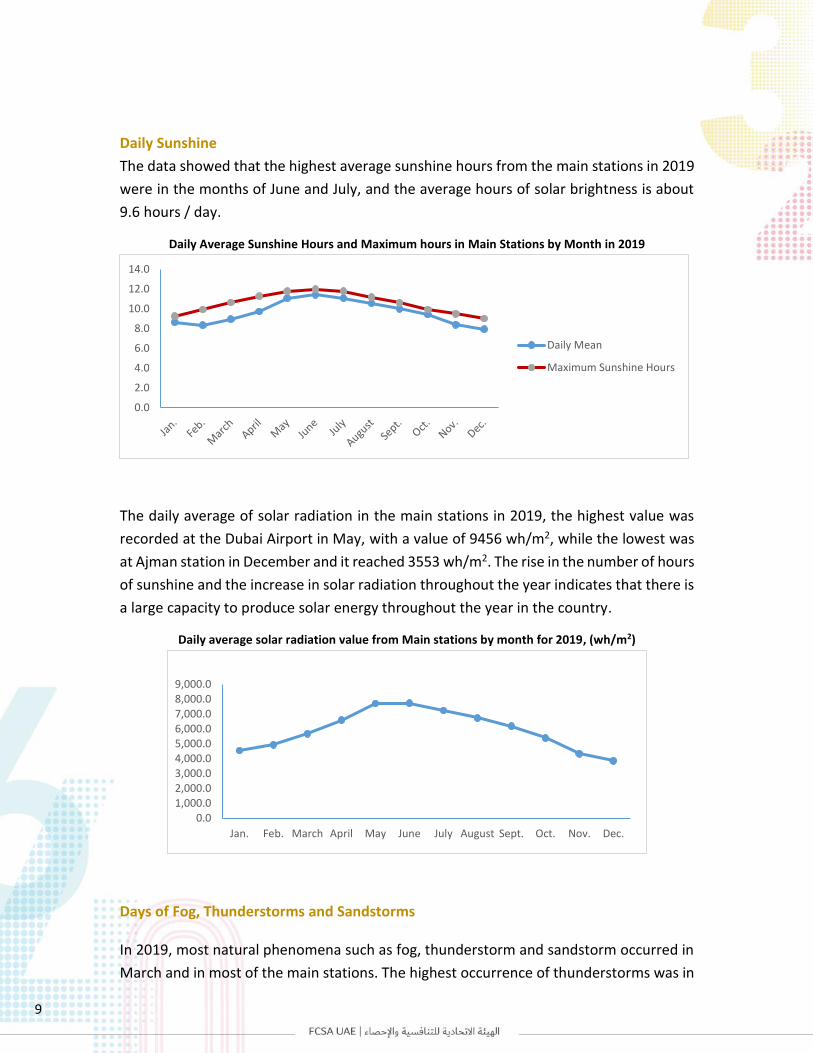
Daily Sunshine
The data showed that the highest average sunshine hours from the main stations in 2019
were in the months of June and July, and the average hours of solar brightness is about
9.6 hours / day.
Daily Average Sunshine Hours and Maximum hours in Main Stations by Month in 2019
The daily average of solar radiation in the main stations in 2019, the highest value was
recorded at the Dubai Airport in May, with a value of 9456 wh/m2, while the lowest was
at Ajman station in December and it reached 3553 wh/m2. The rise in the number of hours
of sunshine and the increase in solar radiation throughout the year indicates that there is
a large capacity to produce solar energy throughout the year in the country.
Daily average solar radiation value from Main stations by month for 2019, (wh/m2)
Days of Fog, Thunderstorms and Sandstorms
In 2019, most natural phenomena such as fog, thunderstorm and sandstorm occurred in
March and in most of the main stations. The highest occurrence of thunderstorms was in
0.0
2.0
4.0
6.0
8.0
10.0
12.0
14.0
Daily Mean
Maximum Sunshine Hours
0.01,000.02,000.03,000.04,000.05,000.06,000.07,000.08,000.09,000.0
Jan. Feb. March April May June July August Sept. Oct. Nov. Dec.

10
Al Ain Airport, where it recorded 22 days. There were no sandstorms or fog at the Fujairah
airport station, and 20 days of thunderstorms recorded there. While, sandstorms
(Horizontal visibility is less than 1000 meters), its highest occurrence was in Al Ain Airport,
and Sharjah Airport did not record any sandstorms. Foggy day’s occurrence was more
frequent at Sharjah Airport Station, where it recorded 11 days of fog.
The Number of Natural Occurrence Days (Outdoor Thunderstorms, Sandy Fog) According to Station,
2019
0 5 10 15 20 25
Abu Dhabi Airport
Al - Ain Airport
Dubai Airport
Sharjah Airport
Ras Al - Khaimah Airport
Fujairah Airport
Foggy Dust Storm Thunder Storm

11
Explanatory Notes
Source
Federal Competitiveness and Statistics Authority
Original sources: National Center of Meteorology.
Data Collection
Data obtained by electronic flow from the databases at National Center of
Meteorology.
Data Quality Assurance
Data reviewed and audited according to the rules of quality assurance in Federal
competitiveness and Statistics Authority.
The FCSA team made calculations of summations on emirate and country level, based
on the individual data for each Monitoring stations.
Glossary:
Maximum Temperature The Highest monthly maximum temperature observed in a
specific month, measured by (C ْ )
Minimum Temperature The lowest monthly minimum temperature observed in a
specific month, measured by (C ْ )
Mean Daily Maximum Temperature for a Month Mean of daily maximum temperatures
observed during a specific month, measured by (C ْ )
Mean Daily Minimum Temperature for a Month Mean of daily minimum temperatures
observed during a specific month measured by (C ْ )
Mean Daily Temperature Mean of the temperatures observed at 24 equidistant times in
the course of a continuous interval of 24 hours, measured by (C ْ )
Mean Monthly Maximum Temperature Mean of the monthly maximum temperature
observed during a specific month over a specific period of years, measured by (C ْ )
Mean monthly minimum Temperature Mean of the monthly minimum temperature
observed during a specific month over a specific period of years, measured by (C ْ )
Total Rainfall amount Amount of total rainfall measured during a period of 24-hours by
means of a rain guage.
Maximum Relative Humidity The Highest daily maximum relative humidity observed in
a specific month (%).
Average Maximum Relative Humidity Mean of daily maximum relative humidity
observed during a specific month (%).
Minimum Relative Humidity The lowest daily minimum relative humidity observed in a
specific month (%).
Average of Atmospheric Pressure Mean of the atmospheric pressure, reduced to mean
sea level, observed at 24 equidistant times in the course of a continuous interval of 24
hours (Unit: Hiktobaskal).
Maximum of Atmospheric Pressure The Highest daily maximum of atmospheric
pressure, reduced to mean sea level, observed in a specific month (Unit: Hiktobaskal).

12
Minimum of Atmospheric Pressure The lowest daily minimum Atmospheric pressure,
reduced to mean sea level, observed in a specific month (Unit: Hiktobaskal).
Wind Speed Horizontal movement of air per unit time: it is measured at the height of 10
m above ground using anemometer (km/hr). Mean total Daily Sunshine Hours Mean of daily total time interval during which solar
radiation reaches a sufficient intensity to cast distinct shadows (measured by hour)
Maximum total Daily Sunshine Hours Maximum of daily total time interval during which
solar radiation reaches a sufficient intensity to cast distinct shadows (measured by hour)
Mean daily of total global solar radiation Average of the daily values of total global
solar radiation in a specified period (wh/m2)
Maximum wind speed The maximum wind speed measured over a period of 10 minutes
at standard height of 10 meters above the ground in an open situation.
Fog Suspension of very small microscopic water droplets in the air, generally reducing
the horizontal visibility at the earth’s surface to less than 1 km.
Thunderstorm Sudden electrical discharges associated with lightning and thunder
.Thunderstorms are associated with convective clouds (Cumulonimbus) and are more
often, accompanied by (Rain-Hail –Snow Pellets).
Sandstorms / Dust storms An ensemble of particles of dust or sand energetically lifted
to great heights by a strong wind which reduce horizontal visibility.