climate smart agriculture for the small-scale …...climate smart agriculture for the small-scale...
TRANSCRIPT

Climate Smart Agriculture for the Small-Scale Farmers
in the Asian and Pacific Region
Edited by Yasuhito Shirato and Akira Hasebe

Climate Smart Agriculture for
the Small-Scale Farmers
in the Asian and Pacific Region
Edited by
Yasuhito Shirato and Akira Hasebe
National Agriculture and Food Research Organization (NARO)
Tsukuba, Japan
Food and Fertilizer Technology Center (FFTC)
for the Asian and Pacific Region
Taipei, Taiwan
EDITORIAL BOARD Co-Chairs: Yasuhito Shirato Research Manager for Climate Change, Institute for Agro-Environmental Sciences, NARO Akira Hasebe Deputy Director, FFTC Members: Tomonari Watanabe Director General, Institute for Agro-Environmental Sciences, NARO Shori Yamamoto Director, Department of Planning and General Administration, Institute for Agro-Environmental Sciences, NARO Hsin-Ho Wei Assistant Researcher, FFTC Ronald G. Mangubat Information Officer, FFTC Claire Fang Secretary, FFTC Secretariat: Planning and Cooperation Section, Institute for Agro-Environmental Sciences, NARO Cover photos: Front: Paddy rice field in Thailand, Photograph by: Dr. Hiroshi Nakagawa, NARO Back: Photograph by: Dr. Kazunori Minamikawa, JIRCAS Japan International Research Centre for Agricultural Sciences

ISBN-978-4-908914-02-7
All rights reserved. No part of this book may be translated or reproduced in any form without written permission from NARO. 2019 by NARO Printed in Taiwan

i
PREFACE
Climate change-induced phenomena such as extremely high temperatures and more frequent torrential rains are making a huge impact on our lives and economies. And agriculture is no exception. We at NARO are working to develop and popularize technologies that contribute to the agricultural and industrial communities, and research on measures to address climate change is one of our key tasks.
Broadly speaking, three main themes guide the development of technologies for responding to climate change. The first theme is prediction of climate change’s future impact on agricultural production, the second is development of measures on how to address the impact that has already become apparent, and the third is reduction of the greenhouse gases emitted by agricultural activities. To ensure that the technologies thus developed are widely utilized throughout the agricultural community, it will be essential to make proactive use of the information and communication technologies that have advanced rapidly in recent years.
Across the Asia-Pacific region, agriculture focusing on rice farming in monsoon zones is common, and those of us living in this region share the same challenges. Against the backdrop of changing climatic conditions, it is our shared challenge to further develop the high levels of productivity and the sustainable farming in this region, and to pass these on to the next generation.
This volume is a collection of 22 selected research papers presented either at the NARO-FFTC-MARCO Symposium 2018 “Climate Smart Agriculture for the Small-Scale Farmers in the Asian and Pacific Region” or at the NARO International Peer Review Meeting on “Tackling the challenge posted by climate change in the agriculture of Monsoon Asia”, both were held in Tsukuba in September 2018. I express my deepest gratitude to all the contributors. I believe that this monograph will facilitate advancing international collaboration to cope with the increasingly acute agro-environmental challenges being faced in monsoon Asia.
Kazuo Kyuma
President
National Agriculture and Food Research Organization (NARO)

ii
PREFACE
The Food and Fertilizer Technology Center for the Asian and Pacific Region (FFTC) is an international organization devoted to promoting the sustainable agricultural and rural development in the region. One of its main activities is to co-organize the international symposiums/ workshops/ seminars/ training courses with the top agricultural research institutes and universities in the region, focusing on current important issues related to the improvement of agricultural productivities, farm income, rural environment and living conditions. FFTC works closely with the top agricultural research institutes of member and observer countries to identify the common interests and agreed upon topics in order to co-organize these events. We are happy to co-organize this international workshop on “Climate Smart Agriculture for the Small-Scale Farms in the Asian and Pacific Region” with the National Agriculture and Food Research Organization (NARO) and the Monsoon Asia Agro-Environment Research Consortium (MARCO). We believe that the publication of this book will contribute greatly to the understanding of climate related issues and how the small-scale farmers will be able to adapt more effectively to these climate change problems.
How to smartly adapt to the climate changes is an important issue, especially for small-scale farmers. Majority of these farms are worked under the natural and unprotected environment and lack of resources to deal with climate change problems. They are vulnerable to climate changes which endanger the food security of these farms the most. Twenty two articles included in this book will be able to provide the valuable updated knowledge for the researchers in this area to learn from each other and set the foundation for further communication and formulating research ideas. Certainly the information provided in this book will also be useful for government officials to formulate more effective policies to help small-scale farmers adapt to problems related to climate change.
Kuo-Ching Lin
Director
Food and Fertilizer Technology Center (FFTC)
for the Asian and Pacific Region


CONTENTS
PREFACE .................................................................................................... i, ii
Mitigation options for greenhouse gas emissions from agricultural lands in the Asian and Pacific region
Mitigation of yield-scaled global warming potential by plastic mulch
technology in rice crops in Southwestern China Guang-bin Zhang, Jing Ma, Hua Xu, Shi-hua Lv, and Xiao-yuan Yan............... 1
Dissemination of water management in rice paddies in Asia
Kazunori Minamikawa, Takayoshi Yamaguchi, and Takeshi Tokida ................ 19 System of rice intensification: An alternative mitigation strategy to
greenhouse gas emissions from paddy fields in Indonesia Chusnul Arif, Budi Indra Setiawan, Nur Aini Iswati Hasanah, and Masaru Mizoguchi ................................................................................... 37
Zero-waste rice-based farming system for small-scale farmers
Eduardo Jimmy P. Quilang, Rizal G. Corales, Ronan G. Zagado, Kristine S. Pascual, Filomena S. Grospe, Evelyn F. Javier, Elmer G. Bautista, and Ricardo F. Orge ...................................................................................... 53
Manure management for greenhouse gas mitigation in Japan
Takashi Osada, Yasuyuki Fukumoto, Takahiro Yamashita, and Akifumi Ogino ......................................................................................... 67
Application of agricultural practices to increase soil carbon
sequestration in Taiwan Chi-Ling Chen, Chiao-Ying Chou, Ming-Chieh Lin, and Jheng-Hong Hu ....................................................................................... 89
Technical measures to mitigate greenhouse gases from agricultural fields
Hiroko Akiyama, Seiichi Nishimura, Miyuki Nakajima, Akinori Mori, Yuhei Hirono, Tomohito Sano, Hiroyoshi Sugiura, Nobuhisa Koga, Takeshi Yamane, Shigeto Sudo, Yasuhiro Nakajima, Yuko T Hoshino, and Yoriko Sakai .................................................................... 107

Efforts of National Institute for Agro-Environmental Sciences/National Agriculture and Food Research Organization in applying greenhouse gas mitigation technologies to Monsoon Asian countries and international frameworks since 2011
Yasukazu Hosen, Kazunori Minamikawa, Shigeto Sudo, Yasuhito Shirato, and Ayaka W. Kishimoto-Mo .................................................................. 115
Mechanisms and impacts of global environmental change
on crop production in the Asian and Pacific region Bayesian statistical models for quantitative synthesis of climate change
impact studies David Makowski ................................................................................... 129
A platform for digitizing and scaling up options with small farms into SDG:
A review Attachai Jintrawet ................................................................................. 139
Evaluation of fuzzy logic systms to assess climate suitability of
Italian ryegrass Shinwoo Hyun and Kwang Soo Kim ......................................................... 157
Impact of climate change on rice productivity and adaptation strategy
in Japan Yasushi Ishigooka, Motoki Nishimori, Tsuneo Kuwagata, and Toshihiro Hasegawa .............................................................................. 177
Improvements in climate change risk assessment for global crop production
Toshichika Iizumi .................................................................................. 191
Adaptation options to reduce vulnerability of agricultural systems to the risks related to climate change
in the Asian and Pacific region Making the smallholder farmers in Southeast Asia climate smart - the
CCAFS R4D thrust Leocadio S. Sebastian and Eisen Bernard V. Bernardo ................................ 201

Paving the pathway for climate smart agriculture among small scale farmers in the Philippines
Robert Patrick M. Cabangbang, Maria Victoria O. Espaldon, Heidi D. Mendoza, Justine Angelo M. Lacson, Ria Jhoanna C. Ducusin, Decibel F. Eslava, Moises A. Dorado, Vicente G. Ballaran, Jr., Melvin D. Ebuenga, Concepcion L. Khan, Bong M. Salazar, Calixto M. Protacio, Edna A. Aguilar, and Victorino A. Bato, Jr.. ........................................... 227
Adaptation strategies and practices to adverse effects from climate change:
Taiwan’s experience and implications Chwen-Ming Yang ................................................................................. 241
Japanese rice-breeding research approach to adapt to global warming
Hiroyuki Sato........................................................................................ 255 Countermeasures against the occurrence of chalky grain during
rice ripening under high temperatures Hiroshi Nakano ..................................................................................... 265
Three climate change adaptation strategies for fruit production
Toshihiko Sugiura.................................................................................. 277
Decision support systems for improving the livelihood of farmers in the Asian and Pacific region
under current and future climate scenarios
Climate risks and vulnerability assessment tools in support of policy planning and climate smart agriculture
Hideki Kanamaru and Mariko Fujisawa ................................................... 293 1-km grid meteorological data service and its use to reduce weather and
climate risks in field crop production Hiroyuki Ohno and Kaori Sasaki ............................................................. 313
Seasonal weather prediction-based decision-support systems for increasing
rice production in rainfed areas Keiichi Hayashi, Lizzida Llorca and Iris Bugayong .................................... 329
Annex
List of MARCO events: symposia, workshops and seminars ..................... 343


MITIGATION OF YIELD-SCALED GLOBAL WARMING POTENTIAL BY PLASTIC MULCH TECHNOLOGY IN RICE CROPS IN SOUTHWESTERN CHINA
1
MITIGATION OF YIELD-SCALED GLOBAL WARMING POTENTIAL BY PLASTIC MULCH TECHNOLOGY IN
RICE CROPS IN SOUTHWESTERN CHINA
Guang-bin Zhang1, Jing Ma1, Hua Xu1, Shi-hua Lv2, and Xiao-yuan Yan1
1Institute of Soil Science, Chinese Academy of Sciences, Nanjing,
China 2Institute of Soil Fertilizer, Sichuan Agriculture Sciences
Academy, Chengdu, China
E-mail: [email protected]; [email protected]
ABSTRACT
The improved technology of plastic-film mulching (PM) for cultivation has been developed to maintain high yields in rice-based cropping systems in southwestern China where paddy fields usually suffer from water shortage or flash droughts. However, the integrated effects of PM on the global warming potential (GWP) of CH4 and N2O emissions, yield-scaled GWP (YGWP), and net profit (balance between economic benefits and environmental costs) are poorly documented. In addition, the cultivation of ratoon rice [RR, the second rice crop from the stubble left behind after an improved single rice (ISR) variety has been harvested] has become available in this region by adopting PM; however, the responses of CH4 and N2O emissions, grain yield, YGWP, and net profit to changes from the traditional single rice (TSR) into ISR with RR cultivation are still unknown. A series of field experiments were therefore conducted from 2012 to 2017 to investigate (1) the effect of cultivation using PM on YGWP and net profit as compared with traditional cultivation in flooded fields (FF) and rainfed fields (RF); (2) whether adding nitrification inhibitors [NI; dicyandiamide (DCD) or chlorinated pyridine (CP)] and controlled-release fertilizer (CRF) increases net profit or not under PM conditions; and (3) the changes in CH4 and N2O emissions, GWP, grain yield, and net profit by shifting TSR to ISR + RR. Results showed that (1) compared with traditional cultivation in FF and FR, cultivation using PM significantly reduced GWP and YGWP by 22%−66% and 38−64%, respectively, thus the increasing net profit to approximately 4626−8217 Chinese yuan (CNY) ha−1; (2) CP addition, rather than DCD and CRF, decreased GWP (6%−11%) and YGWP (7%−13%) as well as

MITIGATION OF YIELD-SCALED GLOBAL WARMING POTENTIAL BY PLASTIC MULCH TECHNOLOGY IN RICE CROPS IN SOUTHWESTERN CHINA
2
increased net profit (by 277 CNY ha−1); (3) seasonal cumulative CH4 emissions were similar from TSR and ISR but additional 8.4−30.4 kg ha−1 emissions were noted from RR, contributing an additional 8%−10% of the total emissions from ISR + RR. Seasonal cumulative N2O emission from RR was 0.16−2.35 kg N ha−1, accounting for 11%−42% of the total emissions, which was even higher than that from TSR in 2017. In addition, total rice grain yield for ISR + RR was 10.2−10.4 t ha−1, 19%−22% higher than that of TSR. Overall, compared with those for TSR, the net profit for ISR + RR increased by 1450 CNY ha−1 and the total GWP increased by 7%−62%. These findings suggest that PM, particularly with the addition of CP, is an effective strategy to reduce environmental costs and increase economic benefits in rice-based cropping systems that are limited by water shortage; moreover, the findings indicate that RR should be looked at as an opportunity and a possible solution to climate change and food security issues in the future. Keywords: GHG emission, grain yield, GWP, net profit, plastic mulch
technology, paddy fields, ratoon rice
INTRODUCTION
China is the largest producer of rice in the world, with a total production of 211 million tons in 2016, contributing approximately 28% of the global rice production. In the hilly areas of southern and southwestern China, there is a special kind of rice field that is continuously flooded after rice harvest until transplanting subsequent rice crops. These fields emit substantial amounts of CH4 over the winter fallow season, contributing approximately 40% of the annual emissions (Cai et al. 2003). Draining these fields either partially or completely in the winter fallow season would significantly reduce CH4 emissions (Yan et al. 2009).
However, draining fields of the local farmers is impractical as farmers often face water shortage problems before transplanting rice. For a long time, most farmers in these regions would have had no choice but to keep the paddy fields intentionally flooded after the rice harvest to ensure sufficient water supply for the next rice transplanting; flooding of these rice fields in winters occurs because the drainage conditions of some fields in low-lying areas are too poor to drain the floodwater from the soil. Additionally, paddy fields in China usually suffer flash droughts during the rice season, particularly in southern China (Wang et al. 2016).
An improved plastic-film mulching technology (PM) was developed in southwestern China approximately 10 years ago (Lv et al. 2009) and was found to be a promising alternative to the flooded rice cultivation system,

MITIGATION OF YIELD-SCALED GLOBAL WARMING POTENTIAL BY PLASTIC MULCH TECHNOLOGY IN RICE CROPS IN SOUTHWESTERN CHINA
3
with advantages such as reducing irrigation water, increasing soil temperature, and maintaining crop yields (Zhang et al. 2018). Field experiments in central and northern China have shown that either PM or rice straw mulching significantly reduces CH4 emissions while increasing N2O emissions compared with traditional cultivation (Kreye et al. 2007; Yao et al. 2014). Till date, no comprehensive study has been conducted to evaluate the responses of the global warming potential (GWP) of CH4 and N2O emissions from PM in rice-based cropping systems at the annual cycles.
Previous studies have shown that the use of a nitrification inhibitor (NI), such as dicyandiamide (DCD) or chlorinated pyridine (CP), with N fertilizer can effectively reduce N2O emissions (Li et al. 2009 and references therein). Controlled-release fertilizers (CRFs) are also widely used during the rice season and have been found to be a useful alternative for mitigating N2O emissions from paddy fields (Abao et al. 2000; Ji et al. 2013). Using NI or CRF under PM conditions during the rice season has been suggested to mitigate N2O emissions. In addition, considering that PM increases soil temperature during the rice-growing season, we were planning on cultivating ratoon rice (RR) using PM to investigate the effects on CH4 and N2O emissions and rice grain yield.
In addition to CH4 and N2O emissions, GWP and grain yields and net profit, which is the balance between economic benefits (yield gains and input costs) and environmental costs (GWP costs), need to be estimated in detail for rice cultivation. Therefore, a series of field experiments were conducted from 2012 to 2017 to investigate (1) the effect of PM on GWP, yield-scaled GWP (YGWP), and net profit from cultivation using PM compared with those from flooded fields (FF) and rainfed fields (RF) under traditional cultivation; (2) whether adding NI (DCD or CP) and CRF under PM conditions increases net profit or not; and (3) the effects on changes in CH4 and N2O emissions, GWP, grain yield, and net profit by shifting traditional single rice (TSR) to improved single rice (ISR) with RR cultivation.
THE EFFECT OF PM
The experimental site was located in Ziyang City, Sichuan Province, southwestern China (30°05’ N, 104°34’ E). Three treatments, with four replicates of each, in a randomized block design, were set up from the 2013 winter fallow season to the 2015 rice-growing season: traditional cultivation with either the fields being flooded in the winter fallow season while rainfed during the rice season (FR) or continuously flooded throughout the winter fallow and rice seasons (FF), and plastic-film mulching cultivation (PM) with the water being transported into ditches to keep the soil moist but without standing water on the surface of the ridges throughout the entire

MITIGATION OF YIELD-SCALED GLOBAL WARMING POTENTIAL BY PLASTIC MULCH TECHNOLOGY IN RICE CROPS IN SOUTHWESTERN CHINA
4
rice-growing season, with the plots being kept drained throughout the winter fallow season. For FF and FR, a total of 150 kg N ha−1 was applied as urea in two equal splits, namely 50% as basal fertilizer in the seed bed and 50% applied at tillering. In contrast, the same rate of urea was applied completely on the ridges of the PM plots as basal fertilizer and then, the plastic film (0.004 mm) was used as mulch. For more detailed descriptions of FR, FF, and PM please refer to Fig. 1.
Fig. 1. Diagram of traditional cultivation (FF and FR) and plastic-film mulching
cultivation (PM) in this study.
PM decreased CH4 emission Shifting the fields from FF into PM significantly decreased CH4 emission in both the winter fallow and the rice-growing seasons by 71−85 and 60%−70%, respectively (Table 1). It is well known that under better conditions (including suitable soil redox potential (Eh) and temperature, and abundant substrates, i.e., for methanogenesis), more CH4 will be produced and emitted. The application of PM kept mean soil water content (SWC) at around 60%−75% during the non-rice and rice seasons, causing annual mean soil Eh to be significantly higher than that in FF (Yang et al. under review). Therefore, the higher the soil Eh, the lower the CH4 production and emission was observed for PM. Moreover, as an important carbon source for methanogenesis, abundant dissolved organic carbon (DOC) favors CH4
16 cm145 cm 145 cm
15 cm
Traditional Cultivation (FR and FF) Plastic Film Mulching Cultivation (PM)
Plan
Profile
40 cm
FF FR PM
10-12 cm
22-25 cm

MITIGATION OF YIELD-SCALED GLOBAL WARMING POTENTIAL BY PLASTIC MULCH TECHNOLOGY IN RICE CROPS IN SOUTHWESTERN CHINA
5
production and emission (Zhang et al. 2018). Soil DOC content was much lower under PM, indicating that PM application mitigated CH4 emission by significantly enhancing Eh and decreasing DOC content, thus greatly depressing CH4 production as compared to FF.
In contrast, PM decreased annual cumulative CH4 emission by 27%−35% relative to FR, mainly due to the significant reduction in CH4 emissions in the winter seasons (Table 1), with substantial decreases in both DOC content and CH4 production potential by PM being considered to be the reason (Yang et al. under review). Moreover, soil temperature may play an important role in CH4 emission as well. Methane can be produced at 5°C, and a higher temperature (10°C−50°C) is more favorable to methanogenesis (Fey et al. 2004). The soil temperature for PM during the winter fallow seasons ranged from 5.0°C to 22.9°C, which is high enough for CH4 production. Therefore, a relatively lower soil temperature under PM conditions (by 1.6°C) was a possible reason for CH4 emissions being lower than those under FF and FR during the winter fallow seasons. PM increased N2O emission PM significantly increased annual cumulative N2O emission by 196%−546% and 9%−20% compared to FF and FR, respectively, an effect which was mainly ascribed to the following possible reasons. Firstly, nitrogen fertilization provides substantial substrates for nitrification and denitrification, and the availability of soil NH4
+-N in paddy fields plays a critical role in N2O emissions (Yao et al. 2014). The urea supplied to the PM site was entirely (i.e., 100%) applied into the soil as basal fertilizer, whereas the proportion was 50% for FF and FR, which resulted in the concentrations of both NH4
+-N and NO3−-N being much greater for PM than for FF and FR
at the beginning of the rice seasons (Yang et al. under review). Secondly, the mean soil temperature for PM was higher by 1.5°C−1.9°C than that for FF and FR during the rice seasons as the conditions were more conducive to N2O production and emission (Schindlbacher et al. 2004).
Thirdly, far lower SWC under PM conditions was more favorable for N2O production and its emission. It is reported that a SWC of 40%−100% water-filled pore space is favorable for N2O transformation and emission, and positive correlations between N2O emissions and SWC have also been observed (Hou et al. 2000; Yan et al. 2000). The SWC under PM ranged from 38% to 96% during the non-rice and rice-growing seasons, respectively (Yang et al. under review), which was within the optimal range of N2O production and emissions. When SWC increased up to 127%−158% on average for FF and FR, nitrification would have been largely inhibited and N2O emissions were hence significantly reduced (Schindlbacher et al. 2004).
MITIGATION OF YIELD-SCALED GLOBAL WARMING POTENTIAL BY PLASTIC MULCH TECHNOLOGY IN RICE CROPS IN SOUTHWESTERN CHINA
6
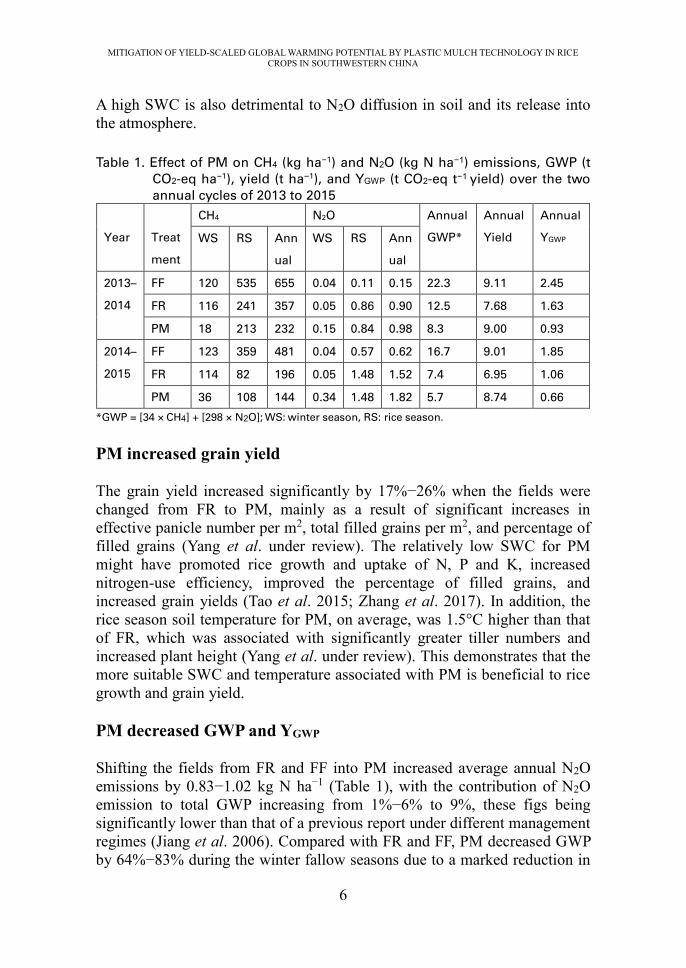
A high SWC is also detrimental to N2O diffusion in soil and its release into the atmosphere.
Table 1. Effect of PM on CH4 (kg ha−1) and N2O (kg N ha−1) emissions, GWP (t
CO2-eq ha−1), yield (t ha−1), and YGWP (t CO2-eq t−1 yield) over the two
annual cycles of 2013 to 2015
Year
Treat
ment
CH4 N2O Annual
GWP*
Annual
Yield
Annual
YGWP WS RS Ann
ual
WS RS Ann
ual
2013–
2014
FF 120 535 655 0.04 0.11 0.15 22.3 9.11 2.45
FR 116 241 357 0.05 0.86 0.90 12.5 7.68 1.63
PM 18 213 232 0.15 0.84 0.98 8.3 9.00 0.93
2014–
2015
FF 123 359 481 0.04 0.57 0.62 16.7 9.01 1.85
FR 114 82 196 0.05 1.48 1.52 7.4 6.95 1.06
PM 36 108 144 0.34 1.48 1.82 5.7 8.74 0.66
*GWP = [34 × CH4] + [298 × N2O]; WS: winter season, RS: rice season.
PM increased grain yield The grain yield increased significantly by 17%−26% when the fields were changed from FR to PM, mainly as a result of significant increases in effective panicle number per m2, total filled grains per m2, and percentage of filled grains (Yang et al. under review). The relatively low SWC for PM might have promoted rice growth and uptake of N, P and K, increased nitrogen-use efficiency, improved the percentage of filled grains, and increased grain yields (Tao et al. 2015; Zhang et al. 2017). In addition, the rice season soil temperature for PM, on average, was 1.5°C higher than that of FR, which was associated with significantly greater tiller numbers and increased plant height (Yang et al. under review). This demonstrates that the more suitable SWC and temperature associated with PM is beneficial to rice growth and grain yield. PM decreased GWP and YGWP
Shifting the fields from FR and FF into PM increased average annual N2O emissions by 0.83−1.02 kg N ha−1 (Table 1), with the contribution of N2O emission to total GWP increasing from 1%−6% to 9%, these figs being significantly lower than that of a previous report under different management regimes (Jiang et al. 2006). Compared with FR and FF, PM decreased GWP by 64%−83% during the winter fallow seasons due to a marked reduction in

MITIGATION OF YIELD-SCALED GLOBAL WARMING POTENTIAL BY PLASTIC MULCH TECHNOLOGY IN RICE CROPS IN SOUTHWESTERN CHINA
7
CH4 emissions (68%−85%). During the rice season, little change in GWP was observed, with no significant differences in CH4 and N2O emissions between FR and PM being observed. In contrast, PM substantially decreased CH4 emissions (60%−70%), resulting in GWP being reduced by 58%−65% as compared to FF. Consequently, relative to FR and FF, PM significantly reduced annual GWP by 22%−66% (Table 1).
Although GWP was reduced under PM, it is also important to determine YGWP under the framework of sustainable intensified agriculture for achieving high crop yields while reducing greenhouse gas (GHG) emissions. Several investigations have reported YGWP in a double-cropping rice field in southeastern China (Zhang et al. 2016) and a rice–wheat cropping system in central China (Zhang et al. 2015). In the current study, annual YGWP ranged from 0.66 to 2.45 t CO2-eq t−1 yield, values which were higher than those reported in the earlier reports mentioned above but much lower than the estimates from a permanently flooded paddy field in southwestern China (Zhou et al. 2018). In addition, relative to FR and FF, PM substantially decreased YGWP by 38%−64%, due to a significant reduction in GWP and a relative stable or increased grain yield (Table 1).
Table 2. Evaluation of the average net profit by shifting the fields from FF and
FR into PM over the two annual cycles of 2013 to 2015
Note: Net profit = Yield gain – [Input cost + Labor cost + GWP cost]; Yield gain = grain yield × price;
for detailed information about the calculation and real-time price, please refer to Zhang et al.
(2018).
PM increased net profit Agriculture faces great challenges to increase grain yields while at the same time reducing both input costs and environmental costs. In other words, ultimately, it must look to promote the net profit, which is the balance between economic benefits and environmental costs. Increasing, or at least preserving, current crop production levels while reducing or maintaining current input costs is very important in rice cultivation. However, up to the current study, no reports on the effect of PM on net profit were available. Although PM reduced yield gains by 497 CNY ha−1, relative to FF, and increased input costs for the plastic film by 740 CNY ha−1, both labor and GWP costs were decreased greatly by 4572 and 1292 CNY ha−1, causing the net profit to increase by 4626 CNY ha−1. More importantly, PM could
Option
Yield gain
(CNY ha−1)
Input cost
(CNY ha−1)
Labor cost
(CNY ha−1)
GWP cost
(CNY ha−1)
Net profit
(CNY ha−1)
FF to PM −497 740 −4572 −1292 4626
FR to PM 4083 740 −4572 −303 8217

MITIGATION OF YIELD-SCALED GLOBAL WARMING POTENTIAL BY PLASTIC MULCH TECHNOLOGY IN RICE CROPS IN SOUTHWESTERN CHINA
8
significantly increase yield gains, compared to FR, which resulted in a net profit as high as 8217 CNY ha−1 (Table 2).
THE EFFECT OF NI AND CRF ADDITIONS
To further estimate the effect of NI and CRF on GHG emissions, YGWP and net profit under PM conditions, a three-year field experiment was conducted during the 2012−2014 rice seasons. There were four treatments with four replicates each, in a randomized block design: PM, PM with NI addition (PM + DCD or PM + CP), and PM with CRF application (PM + CRF). For all treatments, urea (at a rate of 150 kg N ha−1), CRF (thermoplastic resin-coated urea, at a rate of 150 kg N ha−1), DCD (dicyandiamide, at a rate of 5% of the urea), and CP (chlorinated pyridine, at a rate of 0.24% of the urea) were applied on the ridges as a single basal fertilizer, and then the plastic film was positioned. Effect of NIs on CH4 and N2O emissions
Under PM conditions, CP addition reduced CH4 emissions by 2%−11%; however, CH4 emissions increased following DCD application, albeit non-significantly (Table 3). Although the effect on CH4 emissions remains contradictory (Malla et al. 2005), the application of NIs significantly reduced N2O emissions from paddy fields (Li et al. 2009). Shifting rice cultivation from FF to PM significantly increased N2O emissions (Table 1), so it was expected that NI addition would reduce the N2O emissions under PM conditions. Indeed, seasonal N2O emissions were reduced by 24%−63% or 10%−27% by addition of DCD or CP, respectively (Table 3). The additions of DCD or CP can delay urea hydrolysis and inhibit the nitrification process, meaning it will remain present as NH4
+ for longer, which improves the N-use efficiency and reduces N loss and N2O emissions (Zheng et al. 2006).

MITIGATION OF YIELD-SCALED GLOBAL WARMING POTENTIAL BY PLASTIC MULCH TECHNOLOGY IN RICE CROPS IN SOUTHWESTERN CHINA
9
Table 3. Effect of NI and CRF additions under PM conditions on CH4 (kg ha−1)
and N2O (kg N ha−1) emissions, GWP (t CO2-eq ha−1), yield (t ha−1), and
YGWP (t CO2-eq t−1 yield) during the 2012−2014 rice seasons
Year Treatment CH4 N2O GWP* Yield YGWP
2012 PM 263 0.43 9.14 8.23 1.11
PM + DCD 267 0.16 9.16 8.35 1.10
PM+CRF 260 0.25 8.96 8.31 1.08
2013 PM 151 2.11 6.14 8.25 0.74
PM+CP 149 1.54 5.78 8.32 0.69
PM+CRF 136 1.88 5.51 8.33 0.66
2014 PM 213 0.84 7.64 9.00 0.85
PM+DCD 219 0.63 7.73 9.20 0.84
PM+CP 190 0.75 6.83 9.24 0.74
*GWP = 34 × CH4 + 298 × N2O
Effect of CRF on CH4 and N2O emissions Early studies had shown that the application of CRF can reduce CH4 emissions from paddy fields (Abao et al. 2000; Lin et al. 2000); however, a report of a significant increase in CH4 emissions following CRF application has also been published (Li and Fan 2005). In a rice–wheat rotation system, Ji et al. (2014) measured a slight reduction in CH4 emissions by the application of CRF during the rice seasons in 2008−2011. Using the same CRF, CH4 emissions were found to decrease by 1%−10% in the present study, albeit non-significantly (Table 3). Changing urea into CRF was considered to be an effective approach to regulating N2O emission from paddy fields. Ji et al. (2013) reported that N2O emissions from a rice–wheat rotation system reduced by 13% following the addition of CRF. In contrast, we found a reduction of 11%−42%, particularly in 2012, with a significant reduction being observed (Table 3). The addition of CRF can maintain a higher NH4
+-N concentration in the soil, promoting N uptake via rice growth rather than N loss in the form of N2O emissions (Luo et al. 2007). In addition, the application of CRF enhanced the population and activity of soil microbes, resulting in increased N transformation to microbial biomass nitrogen (Luo et al. 2010), thus reducing N2O emissions.

MITIGATION OF YIELD-SCALED GLOBAL WARMING POTENTIAL BY PLASTIC MULCH TECHNOLOGY IN RICE CROPS IN SOUTHWESTERN CHINA
10
Effects of NI and CRF on GWP, grain yield and YGWP Under MC conditions, the GWP was found to decrease by 6%−11% and 2%−10% with the additions of CP and CRF, respectively, whereas the addition of DCD caused only a slight change in the GWP (Table 3). The reduction in GWP observed in the present study by applying CP and CRF can be attributed to the reduction in both CH4 and N2O emissions relative to PM (Table 3). The findings suggest that PM with the applications of CP and CRF can help mitigate the GWP of paddy fields.
Applying NI and CRF under PM conditions always tended to increase grain yield though no significant effect was observed (Table 3). The addition of NI, together with urea, and CRF, has the potential to meet the nutritional needs of rice, which is conducive to rice growth and yield promotion. Previous pot and field measurements had shown that the application of DCD generally increased rice yields (Li et al. 2009). In contrast, the effect of CRF on grain yield is more complicated. Although the primary objectives of CRF development are to reduce N loss, improve N-use efficiency, and increase crop grain yields (Li et al. 2005; Xu et al. 2005), Ji et al. (2013) found that the application of CRF increased rice yield in 2009 and 2010, but significantly reduced it in 2008 and 2011.
In the present study, the YGWP ranged from 0.66 to 1.11 t CO2-eq t−1 yield (Table 3), values which were far lower than those from a rice–wheat rotation system (1.80−2.42 t CO2-eq t−1 yield) reported by Zhang et al. (2015) during the rice season. Under PM conditions, the additions of NI and CRF tended to increase rice grain yields and decrease GWP, thus causing YGWP to decrease. In a rice–wheat rotation system (Li et al. 2009), a reduction in GWP and an increase in grain yield was also observed by application of DCD, thus reducing YGWP by 14%−41%. In a paddy field, CRF addition was found to decrease YGWP by 33% as a result of a 34% reduction in GWP (Abao et al. 2000).
Table 4. Evaluation of the average net profit by applications of NI and CRF under PM conditions over the 2012−2014 rice seasons
Option
Yield gain
(CNY ha−1)
Input cost
(CNY ha−1)
GWP cost
(CNY ha−1)
Net profit
(CNY ha−1)
DCD addition 437 1141 6 −710
CP addition 404 187 −60 277
CRF
application 210 748 −42 −496
Note: Net profit = Yield gain – [Input cost + GWP cost]; Yield gain = grain yield × price; detailed
information about the calculation and real-time price please refer to Zhang et al. (2018)

MITIGATION OF YIELD-SCALED GLOBAL WARMING POTENTIAL BY PLASTIC MULCH TECHNOLOGY IN RICE CROPS IN SOUTHWESTERN CHINA
11
Effects of NI and CRF on net profit Under PM conditions in the current study, DCD addition always increased yield gains and GWP costs; however, the input costs increased much more as a result of its high price, meaning that the net profit decreased by 710 CNY ha−1 on average (Table 4). This indicates that the increase in yield gains barely offset the cost of DCD itself, which in turn led to a negative effect on the incomes of farmers. In contrast, CP addition further increased net profit (by 277 CNY ha−1) because of the higher yield gains and lower GWP costs. Although CRF tended to increase yield gains and reduce GWP costs, it decreased the net profit up to 496 CNY ha−1, mainly due to higher input costs. The findings demonstrated that CP application under PM conditions is a more promising management practice than DCD.
GHG EMISSIONS FROM RR FIELDS
Given that PM improved soil temperature during the rice season, we carried out a study to plant RR in concert with PM in the same experimental site which had originally not been suitable for RR growth. Compared with PM, we hypothesized that (1) the cultivation of RR under PM conditions increases both CH4 emission and GWP in the fields, (2) achieves higher crop yields and yield gains, and (3) ultimately increases the net profit. During the 2016−2017 rice seasons, two treatments were prepared under PM conditions: TSR and ISR with RR growth. The RR involves the production of a second rice crop from the stubble left behind after the single rice had been harvested. In addition, the growth duration of the main rice for ISR was different from that of TSR due to its rice transplanting approximately 15 days earlier (Fig. 2). During the main rice seasons, urea was applied at a rate of 130 kg N ha−1 for TSR and ISR on the ridges as basal fertilizer. In contrast, for RR, urea was applied as a topdressing in two splits at a total rate of 330 kg ha−1. The emissions of CH4 and N2O Different temporal variations in CH4 and N2O emission flux were observed between TSR and ISR + RR (Fig. 2). Before TSR transplantation, substantial CH4 fluxes were measured for ISR. In addition, the timing of the CH4 flux peak for ISR appeared earlier than that of TSR. There were no measurements of CH4 emission after TSR harvest but obvious CH4 fluxes could be observed after ISR harvest for RR (Fig. 2a, b). Seasonally, total CH4 emission was very similar between TSR and ISR during the main rice seasons whereas another 8.4−30.4 kg ha−1 of CH4 emission was measured

MITIGATION OF YIELD-SCALED GLOBAL WARMING POTENTIAL BY PLASTIC MULCH TECHNOLOGY IN RICE CROPS IN SOUTHWESTERN CHINA
12
during the RR seasons (Table 5). As a whole, seasonal cumulative CH4 emission for ISR + RR was 11%−15% higher than that of TSR. The contribution of CH4 emission for RR to ISR + RR was estimated to be 8%−10%.
Fig. 2. Temporal variation of CH4 and N2O emissions during rice seasons in
2016−2017.
For N2O emission, high flux peaks are generally observed after fertilizer
application at tillering and topdressing for TSR, ISR, and RR (Fig. 2c, d). Subsequently, little N2O emission could be measured during most of the season. Seasonally, total N2O emission for TSR was significantly higher in 2016 but lower in 2017 than that of ISR (Table 5). During the ratoon rice seasons, total N2O emission was 0.16−2.35 kg N ha−1 for RR. As a whole, the seasonal cumulative N2O emission for ISR + RR was 29% lower in 2016 but 247% higher in 2017 than that of TSR. The contribution of N2O emission from RR to the total for ISR + RR was found to be 11%−42% (Table 5).
To our knowledge, this is the first report on GHG emissions from RR fields in China. About 25 years ago, Lindau and Bollich (1993) measured CH4 emissions from RR fields with two treatments [plants with (urea) and without fertilizer] in Louisiana, USA, and they found that CH4 emissions from the main rice season and the RR season were 240−340 and 220−520 kg ha−1, respectively. In the current study, CH4 emissions from the RR season
0
10
20
30
40
2016-4-1 2016-5-31 2016-7-30 2016-9-28
CH
4 fl
ux
(mg
m-2
h-1
)
TSR ISR + RR
ISR transplant
TSR transplant
ISR harvest
TSR harvest
RR harvest
(a)
0
10
20
30
40
2017-4-1 2017-5-31 2017-7-30 2017-9-28C
H4
flu
x (m
g m
-2h
-1)
TSR ISR + RR
ISR transplant ISR harvest RR harvest
TSR transplant TSR harvest
(b)
0
400
800
1200
1600
2000
2016-4-1 2016-5-31 2016-7-30 2016-9-28
N2O
flu
x (μ
g N
m-2
h-1
)
Date
Tillering fertilizer
Tillering fertilizer
Topdressing for RR
Topdressing for RR (c)
0
400
800
1200
1600
2000
2017-4-1 2017-5-31 2017-7-30 2017-9-28
N2O
flu
x (μ
g N
m-2
h-1
)
Date
Tillering fertilizer
Tillering fertilizer
Topdressing for RR
Topdressing for RR (d)

MITIGATION OF YIELD-SCALED GLOBAL WARMING POTENTIAL BY PLASTIC MULCH TECHNOLOGY IN RICE CROPS IN SOUTHWESTERN CHINA
13
was much lower than that from the main rice season. Large differences in CH4 emissions between the two reports can possibly be attributed to different climatic and soil environments, rice cultivation methods, field water and fertilizer management practices, and so on. Rice grain yield, GWP, and YGWP During the main rice seasons, rice grain yield for ISR was in the range 8.54−9.08 t ha−1, which was 5.8% higher than that of TSR in 2016 though yields from the two systems were was almost the same as one another in 2017 (Table 5). For RR, the grain yield was 1.10−1.89 t ha−1, resulting in a total yield for ISR + RR 19%−22% higher than that of TSR. In addition, the contribution of RR to total yield of ISR + RR was 11%−18%. However, field experiments in Hubei Province, China (Dong et al. 2017) showed that rice grain yield for RR ranged from 4.05 to 5.83 t ha−1 (or 32%−37% of the annual total), which was much higher than the values obtained in the present study. Therefore, combinations of suitable rice varieties and the best related management practices should be investigated in this region in the future. Table 5. Measurements of CH4 (kg ha−1) and N2O (kg N ha−1) emissions, GWP (t
CO2-eq ha−1), yield (t ha−1), and YGWP (t CO2-eq t−1 yield) during rice
seasons in 2016−2017
Year
Treat
ment
CH4 N2O Yield Total
GWP*
Total
YGWP MS RS Total MS RS Total MS RS Total
2016
TSR 275 - 275 2.17 - 2.17 8.58 - 8.58 10.4 1.21
ISR +
RR
276 30.4 306 1.38 0.16 1.54 9.08 1.10 10.2 11.1 1.09
2017
TSR 89 - 89 1.62 - 1.62 8.52 - 8.52 3.8 0.45
ISR +
RR
95 8.4 103 3.28 2.35 5.63 8.54 1.89 10.4 6.1 0.59
*GWP = [34 × CH4] + [298 × N2O]; MS: main rice season, RS: ratoon rice season
Total GWP for ISR + RR was 6.1−11.1 t CO2-eq ha−1, which was
7%−62% higher than that of TSR (Table 5). This increase was mainly attributed to the much longer growth duration with far heavier N fertilization for ISR + RR (Song et al. accepted). Taking grain yield and GWP together for consideration, no significant difference in total YGWP was observed between TSR and ISR + RR. The results indicate that the cultivation of RR not only largely increased grain yields, but also increased GWP, thus having a slight effect on YGWP when shifting TSR into ISR + RR as a whole. To

MITIGATION OF YIELD-SCALED GLOBAL WARMING POTENTIAL BY PLASTIC MULCH TECHNOLOGY IN RICE CROPS IN SOUTHWESTERN CHINA
14
ensure national and global food securities in future, RR will attract much attention in rice agriculture. Consequently, the study of GHG emissions from RR fields may become a major challenge, especially with increasing climate change that will further accelerate water scarcity in rice-based cropping systems in future.
Table 6. Evaluation of the average net profit by cultivation of ratoon rice under
PM conditions over the rice seasons in 2016−2017
Option Yield gain
(CNY ha−1)
Input cost
(CNY ha−1)
Labor cost
(CNY ha−1)
GWP cost
(CNY ha−1)
Net profit
(CNY ha−1)
ISR + RR 6064 592 3867 156 1450
Note: Net profit = Yield gain – [Input cost + Labor cost + GWP cost]; Yield gain = grain yield × price;
for detailed information about the calculation and real-time prices, please refer to Zhang et al. (2018)
Net profit Compared with TSR, ISR + RR significantly increased net profit by 1450 CNY ha−1 though the costs of input, labor, and GWP were greatly increased. The increased net profit arose because the yield gain was much greater than the negative effects on costs, which completely offset these increased costs (i.e., input, labor, and GWP) which in turn led to a positive effect on economic income (Table 6). It is a matter of fact that ISR + RR can not only achieve more rice production relative to TSR but also save substantially in terms of labor and irrigation water input as compared to the double-rice cropping system (Munda et al. 2009). In addition, the rice quality is better in the RR season than in the main rice season (Liu et al. 2002), which results in the unit price paid for RR being much higher than that for TSR and ISR. There is no doubt that the RR system is a good method to increase food production in areas where the period of favorable temperature for rice production is too short for double rice but too long for single rice, and where labor scarcities or water shortages constrain crop establishment.
CONCLUSION
In view of practical problems concerning the reduction in grain yields and economic incomes arising from frequent droughts, water shortages, or low temperatures in early spring in the hilly regions of southwestern China, the application of PM demonstrated significantly reduced CH4 emissions and GWP relative to winter-flooded paddy fields. In addition, the preservation of soil heat and moisture was also achieved by PM, resulting in high and stable crop yields, YGWP mitigations, and enhanced benefits. Under PM conditions,

MITIGATION OF YIELD-SCALED GLOBAL WARMING POTENTIAL BY PLASTIC MULCH TECHNOLOGY IN RICE CROPS IN SOUTHWESTERN CHINA
15
CP addition was found to further decrease YGWP and increase net profit. More importantly, the cultivation of RR in this region became available with the application of PM, and, as a result, both rice grain yield and net profit were significantly increased. The findings suggest that PM, particularly with CP addition, is an effective strategy to reduce environmental costs and increase economic benefits in rice-based cropping systems, which are limited by water shortage, and further indicate that RR should be looked at as an opportunity and potential solution to climate change and food security issues in the future.
REFERENCES
Abao, E.B., K.F. Bronson, R. Wassmann, and U. Singh. 2000. Simultaneous records of methane and nitrous oxide emissions in rice-based cropping systems under rainfed conditions. Nutrient Cycling in Agroecosystems 58: 131-139.
Cai, Z.C., H. Tsuruta, M. Gao, H. Xu, and C.F. Wei. 2003. Options for mitigating methane emission from a permanently flooded rice field. Global Change Biology 9: 37-45.
Dong, H.L., Q. Chen, W.Q. Wang, S.B. Peng, J.L. Huang, K.H. Cui, and L.X. Nie. 2017. The growth and yield of a wet-seeded rice-ratoon rice system in central China. Field Crops Research 208: 55-59.
Fey, Y.A., P. Claus, and R. Conrad. 2004. Temporal change of 13C-isotope signatures and methanogenic pathways in rice field soil incubated anoxically at different temperatures. Geochimica et Cosmochimica Acta 68: 293-306.
Hou, A., H. Akiyama, Y. Nakajima, S. Sudo, and H. Tsuruta. 2000. Effects of urea form and soil moisture on N2O and NO emissions from Japanese Andosols. Chemosphere 2: 321-327.
Ji, Y., G. Liu, J. Ma, G.B. Zhang, and H. Xu. 2014. Effects of urea and controlled release urea fertilizers on methane emission from paddy fields: a multi-year field study. Pedosphere 24: 662-673.
Ji, Y., G. Liu, J. Ma, G.B. Zhang, H. Xu, and K. Yagi. 2013. Effect of controlled-release fertilizer on mitigation of N2O emission from paddy field in South China: a multi-year field observation. Plant and Soil 371: 473-486.
Jiang, C.S., Y.S. Wang, X.H. Zheng, B. Zhu, and Y. Huang. 2006. Effects of tillage-cropping systems on methane and nitrous oxide emissions from permanently flooded rice fields in a central Sichuan hilly area of Southwest China. Environmental Science 27: 207-213 (In Chinese).
Kreye, C., K. Dittert, X. Zheng, X. Zhang, S. Lin, H. Tao, and B. Sattelmacher. 2007. Fluxes of methane and nitrous oxide in water-saving

MITIGATION OF YIELD-SCALED GLOBAL WARMING POTENTIAL BY PLASTIC MULCH TECHNOLOGY IN RICE CROPS IN SOUTHWESTERN CHINA
16
rice production in north China. Nutrient Cycling in Agroecosystems 77: 293-304.
Li, F.M. and X.L. Fan. 2005. Effect of controlled release fertilizers on methane emission from paddy field. Chinese Journal of Applied and Environmental Biology 11: 408-411 (In Chinese).
Li, F.M., X.L. Fan, and W.D. Chen. 2005. Effect of controlled release fertilizer on rice yield and nitrogen use efficiency. Plant Nutrition and Fertilizer Science 11: 494-500 (In Chinese).
Li, X.L., X.Y. Zhang, H. Xu, Z.C. Cai, and K. Yagi. 2009. Methane and nitrous oxide emissions from rice paddy soil as influenced by timing of application of hydroquinone and dicyandiamide. Nutrient Cycling in Agroecosystems 85: 31-40.
Lin, K.F., Y.L. Xiang, D.B. Jiang, Q.L. Hu, Z.H. Li, D.D. Du, and Z. Tao. 2000. Methane emission flux from paddy fields and its control in Hubei. Agro-environmental Protection 19: 267-270 (In Chinese).
Lindau, C.W. and P.K. Bollich. 1993. Methane emissions from Louisiana first and ratoon crop rice. Soil Science 156: 42-48.
Liu, G.H., H.B. Deng, L.Y. Chen, Y.H. Xiao, and W.B. Tang. 2002. Comparison of grain quality between main and ratooning crops of middle-season rice. Hybrid Rice 17: 45-47 (In Chinese).
Luo, L.F., J. Nie, S.X. Zhang, Y.L. Liao, and J. Xie. 2010. Effect of controlled release nitrogen fertilizer on soil microbial biomass carbon and nitrogen contents. Acta Ecologica Sinica 30: 2925-2932 (In Chinese).
Luo, L.F., S.X. Zheng, Y.L. Liao, J. Nie, J. Xie, and Y.W. Xiang. 2007. Effect of controlled release nitrogen fertilizer on protein quality of brown rice and key enzyme activity involved in nitrogen metabolism in hybrid rice. Chinese Journal of Rice Science 21: 403-410 (In Chinese).
Lv, S.H., X.Z. Zeng, G.J. Ren, and F.S. Zhang. 2009. The technology of plastic film mulching integrated with water-saving and high-yielding in rice cultivation. Science and Technology of Sichuan Agriculture 20: 23-24 (In Chinese).
Malla, G., A. Bhatia, H. Pathak, S. Prasad, N. Jain, and J. Singh. 2005. Mitigating nitrous oxide and methane emissions from soil in rice-wheat system of the Indo-Gangetic plain with nitrification and urease inhibitors. Chemosphere 58: 141-147.
Munda, G.C., A. Das, and D.P. Patel. 2009. Evaluation of transplanted and ratoon crop for double cropping of rice (Oryza sativa L.) under organic input management in mid altitude sub-tropical Meghalaya. Current Science 96: 1620-1627.
Schindlbacher, A., S. Zechmeister-Boltenstern, and K. Butterbach-Bahl. 2004. Effects of soil moisture and temperature on NO, NO2, and N2O

MITIGATION OF YIELD-SCALED GLOBAL WARMING POTENTIAL BY PLASTIC MULCH TECHNOLOGY IN RICE CROPS IN SOUTHWESTERN CHINA
17
emissions from European forest soils. Journal of Geophysical Research 109: D17302.
Song, K.F., Y.T. Yang, H.Y. Yu, G.B. Zhang, H. Xu, S.H. Lv, et al. and J. Ma. 2019. Methane emission from a ratoon rice field under plastic film mulching cultivation in a hilly area of Southwest China. Acta Ecologica Sinica, accepted (In Chinese).
Tao, Y.Y., Y.N. Zhang, X.X. Jin, G. Saiz, R.Y. Jing, L. Guo, et al. and S. Lin. 2015. More rice with less water–evaluation of yield and resource use efficiency in ground cover rice production system with transplanting. European Journal of Agronomy 68: 13-21.
Wang, L.Y., X. Yuan, Z.H. Xie, P.L. Wu, and Y.H. Li. 2016. Increasing flash droughts over China during the recent global warming hiatus. Scientific Reports 6: 30571.
Xu, M.G., X.F. Sun, C.M. Zou, D.Z. Qin, K. Yagi, and Y. Hosen. 2005. Effects of rational application of controlled-release nitrogen fertilizer in paddy field of southern China. Plant Nutrition and Fertilizer Science 11: 487-493 (In Chinese).
Yan, X.Y., H. Akiyama, K. Yagi, and H. Akimoto. 2009. Global estimations of the inventory and mitigation potential of methane emissions from rice cultivation conducted using the 2006 Intergovernmental Panel on Climate Change Guidelines. Global Biogeochemical Cycles 23: 20-23.
Yan, X.Y., S.L. Shi, L.J. Du, and G.X. Xing. 2000. Pathways of N2O emission from rice paddy soil. Soil Biology & Biochemistry 32: 437-440.
Yang, Y.T., J. Ma, Q. Huang, H.Y. Yu, K.F. Song, Y.J. Dong, et al and G.B. Zhang. 2018. Reducing yield-scaled global warming potential and water use by rice plastic film mulching in a winter flooded paddy field. Under review in European Journal of Agronomy.
Yao, Z.S., Y. Du, Y. Tao, X.H. Zheng, C. Liu, S. Lin, et al and K. Butterbach-Bahl. 2014. Water-saving ground cover rice production system reduces net greenhouse gas fluxes in an annual rice-based cropping system. Biogeosciences 11: 6221-6236.
Zhang, G.B., J. Ma, Y.T. Yang, H.Y. Yu, K.F. Song, Y.J. Dong, et al. and H. Xu. 2018. Achieving low methane and nitrous oxide emissions with high economic incomes in a rice-based cropping system. Agricultural and Forest Meteorology 259: 95-106.
Zhang, G.B., H.Y. Yu, X.F. Fan, Y.T. Yang, J. Ma, and H. Xu. 2016. Drainage and tillage practices in the winter fallow season mitigate CH4 and N2O emissions from a double-rice field in China. Atmospheric Chemistry and Physics 16: 11853-11866.
Zhang, Y.N., M.J. Liu, G. Saizc, M. Dannenmannc, L. Guo, Y.Y. Tao, et al and S. Lin. 2017. Enhancement of root systems improves productivity and sustainability in water saving ground cover rice production system.

MITIGATION OF YIELD-SCALED GLOBAL WARMING POTENTIAL BY PLASTIC MULCH TECHNOLOGY IN RICE CROPS IN SOUTHWESTERN CHINA
18
Field Crops Research 213: 186-193. Zhang, Z.S., L.J. Guo, T.Q. Liu, C.F. Li, and C.G. Cao. 2015. Effects of
tillage practices and straw returning methods on greenhouse gas emissions and net ecosystem economic budget in rice wheat cropping systems in central China. Atmospheric Environment 122: 636-644.
Zheng, F.L., B. Li, X.Y. Li, and Y.L. Shi. 2006. Application effect and mechanism of urease inhibitor. Journal of Jilin Agricultural Sciences 31: 25-28 (In Chinese).
Zhou, M.H., X.G. Wang, Y.Q. Wang, and B. Zhu. 2018. A three-year experiment of annual methane and nitrous oxide emissions from the subtropical permanently flooded rice paddy fields of China: emission factor, temperature sensitivity and fertilizer nitrogen effect. Agricultural and Forest Meteorology 250-251: 299-307.

DISSEMINATION OF WATER MANAGEMENT IN RICE PADDIES IN ASIA
19
DISSEMINATION OF WATER MANAGEMENT IN RICE PADDIES IN ASIA
Kazunori Minamikawa1, Takayoshi Yamaguchi2,
and Takeshi Tokida3
1Japan International Research Center for Agricultural Sciences,
Tsukuba, Japan 2Kyoto University, Kyoto, Japan
3Institute for Agro-Environmental Sciences, National Agriculture and Food Research Organization (NARO), Tsukuba,
Japan
E-mail: [email protected]
ABSTRACT Asia is the granary of rice production globally. Methane (CH4) is a potent greenhouse gas that is produced in anaerobic flooded paddy soil and is emitted to the atmosphere. Water management is one of the most effective strategies to reduce CH4 emission from rice paddies. However, rice farmers are not willing to adopt water management strategies unless incentives are provided. This article explains the conventional methods of water management that are currently being utilized in Asia, then outlines the history of and the current constraints to disseminate water management, and finally discusses the future perspective of further dissemination. There are two conventional methods of water management: midseason drainage, which is often followed by intermittent irrigation, and alternate wetting and drying (AWD). A Chinese agricultural book, published in the 7th century, which describes midseason drainage, represents the world’s first record of this technique. In Japan, midseason drainage was first found to be reported in an agricultural book published in the 17th century. Surprisingly, a major proportion of the current knowledge regarding water management for good rice growth and high yield was already recognized by farmers in the ancient period. Recently, the effect of AWD on irrigation water saving has gained interest of researchers and farmers. The dissemination of water management is limited by natural and social factors at multiple spatial scales. Natural factors include climate, weather, soil, and topography. For example, climate determines water availability in the dry season, whereas weather determines the success of soil drying during a drained period. Social factors include

DISSEMINATION OF WATER MANAGEMENT IN RICE PADDIES IN ASIA
20
governmental policy, infrastructure, and farmers’ perception. For example, the construction of water channels is essential for irrigation and drainage of a rice area, whereas the reduction of the fuel cost associated with pumping irrigation water is an incentive for farmers to adopt AWD. The question regarding what is necessary for further dissemination of water management in Asia is still to be answered. Future research should improve focus on the mechanisms underlying the positive effects on rice production, leading to the voluntary dissemination by farmers. However, there is a limit to voluntary dissemination. Under the Paris Agreement, several Asian rice-producing countries have declared to reduce CH4 emissions from rice paddies to achieve the nationally determined contribution, using the institutional approach, such as carbon pricing (i.e., market mechanisms and carbon tax) and Nationally Appropriate Mitigation Action. It is therefore necessary to develop the methodology of monitoring, reporting, and verification to ensure the accuracy and reliability of asserted reduction in CH4 emission by water management. Keywords: AWD, climate-change mitigation, midseason drainage,
methane, MRV
INTRODUCTION
Methane (CH4) is a well-mixed greenhouse gas (GHG) with a global warming potential (GWP) of 34 times that of carbon dioxide (CO2) over a 100-year time scale considering the indirect effects, such as the production of tropospheric ozone, another potent GHG (Myhre et al. 2013). Because CH4 has a relatively short lifetime in the atmosphere, immediate mitigation actions can reduce the risk of crossing the critical 2°C threshold for increase in the global air temperature more effectively than that caused by a reduction in CO2 emissions alone (Shindell et al. 2012). Rice cultivation is a major source of the atmospheric CH4 emissions, accounting for 10%–12% of the global anthropogenic CH4 emissions (Ciais et al. 2013). CH4 is produced in flooded paddy soils via anaerobic metabolism by methanogenic archaea using labile organic carbon (C) substrates (Fig. 1). Major rice-producing countries are located in Asia and rice production has increased steadily over the past decade (Table 1). Therefore, Asia is the hotspot of CH4 emissions emanating from rice cultivation.
There are two promising, readily available alternatives for reducing CH4 emissions from rice cultivation. The first alternative is organic matter management that is practiced before rice cultivation. It reduces labile organic C, leading to a delay in the development of reductive soil conditions and thus to a reduction in CH4 production. For example, decreases in the
DISSEMINATION OF WATER MANAGEMENT IN RICE PADDIES IN ASIA
21
incorporation rate of rice straw (e.g., Naser et al. 2007) and the composting of rice straw (e.g., Yagi and Minami 1990) are effective at reducing CH4 emissions. However, there is concern regarding the loss of soil organic C by this strategy due to the limited C input into single-cropping soil over the long term (Shirato and Yokozawa 2005). In addition, in areas with multiple cropping (i.e., tropical and subtropical regions), there are limited choices for rice straw management (i.e., removal or field burning) because of the relatively short, and often wet, fallow season that is insufficient for the decomposition of incorporated straw before the subsequent rice season.
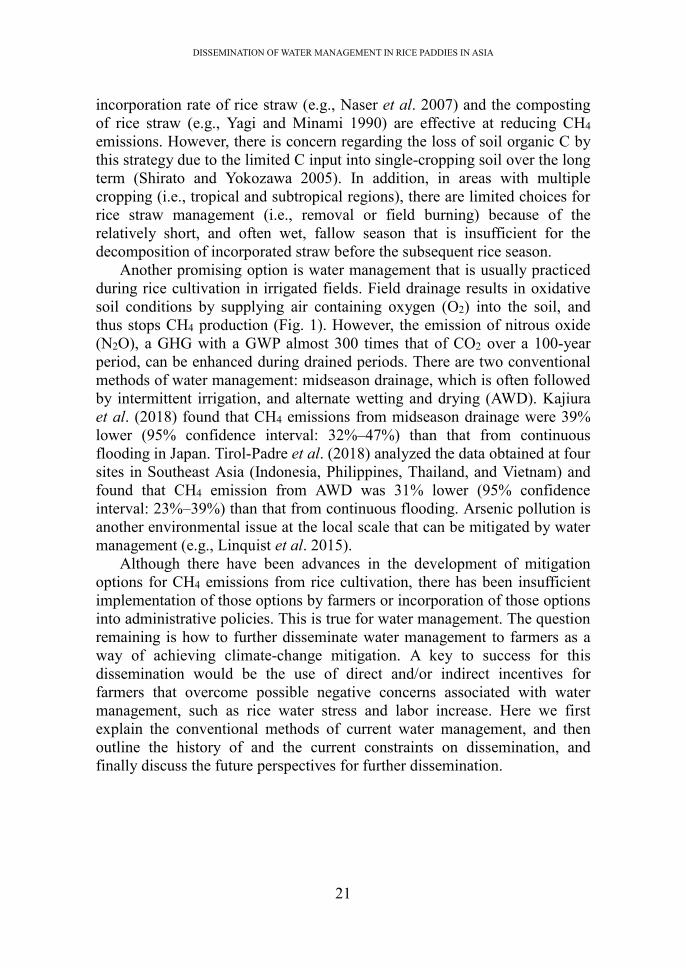
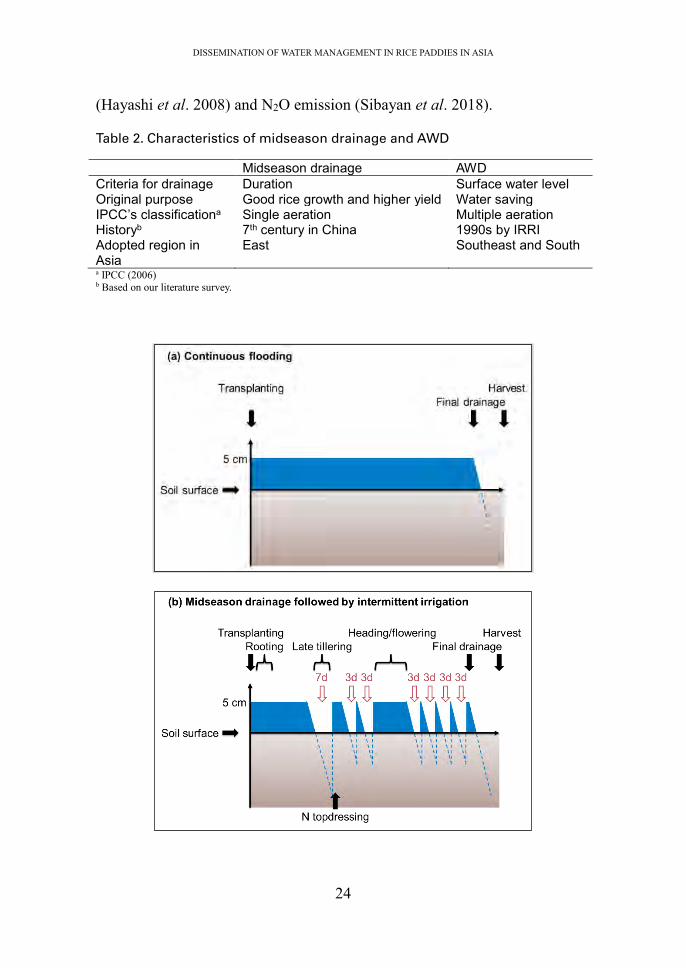
Another promising option is water management that is usually practiced during rice cultivation in irrigated fields. Field drainage results in oxidative soil conditions by supplying air containing oxygen (O2) into the soil, and thus stops CH4 production (Fig. 1). However, the emission of nitrous oxide (N2O), a GHG with a GWP almost 300 times that of CO2 over a 100-year period, can be enhanced during drained periods. There are two conventional methods of water management: midseason drainage, which is often followed by intermittent irrigation, and alternate wetting and drying (AWD). Kajiura et al. (2018) found that CH4 emissions from midseason drainage were 39% lower (95% confidence interval: 32%–47%) than that from continuous flooding in Japan. Tirol-Padre et al. (2018) analyzed the data obtained at four sites in Southeast Asia (Indonesia, Philippines, Thailand, and Vietnam) and found that CH4 emission from AWD was 31% lower (95% confidence interval: 23%–39%) than that from continuous flooding. Arsenic pollution is another environmental issue at the local scale that can be mitigated by water management (e.g., Linquist et al. 2015).
Although there have been advances in the development of mitigation options for CH4 emissions from rice cultivation, there has been insufficient implementation of those options by farmers or incorporation of those options into administrative policies. This is true for water management. The question remaining is how to further disseminate water management to farmers as a way of achieving climate-change mitigation. A key to success for this dissemination would be the use of direct and/or indirect incentives for farmers that overcome possible negative concerns associated with water management, such as rice water stress and labor increase. Here we first explain the conventional methods of current water management, and then outline the history of and the current constraints on dissemination, and finally discuss the future perspectives for further dissemination.

DISSEMINATION OF WATER MANAGEMENT IN RICE PADDIES IN ASIA
22
Fig. 1. Schematic representation of mechanisms underlying CH4 emission from
paddy soil.
Table 1. Top ten rice-producing countries worldwide (2016), the decadal
production growth during 2007–2016, and CH4 emissions from rice
cultivation (2016)
Country Rice production (Mt y-1)
Decadal growth (%)
CH4 emission (Gg CO2-eq y-1)
China, mainland 209.5 12.6 111383 (1)a India 158.8 9.8 95243 (2) Indonesia 77.3 35.2 63382 (3) Bangladesh 52.6 21.8 23767 (7) Viet Nam 43.4 20.9 28848 (6) Myanmar 25.7 -17.1 22098 (8) Thailand 25.3 -22.2 29145 (5) Philippines 17.6 8.5 32010 (4) Brazil 10.6 -4.0 2652 (21) Pakistan 10.4 24.8 8131 (11) World total 741.0 12.9 511495 ― Source: FAOSTAT (2018). a In parentheses, the world ranking
CONVENTIONAL CURRENT METHODS OF WATER MANAGEMENT
Water management is usually feasible in irrigated rice paddies. Continuous flooding is the reference method of water management, in which the soil is kept flooded at about 5 cm above the soil surface from transplanting to the final drainage ca. 2 weeks before rice harvest (Fig. 2a). In case of direct seeding, the soil is first kept water-saturated or shallow flooded until crop establishment; this is also true for other methods of water management. There are two conventional methods of water management that can reduce CH4 emissions as compared to continuous flooding: midseason drainage and AWD (Table 2). Both involve a similar shift in surface water level during rice cultivation (Fig. 2b, c) but have different purposes and historical backgrounds (Table 2). Below, this chapter explains different and shared

DISSEMINATION OF WATER MANAGEMENT IN RICE PADDIES IN ASIA
23
points for the implementation of midseason drainage and AWD. Midseason drainage is practiced for better rice production in East Asia,
such as China and Japan (Table 2). The timing and duration of the drainage is based on the rice growth stage (Table 2 and Fig. 2b). Drainage for 1–2 weeks is intentionally practiced between later tillering and panicle differentiation stages considering the surface soil dryness that partly depends on the weather conditions. It is often associated with opening the water outlet for forced drainage of the surface water. Midseason drainage is often followed by intermittent irrigation, in which the soil is repeatedly drained for a few days until the final drainage (e.g., repeats of 3-day flooding and 3-day drainage). The current understanding of the positive effects of midseason drainage on rice production is as follows:
• to reduce non-productive tillers by inhibiting soil nitrogen (N)
mineralization, • to avoid lodging and enhance weather-resistance by inhibiting the
production of substances harmful to rice, such as hydrogen sulfide and organic acids, and by enhancing root elongation (originally by increasing O2 supply and soil oxidation), and
• to improve field workability at harvest by compacting soil.
Guo et al. (2017) conducted a meta-analysis of datasets in China and found that midseason drainage significantly increased rice yield as compared to continuous flooding.
The original purpose of AWD was water saving in rice cultivation during a dry season in the tropics and subtropics (Table 2). Under AWD, therefore, drainage of surface water depends on natural percolation and evapotranspiration. For example, Tirol-Padre et al. (2018) found that AWD reduced water use (i.e., irrigation + rainfall) in dry seasons by 6%–47% as compared to continuous flooding at the four sites in Southeast Asia tested, depending on environmental factors, such as topography and soil texture. Timing and duration of the natural drainage is usually based on surface water level that can be measured by a pre-installed pipe and a ruler. “15 cm below the soil surface” is often used as the threshold for re-flooding (Fig. 2c), which is called the “safe AWD” (safe for rice production; Lampayan et al. 2009).
A recommendation shared between midseason drainage and AWD is to keep flooding (1) during the rooting and heading/flowering stages to meet rice’s physiological water demands, and (2) during and after N topdressing to improve the N-use efficiency of rice plants (Table 2). For example, urea-N topdressing during a drained or shallow-flooded period can result in substantial N loss of the applied N as a result of both ammonia volatilization
DISSEMINATION OF WATER MANAGEMENT IN RICE PADDIES IN ASIA
24
(Hayashi et al. 2008) and N2O emission (Sibayan et al. 2018).
Table 2. Characteristics of midseason drainage and AWD
Midseason drainage AWD Criteria for drainage Duration Surface water level Original purpose Good rice growth and higher yield Water saving IPCC’s classificationa Single aeration Multiple aeration Historyb 7th century in China 1990s by IRRI Adopted region in Asia
East Southeast and South
a IPCC (2006) b Based on our literature survey.

DISSEMINATION OF WATER MANAGEMENT IN RICE PADDIES IN ASIA
25
Fig. 2. Schematic representations of time patterns of water levels during (a)
continuous flooding, (b) midseason drainage followed by intermittent
irrigation, and (c) AWD.
HISTORY OF MIDSEASON DRAINAGE
There is an enormous difference in the history of dissemination between midseason drainage (7th century) and AWD (1990s) (Table 2). This chapter therefore focuses on the long history of midseason drainage in Asia and explores the reasons for its wide dissemination in Japan as an example.
A Chinese agricultural book, “Qimin Yaoshu,” published in the middle of the 7th century (Fig. 3) mentioned that soil aeration (i.e., midseason drainage) had positive effects on rice production. As far as we know, this is the world’s first record of midseason drainage. We also found that an Indian agricultural book, “Krsiparasara,” published in about the 6th to 8th century, mentioned the beneficial effects of midseason drainage. In Japan, the first record of midseason drainage was found in “Seiryoki” published in the 17th century. In “Noukagyouji” published in the 18th century in Japan (Fig. 3), it was stated that, “from late July to early August (i.e., mid-rice season in Japan), farmers should drain rice paddies, especially for those which are easy to irrigate, and carry out soil aeration for a few days.” We also found that Japanese agricultural books published during the Edo Period (1603–1868) mentioned midseason drainage (Fig. 4). Based on our literature survey, the old Japanese farmers during the Edo Period already knew the detailed beneficial effects of midseason drainage, such as yield increases in wet paddies, removal of aquatic weeds, soil drying ready for harvest and preparing for the subsequent crop, and inhibition of excessive tillering.
In modern times in Japan, midseason drainage was gradually disseminated to farmers (Table 3) for the following reasons. Firstly, the target of governmental policy for domestic rice production changed from

DISSEMINATION OF WATER MANAGEMENT IN RICE PADDIES IN ASIA
26
maximizing yield quantity before the 1970s to maximizing grain quality after the 1970s. Before the 1970s, most of the studious, innovative farmers, who knew the positive effects of midseason drainage and intermittent irrigation, adopted them, and then normal farmers learned and followed, in order to obtain higher yields. Secondly, the modernization of agriculture, such as the introduction of agrochemicals, the development of irrigation infrastructure, and the reformation into well-drained paddy field, enabled farmers to solve the weed problem and to easily control surface water level. Lastly, a high-quality cultivar, ‘Koshihikari’ was widely disseminated after the 1970s although it is sensitive to the rice blast pathogen (Magnaporthe grisea) and prone to lodging. To produce high-quality ‘Koshihikari’ grain for a higher selling price, farmers followed a suite of locally standardized cultivation protocols, including midseason drainage to avoid rice lodging.
The current midseason drainage protocol still has some difficulties in terms of further dissemination. Farmers in the northern area of Japan, Hokkaido, do not dare to practice midseason drainage but keep their fields flooded to protect the rice crop from low temperatures, avoiding the risk of cold damage (Table 3; Leon et al. 2015). Flooding is also required elsewhere in Japan to protect rice from exposure to short periods of high temperatures, caused by the hot dry foehn winds in the southern area. Even where midseason drainage is practiced elsewhere, soil drying may occasionally fail due to rainfall during the draining periods, leading to no reduction in CH4 emissions (Kajiura et al. 2018). In addition, the on-going dissemination of large-scale, extensive rice farming in Japan may hinder the implementation of midseason drainage, to save labor and time.
Fig. 3. Cover pages of old agricultural books in China (Qimin Yaoshu, left) and
Japan (Noukagyouji, right).

DISSEMINATION OF WATER MANAGEMENT IN RICE PADDIES IN ASIA
27
Fig. 4. Old picture of N topdressing during midseason drainage published
during the Edo Period in Japan (reprinted from Tsuchiya and Shimizu
1983)
Table 3. Historical transition of adoption rate of midseason drainage according
to the area in Japan during the modern times (%)
Areaa 1933b 1966c 2008–2011d Hokkaido 0 2 25 Tohoku 18 52 92 Kanto 12 48 79 Hokuriku 71 64 96 Tokai-Kinki 43 66 87 Chugoku-Shikoku 39 69 87 Kyusyu 58 73 87 All ― ― 87 a From north to south b Yamaguchi (2018) c SSDBAFE-MAF (1967) d Leon et al. (2015)

DISSEMINATION OF WATER MANAGEMENT IN RICE PADDIES IN ASIA
28
CURRENT CONSTRAINTS ON AWD
Most of the constraints on the long-term dissemination of midseason drainage, as mentioned above, hold true for the dissemination of AWD, albeit with a much shorter history, starting from the 1990s. However, as AWD is implemented primarily for water saving (Table 2), there is a large difference in water availability between the regions adopting midseason drainage and those adopting AWD. This chapter first outlines the constraints on the current dissemination of AWD, and then presents the results of a case study to explore the dissemination process in the An Giang province located in the Mekong Delta, Vietnam (Yamaguchi et al. 2016; 2017; 2019).
The dissemination of AWD is also underway in the tropics and subtropics. There must be rice-growing areas suitable in terms of environmental conditions such as climate, soil, weather, and topography at multiple spatial scales (Fig. 5). For example, Nelson et al. (2015) assessed the spatiotemporal pattern of climate suitability for AWD in Cagayan province, in the Philippines, using the water balance model that they developed and drew a suitability map for AWD implementation. On the other hand, social constraints are also heavily involved in the dissemination of AWD (Fig. 5). For example, the Vietnamese government is promoting the agricultural policy “1 Must Do, 5 Reductions (1M5R),” in which “1 Must Do” requests farmers to use certificated rice seeds and “5 Reductions” recommends reducing the amounts of seeds, agrochemicals, fertilizers, and irrigation water used, and reducing post-harvest losses (Fig. 6; Yamaguchi et al. 2016). In the 1M5R policy, AWD is considered to be the most important component by which to achieve the reduction in irrigation water usage.
Water availability determines the suitability of AWD. There are hierarchical constraints on the adoption of AWD by farmers in terms of water use (Fig. 7). The irrigated rice ecotype is more suitable to AWD than is the rainfed rice ecotype due to the high availability of water needed; however, AWD itself is conditionally possible even in the rainfed ecosystem (e.g., pump usage with extra cost). Even in the irrigated ecosystem, water may not be available on demand in case of gravity irrigation or tidal irrigation. If an irrigation pump is owned privately, there is an incentive to reduce the volume of irrigation water used to save pump fuel cost. Even if the pump is rented, the volumetric charging can give farmers an incentive to reduce water use.
The An Giang province, Vietnam, is proud of its high adoption rate of AWD, reaching 52% of the total paddy area in the 2014–2015 dry season (Fig. 8; Yamaguchi et al. 2019). One of the major reasons for the high dissemination rate is that, since the end of the 1990s, embankments (full-dike system) have been established and large-capacity pumps have been installed

DISSEMINATION OF WATER MANAGEMENT IN RICE PADDIES IN ASIA
29
to drain rainwater from rice paddies surrounded by an embarkment to the outside, enabling rice triple-cropping and on-demand irrigation and drainage (Yamaguchi et al. 2019). Another major reason for the high uptake of AWD is the positive effect of AWD on rice growth and yield. Through interviews with local government staff, we found that AWD was effective at reducing rice lodging, thereby leading to higher yields (Yamaguchi et al. 2017). In addition, the farmers (1) used soil hardness as indicated by the footprints left and/or the cracks developed on the soil surface as the simplified criteria for AWD in a broad sense to decide the timing of re-flooding instead of assessing the surface water level; and (2) practiced AWD even in rainy seasons with the expectation of yield increases (Yamaguchi et al. 2016). Using statistics and GIS data, it was demonstrated that, in a dissemination campaign (to improve farmers’ perception of AWD), paddy elevation (mid-lying is the best), and infrastructure status (channel density/network) were critical factors in disseminating AWD in the An Giang province (Fig. 5; Yamaguchi et al. 2019).
Fig. 5. Bottlenecks in adopting AWD. Adapted from Yamaguchi et al. (2016;
2017; 2019) and Nelson et al. (2015).

DISSEMINATION OF WATER MANAGEMENT IN RICE PADDIES IN ASIA
30
Fig. 6. Cover page of the guidebook on “1 Must Do, 5 Reductions” policy
(Sub-department of Plant Protection in An Giang 2014).
Fig. 7. A flowchart demonstrating the suitability of AWD in terms of water use.
Adapted from Kurschner et al. (2010), Richard and Sander (2014),
Sibayan et al. (2010), and Yamaguchi et al. (2016).

DISSEMINATION OF WATER MANAGEMENT IN RICE PADDIES IN ASIA
31
Fig. 8. Map of the An Giang province, Vietnam (left), and the AWD
dissemination rate by commune in the 2015 dry season (right). A white
parcel in right panel indicates a commune with missing data.
FUTURE PERSPECTIVES OF DISSEMINATION
What is necessary to achieve further dissemination of water management as a climate-change mitigation option? It is essential to formulate direct and/or indirect incentives for rice farmers. However, it is unclear how to develop what kind of incentive. This final chapter explains the detailed ways to develop further dissemination of water management protocols based on the study by Minamikawa et al. (2018).
There are three possible approaches for achieving a widespread dissemination of climate-change mitigation options by rice farmers (Table 4). The voluntary approach is the most acceptable one for farmers because it is directly linked to their own incentive. For example, soil C sequestration is effective in reducing soil CO2 emissions and also in providing the long-term resilience of rice production in the face of climate change. In addition, the increase in rice yield, if achieved, can be a direct incentive for farmers to adopt water management in tropical and subtropical regions; thus it is necessary to accumulate a more scientific basis for the mechanisms of yield increase by water management similar to the aforementioned beneficial effects of midseason drainage. However, there must be an upper boundary to the mitigation, which can be achieved by voluntary efforts alone.
Through the semi-institutional approach, farmers can obtain some financial incentives in the form of governmental subsidies or added value

DISSEMINATION OF WATER MANAGEMENT IN RICE PADDIES IN ASIA
32
through certification. For example, in Japan, farmers can obtain economic incentives by participating in the governmental subsidy program “Direct payment for environmentally friendly agriculture,” in which the prolonging of midseason drainage is a regionally approved alternative in several prefectures. Although the semi-institutional approach helps in substantially reducing GHG emissions, the efforts of this approach in GHG reduction cannot readily be registered to the national GHG inventory that is submitted to the United Nations Framework Convention on Climate Change (UNFCCC).
The institutional approach is driven by carbon pricing (i.e., market mechanisms and carbon tax) or Nationally Appropriate Mitigation Action (NAMA). Farmers can gain economic incentives or avoid taxes by participating in a mitigation project that mandates them to practice additional agricultural management strategies, such as water management. For example, NAMAs that use AWD as a mitigation option of CH4 emissions are in the preparation phase in Thailand (Thai Rice NAMA; NAMA Facility 2018) and in the preliminary phase with limited implementation areas in the Philippines (AMIA; UNDP 2015). However, till date, the methodology for implementing such mitigation projects for rice cultivation has not been well documented.
Monitoring, Reporting, and Verification (MRV) is a concept that integrates three independent processes of GHG emissions mitigation initiatives: monitoring or measurement (M), reporting (R), and verification (V) (Fig. 9). It assures the accuracy and reliability of the GHG emission baseline and, therefore, any reductions from it. Although each process should be independent of the others, MRV refers to a system that involves a systematic integration of the three processes (IGES, 2011). Recently, the use of market mechanisms has been articulated in the Article 6 of the Paris Agreement (UNFCCC, 2015), which prescribes the use of emission reductions achieved overseas for achieving national GHG emission reduction targets:
• Article 6.2: Internationally transferred mitigation outcomes between
authorizing parties • Article 6.4: A mechanism to contribute to mitigation and sustainable
development
The use of market mechanisms under the Paris Agreement will accelerate the institutional spread of mitigation options through the development of MRV methodology for a certain project. Minamikawa et al. (2018) developed a handbook that provides people who are engaged or interested in the development and implementation of MRV methodologies for water management in irrigated rice paddies with (1) basic information regarding

DISSEMINATION OF WATER MANAGEMENT IN RICE PADDIES IN ASIA
33
MRV, particularly for quantifying GHG emissions and reductions and (2) updates on evolving issues facing these people. Table 4. Characteristics of three approaches to disseminating mitigation
options for GHG emissions from paddy rice cultivation (modified from
Minamikawa et al. 2018) Voluntary Semi-institutional Institutional Explanation Get help from benefits
and synergies for activities such as higher rice production and climate-change adaptation
Domestic subsidy, and governmental or private certification systems
International or domestic carbon pricing, and NAMA
Advantage No additional cost Indirect financial
incentive from improved products
Financial incentive Relatively easy
documentation
Financial incentive Accountable to national GHG
inventory
Drawback Limited number of options
Limited mitigation capacity
Limited amount of subsidy
Limited purchasers
Complicated documentation Risks of low carbon price
Example Soil C sequestration Early maturing
variety
Good Agricultural Practice (GAP)
Eco-labeling
Clean Development Mechanism (CDM)
Thai Rice NAMA Note: An activity of the voluntary approach can be an activity of the semi-institutional or the institutional approach,
if approved.
Fig. 9. Schematic representation of MRV implementation under a certain
mitigation project.

DISSEMINATION OF WATER MANAGEMENT IN RICE PADDIES IN ASIA
34
REFERENCES
Ciais, P., C. Sabine, G. Bala et al. 2013. Carbon and Other Biogeochemical Cycles. pp. 465-570 in: T.F. Stocker, D. Qin, G.K. Plattner et al. (eds.) Climate Change 2013: The Physical Science Basis. Contribution of Working Group I to the Fifth Assessment Report of the Intergovernmental Panel on Climate Change. Cambridge University Press, Cambridge, UK and New York, NY, USA.
FAOSTAT. 2018. Available from http://www.fao.org/faostat/en/#home. Guo, J., Z. Song, Y. Zhu, W. Wei, and S. Li. 2017. The characteristics of
yield-scaled methane emission from paddy field in recent 35-year in China: A meta-analysis. Journal of Cleaner Production 161: 1044-1050.
Hayashi, K., S. Nishimura, and K. Yagi. 2008. Ammonia volatilization from a paddy field following applications of urea: rice plants are both an absorber and an emitter for atmospheric ammonia. Science of the Total Environment 390: 485-494.
IGES (Institute for Global Environmental Strategies). 2011. Classification of MRV of Greenhouse Gas (GHG) Emissions/Reductions: For the discussions on NAMAs and MRV. Policy Brief Number 25, IGES. Available from https://mitigationpartnership.net/sites/default/files/iges_pb_mrv.pdf.
IPCC. 2006. Methane Emissions from Rice Cultivation: Cropland: Agriculture, Forestry and Other Land Use. pp. 5.44-5.53 in: H.S. Eggleston et al. (eds.) 2006 IPCC Guidelines for National Greenhouse Gas Inventories. IGES, Hayama, Japan.
Kajiura, M., K. Minamikawa, T. Tokida, Y. Shirato, and R. Wagai. 2018. Methane and nitrous oxide emissions from paddy fields in Japan: An assessment of controlling factor using an intensive regional data set. Agriculture, Ecosystems and Environment 252: 51-60.
Kurschner, E., C. Henschel, T. Hildebrandt, E. Julich, M. Leineweber and C. Paul. 2010. Water Saving in Rice Production-dissemination, Adoption, and Short-term Impacts of Alternate Wetting and Drying (AWD) in Bangladesh. SLE Publication Series S241. Humboldt Universität, Berlin, Germany.
Lampayan, R.M., F.G. Palis, R.B. Flor et al. 2009. Adoption and Dissemination of “Safe Alternate Wetting and Drying” in Pump Irrigated Rice Areas in the Philippines. pp. 1-11 in: Proceedings of 60th International Executive Council Meeting and 6th Asian Regional Conference of the International Commission on Irrigation and Drainage. Indian National Committee on Irrigation and Drainage, New Delhi, India.
Leon, A, K. Kohyama, K. Yagi, Y. Takata, and H. Obara. 2015. The effects of current water management practices on methane emissions in Japanese

DISSEMINATION OF WATER MANAGEMENT IN RICE PADDIES IN ASIA
35
rice cultivation. Mitigation and Adaptation Strategies for Global Change 22: 85-98.
Linquist, B.A., M.M. Andreas, M.A.A. Adviento-Borbe, R.L. Chaney, L.L. Nalley, E.F.F. da Roda and C. van Kessel. 2015. Reducing greenhouse gas emissions, water use, and grain arsenic levels in rice systems. Global Change Biology 21: 407-417.
Myhre, G., D. Shindell, F.M. Bréon et al. 2013. pp. 659-740 in: T.F. Stocker, D. Qin, G.K. Plattner et al. (eds.) Climate Change 2013: The Physical Science Basis. Contribution of Working Group I to the Fifth Assessment Report of the Intergovernmental Panel on Climate Change. Cambridge University Press, Cambridge, UK and New York, NY, USA.
Minamikawa, K., T. Yamaguchi, T. Tokida, S. Sudo, and K. Yagi. 2018. Handbook of Monitoring, Reporting, and Verification for a Greenhouse Gas Mitigation Project with Water Management in Irrigated Rice Paddies. Institute for Agro-Environmental Sciences, NARO, Tsukuba, Japan. 42 pp.
NAMA Facility. 2018. Thailand–Thai Rice NAMA. Available from https://www.nama-facility.org/projects/thailand-thai-rice-nama.
Naser, H.B., O. Nagata, S. Tamura, and R. Hatano. 2007. Methane emissions from five paddy fields with different amounts of rice straw application in central Hokkaido, Japan. Soil Science and Plant Nutrition 53: 95-101.
Nelson, A., R. Wassmann, B.O. Sander, and L.K. Palao. 2015. Climate-determined suitability of the water saving technology” alternate wetting and drying” in rice systems: a scalable methodology demonstrated for a province in the Philippines. PloS one 10: e0145268.
Richards, M. and B.O. Sander. 2014. Alternate wetting and drying in irrigated rice. CSA Practice Brief. Copenhagen, Denmark.
Shindell, D., J.C.I. Kuylenstierna, and E. Vignati et al. 2012. Simultaneously mitigating near-term climate change and improving human health and food security. Science 335: 183-189.
Shirato, Y. and M. Yokozawa. 2005. Applying the Rothamsted Carbon Model for long-term experiments on Japanese paddy soils and modifying it by simple tuning of the decomposition rate. Soil Science and Plant Nutrition 51: 405-415.
Sibayan, E.B., K. Samoy-Pascual, F. Grospe, M.E. Casil, T. Tokida, A. Padre and K. Minamikawa. 2018. Effects of alternate wetting and drying technique on greenhouse gas emissions from irrigated rice paddy in Central Luzon Philippines. Soil Science and Plant Nutrition 64: 39-46.
Sibayan, E.B., J.L. de Dios, M.L. Florague, L.C. Javier, A.S. Espiritu, R.M. Lampayan, and A.S. Nangel. 2010. Controlled irrigation adoption for efficient water management at the system level for increasing and sustaining water productivity. pp. 135-150 in: F.G. Palis, G.R. Singleton,
DISSEMINATION OF WATER MANAGEMENT IN RICE PADDIES IN ASIA
36
M.C. Casimero and B. Hardy (Eds.) Research to Impact: Case Studies for Natural Resource Management for Irrigated Rice in Asia. IRRI, Los Baños, Philippines.
SSDBAFE-MAF (Statistical Survey Department, Bureau of Agricultural and Forestry Economics, Ministry of Agriculture and Forestry). 1967. Crop Statistics in 1966 (No. 9). Association of Agriculture and Forestry Statistics, Tokyo, Japan. 488 pp. (in Japanese).
Sub-Department of Plant Protection in An Giang. 2014. So Tay Huong Dan Trong Lua Can San Theo “1 Pahi 5 Giam.”
Tirol-Padre, A., K. Minamikawa, T. Tokida, R. Wassmann, and K. Yagi. 2018. Site-specific feasibility of alternate wetting and drying as a greenhouse gas mitigation option in irrigated rice fields in Southeast Asia: a synthesis. Soil Science and Plant Nutrition 64: 2-13.
Tsuchiya, M. and Shimizu, T. 1983. Nihon-Nougaku-Zensyu: Vol. 26 Nougyou-Zue (Kaga). Rural Culture Association Japan, Tokyo, Japan. 312 pp. (in Japanese).
UNDP (United Nations Development Programme). 2015. Adaptation and Mitigation Initiatives in Philippine Rice Cultivation. Available from http://www.undp.org/content/dam/undp/library/Environment%20and%20Energy/MDG%20Carbon%20Facility/AMIA%20Philippines%20Final.pdf.
UNFCCC. 2015. Paris Agreement (FCCC/CP/2015/L.9/Rev.1). Available from http://unfccc.int/resource/docs/2015/cop21/eng/l09r01.pdf.
Yagi, K. and K. Minami. 1990. Effect of organic matter application on methane emission from some Japanese paddy fields. Soil Science and Plant Nutrition 36: 599-610.
Yamaguchi, T., L.M. Tuan, K. Minamikawa, and S. Yokoyama. 2019. Assessment of the relationship between adoption of a knowledge-intensive water-saving technique and irrigation conditions in the Mekong Delta of Vietnam. Agricultural Water Management 212: 162-171.
Yamaguchi, T. 2018. Diffusion of Nakaboshi–An implication for the diffusion of the water-saving irrigation in the Asian countries. Research for Tropical Agriculture 11: 51-52. (in Japanese).
Yamaguchi, T., L.M. Tuan, K. Minamikawa, and S. Yokoyama. 2017. Compatibility of alternate wetting and drying irrigation with local agriculture in An Giang Province, Mekong Delta, Vietnam. Tropical Agriculture and Development 61: 117-127.
Yamaguchi, T., L.M. Tuan, K. Minamikawa, and S. Yokoyama. 2016. Alternate wetting and drying (AWD) irrigation technology uptake in rice paddies of the Mekong Delta, Vietnam: relationship between local conditions and the practiced technology. Asian and African Area Studies 15: 234-256.

SYSTEM OF RICE INTENSIFICATION: AN ALTERNATIVE MITIGATION STRATEGY TO GREENHOUSE GAS EMISSIONS FROM PADDY FIELDS IN INDONESIA
37
SYSTEM OF RICE INTENSIFICATION: AN ALTERNATIVE MITIGATION STRATEGY TO
GREENHOUSE GAS EMISSIONS FROM PADDY FIELDS IN INDONESIA
Chusnul Arif1, Budi Indra Setiawan1,
Nur Aini Iswati Hasanah2, and Masaru Mizoguchi3
1Department of Civil and Environmental Engineering,
IPB University, Bogor, Indonesia 2Department of Environmental Engineering,
Universitas Islam Indonesia, Yogyakarta, Indonesia 3Department of Global Agricultural Sciences,
The University of Tokyo, Tokyo, Japan
E-mail: [email protected]; [email protected]
ABSTRACT The agricultural system has been influenced by regional climate change particularly its water resource. Precipitation pattern has changed in which extreme events such as La-Niña and El-Niño frequently occur during the last ten years. Increasing greenhouse gas concentration in the atmosphere has increased the average air temperature that affected planting season and water availability in the fields. To deal with this regional climate change, adaptation and mitigation strategies are urgent mainly for rice farming with less water input. The system of Rice Intensification (SRI) is alternative rice farming for climate change adaptation and mitigates greenhouse gas emission from paddy fields. At least, there are three major benefits of SRI dealing with climate change, i.e. minimum greenhouse gas emission, more efficient water irrigation and reduced chemical fertilizers application. Although some critics were dismissed, the beneficial effects of this set management have been demonstrated and confirmed in 60 countries in Africa, Latin America and Asia. A long-term field experiment of SRI was conducted in Indonesia with significant yield increases and reduced water use as well as greenhouse gas emissions. SRI is a set of crop management for plants, soil, water, and nutrients simultaneously in producing more rice with less water input. It has six basic elements, i.e. young seedlings, single transplanting, wider spacing, transplanting quickly and carefully, applying intermittent irrigation and use of compost as much as possible. Here, water

SYSTEM OF RICE INTENSIFICATION: AN ALTERNATIVE MITIGATION STRATEGY TO GREENHOUSE GAS EMISSIONS FROM PADDY FIELDS IN INDONESIA
38
management is key management to reduce greenhouse gas emission. By applying intermittent irrigation, the field is conditioned wet (saturated level without flooding) and dries in particular time and continous flooding is avoided. According to previous studies, this irrigation regime was effective to minimize global warming potential at different levels up to 46.4% depending on field conditions. For optimum SRI water management, we found that moderate regime was an alternative option for mitigating greenhouse gas emission without reducing yield significantly. In this regime, the soil moisture was kept at saturated level from the beginning to generative stage (one week before harvesting) and then it is conditioned dry until harvesting. This regime released greenhouse gas emission 80.1% lower than that of continous flooding irrigation (control). However, the experiment was conducted only in one planting season with specific weather condition. For future work, more experiments should be conducted to find optimal water management under varying weather conditions to mitigate greenhouse gas emission without lowering land productivity.
Keywords: Greenhouse gas emission, paddy fields, system of rice
intensification, water management
INTRODUCTION
The agricultural system has been influenced by regional climate change particularly its water resource. Precipitation pattern has changed in which extreme events such as La-Niña and El-Niño frequently occur during the last ten years. Increasing greenhouse gas concentration in the atmosphere has increased the average air temperature that affected planting season and water availability in the fields. Some negative impact of climate change e.g., crop failure, degradation of agriculture land resources, increasing dryness frequency, area and intensity, increasing the threat of pests and diseases (OPT) (Las et al. 2008). Adaptations to regional climate change and mitigation greenhouse gas emission strategies are urgent to address this problem. In Indonesia, paddy fields commonly supplied more water by applying continuous flooding in which standing water 2-5 cm are kept to reduce weed growth with minimum water supply frequency and avoidance of water shortage due to the unreliable water supply system. This method is not effective, because water is supplied more than its actual plant requirement. Also, this method caused in water lost for deep percolation, seepage through bunds and runoff from the soil surface (Bouman 2001).
In addition, flooding condition in the fields caused limited oxygen and others gasses such as sulfates in that soil environment. This situation promotes methanogenesis activities that will relaease more methane (CH4)

SYSTEM OF RICE INTENSIFICATION: AN ALTERNATIVE MITIGATION STRATEGY TO GREENHOUSE GAS EMISSIONS FROM PADDY FIELDS IN INDONESIA
39
emission to the atmosphere (Bouwman 1990). Methane is one of most important greenhouse gases that contributes to global warming. Therefore, the conventional paddy field with continous flooding irrigation is known as a major source of methane emission (Cicerone et al. 1992; Nueu et al. 1990). Further, paddy fields also emitted other greenhouse gas, i.e., nitrous oxide (N2O) and CO2. Although nitrous oxide concentration is smaller than methane emission and can be negligible according to Smith et al. 1982, nitrous oxide contributed 298 times greather than CO2 in global warming potential (IPCC 2007). Thus, nitrous oxide emission should be considered and reduced in its concentration from the atmosphere. Nitrification and denitrification processes in the soil are main source of realeasing nitrous oxide in the atmosphere as well as microbial process in the soil (Mosier et al. 1996).
The characteristic methane and nitrous oxide emissions are different and have opposite trend (Cai et al. 1997). Sometimes nitrous oxide emission reduces when flooded condition occurs in the paddy field, on the other hand, its release more at the beginning of the disappearance of flooding water. Also, its emission increased significantly when nitrogen fertilizer was induced to the field (Akiyama et al. 2005). On the contrary, methane emission increased during flooding (anaerobic condition) and limited when water was drained from the field (Setyanto et al. 2000). Therefore, irrigation system is one of the most important tools in rice farming and is the most important effort for methane and nitrous oxide mitigation (Tyagi et al. 2010). We should introduce alternative irrigation system instead of continuous flooding since this irrigation is not effective from environment perspective as well as water resource.
System of Rice Intensification (SRI) is alternative rice farming for climate change adaptation and mitigates greenhouse gas emission from paddy fields. At least, there are some major benefits of SRI dealing with regional climate change, i.e. minimum greenhouse gas emission, more efficient water irrigation and reduced chemical fertilizers application by applying compost/organic fertilizer as well as increasing farmer’s net income (Uphoff and Dazzo 2016). SRI is a set of crop management for plants, soil, water, and nutrients simultaneously that are different from common practices by farmers in Indonesia to produce more rice with less water input. Although some researchers have different view points of SRI e.g. Sinclair and Cassman 2004, Sheehy et al. 2004, the benefits effects of this set management system have been demonstrated and confirmed in 60 countries in Africa, Latin America and Asia (http://sri.ciifad.cornell.edu/countries/inde x.html). Many scientific papers have reported the benefits of SRI application in many countries in term of water irrigation, yield and greenhouse gas emission. For example, SRI application can save water irrigation up to 28%,

SYSTEM OF RICE INTENSIFICATION: AN ALTERNATIVE MITIGATION STRATEGY TO GREENHOUSE GAS EMISSIONS FROM PADDY FIELDS IN INDONESIA
40
38.5% and 40% in Japan, Iraq and Indonesia, respectively (Chapagain and Yamaji 2010; Sato et al. 2011; Hameed et al. 2011). For rice yield, SRI demonstration plot increased yield in China, Iraq, Afghanistan, Indonesia and Madagascar for 11.3% , 42%, 65%, 78% and 100%, respectively (Lin et al. 2011; Hameed et al. 2011; Thomas and Ramzi 2011; Sato et al. 2011; Barison and Uphoff 2011). Further, SRI also reduced greenhouse gas emission that is represented by reducing global warming potential up to 37.5% in Indonesia (Hidayah et al. 2009) and 40% in India (Gathorne-Hardy et al. 2016).
SRI was introduced in Indonesia in 1999 by the Agency for Agricultural Research and Development in dry season, and then it was spread out to some areas through several programs in Indonesia. The data in 2014 showed that SRI has been applied in 29 provinces and 247 districts with total areas during 2010-2015 were 450,855 ha. Ministry of Agriculture supports SRI by many programs such as inputs production (fertilizers, seeds and pesticides), irrigation pump, hand tractor and composting unit. The current study proposed review SRI basic concepts and its application in Indonesia, greenhouse gas emissions from paddy fields and its mitigation strategy particularly by determining optimal option of water management from SRI paddy fields.
SYSTEM OF RICE INTENSIFICATION: AN OVERVIEW
First, SRI was observed and introduced in Madagascar in the early 1980s by Fr. Henri de Laulanié. Recently, SRI is spread out over the world to 60 countries by Professor from Cornell University, Norman Uphoff (http://sri.cii fad.cornell.edu/countries/index.html). In short definition, SRI has six basic elements that are different with farmer’s practices in Indonesia and it can be summarized by following points (Uphoff et al. 2011):
1. Young seedling (7-14 days after sowing) is transplanted while still at the 2–3 leaf stage. Young seed is selected because it has more potential for roots and shoots growing (Nemoto et al. 1995).
2. Avoiding trauma to the roots, seed is transplanted quickly and carefully with lower depth approximately 1 cm depth
3. One seed in one hill (single transplanting) with wider spacing to give more space for plant growing
4. Apply intermittent irrigation instead of continuous flooding. 5. Doing weeding early and regularly. It is recommended using rotary
weeder to eliminate weed and increase soil aeration at the same time. 6. Apply compost and others organic fertilizer as much as possible to
enhance soil organic matter instead of chemical fertilizer.

SYSTEM OF RICE INTENSIFICATION: AN ALTERNATIVE MITIGATION STRATEGY TO GREENHOUSE GAS EMISSIONS FROM PADDY FIELDS IN INDONESIA
41
Fig. 1. Some basic elements of SRI: young seed, single transplanting and wider
spacing.
By integrated plant, soil, water, nutrient and agro-ecological approach in
irrigated rice farming, SRI allowed farmers to realize yields of up to 15 tons/ha with less water input and chemical fertilizers input by participatory on-farm experiments demonstrated in Madagascar (Stoop et al. 2002). However, contrary results were obtained and stated that SRI has no inherent benefits over the conventional rice farming (Sheehy et al. 2004). Thus, SRI is like an ‘‘unidentified flying object’’ (UFO) or “unconfirmed field observation”, as vehement criticism by Sinclair and Cassman 2004.
In early 2000, SRI became controversial and there were some constraints in spreading out SRI in Indonesia, such as determining optimum water management and then developing irrigation-drainage water control system to inhibit weed growth (Gani et al. 2002). By applying intermittent irrigation, the field is conditioned wet (saturated level without flooding) and dry in particular time and avoiding continuously flooding. Based on previous studies, intermittent irrigation saves more water input from 28% to 40% compared to conventional rice farming and it increases rice yield up to 100%. The key is to keep soil moist enough to sustain plant growth because flooding water sometimes caused the plant became suffocate. Irrigation

SYSTEM OF RICE INTENSIFICATION: AN ALTERNATIVE MITIGATION STRATEGY TO GREENHOUSE GAS EMISSIONS FROM PADDY FIELDS IN INDONESIA
42
water control system for SRI has been developed in Indonesiausing fuzzy logic algorithms and its performance was good as indicated by lower error. This system can save water irrigation up to 42.54% without reducing yield (Arif et al. 2018).
GREENHOUSE GAS EMISSIONS FROM PADDY FIELDS
Recently, two hot issues i.e. global warming and climate change have became considerable scientific debate and public concern. Global Warming Potential (GWP) is known as the potential of some greenhouse gasses that emitted to the atmosphere trapping heat relative to carbon dioxide (CO2) over a specific time horizon. GWP is computed by multiplying the amount of gas by its associated GWP to carbon dioxide equivalent (CO2 eq) value (Smith and Wigley 2000). In agricultural fields, methane (CH4) and nitrous oxide (N2O) gasses are known as main source of greenhouse gas emission that contribute to GWP at 25 and 298 times greater than carbon dioxide, respectively (IPCC 2007). Thus, those gasses have attracted considerable attention because of their effects to global warming (Neue et al. 1990).
As previously mentioned that paddy fields release two kinds of greenhouse gasses. Many research findings have been published regarding methane and nitrous oxide emissions from paddy fields over the past 25 years in regard both continuous flooded irrigation and intermittent irrigation. There are clear findings that methane emission enhances when anaerobic soil condition is developed under flooded water; on the other hand, nitrous oxide emission dramatically increase under aerobic condition with non-flooded water in the fields. One studies showed that a SRI paddy field with intermittent wetting-drying irrigation reduced methane emission by up to 32% (Rajkishore et al. 2013), but nitrous oxide emission increased by an insignificant 1.5% (Dill et al. 2013). Commonly, methane gas is formed by methanogens bacteria when the field condition was limited oxygen and sulfate during decomposition process (Epule et al. 2011). Methane gas is produced as final process of CO2 reduction in the anaerobic soil. Meanwhile, nitrous oxide is formed by nitrification and denitrification process in the soil. Nitrification is converting process of ammonium ion (NH4
+) to be nitrate ion (NO3
-) in three step processes by autotroph bacterial in aerobic condition. N2O is formed as by product of that process. Then, denitrification process occurs to reduce nitrate ion to be nitrogen in anerobic condition with intermediate products of NO2
-, NO and N2O.

SYSTEM OF RICE INTENSIFICATION: AN ALTERNATIVE MITIGATION STRATEGY TO GREENHOUSE GAS EMISSIONS FROM PADDY FIELDS IN INDONESIA
43
Previous studies on greenhouse gas emission in Indonesia Here, we report some greenhouse gas emission studies in Indonesia that have been conducted in some location with various field conditions:
a. Greenhouse gas emission from paddy fields in Central Java (Setyanto and Bakar 2005) This research was conducted at the Agricultural Environmental Research Institute, Jakenan, Pati, Central Java during the dry season of March - June 2002 to determine the effect of different irrigation systems on methane gas emissions. The results showed that intermittent irrigation systems produced methane gas emissions of 136 kg/ha, while flooding irrigation systems with 0-1 cm standing water released total methane emission of 254 kg/ha. This shows that intermittent irrigation systems that are usually applied in SRI cultivation can significantly reduce methane gas emissions up to 46.5%.
b. Greenhouse gas emission from irrigated paddy field in West Java (Hidayah et al. 2009) The experiment was conducted in paddy fields with tertiary irrigation in Cimanuk watershed, West Java in 2009. They compared emission from conventional and SRI paddy fields and their results were presented in Table 1.
Table 1. Comparison greenhouse gas emission from conventional and SRI
paddy fields
Rice cultivation Emissions (kg/ha/season) GWP
(t CO2 eq) CH4 N2O CO2
Conventional Practices 189.3 1.42 15,752 20.5
SRI
Plot 2 22.0 4.88 14,380 16.3
Plot 3 142.5 1.36 11,192 14.9
Plot 4 128.2 1.41 12,672 16.0
Plot 5 208.9 1.39 26,655 31.9
Plot 6 90.2 1.64 15,282 17.8
Average 118.4 2.14 16,036 19.4
Table 1 shows that SRI is able to significantly reduce methane gas emissions from 189.3 kg/ha to 118.4 kg/ha. This means that SRI is able to reduce methane gas emissions by 37.5%. However, the reduction in methane gas emissions is not accompanied by a decrease in N2O and CO2 gas emissions. In fact, the emissions of these two gases increase by 50.7% for N2O and 1.8% for CO2 emissions. However, in general, SRI cultivation contributes less to greenhouse

SYSTEM OF RICE INTENSIFICATION: AN ALTERNATIVE MITIGATION STRATEGY TO GREENHOUSE GAS EMISSIONS FROM PADDY FIELDS IN INDONESIA
44
gas emissions with an indication of the lower value of Global Warming Potential (GWP). SRI's GWP value is 5.3% smaller than conventional rice cultivation.
c. Greenhouse gas emission from Paddy Fields in South Kalimantan (Hadi et al. 2010) Here, greenhouse gas emissions from two different water irrigation regimes with different rice variety were compared. Table 2 shows the comparison between those regimes
Table 2. Greenhouse gas emissions from paddy fields with different water
irrigation regimes in South Kalimantan (Hadi et al. 2010)
Rice
Variety
Irrigation
Regime
Emissions (kg C/ha/season) GWP
(kg CO2
eq/ha/season) CH4 CO2 N2O
Local 2004 Flooding 1,251 810 8.9 32,217
Intermittent 1,065 556 -50.3 10,162
Hybrid
2004/2005
Flooding 1,318 193 26.6 38,381
Intermittent 1,129 198 5.9 27,911
Local 2005 Flooding 1,585 1,191 -29.6 28,884
Intermittent 1,217 1,043 -14.8 24,653
Average
2004/2005
Flooding 1,384 731 1.97 33,161
Intermittent 1,137 599 -19.73 20,909
Intermittent irrigation reduced greenhouse gas emissions for all
gasses. For the average, methane emission can be reduced to 17.8%, while CO2 was reduced up to 18.6%. Intermittent irrigation does not released N2O as indicated by its negative value as shown in Table 2. In addition, intermittent irrigation can minimize GWP in which its value was 36.9% lower than that flooding irrigation regime.
d. Greenhouse gas emission from tertiary irrigation fields in East Java (Utaminingsih and Hidayah 2012)
The research was conducted during one planting season from April to August 2010 with three plots and total areas of 133 ha. Two irrigations system were also compared as presented in Table 3.

SYSTEM OF RICE INTENSIFICATION: AN ALTERNATIVE MITIGATION STRATEGY TO GREENHOUSE GAS EMISSIONS FROM PADDY FIELDS IN INDONESIA
45
Table 3. Greenhouse gas emissions from paddy field in East Java
(Utaminingsih and Hidayah 2012)
Irrigation regime
Total Emissions
(kg/ha/season) GWP
(t CO2 eq) CH4 N2O CO2
Flooding 306.89 0.24 1,084.32 8.84
Intermittent
Plot 1 61.89 0.68 1,234.28 2.98
Plot 2 33.59 0.50 1,796.75 2.78
Plot 3 277.02 0.77 1,296.09 8.45
Average 124.17 0.65 1,442.37 4.74
In this case, intermittent irrigation can reduce methane emission of 59.5%, on the other hand, nitrous oxide and CO2 gases increased significantly. Overall, GWP value can be reduced up to 46.4%.
MITIGATION STRATEGY Field experiments and measurements According to previous studies, it is clearly explained that SRI with intermittent irrigation can reduce greenhouse gas emission from paddy field significantly. However, optimal SRI water management is still questionable for its application in Indonesia as well as its effect on plant growth performance and yield. Therefore, we conducted field experiment to find optimal water management with two main objectives, i.e. reduce greenhouse gas emissions and produce more rice with minimum water irrigation input.
The field experiment was conducted in paddy fields located in Bogor, West Java, Indonesia during 26 March – 24 June 2015. On 26 March 2015, we planted rice (Oryza sativa L) with the variety of Ciherang. Some SRI elements practiced consist of young seeds (5 days sowing) and one plant in one hill (single transplanting) with wider space of 30 cm × 30 cm. Here, the three plots were supplied with different irrigation regimes with two replications. The first plot was continuous flooding regime (FL) as control in which standing water at 2 and 5 cm water depth was managed from the beginning of cultivation period (vegetative) to one week before harvesting (generative), and then the field was conditioned dry before harvesting. The second plot was moderate irrigation regime (MD) in which the soil moisture was kept at saturated level from the beginning to generative stage (one week before harvesting) and then it is conditioned dry until harvesting. The last plot was dry irrigation regime (DR) to save more water in extreme condition in which the saturated condition of soil was managed only 20 days after transplanting, then dry condition was formed by manage water level at -5 cm

SYSTEM OF RICE INTENSIFICATION: AN ALTERNATIVE MITIGATION STRATEGY TO GREENHOUSE GAS EMISSIONS FROM PADDY FIELDS IN INDONESIA
46
water depth (5 cm under soil surface) until harvesting time. Greenhouse gas emissions, i.e., CH4 and N2O, were measured manually
using closed chamber box. The size chamber was 30 cm x 30 cm x 120 cm and it’s was equipped with the fan to circulate the air inside the box during measurement. During measurement, one hill of paddy rice was closed by the chamber, and then the gas sample is taken every 10 minutes within 30 minutes. We got 4 different gas concentrations that were analyzed using a gas chromatograph (Micro GC CP 4900) with flame ionization detector (FID) in the lab. Based on the change of its concentration, we determined greenhouse gas emission. Plant perfomances
Table 4 shows the effects of irrigation regime on the plant performances. Plant height, number tillers/hill and number panicles/hill were comparable among the regimes and not significantly different. DR treatment produced the highest plant and number panicles/hill as well as root length. This condition also corresponded to biomass yield in which DR regime produced the heaviest biomass. These results revealed that under SRI practices when the field was not flooded continuously, the root can growth optimally. In addition, when the water was limited, the plant enhanced root length to find the water in soil under the driest condition (Fig. 2).
Table 4. Plant performances under different water regimes
Plant Performances Irrigation Regimes
FL MD DR
Plant Height (cm) 85.0 ± 2.6 84.4 ± 3.1 88.5 ± 2.6
Number tillers/hill 25.7 ± 8.0 26.1 ± 0.7 24.3 ± 2.6
Number panicles/hill 17.4 ± 2.8 16.9 ± 1.2 19.3 ± 1.2
Root length (cm) 13 15 16
Grain yield (ton/ha) 4.16 ± 0.68 2.96 ± 1.02 2.64 ± 1.02
Biomass yield
(ton/ha) 12.96 ± 1.81 10.4 ± 0.91 13.36 ± 0.57
Irrigation water (mm) 510.4 447.3 434.6

SYSTEM OF RICE INTENSIFICATION: AN ALTERNATIVE MITIGATION STRATEGY TO GREENHOUSE GAS EMISSIONS FROM PADDY FIELDS IN INDONESIA
47
Fig. 2. Root length of each treatment: a) FL, b) MD and c) DR.
However, the production of more biomass was not linear correlated with grain yield. DR regime, in contrast, produced the lowest grain yield. It was indicated that under limited water more spikelet sterility occurred particularly around flowering time. FL regime produced the highest yield in which the yield was 28.8% and 36.5% higher than that MD and DR regimes, respectively. It was revealed that to obtain optimal grain yield, water stress should be avoided. Optimal water management In total, greenhouse gases, i.e., methane and nitrous oxide were emitted at different levels under three water management regimes (Table 5). FL regime with maintaining higher water level released more methane emission particularly in the early growth stage to mid-season stage. Methane emission released to the atmosphere during flooding condition when soil moisture was in saturated level. Meanwhile, DR regime released the highest nitrous oxide emission when drought condition occurred by maintaining water level at -5 cm below the soil surface starting from 20 days after transplanting. From this results indicated that CH4 and nitrous oxide emission has opposite trend. Therefore, global warming potential (GWP) is used as an indicator to represent total greenhouse gas emission.
Table 5 shows that DR regime has lowest GWP, but it decreased significant rice yield being 36.5% lower than that FL regime as shown in Table 4. Meanwhile, MD regime released greenhouse gas emission 80.1% lower than that FL regime. In addition, it saved more water irrigation being 12.4% lower than FL regime and decreased 28.8% rice yield as well. Therefore, MD regime may be an effective option for water management regime in West Java for mitigating greenhouse gas emission.

SYSTEM OF RICE INTENSIFICATION: AN ALTERNATIVE MITIGATION STRATEGY TO GREENHOUSE GAS EMISSIONS FROM PADDY FIELDS IN INDONESIA
48
Table 5. Total greenhouse gas emissions in each water regime
Water
Management
Greenhouse Gas Emission
CH4
(kg/ha/season)
N2O
(kg/ha/season)
GWP* (kg CO2
-eqv/ha/season)
Flooded (FL) 65.3 3.2 2591.7
Moderate (MD) -16.7 3.1 516.2
Dry (DR) -163.4 4.2 -2821.8
*GWP: Global Warming Potential at the 100-year time horizon of 25 and 298 for CH4 and N2O, respectively (IPCC, 2007)
CONCLUSION The System of Rice Intensification (SRI), is an alternative rice farming to mitigate greenhouse gas emissions from paddy fields. It has six basic elements wherein water management is the key managemen to reduce greenhouse gas emission. By applying intermittent irrigation as water management, the field is conditioned wet (saturated level without flooding) and dry at a particular time and continuous flooding is avoided. According to previous studies, this irrigation regime was effective to minimize global warming potential at different levels up to 46.4% depend on field conditions. For optimum SRI water management, we found that moderate regime was alternative option for mitigating greenhouse gas emission without reducing yield significantly. In this regime, the soil moisture was kept at saturated level from the beginning to generative stage (one week before harvesting) and then it is conditioned dry until harvesting. This regime released greenhouse gas emission 80.1% lower than that continous flooding irrigation. However, the experiment was conducted only in one planting season with specific weather condition. For future works, more experiments should be conducted to find optimal water management under varies weather condition to mitigate greenhouse gas emission without lowering land productivity.
ACKNOWLEDGMENTS
Authors wishing to acknowledge to Ministry of Research, Technology and Higher Education Republic of Indonesia and Kurita – AIT for generous financial support for conducting research related to greenhouse gas emission from paddy fields in Indonesia.

SYSTEM OF RICE INTENSIFICATION: AN ALTERNATIVE MITIGATION STRATEGY TO GREENHOUSE GAS EMISSIONS FROM PADDY FIELDS IN INDONESIA
49
REFERENCES Akiyama, H, K. Yagi, and X.Y. Yan. 2005. Direct N2O emissions from rice
paddy fields: Summary of available data. Global Biogeochem Cy 19 (1). Arif, C., F.M. Ilmi, S.K. Saptomo, B.I Setiawan, and M. Mizoguchi. 2018.
Developing Automatic Water Table Control System for Reducing Greenhouse Gas Emissions from Paddy Fields. IOP Conf. Series: Earth and Environmental Science 147: 012040.
Barison, J., and N. Uphoff. 2011. Rice yield and its relation to root growth and nutrient-use efficiency under SRI and conventional cultivation: an evaluation in Madagascar. Paddy Water Environ 9 (1):65-78.
Bouman, B.A.M. 2001. Water-efficient management strategies in rice production. International Rice Research Note 26.2.
Bouwman, A.F. 1990. Introduction. In: Bouwman AF (ed) Soil and the Greenhouse Effects. John Wiley & Sons, New York, United States.
Cai, Z.C, G.X. Xing, X.Y. Yan, H. Xu, H. Tsuruta, K. Yagi, and K. Minami. 1997. Methane and nitrous oxide emissions from rice paddy fields as affected by nitrogen fertilisers and water management. Plant Soil 196 (1):7-14.
Chapagain, T. and E. Yamaji. 2010. The effects of irrigation method, age of seedling and spacing on crop performance, productivity and water-wise rice production in Japan. Paddy Water Environ 8 (1):81-90.
Cicerone, R.J, C.C. Delwiche, S.C. Typer, and P.R. Zimmermann. 1992. Methane emissions from California rice paddies with varied treatments. Global Biogeochem Cy 6 (3):233-248.
Dill, J., G. Deichert, and L.T.N. Thu. 2013. Promoting the System of Rice Intensification: Lessons Learned from Trà Vinh Province, Viet Nam
Epule, E.T., C. Peng and N.M. Mafany. 2011. Methane Emissions from Paddy Rice Fields: Strategies towards Achieving a Win-Win Sustainability Scenario between Rice Production and Methane Emission Reduction. Journal of Sustainable Development 4 (6): 188-196.
Gani, A., T.S. Kadir, A. Jatiharti, I.P. Wardhana, and I. Las. 2002. The System of Rice Intensification in Indonesia. In: Uphoff N, Fernandes E, Yuan LP, Peng JM, Rafaralahy S, Rabenandrasana J (eds) Assessments of the System of Rice Intensification (SRI), Sanya, China, 1-4 April 2002. Cornell International Institute for Food, Agriculture and Development, Ithaca, NY, pp 58-63.
Gathorne-Hardy, A.D.N. Reddy, M. Venkatanarayana, and B. Harriss-White. 2013. A Life Cycle Assessment (LCA) of greenhouse gas emissions from SRI and flooded rice production in SE India. Taiwan Water Conserv 61: 110–125.
Hadi, A., K. Inubushi, and K. Yagi. 2010. Effect of water management on
SYSTEM OF RICE INTENSIFICATION: AN ALTERNATIVE MITIGATION STRATEGY TO GREENHOUSE GAS EMISSIONS FROM PADDY FIELDS IN INDONESIA
50
greenhouse gas emissions and microbial properties of paddy soils in Japan and Indonesia. Paddy Water Environ 8: 319–324.
Hameed, K.A., A.K.J. Mosa, and F.A. Jaber. 2011. Irrigation water reduction using System of Rice Intensification compared with conventional cultivation methods in Iraq. Paddy Water Environ 9 (1):121-127.
Hidayah, S., D.A. Agustina, M.D. Joubert, and Soekrasno. 2009. Intermittent irrigation in System of Rice intensification potential as an adaptation and mitigation option of negative impacts of rice cultivation in irrigated paddy field. Royal Irrigation Department (Thailand) website.
IPCC. 2007. Climate Change 2007: The Physical Scientific Basis, Contribution of Working Group I to the Fourth Assessment Report of the Intergovernmental Panel on Climate Change; Solomon, S., Qin,D., Manning, M., Chen, Z., Marquis, M., Averyt, K.B., Tignor, M. and Miller, H.L. (Eds.).; Cambridge, UK, Cambridge University Press; 2007.
Las, I., E. Surmaini, and A. Ruskandar. 2008. Antisipasi Perubahan Iklim: Inovasi Teknologi dan Arah Penelitian Padi di Indonesia. Proceeding National Seminar on Rice 2008: Inovasi Teknologi Padi Mengantisipasi Perubahan Iklim Global Mendukung Ketahanan Pangan, BB. Padi.
Lin, X.Q., D.F. Zhu, and X.J. Lin. 2011. Effects of water management and organic fertilization with SRI crop practices on hybrid rice performance and rhizosphere dynamics. Paddy Water Environ 9 (1):33-39.
Mosier, A.R., J.M. Duxbury, J.R. Freney, O. Heinemeyer, and K. Minami. 1996. Nitrous oxide emissions from agricultural fields: Assessment, measurement and mitigation. Plant Soil 181 (1):95-108.
Nemoto, K., S. Morita, and T. Baba. 1995. Shoot and Root Development in Rice Related to the Phyllochron. Crop Sci 35 (1):24-29.
Neue, H.U., P.B. Heidmann, and H.W. Scharpenseel. 1990. Organic matter dynamics, soil properties, and cultural practices in rice lands and their relationship to methane production. In: Bouwman AF (ed) Soil and the Greenhouse Effect. John Wiley & Sons, New York, United States, pp 457-466.
Rajkishore, S.K., P. Doraisamy, and K.S. Subramanian, M. Maheswari. 2013. Methane Emission Patterns and Their Associated Soil Microflora with SRI and Conventional Systems of Rice Cultivation in Tamil Nadu, India. Taiwan Water Conservancy 61(4): 126-134.
Sato, S., E. Yamaji, and T. Kuroda. 2011. Strategies and engineering adaptions to disseminate SRI methods in large-scale irrigation systems in Eastern Indonesia. Paddy Water Environ 9 (1):79-88.
Setyanto, P., A.K. Makarim, A.M. Fagi, R. Wassman, and L.V. Buendia. 2000. Crop management affecting methane emissions from irrigated and rainfed rice in Central Java (Indonesia). Nutr Cycl Agroecosys 58:85-93.
Setyanto, P., and R.A. Bakar. 2005. Methane Emission from Paddy Fields as

SYSTEM OF RICE INTENSIFICATION: AN ALTERNATIVE MITIGATION STRATEGY TO GREENHOUSE GAS EMISSIONS FROM PADDY FIELDS IN INDONESIA
51
Influenced by Different Water Regimes in Central Java. Indonesia Journal of Agricultural Science 6 (1): 1-9.
Sheehy, J.E., S.Peng, A. Dobermann, P.L. Mitchell, A. Ferrer, J.C. Yang, Y.B. Zou, X.H. Zhong, and J.L. Huang. 2004. Fantastic yields in the system of rice intensification: fact or fallacy? Field Crop Res 88 (1):1-8.
Sinclair, T.R. and K.G. Cassman. 2004. Agronomic UFOs. Field Crop Res 88 (1):9-10.
Smith, C.J., M. Brandon, and W.H. Patrick. 1982. Nitrous-Oxide Emission Following Urea-N Fertilization of Wetland Rice. Soil Sci Plant Nutr 28 (2):161-171.
Smith, S.J., and M.L. Wigley. 2000. Global warming potentials: 1. Climatic implications of emissions reductions. Climatic Change 44 (4):445-457.
Stoop, W., N. Uphoff, and A. Kassam. 2002. A review of agricultural research issues raised by the system of rice intensification (SRI) from Madagascar: opportunities for improving farming systems for resource-poor farmers. Agr Syst 71:249-274.
Thomas, V., and A.M. Ramzi. 2011. SRI contributions to rice production dealing with water management constraints in northeastern Afghanistan. Paddy Water Environ 9 (1):101-109.
Tyagi, L., B. Kumari, and S.N. Singh. 2010. Water management - A tool for methane mitigation from irrigated paddy fields. Sci Total Environ 408 (5):1085-1090.
Uphoff, N. and F.B. Dazzo. 2016. Making Rice Production More Environmentally-Friendly. Environments 3: 12.
Uphoff, N., A. Kassam and R. Harwood. 2011. SRI as a methodology for raising crop and water productivity: productive adaptations in rice agronomy and irrigation water management. Paddy Water Environ 9:3-11.
Utaminingsih, W. and S. Hidayah. 2012. Mitigasi Emisi Gas Rumah Kaca Melalui Penerapan Irigasi Intermittent di Lahan Sawah Beririgasi. Jurnal Irigasi 7(2): 132-141.

52

ZERO-WASTE RICE-BASED FARMING SYSTEM FOR SMALL-SCALE FARMERS
53
ZERO-WASTE RICE-BASED FARMING SYSTEM FOR SMALL-SCALE FARMERS
Eduardo Jimmy P. Quilang, Rizal G. Corales, Ronan G. Zagado,
Kristine S. Pascual, Filomena S. Grospe, Evelyn F. Javier, Elmer G. Bautista, and Ricardo F. Orge
Philippine Rice Research Institute, Maligaya, Science City of Muńoz, Nueva Ecija, Philippines
E-mail: [email protected]
ABSTRACT
Small scale farmers in Asia till an average of one-hectare of farm. They are one of the poorest in society economically and physically. The best option to lift them up from poverty is to organize them to become strong and obtain more support from the government and philanthropists to start projects that will empower them. Individually, they need to learn the techniques to intensify, diversify and integrate to make their farm zero-waste and adapt to climate change and mitigate greenhouse gas emission. This paper will describe the different climate smart technologies that they could use in intensification, diversification and integration. These technologies also reduce greenhouse gas emissions compared to conventional farming practices. It is a balanced of natural and modern rice farming practices. The alternate wetting and drying (AWD), rice straw-based nutrient management and azolla production, mushroom growing and vermi composting, capillarigation, rice-duck system, sorjan system, high-yielding varieties, Continuous Rice Hull (CtRH) carbonizer with attachments, Ride-on tillage implement, Wind-pump system, Rice Husk Gasifier for village rice mills are just few of the climate smart and mitigating technologies. For examples the AWD reduces methane by 30-70%, early and compost rice straw incorporation has a lower emission, azolla production as carbon sequestration, mushroom growing and vermi composting aside from additional income of farmers it also helps reduce greenhouse gas emission. High yielding varieties, when cultivated with climate smart technologies or integrated crop management, can reduce methane by 83-93%. Generally, high yielding varieties have lower methane transport capacity (MTC). Capillarigation gives higher water use efficiency compared to conventional drip irrigation. The mitigated methane emission from ride-on tillage

ZERO-WASTE RICE-BASED FARMING SYSTEM FOR SMALL-SCALE FARMERS
54
implement, wind-pump system and rice hull gasifier have 2.3 kg CO2 eq, 0.1 Mg CO2 eq per hectare, and 126 kg CO2 eq per day, respectively. Although, we can mitigate greenhouse gases with the technologies we have introduced to the farmers, they will not have decent lives if they remain economically and physically poor. Thus, to complement these technologies and to help ensure a decent life for the farmers, strong support by the network of government, private sector and the academe is needed to empower them to organize and teach them to do agro-enterprise or farming as a business. Keywords: Intensify, diversify, integrate, organize, technologies,
system
INTRODUCTION
The characterization of small farmers in Asia and the Pacific done by the Food and Agricultural Organization in the United Nations (FAO) found that they till an average land area of one hectare. They are very valuable because they are the largest part of the farming community in developing countries. If water is available, they intensify their farming system as a coping mechanism to optimize their land use to improve their household food security situation or to augment their income from agricultural activities. This special characteristic of agriculture holdings in Asia and the Pacific calls for special attention to be given to the small farmers in policies relating to the management of the food and agriculture sector, particularly those relating to supply of agricultural inputs, technology promotion, marketing linkages and availability and accessibility of credit (23rd Session, Siem Reap, Cambodia, 26-30 April 2010. Characterisation of small farmers in Asia and the Pacific).
In the Philippines for example, a national report shows that poverty incidence remains predominantly agricultural. An average rice farmer earns about $1,000 a year, which is below the poverty threshold. In this situation, being a meager, non-lucrative venture, many rural poor no longer see a future in agriculture and would not like their children to become farmers. The Rural Transformation Movement (RTM) was established to address these pressing issues. RTM is a social mobilization initiative that aims to pool together various experts, organizations, and resources to catalyze rural transformation in rural farming areas with PhilRice as the lead agency. Rural transformation refers to the process of enabling positive and relevant change in farmers’ perceptions, attitudes, practices, and life chances with rice-based agriculture as the driver of inclusive, sustainable growth in rural, farming communities. A campaign to enhance farmers’ and other stakeholders’ mindset towards agro-enterprise was carried out. Some agro enterprises as
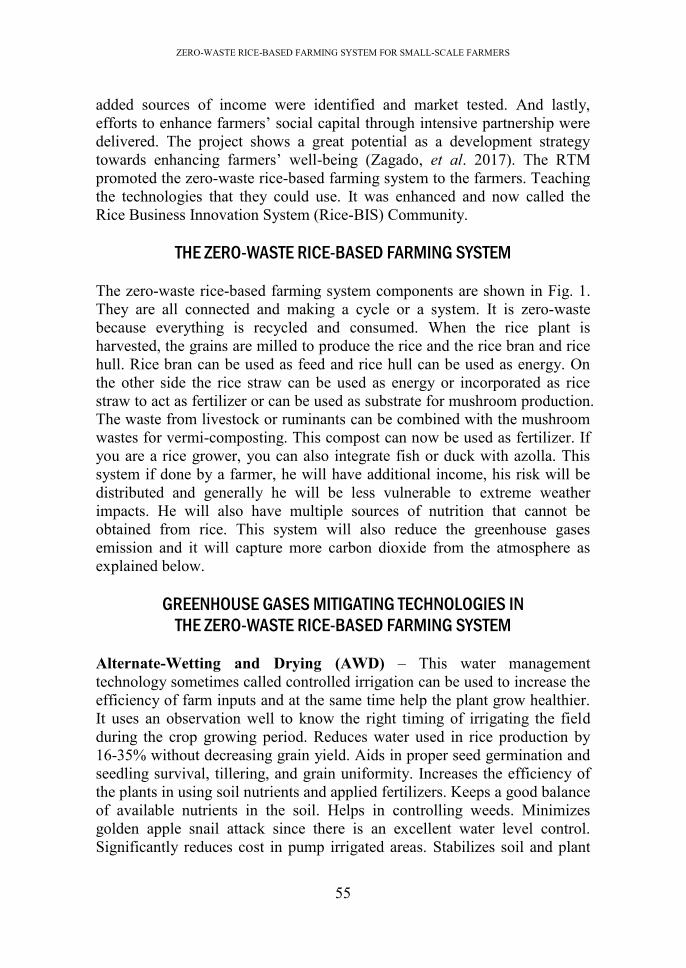
ZERO-WASTE RICE-BASED FARMING SYSTEM FOR SMALL-SCALE FARMERS
55
added sources of income were identified and market tested. And lastly, efforts to enhance farmers’ social capital through intensive partnership were delivered. The project shows a great potential as a development strategy towards enhancing farmers’ well-being (Zagado, et al. 2017). The RTM promoted the zero-waste rice-based farming system to the farmers. Teaching the technologies that they could use. It was enhanced and now called the Rice Business Innovation System (Rice-BIS) Community.
THE ZERO-WASTE RICE-BASED FARMING SYSTEM The zero-waste rice-based farming system components are shown in Fig. 1. They are all connected and making a cycle or a system. It is zero-waste because everything is recycled and consumed. When the rice plant is harvested, the grains are milled to produce the rice and the rice bran and rice hull. Rice bran can be used as feed and rice hull can be used as energy. On the other side the rice straw can be used as energy or incorporated as rice straw to act as fertilizer or can be used as substrate for mushroom production. The waste from livestock or ruminants can be combined with the mushroom wastes for vermi-composting. This compost can now be used as fertilizer. If you are a rice grower, you can also integrate fish or duck with azolla. This system if done by a farmer, he will have additional income, his risk will be distributed and generally he will be less vulnerable to extreme weather impacts. He will also have multiple sources of nutrition that cannot be obtained from rice. This system will also reduce the greenhouse gases emission and it will capture more carbon dioxide from the atmosphere as explained below.
GREENHOUSE GASES MITIGATING TECHNOLOGIES IN
THE ZERO-WASTE RICE-BASED FARMING SYSTEM Alternate-Wetting and Drying (AWD) – This water management technology sometimes called controlled irrigation can be used to increase the efficiency of farm inputs and at the same time help the plant grow healthier. It uses an observation well to know the right timing of irrigating the field during the crop growing period. Reduces water used in rice production by 16-35% without decreasing grain yield. Aids in proper seed germination and seedling survival, tillering, and grain uniformity. Increases the efficiency of the plants in using soil nutrients and applied fertilizers. Keeps a good balance of available nutrients in the soil. Helps in controlling weeds. Minimizes golden apple snail attack since there is an excellent water level control. Significantly reduces cost in pump irrigated areas. Stabilizes soil and plant

ZERO-WASTE RICE-BASED FARMING SYSTEM FOR SMALL-SCALE FARMERS
56
base, hence helps minimize crop lodging. Facilitates farm mechanization especially in the harvesting and hauling of harvests. Reduces farm inputs such as oil, fuel, and labor. Provides for timely water needs of farms at the tail-end of an irrigation system (http://www.pinoyrice.com/keycheck6-water-management/what-is-controlled-irrigation/). Thru this technology, there will be multiple aerations of the paddy fields that eventually reduce methane emission by 30-70% (sander et al., 2012) as shown in Table 1. This technology can be used by a small-scale rice farmer who’s using water pump and also irrigators association for additional irrigated areas. In the Philippines, the AWD became the banner technology in the national dissemination of rice production technologies that are resource use efficient from 2014 to 2017. Results showed that the use of AWD has been very promising in reducing the frequency of pump irrigation from 2-3 times a week to once a week for small-scale farmers with land holding area of one hectare or less (Regalado et. 2017).
Fig. 1. Zero-waste rice-based farming system with its components.

ZERO-WASTE RICE-BASED FARMING SYSTEM FOR SMALL-SCALE FARMERS
57
Rice straw-based nutrient management and azolla production – In the rice-rice cropping system, rice straw is the main farm waste and having high C:N ratio, its reincorporation into the paddy soils increases methane emission (Table 2a). It is advisable to incorporate the rice straw back while the soil is in its dry condition. Otherwise, management of rice straw in the flooded soils should be done earlier or rice straw and stubbles should be decomposed first before it is to be incorporated. The greenhouse gas emission of the different rice straw management and its abatement cost showed that the best rice straw management that had reduced GHG with reasonable counter CO2 cost is the early stubble and rice straw incorporation (Launio, et al., 2016). Table 1. Total seasonal methane (CH4) emission from paddy fields in Nueva
Ecija, Philippines
CF- continuous flooding; AWD- alternate-wetting and drying. DS- dry season; WS- wet season
Table 2a. Methane emission of raw and composted rice straw incorporation
Treatment CH4
(kg CH4 ha-1) Year Source
DS WS
CF 90 - 1998 Corton et al. 2000
AWD 7 -
CF 95 221 2017
Pascual et al. 2017
AWD 48 283
CF 70 329 2014-2016
Sibayan et al. 2018
AWD 42 351

ZERO-WASTE RICE-BASED FARMING SYSTEM FOR SMALL-SCALE FARMERS
58
Table 2b. Azolla production and Nitrogen content
Azolla is a very good alternate organic N topdress for rice. The ability to
fix atmospheric nitrogen at substantially higher rates has led to the exploitation of the organism as bio-fertilizer. Application of Azolla in rice paddy fields has a positive role in improving the soil fertility index. The ability of nitrogen fixation is due to the presence of the symbiotic cyanobacterium Anabaena that occurs in the dorsal leaf cavities of the Azolla fronds (Peters and Meeks, 1989). The total N fixed in Azolla in the field has been estimated to be 1.1 kg N ha-1 day-1 and this fixed nitrogen is sufficient to meet the entire nitrogen requirement of rice crop within a few weeks (Lumpkin and Plucknett, 1980). The rapid and substantially higher rates of nitrogen fixation coupled with production of high biomass (Table 2b) through carbon sequestration by the Azolla have made the organism an outstanding agronomic choice to supply or recycle Nitrogen and carbon dioxide back into the farm (Javier et. al., 2017).
Mushroom growing and vermi composting– Mushroom and vermi composting are directly link because after harvesting the mushroom the substrate can be used immediately for vermi composting. In the Philippines and other countries there is an increasing demand for mushroom. This is because it is an alternative source of healthy nutrients, medical compounds, and dietary supplement. Apart from its health and nutritional benefits, mushroom is a cash crop with immediate economic benefit. Others say, it revives and tightens the connection between nature and people (Rizal G. Corales et. al, Philippine Rice Research Institute 2018). In Vietnam, Social entrepreneur Trang Tran is teaching Vietnamese farmers how to use rice straw as a substrate to grow gourmet mushrooms, helping to reduce

ZERO-WASTE RICE-BASED FARMING SYSTEM FOR SMALL-SCALE FARMERS
59
greenhouse gas emissions and give farmers a new source of income (https://fellowsblog.ted.com/how-we-can-curb-climate-change-by-turning-waste-into-gourmet-mushrooms-e0aa92992089). Capillarigation – Capillarrigation system is an efficient and affordable micro-irrigation system that enhance productivity especially when water is limited. It is patterned from drip irrigation system but uses capillary wicks as media for dispensing water. Fabrication of drippers is easy and can be done by farmers. The cotton yarn was selected as the best wick material with the most uniform wicking flow rate (Orge R. F and Sawey D. A, 2017). The potential to reduce greenhouse gas is reflected indirectly through higher water use efficiency (Table 3). Table 3. Dry Season 2016 test results of capillarigation system for pepper
CtRH carbonizer with attachments – The latest prototype offers potential for use not only in carbonizing rice hull but also other biomass wastes that can be commonly found in the farm. Likewise, the machine’s capability to recover the heat generated during its operation offers a lot of potential benefits in the farm not only in terms of increasing farmers’ income and productivity but also as a climate change adaptation strategy with some mitigation potential (Orge and Abon, 2012). Rice – duck or fish integration – Integrated rice-duck farming system is a cultivation associated with ducks or fish raised simultaneously at the same parcel of land. This system enables the poor farmer to obtain not only rice as main crop but also subsidiary products like ducks meat and eggs or fish. Other benefits reported were reduced cost of weeding, insecticide and chemical fertilizer. The ducks eat weed seeds and insects, thus, keep the paddy field pest free. Likewise, ducks’ or fish feces dropped on paddy soil serve as source of nutrients to rice crops. Thus, it helps reduce production input cost. At PhilRice experiment station, the rice + duck production system (0.15 ha) was planted with Laila which is considered as Special Quality Rice (SQR) variety. Seventy-five (75 heads) 15-day old Mallard ducklings were released in the rice field at 10 DAT. The ducks were given with rice bran-
Irrigation
Method
Cost ($/sq.m)
1$=P50
Emitter
discharge
mL/hr
Yield
(kg/plant)
Water Use
Efficiency (kg/L)
Capillary 0.34 30-40 9.02 36.6
Drip 0.87 1200 10.95 9.9

ZERO-WASTE RICE-BASED FARMING SYSTEM FOR SMALL-SCALE FARMERS
60
kangkong mix as supplemental feeds two times a day, one in the morning and in the afternoon. The ducks were withdrawn from the field at heading stage of the rice crop. The rice yield attained was 750kg equivalent to 5.0t/ha grain yield. The income from the rice production was $375 at $0.50/kg price of SQR. The number of ducks withdrawn from the field was 68 heads with an average weight of 550g/head having a 10% mortality rate. The projected income from the ducks based on pullet price of $3/head was $204. The total gross income that can be generated from the 0.15 ha area was $1158 per year which means that ducks provided an additional income of around $120 /season (Rizal G. Corales et al., 2018). High yielding rice varieties – In literatures, many studies have proven that the higher the yield the lesser is the Methane Transport Capacity (MTC) as shown in Fig. 2. With the new breeds of high-yielding varieties including hybrids we can now promote these varieties to be adopted by farmers. In the Philippines new varieties even the inbred is now comparable to hybrid yields. Coupled with Integrated Crop Management (ICM) best practices from seed selection to nutrient and water management and crop establishment, methane emission can be reduced by 83-93% as shown in Table 4 (Asis C. A. et al., 2014). The promotion of these varieties with ready ICM for farmers adoption has to be further strengthened to help contribute in food security and mitigate climate change.
Fig. 2. Relationship between Grain Yield and Methane Transport Capacity.

ZERO-WASTE RICE-BASED FARMING SYSTEM FOR SMALL-SCALE FARMERS
61
Table 4. Best practices to reduce methane emissions
Sorjan system – Sorjan production system is a common farming system in the flood-prone communities in Java, Indonesia. PhilRice developed and assessed three modified sorjan models to help increase food source, and income of rice farmers in the context of crop diversification, intensification and integration. The sorjan production model 3 is more diversified than the other models. The 1160 square meter area generated an average annual income of $550.61 (Table 5) equivalent to around $45.88 monthly. The advantage of this highly diversified and intensified sorjan model can produce an income almost $4184.19 over the income of rice production alone. Moreover, the intensified and diversified nature of income sources enhances income stability by providing the much needed income to sustain the daily needs including food security. Table 5. Income generated from Sorjan production model 3 from 1160 square
meter
Production
Model
Component
Year 2015 Year 2016 Year 2017 Average
Annual
Income
PhP [$]
Annual
Income
PhP [$]
Annual
Income
PhP [$]
Annual
Income
PhP [$]
Monthly
Income
PhP [$]
Vegetables 10884
[239.19]
14543
[306.22]
16248
[322.36]
13891.67
[290.62]
1157.64
[24.22]
Fish 0 [0] 0 [0] 700
[13.89]
700
[14.64]
58.33
[1.22]
Rice 9280
[203.94]
9860
[207.61]
9396
[186.42]
9512
[199.00]
792.67
[16.58]
Taro 0 [0] 320 [6.74] 4110.6
[81.55]
2215.3
[46.35]
184.61
[3.86]
Total 20,164.00
[443.14]
24,723.00
[520.57]
30,454.60
[604.21]
26,318.97
[550.61]
2,193.25
[45.88] Note: Conversion to USD ($) is based on the average prevailing annual rate.

ZERO-WASTE RICE-BASED FARMING SYSTEM FOR SMALL-SCALE FARMERS
62
Ride-on tillage implement – The ride-on tillage implement can accomplish all major land preparation operations such as plowing, harrowing, and leveling. The newly designed implement is a good alternative for preparing the rice field that could shorten time of preparation because of faster performance than the customarily used attachment. It is good replacement to carabao as a draft animal which commonly emits more GHG emission from its enteric fermentation and its manure. The handtractor was proven to mitigate GHG emission as shown in Fig. 3 if it will replace the carabao in rice production (Bautista EG, et al., 2008). Wind-pump system – The wind-pump system could be used for smaller areas of rice crop. It can also be used for irrigation of high-value crops that does not require total flooding. The system mitigated GHG emission by replacing the fossil fuel with naturally available source of energy (Bautista EG. et. al., 2015). Rice Husk (RH) gasifier for village rice mills – When small scale farmers are organized and formally formed a registered group, they can buy and process their own produced without being dependent to rice traders. In this case, they can put up their own rice processing center and use Up-Draft rice husk gasifier to power their village rice mills. The mitigation effect of the RH gasifier system was related to the electricity required to power its everyday operation and from RH by-product which was disposed and burnt in open field. In Fig. 4, The rice mill factory emitted around 166 kg CO2 eq d
-1 due to its electricity requirement and 125 kg CO2 eq due to RH by-product from everyday operation. However when the RH gasifier system supplied electricity to rice mill, it emitted 88 kg CO2 eq d -1 and 77 kg CO2 eq d -1 for its electricity and RH disposal, respectively. Therefore, using the RH gasifier system could mitigate a total of 126 kg CO2 eq d -1. (Bautista EG. et al., 2014).

ZERO-WASTE RICE-BASED FARMING SYSTEM FOR SMALL-SCALE FARMERS
63
Fig. 3. Emission from handtractor with conventional and ride-on attachment.
Fig. 4. Emission from 8 t h-1 rice milling factory.

ZERO-WASTE RICE-BASED FARMING SYSTEM FOR SMALL-SCALE FARMERS
64
CONCLUSION There are a lot of climate smart technologies already available for farmers. These are efficient and environmentally friendly and require political will to be promoted and adopted by farmers. It can reduce greenhouse gases emissions and at the same time mitigate climate change effect. It will increase productivity and income of the farmers.
A good study is to quantify specifically the greenhouse gas emission of the zero-waste rice- based farming system. We assume that it should be negligible since all the carbon produced is sequestered and put back into the soil.
A model that is in pilot stage in the Philippines to help the small-scale farmers increase their income is the Rice Business Innovation System (RiceBIS) Community. The zero-waste rice-based farming system is being adopted to empower the farmers. In the Philippines it is common that the farmers’ produce is sold to traders and the price is dependent in the hands of the traders. In this case, we need to help the farmers not only in their production concerns but also on how they deal with market and business development service providers. There should be a paradigm shift to the thinking of the farmers that farm is a production unit only. They should think that farming is an Agro-Enterprise or business. They should learn what to sell, how to sell, and whom to sell. Farmers should organize their farming activities and take advantage of business and marketing opportunities. In this scenario of organizing the farmers by themselves, they need enabling support from network of public and private institutions and the academe. As a group they will be stronger, more efficient and precise in farming that leads to mitigation of GHGs, more bargaining power, and at the end because of increase income they could easily adapt to climate change and become resilient and sustainable.

ZERO-WASTE RICE-BASED FARMING SYSTEM FOR SMALL-SCALE FARMERS
65
REFERENCES Asis, C.A., E.J.P. Quilang, F.S. Grospe, and R.F. Orge. 2014. Reducing
Methane Emissions from Irrigated Rice Fields. Rice Technology Bulletin Philippine Rice Research Institute.
Bautista, E.G., M. Saito, and M.J.C. Regalado. 2014. Performance of an up-draft rice husk gasifier system for powering village rice mills in the Philippines. Journal of Food Agriculture and Environment. Volume 12 (2): 831-835.
Bautista, E.G., N.T. Nghi, M. Saito, and M.J.C. Regalado. 2015. Potential evaluation of a locally-designed wind-pump system for water pumping to irrigate rice crop based on a ten-year weather data in the Philippines. Journal of Integrated Field Science Vol. 12: 9-17.
Bautista, E.G. and P.M. Bato. 2008. Technical and socioeconomic evaluation of the ride-on tillage implement for the hand tractor. Philippine Agriculture Scientist Journal 2008 Vol. 91 No. 2 195-205 p.
Launio, C.C., C.A. Asis, R.G. Manalili, and E.F. Javier. 2016. Cost-effectiveness analyses of farmer’s rice straw management practices considering CH4 and N2O emissions. Journal of Environmental Management Vol. 183:245-252. Elsevier Ltd.
Corton, T.M., J.B. Bajita, F.S. Grospe, R.R. Pamplona, C.A. Asis Jr, R. Wassmann, R.S. Lantin, and L.V. Buendia. 2000: Methane emissions from irrigated and intensively managed rice fields in Central Luzon (Philippines). Nutr. Cycl. Agroecosyst., 58, 37-53. Doi:10.1023/A:1009826131741
Corales, R.G., et al., 2018. Palayamanan Plus. Terminal Report. Philippine Rice Research Institute.
Corale, A.M. RiceBIS briefer powerpoint. Javier, E.F., A.J. Espiritu, J.M. Mercado, and X.X.G. Sto Domingo. 2017.
Technology demonstration on organic-based rice producton and Azolla production. (unpublished terminal report). PhilRice. Science City of Muñoz, Nueva Ecija.
Food and Agriculture Organization of the United Nations. Asia and Pacific Commission on Agricultural Statistics. 23 rd Session, Siem Reap, Cambodia, 26-30 April 2010. Characterisation of small farmers in Asia and the Pacific.
Peters, G.A. and J.C. Meeks. 1989. The Azolla-Anabaena symbiosis: basic biology. Ann Rev Plant Physiol Plant MolBiol 40 193-210
http://www.pinoyrice.com/keycheck6-water-management/what-is-controlled-irrigation/

ZERO-WASTE RICE-BASED FARMING SYSTEM FOR SMALL-SCALE FARMERS
66
https://fellowsblog.ted.com/how-we-can-curb-climate-change-by-turning-waste-into-gourmet-mushrooms-e0aa92992089
Pascual, K.S., A.T. Remocal, F.S. Grospe, E.B. Sibayan, and R. Orge. 2017. Evaluation of soil productivity, agronomic performance and greenhouse gas emissions of combined effects of biochar and AWD on rice production. Philippine Rice Research Institute. Munoz, Nueva Ecija. Manuscript in preparation.
Rizal, G. Corales, Julius T. Sajor, Aurora M. Corales, Jesus M. Rivera, and Aiko F. Catalon. 2018. Rice-based mushroom production manual. Philippine Rice Research Institute. Pp 1-2.
Ricardo, F. Orge and John Eric O. Abon. 2012. Design Improvement of the PhilRice Continuous-Type Rice Hull Carbonizer for BioChar production Towards Sustainable Agriculture.
Ricardo, F. Orge and Derose A. Sawey. 2017. Coping with water scarcity in rice-based farms: Development of Capillary Irrigation System for Small Holder Farmers in the Philippines. Agricultural Research Updates Vol 16. Nova Science Publishers Inc. Pp 191-206.
Regalado, M.J.C.R., E.B. Sibaya, L.M. Juliano, P.S. Ramos, E.C. Martin, and K.S. Pascual et al. 2017 Accelerating the Development and Dissemination of Associated Technologies on Rice Production That Are Resource Use Efficient. Philippine Rice Research Institute. Munoz, Nueva Ecija. Terminal Report.
Sander, B.O., C.A. Asis, and R. Wassmann. 2012. Greenhouse gas emissions from farmers’ rice fields in the Philippines: ‘reality check’ for water management as mitigation option. Poster presented at the International Symposium on Managing Soils for Food Security and Climate Change Adaptation and Mitigation, Vienna, Austria, 23–27 July.
Sibayan, E.B., K. Samoy-Pascual, F.S. Grospe, M.E.D. Casil, T. Tokida, A.T. Padre, and K. Minamikawa. 2018. Effects of alternate wetting and drying technique on greenhouse gas emissions from irrigated rice paddy in Central. Luzon, Philippines. Soil Science and Plant Nutrition 64: 39-46 https//doi.org/10.1080/00380768.2017.1401906.
Lumpkin, T.A. and D.L. Plucknett. 1980. Azolla: Botany, Physiology and use as a green manure Econ Bot 34 111- 153.
Zagado et al. 2017. PalaYamaNayon: The Rural Transformation Movement. Terminal Report, PhilRice pp1-2.

MANURE MANAGEMENT FOR GREENHOUSE GAS MITIGATION IN JAPAN
67
MANURE MANAGEMENT FOR GREENHOUSE GAS MITIGATION IN JAPAN
Takashi Osada1, Yasuyuki Fukumoto1,
Takahiro Yamashita1, and Akifumi Ogino2
1Institute of Livestock and Grassland Science, National Agriculture and Food Research Organization (NARO),
Tsukuba, Japan 2 Headquarters, NARO, Japan
E-mail: [email protected]
ABSTRACT
Considering the difficulty of mitigating environmental damage caused by climate change, all industries including agriculture should attempt to reduce greenhouse gas (GHG) emissions. Agricultural nutrients can enter other ecosystems via leaching, volatilization, and the waste streams of livestock and humans. The animal sector generates a huge amount of organic matter and nitrogen during feed production, feeding, and manure treatment. Methane is produced when organic materials with high moisture content decompose under anaerobic conditions during manure storage. Nitrous oxide is generated on farms as an intermediate product of nitrification and denitrification by microorganisms present in manure or wastewater and in soils, particularly following compost application. With the growing worldwide demand for animal products such as meat, eggs, and dairy, it is imperative that the animal industry develops methods to mitigate GHG emissions.Till date, the inventory data regarding different GHGs under various conditions from agricultural sector are unclear. To obtain the data required, we developed a system for the direct quantitative measurement of emissions from manure management facilities using a large dynamic chamber. The emission factor of each manure treatment system needs to be evaluated under the procedure and general conditions pertaining to each country because these factors may widely vary. Composting is the principal method for treating the solid fraction of swine manure in Japan. On the contrary, a wastewater purification system is necessary for continuous livestock production in urban farming, particularly for swine breeding. To achieve these ends, we have developed a number of mitigation measures. The cost-effectiveness of mitigation measures developed to regulate on-farm

MANURE MANAGEMENT FOR GREENHOUSE GAS MITIGATION IN JAPAN
68
GHG emissions needs to be evaluated. In present study that began this fiscal year, the economical introduction strategies of GHG regulation measures for domestic farming will be considered based on the Life-Cycle Assessment. Keywords: Manure management, livestock waste, compost,
wastewater treatment, low protein diet
INTRODUCTION
Livestock production systems are the leading sources of gaseous pollutants, including ammonia, methane, and nitrous oxide, which increase soil acidification and global warming. The recent annual report of the Food and Agriculture Organization (FAO, 2009) stated that animal industries contribute to 9% of anthropogenic CO2 emissions, 37% of CH4, and 65% of N2O; when expressed as CO2-equivalents, these components account for approximately 18% of anthropogenic greenhouse gas (GHG) emissions. Due to their effects on GHGs, animal production systems have been implicated in various local and global environmental problems. To ameliorate the adverse effects of these systems, the mitigation of these emissions should be prioritized, considering that animal production will continue to increase as the world population increases. Meanwhile, options for modifying current livestock-management methods without reducing productivity should be explored, developed, and implemented. For example, supplementing low-protein swine diets with amino acids can reduce nitrogen excretion by approximately 20% (Aarnink and Verstegen, 2007). However, the effects of supplemental low-protein diets on NH3, N2O, and CH4 emissions remain unclear.
In FY2016, the total national GHG emissions reached 1307 Tg (National Greenhouse Gas Inventory Report of Japan, 2018), making Japan the fifth highest emitter of GHGs worldwide. This proportion of GHGs accounts for approximately 4.5% of the total global emission and represents an increase of 2.7% over the emission in 1990 (base year) under the Kyoto Protocol. Japan has set interim GHG reduction targets of 26% reduction below the emission levels recorded in 2013 by 2030 and 80% reduction below those recored in 1990 by 2050. In addition, the Japanese Cabinet submitted the Bill of Basic Law on Climate Change to the National Diet on 12 March 2010. Thus, there is an urgent need to incorporate GHG reduction measures in every category, including the agricultural industry.
CH4 and N2O generated from agricultural sector in Japan account for approximately 2% of the total national GHG emission. CH4 emission due to enteric fermentation by livestock and GHG generated by the treatment of manure are the primary sources of GHGs from animal production in Japan.

MANURE MANAGEMENT FOR GREENHOUSE GAS MITIGATION IN JAPAN
69
CH4 and N2O from manure management accounted for 6.8 % and 11.8%, respectively, of the total domestic GHG emissions from agriculture, and together they accounted for approximately 0.6% of the annual national GHG emission. Therefore, the reduction of CH4 and N2O emissions using improved methods of manure treatment can potentially reduce overall GHG emissions from the agricultural sector in Japan.
MEASUREMENT SYSTEMS FOR GHG EMISSION FROM
ON-FARM MANURE MANAGEMENT FACILITY
Framework of evaluation from manure management There is still a lack of certainty concerning GHG emission data from different parts of the agricultural sector in Japan, and gas emission data from different livestock sources under various conditions need to be obtained. To this end, we developed a system for the quantitative measurement of emissions from manure management systems using a large dynamic chamber in an experimental study. With a small-scale apparatus, it was difficult to interpret the various changes in the gas emission rate in terms of actual on-farm manure management. In this report, we will introduce our initial measurement system to evaluate the emission materials produced by composting using a large chamber and describe some of the results using this system (Osada et al. 2001, Fukumoto et al. 2003). According to the results of this study, the emission factors of CH4 and N2O from composted manure varied significantly between livestock types, the moisture contents of the pile materials and ambient temperature (Tamura & Osada 2006, Shiraishi et al. 2006, Minato et al. 2013, Ohkubo et al. 2016).
Emission factors also vary depending on the manure treatment type. This is important information not only for inventory data but for the development of greenhouse gas regulations and technologies. In Asian countries, composting is widely used for the treatment of livestock waste. However, the exact amount of greenhouse gases generated from actual composting is not known. Not only the compost, but the emission factor of each treatment system should be evaluated under the procedure and general conditions used by each country, because these factors might also vary widely. It is important that each country has the measurement technique of GHG emission, not only for inventory data but for the development of greenhouse gas regulations and technologies (Maeda et al. 2010a,b,2013, Ohkubo et al. 2016).

MANURE MANAGEMENT FOR GREENHOUSE GAS MITIGATION IN JAPAN
70
Measurement system for compost (static pile) In Japan, the composting process plays a central role in livestock waste treatment. Since much of the livestock waste is processed, greenhouse gas (GHG) generation is also recognized to be substantial. However, few experiments have been undertaken in Japan to quantify the amount of each GHG generated from the pile-type composting process, which is the most-representative composting system used in Japan. Various types of livestock waste were piled together with a moisture conditioner to form significant masses (around 300–1230 kg), and their respective CH4 and N2O emissions were determined during both the high-temperature and low-temperature seasons. The measurement system we devised consisted of a cylindrical chamber (3 m in diameter, 2.2 m in height, 13 m3). Samples of inlet air (fresh air) were extracted from a height of 30 cm beside the chamber, and outlet air (exhaust air) was extracted just before entering the ventilation blower (Fig. 1). Gases at each sampling point were automatically carried to the analysis apparatus through a Teflon tube (4 mm diameter). CH4 and N2O concentrations in the exhaust air from the chamber were measured using an infrared photoacoustic detector (Innova trace gas monitor, type 1312, and multipoint sampler, type 1309; Lumasense Technol. Inc., Ballerup, Denmark) at 5 min intervals. Gas was dried by an electric cooler to improve the accuracy of the measurement values for methane and nitrous oxide. Air flow rate analyses were conducted weekly using an inclined manometer (Okano Factory) in the exhaust pipe according to the method of JIS B8330. Using the procedure described above, the air in the chamber was interchanged 10.2 times per hour and was highly stable (Fig. 1). The composting-manure emission factors of CH4 (g per one-kilogram organic matter) and N2O (g per one-kilogram nitrogen in composting material) varied significantly between livestock types. This should be important information not only for inventory data but also for the development of CHG regulations and technologies (Osada et al. 2001, Fukumoto et al. 2003). Measurement system for slurry storage Gas emissions from stored slurry generated by dairy cattle were the subject of this study. For this purpose, we developed a system for measuring the gases emitted from the surface of a slurry storage tank. We developed a system for measuring emissions from stored slurry by using a floating dynamic chamber. CH4, CO2, N2O and NH3 emitted from the storage tank of a dairy cattle farm in eastern Hokkaido were measured (Fig. 2).
Depending on the season, the temperature of the stored slurry varied from 15 to 22°C. CH4 emission was 34–55 g/m2/day, N2O emission ranged

MANURE MANAGEMENT FOR GREENHOUSE GAS MITIGATION IN JAPAN
71
from trace to 67 mg/m2/day, and NH3 emission was 0.5–0.7 g/m2/day (Fig. 2). CH4, CO2 and NH3 were probably generated during the winter as well, but, because the surface of the stored slurry was frozen, we were unable to obtain these measurements. N2O emission from stored slurry was negligible in winter. All of the measured gas emissions showed seasonal variation and varied widely over the short term. Daily CH4 emission (g/day) was strongly affected by the volume of slurry stored, the maximum daily ambient temperature, and the slurry temperature. N2O and NH3 emissions were influenced heavily by atmospheric humidity and solar radiation, respectively. To accurately calculate the gas generated annually from a specific slurry storage tank, measurements should be obtained continuously over a 24-h period for several days over at least two seasons (Minato et al. 2013). Measurement system for wastewater treatment (aerobic treatment, purification) The activated sludge process to remove nitrogen and reduce biochemical oxygen demand is reportedly cost-effective for swine wastewater treatment, and its use has thus increased in pig farming. N2O is generated on farms as an intermediate product during nitrification and denitrification, while methane (CH4) is also generated from organic matter degradation under anaerobic conditions by microorganisms in manure or wastewater. For the quantitative measurement of GHG emission from each tank at the wastewater treatment facilities in Chiba prefecture, the tank was sealed or covered with a small ventilation chamber, and fresh air (inlet air) and exhaust air (outlet air; head space of each tank) were collected through Teflon tubes. Fig. 3 provides a photograph and a schematic figure of the measuring chamber used in Chiba prefecture. CH4, N2O, and NH3 were continuously measured by a multi-gas monitor (INNOVA 1412; LumaSense Technologies, Santa Clara, CA, USA). The results of the total measurement period showed that the CH4 and N2O emission factors were 0.91% (kg CH4 /kg volatile solids) and 2.87% (kg N2O-N/ kg total N), respectively. The values were similar to those from a report from a 16-month-long nitrous oxide emission monitoring campaign at a full-scale municipal wastewater treatment in the Netherlands (Dealman et al. 2015). In contrast, the CH4 emission factor calculated in the present study was rather high compared to prior laboratory measurements. We need to pay more attention to the measuring systems for both the ventilation and gas concentrations at full-scale wastewater purification facilities. The measurement strategies also need improvement to provide more environmentally sound measurements (Osada et al. 2017).

MANURE MANAGEMENT FOR GREENHOUSE GAS MITIGATION IN JAPAN
72
Fig. 1. System for measuring greenhouse gases from composting.
Fig. 2. System for measuring greenhouse gases from slurry storage.

MANURE MANAGEMENT FOR GREENHOUSE GAS MITIGATION IN JAPAN
73
Fig. 3. System for measuring greenhouse gases from wastewater treatment
plants.
MITIGATION OF GHG EMISSION FROM COMPOSTING SYSTEM
Trends of Japanese livestock industry and related environmental laws The livestock industry in Japan has grown dramatically during the few decades since World War II, due to changes in dietary habit, with increased demand for livestock products. At present, the livestock industry has become the fundamental sector of Japanese agriculture, representing 34.4% (3,162,600 million yen) of the value of Japanese total agricultural output (FY 2016). In the Japanese livestock industry, the numbers of livestock animals are almost unchanged from year-to-year, despite the fact that the numbers of livestock farms decrease every year, resulting in a considerable increase in the number of animals on each livestock farm. For example, the average numbers of pig per farm in 1980 was 71, increasing to 2,056 in 2018 (29 times larger than that in 1980), while the numbers of pig farm decreased from 141,300 (1980) to 4,470 (2018). Intensive livestock production has caused the concentration of huge amounts of livestock waste in a limited area. The amounts of annual livestock excretion in 2018 are estimated to be approximately 79,000 thousand tons, which represents approximately one quarter of the total organic waste in Japan. Unsuitable handling or treatment of livestock waste could become the cause of serious environmental problems such as offensive odor generation and water pollution. In Japan, there are several environmental laws concerning livestock waste management such as Waste Management and Public Cleansing Law (enacted in 1970), Water Pollution Control Law (1970), Offensive Odor Control Law (OOCL,1971) and Law Concerning Special Measures for Conservation of Lake Water Quality (1984). Moreover, in 1999, the Law on the Appropriate

MANURE MANAGEMENT FOR GREENHOUSE GAS MITIGATION IN JAPAN
74
Treatment and Promotion of Utilization of Livestock Manure was enacted to encourage the recycling of livestock waste. GHG generation in the composting treatment Composting is the optimal treatment method for organic waste, and is recommended for the recycling of livestock waste. Livestock waste can be changed to a uniform organic fertilizer by composting treatment. However, composting of livestock waste is also one of the sources of anthropogenic GHG emissions. Livestock waste consists of urine, feces and other materials such as sawdust for bedding material, and its moisture content is usually too high to achieve good composting. Before the start of composting, it is important to control the moisture content of livestock waste by mixing it with a bulking agent to increase aerobic microbiological degradation. However, in practice, controlling the moisture content of livestock waste to a suitable level is often difficult because of the shortage of bulking agent, which will lead to unsuitable compost fermentation, meaning that the proportion of anaerobic decomposition of the organic matter increases. Therefore, gaseous components generated under anaerobic condition are increased, particularly CH4. The greater the anaerobic proportion inside the compost pile, the greater the CH4 emissions (Fukumoto et al., 2003). Therefore, suitable composting treatment needs to be effective for reducing GHG emissions. The pathway of generation of CH4 is simple, so that decreasing the anaerobic portion of composting material is an effective mitigation measure for CH4 emission. On the other hand, nitrous oxide (N2O) is a GHG with a high global warming potential which cannot be mitigated only by using suitable composting treatment, because N2O is generated via both aerobic (nitrification) and anaerobic (denitrification) conditions. Conditions of both reduction and oxidation co-exist in the composting pile. Therefore, it is difficult to reduce N2O emission by controlling the conditions of the composting process. Generation of N2O Autotrophic nitrifying bacteria consist of ammonia-oxidizing bacteria (AOB), ammonia-oxidizing archaea and nitrite-oxidizing bacteria (NOB). In the nitrification process, ammonia is oxidized into nitrite by ammonia-oxidizing microbes, and NOB subsequently oxidize nitrite into nitrate. It is believed that N2O is generated as a by-product during the oxidization process from ammonia to nitrite. On the other hand, denitrifying microbes reduce nitrate to produce nitrogen gas (N2) via a series of intermediate nitrogen oxide products including N2O. As another pathway of N2O generation, there is

MANURE MANAGEMENT FOR GREENHOUSE GAS MITIGATION IN JAPAN
75
nitrifier denitrification in which AOB reduces nitrite to N2 via N2O under certain circumstance of high N content, low organic C content, low O2 pressure and low pH (Wrage et al., 2001).
In the composting process, nitrification is a prerequisite for N2O generation because little nitrate nitrogen is contained in the fresh manure immediately after excretion. Usually, nitrifying bacterium grow in the stored livestock waste before the composting. However, because autotrophic nitrifying bacteria are mesophilic bacteria, the numbers of nitrifying bacteria would decline during the thermophilic phase of composting fermentation. After the thermophilic phase of composting had finished, nitrifying bacteria begin to multiply again. However, there are cases where the regrowth of NOB is delayed behind that of AOB in the composting process. In that case, the oxidation of nitrite into nitrate is inhibited, leading to the accumulation of nitrite in the composting material. Moreover, this phenomenon has important consequences because the nitrite accumulation enhances N2O emission (He et al., 2001). In our studies, the nitrite accumulation during composting were often observed in swine-manure composting. The cause of nitrite accumulation was the delayed growth of NOB compared with AOB growth. Moreover, during the duration of nitrite accumulation, N2O continued to be emitted. Therefore, it was considered that, to shorten the duration of nitrite accumulation would be effective in controlling N2O emission. So, we attempted to shorten the nitrite accumulating period by a rapid recovery of complete nitrification in the swine-manure composting. Effect of NOB addition on N2O emission To reduce N2O emission caused by nitrite accumulation, the effect of the addition of a source of NOB during the swine-manure composting was examined in laboratory-scale composting experiments (Fukumoto et al., 2006). As the NOB source, mature swine compost was chosen. Usually, well matured compost contains nitrifying bacterium to some extent, and it already existed on the livestock farm. The mature swine compost used in the experiment contained both AOB and NOB at high cell densities (105 to 106 cells per g compost). The material temperature rose to a high level during the first few weeks, sometimes exceeding 60ºC. During this period, large amounts of ammonia were emitted while N2O emission was scarcely observed. The numbers of nitrifying bacteria in the composting material fell below the detection limit of incubation analyses, and most of the inorganic nitrogen compounds were occupied by ammonium in this period. Because NOB cannot survive at high temperatures, the timing of NOB addition was set at when the thermophilic phase of composting had finished.
After the thermophilic phase of composting had finished, mature swine

MANURE MANAGEMENT FOR GREENHOUSE GAS MITIGATION IN JAPAN
76
compost containing NOB was mixed with the composting material. In the control (where there was no addition of mature swine compost), AOB started to grow initially. However, the growth of NOB was delayed, which resulted in prolonged nitrite accumulation and N2O emission. On the other hand, the accumulation of nitrite was resolved relatively rapidly by the addition of NOB. As a result, the duration of N2O emission was shortened. In the laboratory-scale composting experiments, the amount of N2O emission decreased by 60% on average following addition of NOB during the swine-manure composting (Fig. 1). Moreover, in the later study, it was confirmed that NOB addition could also reduce nitric oxide (NO) emission (Fukumoto et al., 2011). Therefore, it is thought that the plural environmental harmful gases emission would be mitigated by resolution of nitrite accumulation in the composting process.
Issues for practical use The effect of NOB addition in decreasing N2O emission was confirmed in the laboratory-scale composting experiments. Oukubo et al. (2016) examined its effect in the pilot-scale swine-manure composting. However, a negative effect, in that that the amount of N2O was increased by addition of the NOB source, was observed in their experiment. They discussed that the cause of higher N2O emission seemed to be due to an increase in the amount of N2O generated in the denitrification process. This method can decrease N2O emission induced by nitrite accumulation. However, this method cannot decrease N2O emission via the denitrification process. To make it a usable practical method, it is important to minimize the N2O generated from denitrification in the composting process, for which it is considered that a suitable composting treatment will be effective.
Recently, complete oxidation of ammonia to nitrate in one organism (complete ammonia oxidation: comammox) has drawn attention as a completely new route of nitrification. It has been revealed that Nitrospira species, which have been known to be NOB, have the all the enzymes necessary for complete nitrification (van Kessel et al., 2015). As shown above, nitrite accumulation is an important cause of N2O emission in the composting process. Therefore, if comammox could be applied to composting, it could be a decisive way to control N2O emission, but further study is needed to confirm this model.

MANURE MANAGEMENT FOR GREENHOUSE GAS MITIGATION IN JAPAN
77
Fig. 4. Effect of NOB addition on N2O emission in laboratory-scale
swine-manure composting experiments. Error bars indicate standard
deviation.
MITIGATION OF GHG EMISSION FROM
WASTEWATER TREATMENT SYSTEM Greenhouse gases such as CO2, CH4 and N2O are emitted from wastewater treatment plants. N2O, in particular, is a potent greenhouse gas, accounting for 7.9% of global anthropogenic greenhouse gas emissions in 2004, and having a global warming potential approximately 300-fold stronger than that of carbon dioxide (Intergovernmental Panel on Climate Change 2007). Kampschreur et al. (2009) reported that N2O was emitted from various types of wastewater treatment. Online measurements suggest that N2O emission is responsible for 0.01–90% of the total nitrogen load of influent. N2O is produced during biological nitrogen conversions in wastewater treatment plants. Most soluble nitrogen in wastewater exists as ammonium ions (NH4
+). Under aerobic conditions, NH4+ is oxidized by autotrophic
nitrifying bacteria into nitrite ions (NO2–) and nitrate ions (NO3
−) by a reaction called nitrification. Nitrification is generally carried out by two groups of microorganisms, namely, NH3-oxidizers that oxidize NH4
+ to NO2−,
and NO2−-oxidizers that oxidize NO2
− to NO3−. Although NO2
− and NO3− are
the main end products of nitrification, nitrifier denitrification (a pathway of nitrification) contributes to the production of N2O by autotrophic NH3-oxidizers (Wrage et al., 2001). Subsequent to nitrification, under anoxic

MANURE MANAGEMENT FOR GREENHOUSE GAS MITIGATION IN JAPAN
78
conditions, NO2− and NO3
− are reduced to N2 gas by heterotrophic or autotrophic denitrifying bacteria. This reaction is called denitrification. During denitrification, unlike nitrification, N2O is a regular intermediate. If denitrification occurs completely, N2O becomes N2 gas and the release of N2 gas to the atmosphere removes nitrogen from the reaction tank. Because N2 gas is not a GHG, converting these ions into N2 gas is important. An overview of reactions in which nitrification and denitrification is shown in Fig. 1. The overlapping boxes symbolize the possibility of a coupling between nitrification and denitrification. As nitrifier denitrification is a pathway of nitrification, the boxes for nitrification and nitrifier denitrification overlap, but separate into the different branches from nitrite (Wrage et al., 2001). Ritchie and Nicholas (1972) reported that AOB produce N2O through the reduction of NO2
− with NH2OH as an electron donor under aerobic as well as anaerobic conditions. Poth and Focht (1985) reported that N2O production by AOB through nitrifier denitrification occurs only under conditions of oxygen stress. In the pathway of nitrifier denitrification, NO2
− is reduced and NO3
− is not formed.
Fig. 5. Transformations of mineralized nitrogen (Wrage et al., 2001).
To develop treatment methods that reduce the amount of N2O generated in the process of converting NH4+ within wastewater into N2 gas, we focused on and examined the biofilm method. The microbial reactions in this method differ from those of the conventional wastewater purification treatment methods or the activated sludge (AS) method. A biofilm method uses carriers (materials that hold the microorganisms) to purify wastewater. In previous research, N removal from dairy farm wastewater treatment in an aerobic bioreactor packed with a perlite carrier, reported the efficient removal of N (Yamashita et al. 2011). The application of this perlite carrier method to

MANURE MANAGEMENT FOR GREENHOUSE GAS MITIGATION IN JAPAN
79
swine wastewater treatment was expected to yield similar results. However, NO3
- and NO2- were not efficiently denitrified, but instead both accumulated.
This result would have been because bacteria of the aerobic denitrifying genus Thauera were present in the dairy farm wastewater and accumulated on the perlite carrier; in contrast, Thauera spp. was scarcely present in the swine wastewater and did not accumulate, thus leading to the absence of adequate denitrification. For this reason, if N is to be removed from swine wastewater by using a single-tank reactor, fixed-bed-type carriers should be used because they enable more efficient denitrification than do fluidized-bed-type perlite carriers because of the more efficient anaerobic growth within the tank of the former. We employed carbon fibers (CF) as carriers, because CF adhere strongly to microorganisms and are expected to hold them for longer and at higher concentrations than can be achieved with the AS method. Mitigation of nitrous oxide (N2O) emission from swine wastewater treatment was demonstrated in an aerobic bioreactor packed with CF reactor (Yamashita et al. 2015, 2016). The CF reactor had a demonstrated advantage in mitigating N2O emission and avoiding NOx (NO3
- + NO2-)
accumulation. The N2O emission factor was 0.0003 g N2O-N/g TN-load in the CF bioreactor compared to 0.03 g N2O-N/g TN-load in the AS reactor. N2O and CH4 emissions from the CF reactor were 42 g-CO2 equivalents/m3/day, while those from the AS reactor were 725 g-CO2 equivalents/m3/day (Fig. 6). The dissolved inorganic nitrogen (DIN) in the CF reactor removed an average of 156 mg/L of the NH4-N, and accumulated an average of 14 mg/L of the NO3-N. In contrast, the DIN in the AS reactor removed an average 144 mg/L of the NH4-N and accumulated an average 183 mg/L of the NO3-N. NO2-N was almost undetectable in both reactors (Fig.6). In the CF carrier experiment, a huge amount of biofilm was formed (29.0 mg dry-weight sludge/mg CF); this was equivalent to biofilms of ~50 g/10 L within the tank. In addition, there may have been AS as well as biofilms adhering to the CF within the tank, indicating that reasonable amounts of microorganisms were present and involved in purification. The CF method can be introduced by loading CF carriers into existing AS treatment equipment. No special equipment needs to be installed, and this reduces the initial investment required. The CF method is therefore likely to be adopted for use on livestock farms.

MANURE MANAGEMENT FOR GREENHOUSE GAS MITIGATION IN JAPAN
80
Fig. 6. Gas emissions and water quality in the activated sludge and carbon
fiber bioreactors. (a) Amount of greenhouse gas generated from the
bioreactors. (b) Water quality in the bioreactors.
POTENTIAL REDUCTION OF GHG EMISSIONS FROM MANURE
MANAGEMENT BY USING A LOW-PROTEIN DIET SUPPLEMENTED WITH
SYNTHETIC AMINO ACIDS One possible measure to achieve reduction of GHG emissions from livestock production is by reducing the excretion by livestock of nitrogen, which is a source of N2O emissions in manure management. Many studies of the feeding of a low-protein diet supplemented with crystalline amino acids (AA) to fattening pigs have been conducted and have reported a reduction in nitrogen excretion without sacrificing productivity (e.g. Otto et al. 2003b; Rotz 2004). Furthermore, the reduction of N2O emissions from manure has recently been reported to be achieved by the low-protein diet technique (Osada et al. 2011). However, the use of a low-protein diet with AA involves additional GHG emissions resulting from AA manufacturing. The environmental impacts were therefore compared using the LCA method between two pig farming systems, one using conventional diets (CNV) and the other using the low-protein diets with AA (LOW). This section is based on Ogino et al. (2013), from whence further information can be obtained. Materials and Methods The first step of LCA is the definition of the functional unit (FU), the system boundaries and so on. The FU was defined as one marketed pig. For the comparative LCA of manure management, the CH4 and N2O emissions from the manure management of CNV were set as a baseline, and the system boundary of LOW included the CH4 and N2O emissions resulting from manure management and of changes in the GHG emissions from the
0
100
200
300
400
処理前 活性汚泥法 炭素繊維法
Solu
ble
nit
roge
n(m
g/L
)
NO3-N
NO2-N
NH4-N
NO3-N
NO2-N
NH4-N
0
200
400
600
800
1000
1200A
mo
un
t o
f gr
ee
nh
ou
se g
as g
en
era
ted
(g-
CO
2e
q/m
3 /d
ay)
N2O
CH4
活性汚泥法 炭素繊維法
N2O
CH4
Activated sludge method
Carbon fiber method
InfluentActivated
sludge method
Carbon fiber
method
(a) (b)

MANURE MANAGEMENT FOR GREENHOUSE GAS MITIGATION IN JAPAN
81
processes of feed production including AA manufacturing and feed transport and the materials and energy consumed in the manure management process. For the cradle-to-farm gate LCA of pig farming, the evaluated system included the processes of feed production including AA manufacturing for LOW, feed transport, animal housing including the biological activity of the animal, and manure management. The diets for the growing stage (from 30 to 70 kg of liveweight) were designed based on Osada et al. (2011) while those for the fattening stage (from 70 to 115 kg of liveweight) were based on Kaji et al. (1997). The crude protein (CP) contents of LOW and CNV were 14.5% and 17.1% for the former study, respectively, and 10.8% and 14.0% for the latter study, respectively. The second step of LCA is life-cycle inventory. The emission factors associated with pig farming considered in the analysis were collected from literature, LCA database, and so on. The emission factors used in this study were adopted because they were determined to be the most applicable to the defined conditions of the processes in the systems analyzed, such as the climate, animals, and styles of housing and waste treatment. The nitrogen content in excreted feces and urine for swine (expressed in g/day) was calculated as follows:
Excreted N = (CP – RP – MP) / 6.25
where CP is crude protein intake (g/day), RP is retained protein (g/day), and MP is milk protein for the lactating sow (g/day) calculated using the feeding standard (NARO 2005). The calculated nitrogen flow values per FU from feed to manure in LOW and CNV were as follows: 9.05 and 7.74 kg N from feed intake, 3.04 and 3.04 kg N used for weight gain, 1.67 and 1.59 kg N excreted into feces, and 4.35 and 3.11 kg N excreted into urine, respectively. The reduction in nitrogen excretion by the pigs resulting from the low-protein diets was determined to be 4.9% for feces and 40.6% for urine at the growing stage (Osada et al. 2011), and 7.0% for feces and 35.0% for urine at the fattening stage (Kaji et al. 1997). Further explanations on the life-cycle inventory and impact assessment methodologies are found in Ogino et al. (2013). Results and Discussion As a result of comparative LCA, the GHG emissions from manure management in LOW and CNV were 80 and 100 kg CO2-equivalents, respectively. The lower direct and indirect GHG emissions from manure management contributed to lower total GHG emissions from LOW despite the higher emissions from feed production including AA manufacturing. The

MANURE MANAGEMENT FOR GREENHOUSE GAS MITIGATION IN JAPAN
82
comparative LCA of the manure management of pig farming systems revealed that the use of a low-protein diet supplemented with AA resulted in 20% lower GHG emissions, even taking into account the negative effect of the changes in diet. While the GHG emissions from AA manufacturing were predictably higher than those from the production of the main feed ingredients, such as corn and soybean meal, the reduction in N2O emissions from manure management, mainly from wastewater treatment, was much larger than the GHG increase due to the use of AA. The national GHG inventory, which provides a basis for policy-making related to GHG mitigation, categorizes the sources of GHG emissions based not on the life cycle of the products but on sectors (e.g. energy and agriculture), and each sector is broken down into activities or practices (e.g. mobile combustion and manure management). For the GHG emissions related to manure management, there is the category of manure management, which covers CH4 and N2O emissions from livestock manure management, and thus a comparative LCA of manure management enables quantification of GHG mitigation in this category in line with the structure of the national GHG inventory, taking into account negative effects. This is the significance of conducting the comparative LCA of manure management in this study as well as the cradle-to-farm gate LCA of pig farming. The GHG mitigation potential brought about by the low-protein diet technique was estimated to be 340 Gg year-1 using the GHG mitigation per head obtained in this study (19.9 kg CO2-equivalents) and the annual number of marketed pigs (17.0 million head; MAFF 2010).
Fig. 7. Cradle-to-farm gate environmental impacts of pig farming systems.
CNV, pig farming system using conventional diets; LOW, pig farming
system using low-protein diets supplemented with amino acids. Values
for CNV are expressed as 100%.
0
20
40
60
80
100
120
Global Warming Acidification Eutrophication Energy
CNV LOW
Envi
ronm
enta
l im
pact
s, %

MANURE MANAGEMENT FOR GREENHOUSE GAS MITIGATION IN JAPAN
83
The results of LCA for four environmental impact categories over the whole life cycle of the pig farming systems (cradle-to-farm gate LCA) are shown in Fig. 7. The difference between LOW and CNV in terms of acidification had a tendency similar to the difference in global warming; LOW had a 4 to 5% smaller acidification potential than CNV. The eutrophication potential of LOW without maximizing GHG reduction was much smaller (by 28%) than that of CNV. Energy consumption was slightly (1-2%) larger in LOW than in CNV. The results of cradle-to-farm gate LCA of pig farming showed that LOW had lower GHG emissions than CNV throughout its life cycle (Fig. 7). The manure management process had the second highest GHG emissions (35% of the total) next to the feed production process in the pig life cycle, and thus the low-protein diet technique, which mainly reduces GHGs emitted from the manure management process, appears to be effective to reduce cradle-to-farm gate GHG emissions from pig farming. The eutrophication potential was markedly lower in LOW without maximum GHG reduction than in CNV, and this difference appeared to be because more than half of the environmental loads related to eutrophication were generated in the manure management process in CNV, and effluent nitrogen, which is a major source of eutrophication, was reduced by the low-protein diet technique. As the reason for the greater energy consumption in LOW, it was suggested that the low-protein diet technique mainly reduced N2O emissions not relevant to energy consumption, while AA manufacturing consumed more energy than crop production per unit amount. The results of LCA suggests that the low-protein diet technique reduces environmental impacts as a whole. The low-protein diet technique does not depend on the availability of the feedstock or the modification of waste treatment systems, and thus, theoretically, it can be used on all pig farms. The reduction of GHG emissions from pig farming using a low-protein diet supplemented with AA has been reported for other countries or regions, such as France (Garcia-Launay et al. 2014), Brazil (Monteiro et al. 2016; 2017), Europe, and North and South America (Kebreab et al. 2016). Among these reports, larger reduction of GHG emissions has been observed when AA replaces soybean meal that is derived from South America and involves deforestation.
CONCLUSION Composting is the most popular system for treating cattle manure in Japan. Restrictions on the level of GHG emissions vary depending on climate conditions and livestock species. We believe that efforts to reduce GHG begin by accurately measuring and presenting the emission status for each

MANURE MANAGEMENT FOR GREENHOUSE GAS MITIGATION IN JAPAN
84
farm. Nitrite accumulation is one of the important factors contributing to N2O
emission during the composting of livestock manure. One of the causes of nitrite accumulation during composting is the delayed regrowth of native NOB compared with AOB after the thermophilic phase of composting. To reduce N2O emission during composting, the effect of the artificial addition of an NOB source (mature compost product) after the thermophilic phase of swine-manure composting was evaluated using laboratory-scale apparatus. By adding the NOB source, the duration of nitrite accumulation reduced, which resulted in the early cessation of N2O emission. In the laboratory-scale swine-manure composting experiments, N2O emission rate was reduced by 60% on average by adding the NOB source. However, a negative effect of the addition of the NOB source in the pilot-scale composting experiment was observed, which seemed to be due to an increase in N2O generation via denitrification by the addition of nitrate nitrogen contained in the NOB source. Countermeasures are necessary to reduce N2O generation from denitrification when this technique would be used in the actual composting treatment.
The CF method can be introduced by loading CF carriers into existing AS treatment equipment. No special equipment needs to be installed, and this reduces the initial investment required. The CF method is therefore likely to be adopted for use on livestock farms.
The results of the comparative LCA showed that the GHG emissions from manure management of LOW were 20% less than those of CNV. The results of cradle-to-farm gate LCA showed that LOW had lower GHG emissions, acidification potential, eutrophication potential and overall environmental impact, and slightly higher energy consumption, than CNV.
In terms of amino acid-balanced diets, the addition of crystalline AA is a cost-increasing factor, while the reduction of high-CP feed ingredients, such as soybean meal (a costlier option than low-CP feed ingredients like maize) is a cost-decreasing factor. Though the price of amino acid-balanced diets depends on the price ratio between high- and low-CP feed ingredients, as well as the level of added crystalline AA and price of AA, it is equal in price or moderately cheaper overall compared to the conventional diets.
For swine and chicken, the AA that will be lacking when reducing the CP content can be determined by comparing the amino acid content in the diet and the amino acid requirement of the livestock (in most cases, lysine and methionine are limiting AA for swine and chicken, respectively). In the case of cattle, unlike swine and chicken, since all AA are theoretically supplied from rumen microbes, we cannot determine which AA will be lacking by comparing the amino acid content in the diet and the amino acid requirement. However, we know empirically which AA are typically lacking, and thus

MANURE MANAGEMENT FOR GREENHOUSE GAS MITIGATION IN JAPAN
85
amino acid-balanced diet could also be applied for cattle.
REFERENCES Daelman, M.R.J., E.M. van Voorthuizen, U.G.J.M. van Dongen, E.I.P.
Volcke, and M.C.M. van Loosdrecht. 2015. Seasonal and diurnal variability of N2O emissions from a full-scale municipal wastewater treatment plant. Science of the Total Environment 536:1-11.
Fukumoto, Y., T. Osada, D. Hanajima, and K. Haga. 2003. Patterns and quantities of NH3, N2O and CH4 emissions during swine manure composting without forced aeration−effect of compost pile scale. Bioresource Technology 89:109-114.
Fukumoto, Y., K. Suzuki, T. Osada, K. Kuroda, D. Hanajima, T. Yasuda, and K. Haga. 2006. Reduction of nitrous oxide emission from pig manure composting by addition of nitrite-oxidizing bacteria. Environmental Science and Technology 40:6787-6791.
Fukumoto, Y., K. Suzuki, K. Kuroda, M. Waki, and T. Yasuda. 2011. Effects of struvite formation and nitratation promotion on nitrogenous emissions such as NH3, N2O and NO during swine manure composting. Bioresource Technology 102:1468-1474.
Garcia-Launay, F., H.M.G. van der Werf, T.T.H. Nguyen, L. Le Tutour, and J.Y. Dourmad. 2014. Evaluation of the environmental implications of the incorporation of feed-use amino acids in pig. production using Life Cycle Assessment. Livestock Science 161:158-175.
He, Y., Y. Inamori, M. Mizuochi, H. Kong, N. Iwami, and T. Sun. 2001. Nitrous oxide emissions from aerated composting of organic waste. Environmental Science and Technology 35:2347-2351.
IPCC (2007) ‘IPCC (Intergovernmental Panel on Climate Change). Climatic change 2007: the physical science basis.’ (Intergovernmental Panel on Climate Change: Geneva).
Kaji, Y., M. Katsumata, E. Tsuneishi, and R. Takada. 1997. Reduction of urinary nitrogen excretion of swine by improving dietary amino acid balance (in Japanese). Research Results of Animal Producion 11:109-110.
Kampschreur, M. J., H. Temmink, R. Kleerebezem, M. S. M. Jetten, and M. C. M. van Loosdrecht. 2009. Nitrous oxide emission during wastewater treatment. Water Research 43:4093-103.
Kebreab, E., A. Liedke, D. Caro, S. Deimling, M. Binder, and M. Finkbeiner. 2016. Environmental impact of using specialty feed ingredients in swine and poultry production: A life cycle assessment. Journal of Animal Science 94:2664-2681.
Monteiro, A.N., F. Garcia-Launay, L. Brossard, A. Wilfart, and J.Y. Dourmad. 2016. Effect of feeding strategy on environmental impacts of pig

MANURE MANAGEMENT FOR GREENHOUSE GAS MITIGATION IN JAPAN
86
fattening in different contexts of production: evaluation through life cycle assessment. Journal of Animal Science 94:4832-4847.
Monteiro, A.N.T.R., T.M. Bertol, P.A.V. de Oliveira, J.Y. Dourmad, A. Coldebella, and A.M. Kessler. 2017. The impact of feeding growing-finishing pigs with reduced dietary protein levels on performance, carcass traits, meat quality and environmental impacts. Livestock Science 198 (Supplement C):162-169.
NARO. 2005. Japanese feeding standard for swine, 2005. Japan Livestock Industry Association, Tokyo, Japan.
Ogino, A., T. Osada, R. Takada, T. Takagi, S. Tsujimoto, T. Tonoue, D. Matsui, M. Katsumata, T. Yamashita, and Y. Tanaka. 2013. Life-cycle assessment of Japanese pig farming using low-protein diet supplemented with amino acids. Soil Science and Plant Nutrition 59:107-118.
Ohkubo, T., T. Osada, and M. Akagami. 2016. Regulation trial of nitrous oxide emissions caused by composting swine manure with nitrite-oxidizing bacteria added for nitrification promotion. JARQ-Japan Agricultural Research Quarterly 50:353-359.
Osada, T., R. Takada, and I. Shinzato. 2011. Potential reduction of greenhouse gas emission from swine manure by using a low-protein diet supplemented with synthetic amino acids. Animal Feed Science and Technology 166-67:562-574.
Osada, T., M. Shiraishi, T. Hasegawa, and H. Kawahara. 2017. Methane, nitrous oxide and ammonia generation in full-scale swine wastewater purification facilities. Frontiers of Environmental Science & Engineering11:10.
Otto, E.R., M. Yokoyama, P.K. Ku, N.K. Ames, and N.L. Trottier. 2003b. Nitrogen balance and ileal amino acid digestibility in growing pigs fed diets reduced in protein concentration. Journal of Animal Science 81:1743-1753.
Poth, M., and D.D. Focht. 1985. 15N kinetic analysis of N2O production by Nitrosomonas europaea: an examination of nitrifier denitrification. Applied & Environmental Microbiology 49:1134-1141.
Ritchie G.A.F. and D. J. D. Nicholas. 1972. Identification of nitrous oxide produced by oxidative and reductive processes in Nitrosomonas europaea. Biochemical Journal 126:1181-1191.
Rotz, C.A. 2004. Management to reduce nitrogen losses in animal production. Journal of Animal Science 82: E119-E137.
Van Kessel, M.A.H.J., D.R. Speth, M. Albertsen, P.H. Nielsen, H.J.M. Op den Camp, B. Kartal, M.S.M. Jetten, and S. Lücker 2015. Complete nitrification by a single microorganism. Nature 528:555–559.
Wrage, N., G.L. Velthof, M.L. van Beusichem, and O. Oenema. 2001. Role of nitrifier denitrification in the production of nitrous oxide. Soil Biology

MANURE MANAGEMENT FOR GREENHOUSE GAS MITIGATION IN JAPAN
87
and Biochemistry 33:1723-1732. Wrage, N., G.L. Velthof, M.L. van Beusichem, and O. Oenema. 2001. Role
of nitrifier denitrification in the production of nitrous oxide. Soil Biol Biochem. 33:1723-32.
Yamashita, T., H. Yokoyama, S. Kanafusa, A. Ogino, M. Ishida, T. Osada, and Y. Tanaka. 2011 Nitrate-removal activity of a biofilm attached to a Perlite carrier under continuous aeration conditions. Bioscience, Biotechnology, and Biochemistry 75:578-581.
Yamashita, T., R. Yamamoto-Ikemoto, H. Yokoyama, H. Kawahara, A. Ogino, and T. Osada. 2015. Mitigation of nitrous oxide (N2O) emission from swine wastewater treatment in an aerobic bioreactor packed with carbon fibers. Animal Science Journal 86:358-368.
Yamashita, T., M. Shiraishi, R. Yamamoto-Ikemoto, H. Yokoyama, A. Ogino, and T. Osada. 2016. Swine wastewater treatment technology to reduce nitrous oxide emission by using an aerobic bioreactor packed with carbon fibres. Animal Production Science 56:330-336.

88

APPLICATION OF AGRICULTURAL PRACTICES TO INCREASE SOIL CARBON SEQUESTRATION IN TAIWAN
89
APPLICATION OF AGRICULTURAL PRACTICES TO INCREASE SOIL CARBON SEQUESTRATION IN
TAIWAN
Chi-Ling Chen, Chiao-Ying Chou, Ming-Chieh Lin, and Jheng-Hong Hu
Taiwan Agricultural Research Institute,
Taichung, Taiwan
E-mail: [email protected]
ABSTRACT
According to the global estimation, the annual increase in CO2 concentration in the atmosphere can be halted by increasing 4‰ of the quantity of carbon contained in soils per year. The “Four per One Thousand Initiative” has been lunched by France on COP 21. Taiwan has signed the joint declaration as a response to the action. The action is also a major contributor to the greenhouse effect, climate change and food security. The objective of this study is to assess the possibility to achieve the goal of increasing 4‰ of soil organic carbon (SOC) every year in Taiwan. First, the SOC in Taiwan has been estimated by the sum of content of SOC in different soil groups. Second, the carbon sequestration potential of different agricultural practices has been estimated by long term experiment. The assessed practices include livestock manure and bio-char application on farmlands, organic farming, orchard grass cultivation, and afforestation in the plain area. The results reveal the content of SOC in Taiwan is about 237 million Mg in 0-100cm depth. The bio-char application has the highest potential carbon sequestration among the practices. However, the total of the potential carbon sequestration cannot achieve the goal of the initiative by all of the practices. Moreover, the total carbon sequestration of current practices is much lower than the target. In the future, some other practices, such as intercropping, restore the degraded land, land use change, and minimum tillage etc., might be improved to approach the goal of the initiative.
Keywords: 4 per 1000 initiative, soil carbon sequestration, agricultural practice

APPLICATION OF AGRICULTURAL PRACTICES TO INCREASE SOIL CARBON SEQUESTRATION IN TAIWAN
90
INTRODUCTION
The Paris Climate Agreement had been built upon the 21st Conference of the Parties to the United Nations Framework Convention on Climate Change (COP21) on Nov. 30 to Dec. 11, 2015 in Paris, France. This is a global agreement on the reduction of climate change, limiting global warming to less than 2 Celsius degrees (℃). In order to keep temperature rise below 2 ℃, we need to limit our annual greenhouse gas emission with an estimate of 9.8 Gt (9.8 × 10¹⁵ g) C at a 64% probability (Meinshausen et al., 2009).
The annual greenhouse gas emissions from fossil carbon are estimated as 8.9 Gt C (8.9 × 10¹⁵g), and a global estimate of soil C stock to 2 m of soil depth of 2400 Gt (2400 × 1015g) (Batjes, 1996). Taking the ratio of global anthropogenic C emissions and the total soil organic carbon (SOC) stock (8.9/2400), results in the value of 0.4% or 4‰ (4 per mille) (Ademe, 2015). Increasing SOC has been proposed to mitigate climate change with an additional benefit of improving soil structure and conditions (Lal, 2016).
The “4 per 1000 Initiative: soils for food security and climate” aspires to increase global soil organic matter stocks by 0.4 % per year as a compensation for the global emissions of greenhouse gases by anthropogenic sources. The initiative aims to show that food security and combating climate change are mutually complementary and to ensure that agriculture is a source of solutions. It was launched in COP21 as well and supported by almost 150 signatories (i.e., countries, regions, international agencies, private sectors and NGOs). Taiwan has signed the joint declaration as a response to the action. Stakeholders commit in a voluntary action plan to implement farming practices that maintain or enhance soil carbon stocks in agricultural soils and to preserve carbon-rich soils (Chambers et al., 2016; Lal, 2016).
In the world, if the land area is considered as 149 million km2, SOC would be estimated about 161 tons/hectare on average. So 4 per mille of this equates to an average sequestration rate to offset emissions of C as 0.6 tons hectare-1 year-1. This 4 per mille blanket value cannot be applied everywhere as soil varies widely in different environments, including desert, peat lands, mountains, etc., in turns of C storage. Soil types, aboveground vegetation, climate, and how quickly the soil biota uses the carbon which collectively impact the C storage. Nevertheless, studies from the world have estimated SOC sequestration rates and they suggest that annual carbon sequestration rate is about 0.2 to 0.5 tons/hectare, whilst adopting the most appropriate management practices, such as tillage reduction in combination with legume cover crops. In addition, some reports demonstrated that SOC increases due to the improvement on managements (Chen et al., 2015).
The 4 per mille initiative is feasible for the regions. The outcomes

APPLICATION OF AGRICULTURAL PRACTICES TO INCREASE SOIL CARBON SEQUESTRATION IN TAIWAN
91
highlight regional specific efforts and scopes for soil carbon sequestration. Reported soil C sequestration rates globally show that under the most appropriate management practices, 4 per mille or even higher C sequestration rates can be accomplished. High C sequestration rates (up to 10 per mille) can be achieved for soils with low initial SOC stocks (topsoil less than 30 ton C ha−1), and at the first 20 years after implementation of the most appropriate management practices. In addition, areas where they have reached the equilibrium of decomposition will not be able to further increase the C sequestration rate. (Budiman et al., 2017)
Taiwan is located in subtropical region with high temperature and high humidity. The decomposition of organic materials in soils is fast. The carbon sequestration is accumulated slowly by applying organic material. It is a challenge to achieve the goal of increasing 4‰ of SOC every year in Taiwan. The objective of this study is to evaluate the current and possible agricultural practices to reach the goal of the initiative and how to approach it in the future.
MATERIALS AND METHODS
Estimation of the SOC stocks in Taiwan
To estimate the Carbon sequestration rate, the current SOC stocks should be estimated first. The global SOC stocks have been estimated within different soil depths, from one to two meters, by different international research organizations (i.e., 4 per mille initiative, INRA, University of Sydney, etc.). According to the limitations of soil survey in the past, the SOC stocks in Taiwan had been estimated within one-meter-depth of soil. The SOC stocks in agricultural lands and forest with various depths in Taiwan had been estimated by the surveys as shown in Table 1 (Chen et al., 2000; Chen and Hseu, 1997; Tsui et al., 2016; Tsui et al., 2016).

APPLICATION OF AGRICULTURAL PRACTICES TO INCREASE SOIL CARBON SEQUESTRATION IN TAIWAN
92
Table 1. Soil organic carbon (SOC) stocks with varied depths in Taiwan
Depth
(cm)
SOC
(Mg/ha)
Ratio
(0-100) Land use Citations
0-20 32.4 29 Farmland Chen et al., 2000
0-30 36.4 54 Farmland & Forest Chen and Hseu 1997
0-50 50.3 72 Farmland & Forest Chen and Hseu 1997
0-100 73.1 100 Farmland & Forest Chen and Hseu 1997
0-15 27.1 20-25 Farmland & Forest Tsui et al., 2016
0-30 51.0 37-47 Farmland & Forest Tsui et al., 2016
0-50 88.5 65-81 Farmland & Forest Tsui et al., 2016
0-100 109-136 100 Farmland & Forest Tsui et al., 2016
0-30 48.2 50 Farmland Jien et al., 2010
0-50 67.3 70 Farmland Jien et al., 2010
0-100 96.4 100 Farmland Jien et al., 2010
Estimation of the decomposition of organic materials in soil The accumulation of SOC by applying organic materials is a slow process. Since there is no regular monitoring network for cultivated soil carbon, SOC sequestration rates of various practices in cultivated soils were estimated based on limited long term experiments in this study. Those data from different sites in Taiwan have been collected, where different rates of crops residues or organic manure had been applied continuously as shown in Table 2.
(1) 48-year field trial of two crops paddy under applying different organic materials rice in Taipei.
(2) 14-year field trial of rice-rice-soybean under applying crop residue in Pingtung.
(3) 9-year field trial of 2-3 crops soybean under applying compost in Tainan.
(4) 10-year field trial of two crops paddy under applying swine manure in Taichung.
The decomposition and accumulation of organic matter in soil were simulated as the first order reaction (Chen and Lian, 2002) in the followings equation (1) :
)()( SOCkAdtSOCd
−= (1)
A: Application rate of organic C. K: Decomposition rate constant.

APPLICATION OF AGRICULTURAL PRACTICES TO INCREASE SOIL CARBON SEQUESTRATION IN TAIWAN
93
If we apply the same amount of organic materials on soil every year, SOC will reach a stable equilibrium status after several decades. At that time, the SOC decomposition rate will not increase any more. The equation was used to estimate SOC stocks at equilibrium of decomposition under applying the organic materials by curve fitting of long term data.
Table 2. SOC decomposition rates under applying different organic materials in
five sites, Taiwan
Location Years Crop
System Trt
(z)
Crop residue/
Organic
manure
Rate applied
(Mg/ha/yr)
Decomposition
rate
SOCeq(x)
Matter(y) C constant(K,yr-1) (%)
Taipei, 1924-
1972
Rice-rice NoF rice stubble &
root
1.4 0.6 0.0158 2.2
IF rice stubble &
root
2.6 1.0 0.0229 2.4
GM rice stubble &
root
green manure
(soybean)
2.6
31.6*
1.0
2.5
0.0805 2.5
OF rice stubble &
root
farm yard
manure
2.7
18.2*
1.1
2.8
0.0795 2.8
Wanluan, 1974-
1988
Rice-rice- IF rice stubble &
root
5.8 2.3 0.06 2.0
Pingtung,
soybean IF+res. root
rice straw
soybean
residue
4
6-8*
0-2*
1.6
2.2-2.9
0-0.7
0.115 2.1
Shanhua,T
ainan,
1984-
1992
Soybean
-soybean
-soybean
IF root
crop residue
bagasse-filter
cake compost
0.7-1.3
21.5-0
20-0*
0.3-0.5
8.6-0
1.5-0
0.5-0.059 0.4
IF+OF root
crop residue
bagasse-filter
cake
compost
0.7-1.3
21.5-0
150-20*
0.3-0.5
8.6-0
8.8-1.5
0.18 1.9
Wufeng,
Taichung,
2004-
2016
Rice-rice NoF rice stubble &
root
7.6 3.0 0.1449 1.0
IF rice stubble &
root
organic
fertilizer
15
0.8
6.1
0.3
0.185 1.6
M rice stubble &
root
swine manure
15
1.4
6.0
0.6
0.1683 1.8
(z)Trt: treatment, NoF: no fertilizer, IF: inorganic fertilizer, GM: green manure, OF: organic fertilizer, M: swine manure, OG: Orchard grass (y)annotated '*' are based on fresh weight, while the rest are based on dry weight (x)SOC(eq) : estimated soil organic carbon content at equilibrium status.

APPLICATION OF AGRICULTURAL PRACTICES TO INCREASE SOIL CARBON SEQUESTRATION IN TAIWAN
94
Feasible agricultural practices on the improvement of SOC sequestration There are some feasible practices which have been conducted to increase the SOC sequestration in Taiwan as the following. Some practices have been monitored and reviewed for the estimation of the SOC sequestration.
Application of livestock manure on farmland The waste of livestock must be treated by a three-step process, and then discharged to the surface water in the past. After the evaluation of the experiments in 4-5 years, applications of livestock manure on farmlands for fertilization have been approved by the government of Taiwan since 2011 (Chen, 2013). There are more than 300 ha of farmlands applied with swine or cattle manure. The area of manure applications is continually increasing on a yearly basis. A 10-year-experiment of continuous swine manure applications has been conducted on farmlands by the Taiwan Agricultural Research Institute (TARI). The SOC sequestration has been estimated by this experiment. The annual SOC sequestrations were estimated according to Walkley-Black wet oxidation method (Nelson and Sommer, 1982).
Organic farming Organic farming, by recycling the agricultural organic waste, is one of the effective practices to increase SOC sequestration. It is also one of the environmentally friendly agricultural practices. However, it is a the practices are challenging because they are costly and labor intensive under the special climate and complicated environment in Taiwan. The current area of organic farming is only about 7,600 ha (<1% of total cultivated land in Taiwan), including 2,700 ha in paddy fields and 4,900 ha in upland fields (Taiwan Organic Information Portal, 2018). Organic farming can be improved through the subsidy from the government. The goal of the area of organic farming by the government is to up to 40,000 ha (~5% of total cultivated land in Taiwan) in 2017. The SOC sequestration of organic farming is estimated from the data of a previously mentioned 10-year-experiment.
Orchard grass cultivation Most of the orchard grows along a sloping hill in Taiwan. The grass cultivation is one of the strategies to inhibit weed growth, control the damages of insects and pests, and improve the conservation of soil, water
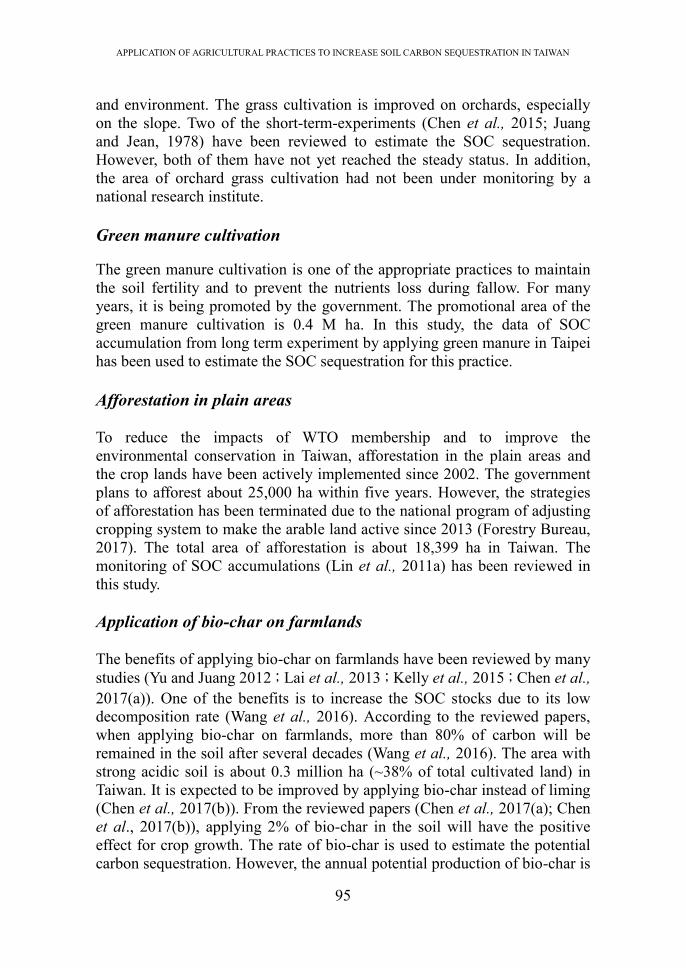
APPLICATION OF AGRICULTURAL PRACTICES TO INCREASE SOIL CARBON SEQUESTRATION IN TAIWAN
95
and environment. The grass cultivation is improved on orchards, especially on the slope. Two of the short-term-experiments (Chen et al., 2015; Juang and Jean, 1978) have been reviewed to estimate the SOC sequestration. However, both of them have not yet reached the steady status. In addition, the area of orchard grass cultivation had not been under monitoring by a national research institute.
Green manure cultivation
The green manure cultivation is one of the appropriate practices to maintain the soil fertility and to prevent the nutrients loss during fallow. For many years, it is being promoted by the government. The promotional area of the green manure cultivation is 0.4 M ha. In this study, the data of SOC accumulation from long term experiment by applying green manure in Taipei has been used to estimate the SOC sequestration for this practice.
Afforestation in plain areas To reduce the impacts of WTO membership and to improve the environmental conservation in Taiwan, afforestation in the plain areas and the crop lands have been actively implemented since 2002. The government plans to afforest about 25,000 ha within five years. However, the strategies of afforestation has been terminated due to the national program of adjusting cropping system to make the arable land active since 2013 (Forestry Bureau, 2017). The total area of afforestation is about 18,399 ha in Taiwan. The monitoring of SOC accumulations (Lin et al., 2011a) has been reviewed in this study.
Application of bio-char on farmlands The benefits of applying bio-char on farmlands have been reviewed by many studies (Yu and Juang 2012;Lai et al., 2013;Kelly et al., 2015;Chen et al., 2017(a)). One of the benefits is to increase the SOC stocks due to its low decomposition rate (Wang et al., 2016). According to the reviewed papers, when applying bio-char on farmlands, more than 80% of carbon will be remained in the soil after several decades (Wang et al., 2016). The area with strong acidic soil is about 0.3 million ha (~38% of total cultivated land) in Taiwan. It is expected to be improved by applying bio-char instead of liming (Chen et al., 2017(b)). From the reviewed papers (Chen et al., 2017(a); Chen et al., 2017(b)), applying 2% of bio-char in the soil will have the positive effect for crop growth. The rate of bio-char is used to estimate the potential carbon sequestration. However, the annual potential production of bio-char is

APPLICATION OF AGRICULTURAL PRACTICES TO INCREASE SOIL CARBON SEQUESTRATION IN TAIWAN
96
only 10,000 Mg per year, in Taiwan, due to the current limitation of the amounts of kilns.
RESULTS AND DISCUSSION
Estimation of the SOC stocks in Taiwan The areas of cultivated lands and forest lands are approximately 0.8 M ha and 2.2 M ha, respectively, and the total area is about 3.6 million ha in Taiwan (COA, 2018(b)). According to the results of soil surveys, the amounts of SOC stocks are between 73 - 136 Mg/ha within one meter depth among farmlands and forests as the table 1 (Chen and Hseu ,1997; Chen et al., 2000; Tsui et al., 2016; Tsui et al., 2016). In this study, the SOC stocks for the top 1 m is estimated as 77 million Mg in cultivated soils (Jien et al., 2010) and 160 million Mg in forest soils (Tsai et al., 2010). Therefore, the total SOC stocks in Taiwan are about 237 million Mg.
In Taiwan, the average SOC stocks of cultivated soils tend to decrease from the north to the south because the climate is warmer in the south (Chen et al., 2000; Tsui et al., 2013). For forest soils, the variation of SOC stocks is significantly related to the air temperature and elevation gradients. In Taiwan, the current annual CO2 emissions from fossil fuel are 253.92 Mt CO2 (69.25 Mt C) (EPA, 2018). In general, 49.6% of cultivated lands are used for rice production, which is more efficient for C sequestration compared to the lands for other crops (Chen et al., 2000).
Taiwan Agricultural Research Institute (TARI) has conducted a detailed soil survey based on a grid sampling design (250 m × 250 m) between 1992 and 2010. More than 130,000 pedons of soil with 0-1.5 m depth were collected from the cultivated soils. There was also a detailed survey for forest soils (~ 8,000 pedons) which was conducted by Taiwan Forestry Research Institute (TFRI) between 1993 and 2002. Those data are organized and analyzed to improve the SOC stocks estimation in Taiwan in the near future.
Estimation of the decomposition rate of organic materials in cultivated soils According to the curve fitting of the long term experiment by the first order equation, the results reveal that it takes at least 20-30 years for SOC to reach the stable status of equilibrium in Taiwan. Chemical fertilizers had been applied for several decades in conventional farming. Therefore, we assume that the SOC sequestration is not increased under steady status. The long term experiments indicate that generally, soil organic matter can be

APPLICATION OF AGRICULTURAL PRACTICES TO INCREASE SOIL CARBON SEQUESTRATION IN TAIWAN
97
maintained at higher level in paddy fields than in upland fields. The long-term applications of chemical fertilizers did not deplete the content of soil organic matter comparing to the applications without chemical fertilizers. However, we can discover slightly increasing of soil organic matter in the long-term applications of chemical fertilizers. In fact, a stabilized content of SOC (2.2%) was maintained in the soil without applications of fertilizers in this paddy soil; the content of SOC from the rice stubble and roots remained in the soil after the harvests were enough to maintain the organic matter without any tendency of depletion. On the other hand, the content of SOC in the long-term applications of green manure did not increase as significantly as that in the application of compost, although it did increase slightly higher than that of the application of chemical fertilizer as shown in Table 2 and Fig. 1. Apparently, increasing the content of SOC through the applications of organic materials is difficult in Taiwan due to its higher rate of decomposition. The average of SOC accumulation rate is only 0.02-0.03 % per year (Chen and Lian, 2002). However, it is advantageous for agricultural lands to dispose of the harmless organic wastes produced by animal husbandry. The environmental impacts will be minimized when applying organic materials with the reasonable rate which has been evaluated. In addition, government agencies also strongly recommend that rice-cropping systems that could be combined with applications of compost and crop residues.
According to the results of the experiments and simulation analysis, the continuous applications of 17Mg/ha/year (fresh weight basis) of farm yard manure for 70 years is required to raise SOC from the level of 2.2 % to 2.8 % at nearly steady state in the paddy field, Taipei. On the other hand, the continuous application of 110 Mg/ha/year (fresh weight basis) of bagasse filter cake compost for 30 years is required to raise SOC from the level of 0.4 % to 1.9 % at nearly steady state in the upland field, Tainan. However, the rate of N release at steady state needs to be 740 kg N/ha/year to maintain 1.9 % of SOC. The long-term continuous application of 110 Mg/ha/year (fresh weight basis) of bagasse filter cake compost apparently will result in the environmental pollution (Chen and Lian, 2002). Such high applying rate is not recommended.

APPLICATION OF AGRICULTURAL PRACTICES TO INCREASE SOIL CARBON SEQUESTRATION IN TAIWAN
98
Fig. 1. SOC accumulation by applying different organic materials in the long
term experiments in (a) Taipei, (b) Pingtung, (c) Tainan, (d)Taichung.
(NoF: no fertilizer; IF: inorganic fertilizer; GM: green manure; OF:
organic fertilizer; M: swine manure; obs: observed data; est: estimated
data by model). Estimation of the potential SOC sequestration of agricultural practices Estimation of the SOC sequestration of different practices Since there is no regular monitoring network for cultivated soil carbon, SOC sequestration of various practices in cultivated soils were estimated based on limited long-term studies. The SOC sequestration rates of organic farming, green manure cultivation and application of poultry manure are estimated based on the former results of the long term experiments in Taipei. The SOC accumulation rate by applying the swine manure with the data of 10-year-experiment at Wufeng was estimated and showed in Fig. 1. The SOC accumulation is estimated to be 1.8 % under the steady status. It is 0.2 % higher than that of applying chemical fertilizer.
APPLICATION OF AGRICULTURAL PRACTICES TO INCREASE SOIL CARBON SEQUESTRATION IN TAIWAN
99
Bahia grass (Paspalum notatum Fliigge) is one species of grasses with higher biomass. It is used to cultivate in slopes to prevent the soil erosion and enhance soil fertility. After five-year cultivation, the SOC stock of orchard with Bahia grass cultivation is 1% which is higher than that of orchard without Bahia grass cultivation (0.5%) (Juang and Jean, 1978). The SOC stock will increase 0.8 % and 0.5 % after nine months by cultivating Chinese wedelia (Wedelia chinensis Merr) and Alligator weed (Alternanthera philoxeroidex Mart) in wax apple orchards (Chen et al., 2015). However, the SOC stocks of both experiments have not yet reached the steady status. In this study, we estimate 0.5% of SOC stocks will be increased by orchard grass cultivation based on the previous experiments.
The long-term monitoring of the SOC stocks in abandoned orchards and afforested sites revealed that afforestation could result in lower pH, lower bulk density, higher soil organic C, and higher nitrogen content, and higher storages compared to the adjacent cultivated stands. However, this general trend can be deflected by the specific management in the individual cultivated stands. The average SOC storage at 0-20 cm depth is 7.8 ton C ha-1 in the afforested stands which is higher than that of the cultivated stands. While most of the sequestrated C storages belonged to the labile C pools and only a few amount of sequestrated C storages can be stored in the recalcitrant C pools. Annual SOC accumulation was 0.34 ton C ha-1 y-1 which was close to the mean value of annual SOC accumulation from global afforestation (0.3 ton C ha-1 y-1) (Lin et al., 2011a). In this study, we estimate the SOC sequestration rate as 0.0175 % /yr based on the reviewed study.
From the reviewed papers (Chen et al., 2017(a); Chen et al., 2017(b)), applying 2% of bio-char will have active effects for crop growth. The rate is used to estimate the potential SOC sequestration. And, we assume that the carbon content of bio-char is 50% and 20 % of bio-char will be decomposed in soil (Johannes et al., 2006; Wang et al., 2016). Then, 0.8 % of SOC content from bio-char will be remained in soil.
Estimation of applied maximum area of different practices For estimating the potential SOC sequestration, the maximum area which can be applied for various practices must be estimated first. The estimation of total area is about 235, 000 ha that can be applied with livestock manure with 400 kg N/ha demanded. It is estimated using the total produced nitrogen in manure of 5.4 million heads of swine, 0.1 billion heads of poultry and 147,000 of cattle in 2017 (COA, 2018(a)). The expected maximum area is 400,000 ha for green manure cultivation which is the area of paddy field in Taiwan. The area of 40,000 ha will be improved by government in the near 10 years (COA, 2018(c)). The maximum area can be applied for orchard

APPLICATION OF AGRICULTURAL PRACTICES TO INCREASE SOIL CARBON SEQUESTRATION IN TAIWAN
100
grass cultivation is 180,000 ha, which is the total area of orchard in Taiwan. The afforestation in plain areas has been applied for 18,000 ha. Due to the strategy on the promotion of this practice has been terminated by 2013, the area will not be expanded in the near future. The maximum area for applying bio-char is 300,000 ha which is the area of strong acidy soil in Taiwan.
To summarize all of the areas from these practices, the total potential SOC sequestration is about 9.2 million Mg per year as Table 3. It is higher than the goal of the initiative based on the agricultural SOC only. However, it will be lower than the goal if based on the total SOC (with both agricultural SOC and forest SOC). Table 3. Potential increased SOC sequestration of agricultural practices in
Taiwan
Practices Increasing SOC in
25-yr (%) Area(103 ha) SOC (103 Mg)
Applying
Manure
Swine 0.2
0.4
0.2
120 480
Poultry 100 800
Cattle 15 60
Green manure 0.1 400 800
Organic Farming 0.4 40 320
Grass Cultivation 0.5 180 1,800
Afforestation 0.4 18 144
Applying Bio-char 0.8 300 4,800
Total 9,204 (368/yr)
Estimation of the current annual SOC sequestration of agricultural practices The estimated potential SOC sequestration is lower than the goal of the initiative. However, it might be much lower than the goal in current status due to the limitations of promotional strategies by the government (Table 4). The limitations of practices are described as follows:
Application of livestock manure on farmlands Since the nutrient content of swine and cattle waste water is quite low and is not constant, the cost of transportation is expensive and this practice is promoted very slowly. The estimated average increased area for applying swine and cattle wastes is about 2000 ha/yr. In addition, the over addition of copper and zinc in feeding might cause the metal accumulation in soils. So the standards of metal contents in feeding must be adjusted and the
APPLICATION OF AGRICULTURAL PRACTICES TO INCREASE SOIL CARBON SEQUESTRATION IN TAIWAN
101
management of livestock feeding must be monitored. Organic farming The limitations for the promotions of practices must be solved. For example, low profits during the transition period, the standards of certification are restricted on heavy metal contents and organic materials, organic fields might be polluted by the residual pesticides from neighbor conventional field, pest insects and weeds are not easily controlled due to the high temperature and humidity in Taiwan, the higher input for production and extra cost for certification monitoring than conventional farming etc. Afforestation in plain areas Although this practice have some advantages, such as increase in SOC sequestration, green landscaping and minimizing the effect of global warming, etc., there are also some disadvantages, such as replacing the potential crop yields in farmlands, reducing the development area, limited to a few of tree species, loss of the original biodiversity, etc. Therefore, the government terminated the strategy due to the program of adjusting cropping system in which arable land hasn’t been active since 2013 (Forestry Bureau, 2013). However, we estimate the SOC accumulation within 20 years since it has not yet reached the steady status. Application of bio-char on farmlands The total SOC sequestration is estimated up to 12 million Mg by applying 2% of bio-char in strong acidic soil. However, the annual potential production of bio-char is only 10,000 Mg per year due to the current limitation in the amounts of kilns. This practice is expected to accelerate by increasing the facilities of bio-char production. The classification standards of bio-char production should be established urgently to assure the quality of bio-char for agricultural production and environmental protection. More applications of agricultural practices in the future Some practices have been applied effectively in other countries. For example, intercropping, restoring the degraded land, land use change, and minimum tillage, etc. Since the total SOC sequestration rates of the current practices cannot reach the goal of the initiative in Taiwan, more practices will be promoted and improved so the goal will be approached in the future.

APPLICATION OF AGRICULTURAL PRACTICES TO INCREASE SOIL CARBON SEQUESTRATION IN TAIWAN
102
However, the strategies of promotions and improvement on SOC sequestrations might be getting more difficult in practice. In Taiwan, it is costly to restore the degraded soil, such as saline soil, acid soil, alkali soil, etc. The weed and disease control are not easy for minimum tillage. The change of land use might be involved the food security problem.
Table 4. Current annual SOC sequestration of agricultural practices in Taiwan
Practices Increasing SOC
(%/yr) Area(103 ha) SOC (103 Mg)
Applying
Manure
Swine 0.008
0.016
0.008
1 0.16
Poultry 100 32
Cattle 1 0.16
Green manure 0.004 200 160
Organic Farming 0.016 10 3.2
Grass Cultivation 0.02 10 4
Afforestation 0.0175 18 6.3
Applying Bio-char 0.032 0.5 0.32
Total 62.14
CONCLUSION
Because of the high decomposition rates of SOC and the limitations of the government strategies, it is a challenge to reach the goal of the initiative in Taiwan. From the results of the estimations, the goal of the initiative may not be reached by the current agricultural practices, including livestock manure and bio-char application on farmlands, organic farming, orchard grass cultivation, and afforestation in the plain areas. However, the SOC sequestration can be estimated accurately by monitoring of these practices. In the future, more practices, such as restoring the degraded land, land use change, and minimum tillage intercropping, etc., will be implemented to approach the goal of the initiative year by year.

APPLICATION OF AGRICULTURAL PRACTICES TO INCREASE SOIL CARBON SEQUESTRATION IN TAIWAN
103
REFERENCES
Ademe, 2015. Organic carbon in soils. Meeting Climate Change and Food
Security Challenges. ADEME, France. Batjes, N.H. 1996. Total carbon and nitrogen in the soils of the world. Eur. J.
Soil Sci. 47: 151–163. Budiman M., B.P. Malone, A.B. McBratney, D.A. Angers, D. Arrouays, A.
Chambers, V. Chaplot, Z.S. Chen, K. Cheng, B.S. Das, D.J. Field, A. Gimona, C.B. Hedley, S.Y. Hong, B. Mandal, B.P. Marchant, M. Martin, B.G. McConkey, V.L. Mulder, S. O'Rourke, A.C. Richer-de-Forges, I. Odeh, J. Padarian, K. Paustian, G. Pan, L. Poggio, I. Savin, V. Stolbovoy, U. Stockmann, Y. Sulaeman, C.C. Tsui, T.G. Vågen, B.V. Wesemael, and L. Winowiecki. 2017. Soil carbon 4 per mille. Geoderma. 292:59-86.
Chambers, A., R. Lal, and K. Paustian. 2016. Soil carbon sequestration potential of US croplands and grasslands: implementing the 4 per thousand initiative. J. Soil Water Conserv. 71: 68A–74A.
Chen, C.L., M.L. Lin, H.Y. Guo, Chi-Fang Chiang, Tsang-Sen Liu and Chien-Liang Chu. 2000. Impact assessment of shifts of land use on soil organic carbon storage of cultivated land in Taiwan. Soil and Environment. 3(4): 363-378. (In Chinese).
Chen, C.L. and S. Lian. 2002. Modeling of organic matter turnover and fertility maintenance in Taiwan and Japan. Journal of Agricultural Research of China 51(2): 50-65. (In Chinese).
Chen, C.L. 2013. Pilot study of Dutch livestock waste management in Taiwan。Agricultural Science and Technology Newsletter International Quarterly 58: 3-6. (In Chinese).
Chen, C.L., C.Y. Liao, and C.C. Yang. 2017(a). Benefit analysis of applying biochar on soil carbon sequestration in farmland. Proceeding of “2017 International Conference on Intelligent Agricultural Machinery (ICOIAM) in Taiwan”. Section B7. 12/1-2. National Formosa University, Yuinlin.
Chen, C.L., C.Y. Liao, C.C. Yang, and P.H. Lin. 2017(b). Impact of biochar application on crop growth and estimation of carbon sequestration potential in farmland. Agriculture World Magazine. 404: 8-13. (In Chinese).
Chen, L., P. Smith, and Y. Yang. 2015. How has soil carbon stock changed over recent decades? Glob. Chang. Biol. 21:3197-3199.
Chen, S.J., H.P. Chou, Y.H. Lin, M.N. Tseng, and C.C. Hu. 2015. Research, demonstration and extension of wax apple orchard health management. Integrated Crop Management Conference. Feb. 12, 2015. Taiwan

APPLICATION OF AGRICULTURAL PRACTICES TO INCREASE SOIL CARBON SEQUESTRATION IN TAIWAN
104
Agricultural Research Institute, Council of Agriculture, Executive Yuan, Taichung, Taiwan. pp.120-133. (In Chinese).
Chen, Z.S. and Z.Y. Hseu. 1997. Organic carbon storage in soils of Taiwan. Proceedings of National Science Council, ROC (Part B: Life science) 21:120-127.
Council of Agriculture (COA), Executive Yuan, R.O.C. 2018(a). Agricultural statistics yearbook 2017, agricultural production. pp. 21-128.
Council of Agriculture (COA), Executive Yuan, R.O.C. 2018(b). Agricultural statistics yearbook 2017, land. pp. 225-227.
Council of Agriculture (COA), Executive Yuan, R.O.C. 2018(c). Promote organic and friendly environment for farming. Retrieved from https://www.eycc.ey.gov.tw/DL.ashx?s=1137EFC96E3CA0EA79435349EB8F6EA9028BCEC2057278F71B202E11C1655287&u=%2FUpload%2FRelFile%2F118%2F761664%2Fdb29f48f-3d81-4d5c-9945-5d63760abb21.pdf. (Sept. 4, 2018)(In Chinese).
Environmental Protection Administration (EPA), Executive Yuan, R.O.C. 2018. Taiwan Greenhouse Gas Inventory Report Summary in 2017. Chapter 2: pp. 1-21.
Forestry Bureau, Council of Agriculture, Executive Yuan. 2017. Reward afforestation information. Retrieved from https://www.forest.gov.tw/0000055. (Sept. 4, 2018).
Jien, S.H., Z.Y. Hseu, H.Y. Guo, C.C. Tsai, and Zu.S. Chen. 2010. Organic carbon storage and management strategies of the rural soils on the basis of soil information system in Taiwan. Proceedings of International Workshop on Evaluation and Sustainable Management of Soil Carbon Sequestration in Asian Countries. Bogor, Indonesia Sept. 28-29, 2010. pp. 125-137.
Johannes, L., G. John, and R. Marco. 2006. Bio-char sequestration in terrestrial ecosystems – a review. Mitigation and Adaptation Strategies for Global Change. 11: 403-427.
Juang, T.C., and S.Y. Jean. 1978. Effect of bahia grass mulching and covering on the soil fertility of slopeland. Journal of Chinese Soil and Water Conservation. 9 (1): 57-66. (In Chinese).
Kelly, C.N., F.C. Calderon, V. Acosta-Martinez, M.M. Mikha, J. Benjamin, D. W. Rutherford, and C.E. Rostad. 2015. Switchgrass biochar effects on plant biomass and microbial dynamics in two soils from different regions. Pedosphere 25:329–342.
Lai, W.Y., C.M. Lai, G.R. Ke, R.S. Chung, C.T. Chen, C.H. Cheng, C.W. Pai, S.Y. Chen, and C.C. Chen. 2013. The effects of woodchip biochar application on crop yield, carbon sequestration and greenhouse gas emissions from soils planted with rice or leaf beet. Journal of the Taiwan Institute of Chemical Engineers 44:1039-1044.

APPLICATION OF AGRICULTURAL PRACTICES TO INCREASE SOIL CARBON SEQUESTRATION IN TAIWAN
105
Lal, R. 2016. Beyond COP 21: potential and challenges of the “4 per Thousand” initiative. J. Soil Water Conserv. 71: 20A–25A.
Lin, Y.R., C.H. Cheng, and T.Y. Tseng. 2011a. Carbon sequestration potential of afforestation in the plain areas in Taiwan: examples from long-term abandoned orchards and afforested sites. Q. J. Chin. For. 44(4): 567–588 (In Chinese).
Lin, Y.R., C.H. Cheng, T.Y. Tseng, S.L. Wang, and H.Y. Guo. 2011b. Soil properties and organic carbon sequestration in the long-term afforested stands of plain areas. Taiwanese Journal of Agricultural Chemistry and Food Science 49(5): 260-274. (In Chinese).
Meinshausen, M., N. Meinshausen, W. Hare, S.C. Raper, K. Frieler, R. Knutti, D.J. Frame, and M.R. Allen. 2009. Greenhouse-gas emission targets for limiting global warming to 2C. Nature 458: 1158–1162.
Nelson, D.W., and L.E. Sommers. 1982. Total carbon, organic carbon, and organic matter. In: Page, A.L., Miller, R.H., Keeney D.R. (Eds.), Methods of soil analysis, Part 2. Chemical and microbiological properties. ASA and SSSA, Madison, WI. Agronomy monograph, No. 9. 539–577.
Taiwan Organic Information Portal. 2018. 2017 Yearly Report of Organic agricultural land and farm in Taiwan. Retrieved from http://info.organic.org.tw/supergood/ezcatfiles/organic/img/img/1266/33799838.pdf. (Sept. 4, 2018).
Tsai, C.C., Z.S. Chen, Z.Y. Hseu, C.T. Duh, and H.Y. Guo. Organic carbon storage and management strategies of the forest soils on the forest soil survey database in Taiwan. Proceedings of International Workshop on Evaluation and Sustainable Management of Soil Carbon Sequestration in Asian Countries. Bogor, Indonesia Sept. 28-29, 2010. pp. 85-102.
Tsui, C.C., C.C. Tsai, and Z.S. Chen. 2013. Soil organic carbon stocks in relation to elevation gradients in volcanic ash soils of Taiwan. Geoderma. 209: 119–127.
Tsui, C.C., C.C. Tsai, and Z.S. Chen. 2016. The situation and new issues on the applications of different biochars on the arable soils of east and southeastern Asian countries. 3rd Asia Pacific Biochar Conference 2016 (APBC 2016): A Shifting Paradigm towards Advanced Materials and Energy/Environment Research. Oct 19 -26, 2016, Gangwon Province, Korea.
Wang, J.Y., Q.X. Zheng, and YaKov Kuzyakov. 2016. Biochar stability in soil: meta-analysis of decomposition and priming effects. Global Change Biology Bioenergy. 8: 512–523.
Yu, C.C. and K.W. Juang. 2012. Effects of coffee ground- and tea residue-based biochars amendments on the uptakes of macro elements by canola seedlings. Soil and Environment. 16(1): 67-80. (In Chinese).

106

TECHNICAL MEASURES TO MITIGATE GREENHOUSE GASES FROM AGRICULTURAL FIELDS
107
TECHNICAL MEASURES TO MITIGATE GREENHOUSE GASES FROM
AGRICULTURAL FIELDS
Hiroko Akiyama1, Seiichi Nishimura2, Miyuki Nakajima3, Akinori Mori4, Yuhei Hirono5, Tomohito Sano5,
Hiroyoshi Sugiura5, Nobuhisa Koga6, Takeshi Yamane6,
Shigeto Sudo1, Yasuhiro Nakajima1, Yuko T Hoshino1, and Yoriko Sakai1
1Institute for Agro-Environmental Sciences,
National Agriculture and Food Research Organization (NARO),
Tsukuba, Japan 2Hokkaido Agricultural Research Center,
NARO, Sapporo, Japan 3Tohoku Agricultural Research Center, NARO, Morioka, Japan
4Institute of Livestock and Grassland Science,
NARO, Nasushiobara, Japan 5Institute of Fruit Tree and Tea Science, NARO, Tsukuba, Japan
6Kyushu Okinawa Agricultural Research Center, NARO,
Chikugo, Japan
E-mail: [email protected]
ABSTRACT
Agriculture is a major anthropogenic source of greenhouse gases (GHGs), such as methane (CH4) and nitrous oxide (N2O). In contrast, agricultural soil has great potential to act as a sink of atmospheric carbon dioxide (CO2). This study aimed to develop techniques for increasing soil C stocks and reducing GHGs from agricultural fields while adapting to climate change and meeting the increasing demand for agricultural products. Here, we summarize five major achievements of our study. (1) We conducted nine field experiments across Japan and demonstrated that prolonged mid-season drainage (MD) (1 week longer than local conventional drainage) reduced CH4 emission from paddy fields by 30% compared with conventional drainage practice, while maintaining grain yields. The Ministry of Agriculture Forest and Fisheries has approved prolonged MD as a subsidized program. Prolonged MD has now been applied to approximately half of rice paddy fields in Shiga Prefecture and has been

TECHNICAL MEASURES TO MITIGATE GREENHOUSE GASES FROM AGRICULTURAL FIELDS
108
approved in a total of five prefectures. (2) We assessed the effect of different biochar application rates (0, 10, 20, and 40 Mg ha-1) on crop productivity and global warming potential by a 4-year field experiment in an Andosol field in Hokkaido. Wood residue-derived biochar application had no significant influence on the yield, quality of the harvested materials, or cumulative CO2, N2O, and CH4 emissions. The net ecosystem C budget increased with the rate of biochar application; thus, biochar application has great potential for mitigating global warming through enhanced soil C sequestration. (3) We investigated the effect of organic matter application on soil C sequestration in orchards by long-term field experiments (>10 years) at three sites across Japan. Our results showed that organic matter application increased soil organic carbon concentration compared with that in bare soil control with no organic matter application. (4) We demonstrated that N2O reductase (N2OR) can mitigate N2O emissions from soybean fields during nodule decomposition by inoculation with nosZ++ strains (mutants with increased N2OR) of Bradyrhizobium diazoefficiens and by inoculation with a mixed culture of indigenous nosZ+ strains of B. diazoefficiens isolated from Japanese agricultural fields. (5) We conducted a meta-analysis of the effects of biochar and the inhibitors of nitrification and urease activities on N2O emissions, nitrate leaching, and plant nitrogen uptake from urine patches of grazing animals on grasslands. Our results suggested that the application of dicyandiamide (DCD) (a nitrification inhibitor) or N-(n-butyl) thiophosphoric acid triamide (NBPT, a urease inhibitor) + DCD decreases N losses and increases N utilization from urine patches. Keywords: Methane, nitrous oxide, soil, mitigation, carbon
sequestration
INTRODUCTION
Agriculture is a major anthropogenic source of greenhouse gases (GHGs), such as methane (CH4) and nitrous oxide (N2O). Rice paddy fields are a major source of CH4, and the application of synthetic and organic fertilizers increases N2O emissions from soil; however, agricultural soil has great potential to act as a sink for atmospheric carbon dioxide (CO2). Changing farming practices can remove a substantial amount of CO2 from the atmosphere via the storage of carbon (C) in the soil as organic matter, whereas increasing the input of organic matter and reducing tillage can increase soil C sinks.
This study aimed to develop techniques to increase soil C sinks and

TECHNICAL MEASURES TO MITIGATE GREENHOUSE GASES FROM AGRICULTURAL FIELDS
109
reduce GHGs emitted from agricultural fields while adapting to climate change and meeting the increasing demand for agricultural products. Our research also aimed to contribute to the National Greenhouse Gas Inventory Report and Refinement of IPCC Guidelines.
MAJOR ACHIEVEMENTS
Mitigation of CH4 emissions from rice paddy fields by prolonged mid-season drainage (MD) and its application for farmers According to the global statistical analysis, CH4 emissions from MD of rice paddy fields accounts for 48% of CH4 emissions from fields subjected to continuous flooding (Yan et al., 2005). In Japan, MD is already practiced in approximately 90% of paddy fields except those in Hokkaido; as a consequence, introducing MD to reduce CH4 is only applicable in Hokkaido.
Prolonged MD (lasting 1 week longer than conventional MD) may reduce CH4 emissions compared with conventional MD. To evaluate the effectiveness of prolonged MD on reducing CH4 emissions, field experiments were conducted at nine sites across Japan for 2 years (Itoh et al., 2011).
Seasonal CH4 emissions were significantly decreased at most sites as a result of prolonged MD compared with that as a result of conventional MD (Fig. 1), particularly at sites where organic matter was added to the soil before cultivation. The effect on N2O emission was much smaller than that of CH4 emission (considering CO2 equivalents). Compared with conventional MD, seasonal CH4 emissions and net 100-year global warming potentials (CH4 + N2O) can be reduced, as mean ± SE, by 69.5% ± 3.4% and 72.0% ± 3.1%, respectively, while maintaining grain yields at a high level of 96.2% ± 2.0% by prolonging MD.
The Ministry of Agriculture Forest and Fishery approved prolonged MD as a subsidized program to reduce GHG emissions from agriculture. Prolonged MD has now been applied to approximately 50% of rice paddy fields in Shiga Prefecture. Till date, prolonged MD has been approved in five prefectures (Shiga, Kyoto, Oita, Iwate, and Ishikawa), and its approval is expected to be extended to more prefectures.

TECHNICAL MEASURES TO MITIGATE GREENHOUSE GASES FROM AGRICULTURAL FIELDS
110
Fig. 1. CH4 reduction rate (% of conventional mid-season drainage) by
prolonged mid-season drainage at nine sites.
Biochar effects on crop productivity and greenhouse gas emissions from Andosol fields To assess the effect of biochar application on crop productivity and global warming potential, a 4-year field experiment was conducted in a well-drained Andosol field in Hokkaido (Koga et al., 2017). Wood residue-derived biochar (pyrolyzed at >800°C) was applied at the rates of 0, 10, 20, and 40 Mg ha-1 for potatoes, winter wheat, sugar beet, and soybeans cultivated in rotation, and CO2, N2O, and CH4 emissions, yield, and the quality of harvested materials were assessed.
Biochar application, regardless of the rate, had no significant influence on yield and the quality of the harvested materials, except for soybean grain yield that increased at 40 Mg ha-1 of application rate. Moreover, it had no significant effect on cumulative CO2, N2O, and CH4 emissions from the soil. The net ecosystem C budget during the study period increased with the rate of biochar application from −3.55 ± 0.19 Mg C ha-1 without biochar application to 4.89 ± 0.46, 13.4 ± 0.3, and 29.9 ± 0.4 Mg C ha-1 at the application rates of 10, 20, and 40 Mg ha-1, respectively. As a consequence, the application of wood residue-derived biochar to Andosol has great
Site

TECHNICAL MEASURES TO MITIGATE GREENHOUSE GASES FROM AGRICULTURAL FIELDS
111
potential for mitigating global warming through enhanced soil C sequestration without sacrificing crop productivity.
Another field experiment at an Andosol field in Tsukuba also confirmed that the application of biochar at a rate of 25 Mg ha-1 in four different feedstocks (rice husk, bamboo, hardwood, and wood briquettes of mixed hardwood and softwood) had no effect on N2O and CH4 emissions or crop productivity of spinach and Brassica SP (Yamamoto et al., submitted). Changes in soil organic carbon (SOC) after >10 years of continuous organic matter application to orchards in Japan Orchards are typically managed with no-till, ground-cover vegetation (e.g., cover crops and weeds), manure application, and long-term cultivation. Therefore, orchards are considered to have a larger potential for soil C storage than other types of agricultural lands. To investigate the effect of organic matter application on soil C sequestration in orchards, long-term field experiments (>10 years) were conducted at three sites (Tsukuba, Yamanashi, and Omura), which were characterized by different fruit crop species, soil types, and climate (Sugiura et al., 2017). Treatments were as follows: (i) bare ground control cultivation (CC), in which synthetic fertilizer was applied and the ground was kept bare; (ii) sod culture, in which synthetic fertilizer was applied and the ground was covered by grass or weed; and (iii) organic amendment (OA), in which synthetic fertilizer and cattle manure (OAcat) or bark compost (OAbrk) were applied and the ground was kept bare. The application rates of organic matter in treatments (ii) and (iii) were 30 Mg ha-1 yr-1, except at Yamanashi (20–40 Mg ha-1).
Between the treatments, annual changes in SOC concentration were the highest in OA and the lowest in CC at all sites, with the organic amendment treatments indicating that the application of organic matter causes an increase in the SOC concentration. Mitigation of soil N2O emission by inoculation with a mixed culture of indigenous Bradyrhizobium diazoefficiens isolates in soybean fields Soybean is an important leguminous crop worldwide. Soybean hosts symbiotic nitrogen-fixing soil bacteria (rhizobia) in root nodules. In soybean ecosystems, N2O emissions often increase during decomposition of root nodules. Itakura et al. (2008) reported that inoculation of nosZ++ strains of B. diazoefficiens [mutants with increased N2O reductase (N2OR) activity] reduced N2O in a laboratory study.
Our results showed that N2OR can be used to mitigate N2O emissions

TECHNICAL MEASURES TO MITIGATE GREENHOUSE GASES FROM AGRICULTURAL FIELDS
112
0.0
0.1
0.2
0.3
control C110
N2O
emission
(kgN
/ha)
Treatment
from soybean fields during nodule decomposition by inoculation with nosZ++ strains of B. diazoefficiens (Itakura et al., 2013). Moreover, Akiyama et al. (2016) showed that N2O emissions during the harvest period could be reduced at the field scale by inoculation with a mixed culture of 125 indigenous nosZ+ strains of B. diazoefficiens USDA110 group (C110) isolated from 32 Japanese agricultural fields (Fig. 2). The results also suggested that nodule nitrogen (N) is the main source of N2O production during nodule decomposition. Isolating nosZ+ strains from local soybean fields would be more applicable and feasible than generating mutants for many soybean-producing countries.
Fig. 2. N2O emission during the harvest period from the control (without
inoculation) and C110 (inoculation with indigenous nosZ+ strains of B. diazoefficiens USDA110 group) in the field.
Effects of inhibitors and biochar on N2O emissions, nitrate leaching, and plant nitrogen uptake from urine patches of grazing animals on grasslands: a meta-analysis Excreta (urine and dung) patches on grazed grasslands are significant sources of N trace gas emissions and leaching. Nitrification inhibitors (NIs), urease inhibitors (UIs), and biochar have been shown to reduce N losses and increase N utilization in various agro-ecosystems. Although the effectiveness of NIs, UIs, or biochar on N losses or N utilization of chemical N fertilizers and manures have been evaluated in previous studies, there has been no comprehensive assessment on their effectiveness with respect to excreta patches of grazing animals on grassland. Thus, we analyzed the results of 44 studies (156, 65, 67, and 97 pair of comparison data of N2O emissions, NO3
− leaching, plant N uptake, and plant yields, respectively) to evaluate the effects of additives on N losses and uptake

TECHNICAL MEASURES TO MITIGATE GREENHOUSE GASES FROM AGRICULTURAL FIELDS
113
from excreta patches (Cai and Akiyama, 2016). Our results showed that, compared with urine patches without additives,
pyrazole derivatives (a NI), N-(n-butyl) thiophosphoric triamide (NBPT, a UI), and biochar did not affect N2O emissions, whereas dicyandiamide (DCD, a NI) and a combination of NBPT and DCD (NBPT + DCD) significantly reduced N2O emissions by 51% and 48%, respectively (Fig. 3). DCD and NBPT + DCD also significantly reduced NO3
− leaching (46% and 42%, respectively), and increased plant N uptake (14% and 15%, respectively) and plant yields (7% and 12%, respectively). Our findings suggest that the application of DCD was effective in decreasing N losses and increasing N utilization from urine patches, whereas NBPT + DCD would be a better option in order to avoid potential increases in ammonia emissions following DCD application. However, the effect on environment and human health of inhibitor application should be evaluated.
Fig. 3. Effects of inhibitors and biochar (relative to the control) on N2O
emissions (a), NO3− leaching amounts (b), above-ground plant N
uptake rates (c), and above-ground plant yields (d) from urine
patches. Mean effects and bias-corrected 95% confidence intervals
are shown. Numerals indicate the number of data. DCD(L):
dicyandiamide in liquid form; DCD(Z): dicyandiamide coated with
zeolite; PD: pyrazole derivatives in liquid form; Biochar:
biomass-derived charcoal; NBPT: N-(n-butyl) thiophosphoric
triamide in liquid form; NBPT + DCD(L): both NBPT and DCD in liquid
form; and NBPT + DCD(Z), both NBPT and DCD coated with zeolite.
CONCLUSION AND FURTHER RESEARCH The mitigation technique of CH4 emission from paddy rice fields by prolonged MD developed by Ito et al. (2011) became widely adopted by farmers after the Ministry of Agriculture, Forestry and Fisheries approved prolonged MD as a subsidized program to reduce GHG emissions from

TECHNICAL MEASURES TO MITIGATE GREENHOUSE GASES FROM AGRICULTURAL FIELDS
114
agriculture. Our research project continues to develop additional mitigation options to reduce GHG emissions from Japanese agricultural soil, such as the mitigation of CH4 emissions from paddy fields by dry-seeding or carrying out MD in the Hokkaido region, the mitigation of N2O emissions from upland fields by the use of NIs, and evaluating GHG emissions by life cycle assessment from animal waste treatment and the application of slurry or composted manure to grasslands.
REFERENCES Akiyama, H, Y.T. Hoshino, M. Itakura, Y. Shimomura, Y. Wang, A.
Yamamoto, K. Tago, Y. Nakajima, K. Minamisawa, and M. Hayatsu. 2016. Mitigation of soil N2O emission by inoculation with a mixed culture of indigenous Bradyrhizobium diazoefficiens, Scientific Reports.
Cai, Y. and H. Akiyama. 2016. Nitrogen loss factors of nitrogen trace gas emissions and leaching from excreta patches in grassland ecosystems: A summary of available data, Science of the Total Environment 572, 195.
Itakura, M, Y. Uchida, H. Akiyama, T.T. Hoshino, Y. Shimomura, S. Morimoto, K. Tago, Y. Wang, C. Hayakawa, Y. Uetake, C. Sanchez, S. Eda, M. Hayatsu, and K. Minamisawa. 2013. Mitigation of nitrous oxide emissions from soils by Bradyrhizobium japonicum inoculation, Nature Climate Change 3, 208-212.
Itakura, M., K. Tabata, S. Eda, H. Mitsui, K. Murakami, J. Yasuda, and K. Minamisawa. 2008. Generation of Bradyrhizobium japonicum mutants with increased N2O reductase activity by selection after introduction of a mutated dnaQ Gene. Applied and Environmental Microbiology 74, 7258-7264.
Itoh, M, S. Sudo, S. Mori, H. Saito, T. Yoshida, Y. Shiratori, S. Suga, N. Yoshikawa, Y. Suzue, H. Mizukami, T. Mochida, and Yagi K. 2011. Mitigation of methane emissions from paddy fields by prolonging midseason drainage, Agriculture Ecosystems and Environment 141, 359-372.
Koga, N., S. Shimoda, and Y. Iwata. 2017. Biochar impacts on crop productivity and greenhouse gas emissions from an Andosol, Journal of Environmental Quality 46, 27-35.
Sugiura, H., H. Inoue, O. Kato, T. Tezuka, S. Furuya, and T. Furukawa. 2017. Changes in soil organic carbon after more than ten years of continuous organic matter application in orchards in Japan, Journal of Agricultural Meteorology, 73, 68-72.
Yan, X, K. Yagi, H. Akiyama, and H. Akimoto. 2005. Statistical analysis of the major variables controlling methane emission from rice fields, Global Change Biology, 11, 1131–1141.

EFFORTS OF NIAES/NARO IN APPLYING GREENHOUSE GAS MITIGATION TECHNOLOGIES TO MONSOON ASIAN COUNTRIES AND INTERNATIONAL FRAMEWORKS SINCE 2011
115
EFFORTS OF NATIONAL INSTITUTE FOR AGRO-ENVIRONMENTAL SCIENCES/NATIONAL
AGRICULTURE AND FOOD RESEARCH ORGANIZATION IN APPLYING GREENHOUSE GAS
MITIGATION TECHNOLOGIES TO MONSOON ASIAN COUNTRIES AND INTERNATIONAL FRAMEWORKS
SINCE 2011
Yasukazu Hosen1, Kazunori Minamikawa1,2,
Shigeto Sudo1, Yasuhito Shirato1, and Ayaka W. Kishimoto-Mo1
1Institute for Agro-Environmental Sciences (NIAES),
National Agriculture and Food Research Organization (NARO),
Tsukuba, Japan 2Japan International Research Center for Agricultural Sciences,
Tsukuba, Japan
E-mail: [email protected]
ABSTRACT
Over the past number of years, the National Institute for Agro-Environmental Sciences (NIAES), which was integrated into the National Agriculture and Food Research Organization (NARO) in April 2016 to form NIAES/NARO, has examined the widespread application of climate change mitigation technologies to many monsoon Asian countries. To encourage the dissemination of these technologies, NIAES/NARO has also formulated guidelines and a handbook. In addition, NIAES/NARO has made positive contributions through its involvement in many international frameworks, such as the Global Research Alliance on Agricultural Greenhouse Gases, Intergovernmental Panel on Climate Change, and The 4 per 1000 Initiative. In these endeavors, NIAES/NARO has achieved success with respect to the specific contents of individual research fields, moving toward a direction of generalization of obtained results. In the next step, to increase the applicability of research results to the society, should NARO consider site-specific efforts more, thus incorporating the evaluation indicators of broader research fields and multiple stakeholders?

EFFORTS OF NIAES/NARO IN APPLYING GREENHOUSE GAS MITIGATION TECHNOLOGIES TO MONSOON ASIAN COUNTRIES AND INTERNATIONAL FRAMEWORKS SINCE 2011
116
Keywords: NIAES, NARO, GHG mitigation technology, China, India, Indonesia, Philippines, Thailand, Vietnam, GRA, IPCC, the 4 per 1000 Initiative
INTRODUCTION
Efforts to mitigate cross-border climate change have a limited effect when only local/domestic measures are applied. Therefore, it is important to consider the regional application of climate change mitigation technologies and to encourage their dissemination within the region. Based on this idea, by targeting monsoon Asian countries, where rice is an important agricultural crop as in Japan, NIAES/NARO has been trying to apply developed technologies to reduce greenhouse gas (GHG) emissions from agricultural lands, particularly rice paddies. In addition, NIAES/NARO has been aiming to create guidelines and handbooks to help disseminate these technologies and to actively contribute to international efforts through its involvement in international frameworks. This review highlights some of the major achievements of NIAES/NARO in the aforementioned fields since 2011 and also reviews its activities to consider future directions for research and practical applications.
APPLICATION OF GHG EMISSION-REDUCTION TECHNOLOGIES TO
MONSOON ASIAN FARMLANDS AND EVALUATION
OF THEIR IMPACT
NIAES/NARO has been applying GHG emission-reduction technologies in many monsoon Asian countries to demonstrate the applicability of these technologies. The following are some of the major achievements of NIAES/NARO in these countries since 2011. A multi-country on-site demonstration of GHG emission-reduction effect by introducing a water-saving irrigation technology (AWD) in irrigated paddy fields in Vietnam, Thailand, the Philippines, and Indonesia Field experiments were performed in cooperation with the International Rice Research Institute, the Philippines; University of Agriculture and Forestry, Hue University, Vietnam; the Joint Graduate School of Energy and Environment, King Mongkut’s University of Technology, Thonburi, Thailand; the Philippine Rice Research Institute; and the Indonesian Agricultural Environment Research Institute, in a research project financially

EFFORTS OF NIAES/NARO IN APPLYING GREENHOUSE GAS MITIGATION TECHNOLOGIES TO MONSOON ASIAN COUNTRIES AND INTERNATIONAL FRAMEWORKS SINCE 2011
117
supported by the Ministry of Agriculture, Forestry and Fisheries of Japan (MAFF; FYs 2013–2017). The GHG emission-reduction effects of an intermittent-irrigation technology, called “alternate wetting and drying” (AWD) that has been disseminated across rice-producing countries, mainly Asia, were demonstrated. Under AWD irrigation control, irrigation water is not applied until the soil moisture decreases to a certain level (e.g., until the field water level drops to 15 cm below the soil surface) after the standing water has been disappeared, except during some specific periods. As aeration of the shallow soil is normally performed multiple times during the cropping period under this irrigation control strategy, the application of the AWD irrigation method is believed to contribute to the reduction in methane (CH4) emissions generated under anaerobic conditions. However, the quantitative effects of this strategy under diverse Asian rice paddy environments had not been fully elucidated till date. Therefore, field trials were conducted at four sites in Southeast Asia (Hue, Vietnam; Prachinburi, Thailand; Muñoz, the Philippines; and Jakenan, Indonesia) for 3 years to evaluate the effects of introducing AWD to irrigated rice paddies (each with two cropping seasons, i.e., the dry and rainy seasons), using GHG emissions, rice productivity, and water use as indicators. In the experiments, the following two types of AWD treatments were compared with the conventional continuous flooding (CF) treatment. All treatments involved no artificial draining except just before harvesting.
- Safe AWD: In this technique, irrigation is performed only when the field water level drops to 15 cm below the soil surface, except during some specific periods (saturated just after sowing, flooded during the heading period in some cropping seasons at certain experimental sites, and/or flooded at topdressing in most cropping seasons).
- Site-specific AWD: This is a modification of the safe AWD according to the recommendations of the researchers in charge of each field trial.
The results indicated that, although CH4 emissions significantly differed
between the target sites because of differences in soil characteristics and fertilizer management between sites, the volume of CH4 emissions was reduced by AWD (considering both Safe AWD and Site-specific AWD, collectively referred to “AWD” in the rest of this paragraph) at all times compared with CF, except for the wet season in the Philippines; because the area around the experimental site in the Philippines was continuously flooded throughout the wet season, no difference in field water management was made between AWD and CF. The average reduction in GHG emission, excluding that observed during the wet season in the Philippines, was 31%. The yield of the representative rice variety of each target site did not

EFFORTS OF NIAES/NARO IN APPLYING GREENHOUSE GAS MITIGATION TECHNOLOGIES TO MONSOON ASIAN COUNTRIES AND INTERNATIONAL FRAMEWORKS SINCE 2011
118
significantly decrease in any cropping season because of the application of AWD, and the volume of water used (including both irrigation water and precipitation) was 6%–47% (for the dry season) and 6%–17% (for the wet season) lower for AWD compared with those for CF (Chidthaisong et al., 2018; Setyanto et al., 2018; Sibayan et al., 2018; Tirol-Padre et al., 2018; and Tran et al., 2018).
On-site verification of the effect of the System of Rice Intensification (SRI) in a South Asian irrigated paddy field This research was financially supported by the Ministry of the Environment, Japan.
SRI is a methodology that aims to increase the yield of rice by minimizing anaerobic soil conditions and by using younger seedlings singly that are optimally and widely spaced. SRI was first developed in the 1980s by Fr. Henri de Laulanié S.J. in Madagascar (Laulanié et al. 2011) and has been tested and disseminated with the help of scientists such as those from the Cornell University; however, the effectiveness of SRI has been under debate between supporters and critics of the system. To reach a consensus, the effects of introducing SRI were evaluated in Tamil Nadu, South India, wherein SRI has been already been used, by employing rice productivity, water use, and GHG emissions as indicators.
A significant yield increase effect achieved by SRI, which SRI supporters had argued as the main benefit of SRI introduction, was not observed. On the contrary, water use was reduced by 48%–49% (dry season) to 79%–80% (wet season), and GHG emissions (total CO2-equivalents of CH4 and N2O emissions) were reduced by 41%–48% (dry season) to 24%–26% (wet season) with the introduction of rice-cropping technologies combined with widely spaced transplanting of young seedlings and/or AWD water-saving irrigation (Oo et al., 2018).
On-site demonstration of the effect on annual GHG emissions of introducing dry-season cropping to a rainfed rice field in Thailand In the rainfed rice paddies of Thailand, usually no crop is cultivated during the dry season. During a five-year field experiment, the effect on CH4 and N2O emissions and on soil carbon stocks following the introduction of dry-season cropping to a rainfed rice field in Thailand was evaluated. The results indicated that GHGs equivalent to 38 t CO2 ha-1 y-1 (total CO2-equivalents of CH4 and N2O emissions and soil carbon reduction, as used for the rest of this paragraph) were annualy emitted when irrigated rice cropping was introduced in the dry season. On the contrary, when maize/sorghum cropping was

EFFORTS OF NIAES/NARO IN APPLYING GREENHOUSE GAS MITIGATION TECHNOLOGIES TO MONSOON ASIAN COUNTRIES AND INTERNATIONAL FRAMEWORKS SINCE 2011
119
introduced in the dry season, annual GHG emissions reduced to approximately one-quarter of that achieved by introducing irrigated rice cropping in the dry season. Analyzing GHG emissions showed that CH4 emissions from maize/sorghum cropping compared with those from rice cropping were significantly lower; however, there was no significant impact of maize/sorghum cropping on soil carbon content (Cha-un et al., 2017).
CREATION OF GUIDELINES AND A HANDBOOK FOR
TECHNOLOGY DISSEMINATION As described above, NIAES/NARO has been applying GHG emission-reduction technologies to many monsoon Asian countries to demonstrate the applications of these technologies. “Know-how” gained through the demonstration activities needed to be summarized in a form that anyone can use. “Guidelines for measuring CH4 and N2O emissions from rice paddies with a manually operated closed chamber method” and “Handbook of monitoring, reporting, and verification for a greenhouse gas mitigation project with water management in irrigated rice paddies” were published in 2015 and 2018, respectively. “Guidelines for measuring CH4 and N2O emissions from rice paddies with a manually operated closed chamber method” As with the multi-country on-site demonstrations described above, these guidelines (Minamikawa et al., 2015) are a product of the research project supported financially by MAFF (FYs 2013–2017). A manually operated gas sampling chamber is commonly used to monitor GHG fluxes from paddy fields. Several manuals on this method had been published in the 1990s, following which little noticeable publicity was observed. On the other hand, each researcher/research group established their own measurement methods empirically in respect to their particular local field conditions, as described in Minamikawa et al. (2015). Therefore, guidelines suitable to different rice-cropping areas were created. The guidelines had the following features:
• The guidelines were developed based on requests from the Paddy Rice Research Group of the Global Research Alliance on Agricultural Greenhouse Gases (GRA), an international research network based on intergovernmental agreement. The guidelines were approved at the Asia Sub-group meeting held in September 2015, and could be viewed and downloaded for free from the GRA website (Minamikawa et al., 2015).
• The guidelines are not rigidly applied uniform measurement methods based on the most advanced technologies but were prepared assuming

EFFORTS OF NIAES/NARO IN APPLYING GREENHOUSE GAS MITIGATION TECHNOLOGIES TO MONSOON ASIAN COUNTRIES AND INTERNATIONAL FRAMEWORKS SINCE 2011
120
that measurements could and should be adapted to the circumstances and conditions of each particular site (regardless of the procurement status of experimental materials, tools, equipment, or the like).
• The document comprises a summary of “recommendations” and “evolving issues” as well as seven chapters. Chapters 2 to 7 cover topics ranging from “experimental design” at the preparation stage to “data processing” after completion of the measurements.
• Advice, gleaned from years of experience of measuring GHG emissions in Japan, is included in the document, aimed at improving the skills of the technicians.
• The guidelines facilitate the estimation of the GHG emissions from paddy fields with the necessary accuracy to develop and quantitatively evaluate measures for the reduction of emissions.
“Handbook of monitoring, reporting, and verification for a greenhouse gas mitigation project with water management in irrigated rice paddies” As with the guidelines, this handbook (Minamikawa et al., 2018) is a product of the GRA research project supported financially by MAFF (FYs 2013–2017). Social implementation (by dissemination to producers) of global warming mitigation measures in the agricultural sector has not progressed satisfactorily and further promotion is required to achieve substantial GHG emission reductions. The Paris Agreement, which came into effect in 2016, proposes the use of institutional emission-reduction plans in developing countries, such as emissions trading and nationally appropriate mitigation actions. In Asian rice-producing countries, in particular, CH4 emissions from paddy fields account for a significant proportion of the anthropogenic GHG emissions, and the expectations for an institutional emission-reduction plan are therefore considerable. However, the methodology for “monitoring, reporting, and verification (MRV),” which is essential for institutional implementation, has not been established sufficiently in the agricultural sector, unlike the situation in the industrial sector. Consequently, an English language MRV handbook, that can be used to institutionally implement a project for CH4 emission reduction via water management in irrigated rice paddies, was prepared, and has been available on the NARO and GRA websites (Minamikawa et al., 2018).
The handbook has the following features:
• Scientific and quantitative descriptions are emphasized, assuming emissions trading and the like that require the rigorous institutional design of MRV methodology, and problems on the current situation in

EFFORTS OF NIAES/NARO IN APPLYING GREENHOUSE GAS MITIGATION TECHNOLOGIES TO MONSOON ASIAN COUNTRIES AND INTERNATIONAL FRAMEWORKS SINCE 2011
121
the institutional design development are described. • In addition to the global warming mitigation effect, an advantage for
producers is a shortcut to implementation and dissemination of mitigation measures. In the introduction, the practical mitigation measures to achieve social implementation are categorized into three types (voluntary, semi-institutional, and institutional), their respective characteristics are described, and the importance of an institutional approach from the viewpoint of the amount of emission reduction achieved is indicated.
• Paddy fields are non-point sources of CH4, and the emissions fluctuate significantly with respect to time and space. In Chapter 3, it is clearly stated that the rate of CH4 emission reduction by appropriate water management strategies needs to be calculated conservatively taking into account various uncertainties.
• The costs for implementing MRV need to be reduced in future, taking into consideration a balance between cost and the accuracy of the calculations. In Chapter 3, in addition to the calculation method using the emission factor based on measurements taken at the site, a calculation method using mathematical models is introduced. This calculation has received attention in recent years.
CONTRIBUTION THROUGH INTERNATIONAL FRAMEWORKS
In addition to above-mentioned activities, NIAES/NARO has also been contributing actively to international efforts through international frameworks, such as Global Research Alliance on Agricultural Greenhouse Gases (GRA), Intergovernmental Panel on Climate Change (IPCC), and “The 4 per 1000 Initiative,” as follows. Contribution through Global Research Alliance (GRA) on agricultural greenhouse gases GRA is an initiative to strengthen the ties among people and countries faced with agricultural GHG challenges. At a side event of the 15th Conference of the Parties to the United Nations Framework Convention on Climate Change (COP 15), held in Copenhagen in December 2009, the establishment of GRA was declared jointly by 21 countries including Japan, and in June 2011 at the GRA Ministerial Summit in Rome, the GRA was launched formally by the signing of its charter by 32 countries (the number of member countries as of February 2019 had increased to 56). NIAES/NARO has been intensely involved in GRA activities together with MAFF from before its official launch, such as by leading the activities of GRA’s Paddy Rice Research
EFFORTS OF NIAES/NARO IN APPLYING GREENHOUSE GAS MITIGATION TECHNOLOGIES TO MONSOON ASIAN COUNTRIES AND INTERNATIONAL FRAMEWORKS SINCE 2011
122
Group (PRRG) and acting as Chairperson of the group (co-chaired with Uruguay since June 2011). Staff members of NIAES/NARO have contributed to the activities of PRRG by attending and hosting various meetings, including the following official meetings as Chairperson/Co-Chairperson of PRRG, etc.:
Feb 2010 (Tokyo, Japan) A meeting at MAFF when Mr. Groser, NZ Trade Minister, visited MAFF to request Japan to join GRA
Apr 2010 (Wellington, NZ) A meeting to launch GRA Sep 2010 (Tsukuba, Japan) MARCO/GRA Joint Workshop on Paddy
Field Management and Greenhouse Gases Mar 2011 (Versailles, France) The 2nd high-level official meeting/PRRG
Meeting Jun 2011 (Rome, Italy) GRA Minister Summit/Council Meeting Nov 2011 (Tsukuba, Japan) PRRG Meeting Jun 2012 (Saskatoon, Canada) Council Meeting Jun 2013 (Montevideo, Uruguay) Council Meeting/PRRG International
Workshop Oct 2013 (Bogor, Indonesia) PRRG Meeting May 2014 (Cali, Colombia) PRRG Meeting Jun 2014 (The Hague, Netherlands) Council Meeting Aug 2014 (Los Baños, Philippines) PRRG Meeting Mar 2015 (Pelotas, Brazil) PRRG Americas Sub-Group Meeting Sep 2015 (Nanjing, China) PRRG Asia Sub-Group Meeting Nov 2015 (Des Moines, USA) Council Meeting Jul 2016 (Stuttgart, USA) PRRG Americas Sub-Group Meeting Oct 2016 (Mexico City, Mexico) Council Meeting Aug 2017 (Tsukuba, Japan) Council Meeting/JIRCAS-NARO
International Symposium “Agricultural Greenhouse Gas Mitigation”
Sep 2017 (Tsukuba, Japan) PRRG Asia Sub-Group Meeting May 2018 (Piura, Peru) PRRG Americas Sub-Group Meeting Sep 2018 (Berlin, Germany) Council Meeting Oct 2018 (Bangkok, Thailand) Workshop “Rice landscapes and climate
change –options for mitigation in rice-based agroecosystems and the scaling-up of climate-smart rice cultivation technologies in Asia”/ PRRG Asia Sub-Group Meeting
Nov 2018 (Parral, Chile) Capacity Building on Management Technologies for Climate-Smart Rice Cultivation in the South-East Asian and Latin American Rice Sector
In addition, one of the objectives of the MAFF-funded research project

EFFORTS OF NIAES/NARO IN APPLYING GREENHOUSE GAS MITIGATION TECHNOLOGIES TO MONSOON ASIAN COUNTRIES AND INTERNATIONAL FRAMEWORKS SINCE 2011
123
mentioned above was to support GRA activities. The project, implemented together with the researchers of the GRA-PRRG participating countries, is well recognized by stakeholders as one of the main activities of the GRA.
Other than PRRG, there are currently three research groups (Croplands,
Livestock, and Integrative Research Groups [CRG, LRG, and IRG, respectively]) in GRA, and NIAES/NARO has been registered as the national contact institution of Japan for all the research groups, except LRG. In CRG, staff members of NIAES/NARO have been contributing to the activities of the Managing Agricultural Greenhouse Gases Network (MAGGnet), which is one of the main activities of CRG utilizing the GRA network. MAGGnet is an attempt to compile metadata from field experimental sites worldwide where GHG fluxes and soil carbon dynamics are monitored, and to share the data widely. Since 2012, MAGGnet has compiled more than 337 metadata from field experimental sites in 23 countries, including 19 sites in Japan (Liebig et al., 2016). In addition, staff members of NIAES/NARO have attended meetings and contributed to the activities of research groups other than PRRG, such as attending the following meetings:
Nov 2010 (Long Beach, USA) CRG Meeting Jul 2011 (Leuven, Belgium) Cross-cutting activity (current IRG) C-N
Cycles Workshop Oct 2011 (San Antonio, USA) CRG Meeting Jul 2012 (Bari, Italy) CRG and C-N Cross-cutting Working Group
(current IRG) Joint Meeting Nov 2013 (Tampa, USA) CRG Meeting Mar 2014 (Paris, France) C-N Cross-cutting Working Group (current
IRG) Workshop “Experimental databases and model of N2O emissions by croplands: Do we have what is needed to explore mitigation options?”
Jun 2014 (Wageningen, Netherland) Cross-cutting (current IRG) activity C-N Cycles Workshop
Aug 2014 (Debrecen, Hungary) CRG Meeting Jul 2015 (Brasilia, Brazil) CRG, Inventory (current IRG), and
Monitoring Cross-Cutting Group (current IRG) Joint Meeting
Nov 2016 (Phoenix, USA) CRG Meeting Jan 2018 (Paris, France) IRG Meeting

EFFORTS OF NIAES/NARO IN APPLYING GREENHOUSE GAS MITIGATION TECHNOLOGIES TO MONSOON ASIAN COUNTRIES AND INTERNATIONAL FRAMEWORKS SINCE 2011
124
Contribution to the creation of IPCC guidelines for greenhouse gas inventories In compiling the “2013 IPCC Wetland Supplemental Guidelines” (Wickland et al., 2014), one of the NIAES staff members has contributed as a Lead Author, including attendance at the following Lead Author Meetings (LAMs):
Nov 2011 (Hayama, Japan) 1st LAM Feb 2012 (Victoria Falls, Zimbabwe) 2nd LAM Jul 2012 (Dublin, Ireland) 3rd LAM May 2013 (Manaus, Brazil) 4th LAM
At the time of preparing “2013 Revised Supplementary Methods and Good Practice Guidance Arising from the Kyoto Protocol” (IPCC, 2014), one of the NIAES staff members has contributed as a review editor, including attendance at the following meetings:
Mar 2013 (Oslo, Norway) 3rd LAM Jul 2013 (Chiang-Mai, Thailand) 4th LAM Oct 2013 (Batumi, Georgia) Thirty-Seventh Session of the IPCC
(IPCC-37) and the Meeting of Coordinating Lead Authors and Review Editors for the “2013 Revised Supplementary Methods and Good Practice Guidance Arising from the Kyoto Protocol” preparation for discussion at the IPCC-37.
Two lead authors from NARO have participated in the ''2019 Refinement to the 2006 IPCC Guidelines for National Greenhouse Gas Inventories''. They have been contributing, e.g., by attending the LAMs listed below:
Jun 2017 (Bilbao, Spain) 1st LAM Sep 2017 (Victoria Falls, Zimbabwe) 2nd LAM Apr 2018 (Cairns, Australia) 3rd LAM Oct 2018 (Rome, Italy) 4th LAM
Contribution through “The 4 per 1000 Initiative” At the “The 4 per 1000 Initiative” established at the initiative of France at COP 21 (Paris) at the end of 2015, one of the NARO staff members has been participating as one of the 14 members of the Scientific and Technical Committee (STC) that provides scientific advice. The initiative was launched with the slogan that, if 0.4% of soil carbon could be increased every year, it

EFFORTS OF NIAES/NARO IN APPLYING GREENHOUSE GAS MITIGATION TECHNOLOGIES TO MONSOON ASIAN COUNTRIES AND INTERNATIONAL FRAMEWORKS SINCE 2011
125
would stop the rise of the atmospheric CO2 concentration. This staff member has been contributing, e.g., by attending and hosting the following meetings:
Nov 2016 (Marrakech, Morocco) 1st Consortium of Members Meeting (CMM)/1st Forum of Partners Meeting (FPM)/1st Meeting of STC (STCM)
Feb 2017 (Tsukuba, Japan) NARO-MARCO International Symposium “Soil Carbon Sequestration: Needs and prospects under the 4 per 1000 initiative”
Mar 2017 (Rome, Italy) 2nd STCM Jun 2017 (Montpellier, France) 2nd CMM/3rd STCM Nov 2017 (Bonn, Germany) 3rd CMM/2nd FPM/4th STCM Jun 2018 (Madrid, Spain) 5th STCM Dec 2018 (Katowice, Poland) 4th CMM/3rd FPM/6th STCM
In association, the Asian Long-Term Experiment Network for Agriculture
was launched and its homepage (http://www.naro.affrc.go.jp/english/laboratory/niaes/altena/index.html) was created.
CONCLUSION In all the endeavors mentioned above, NIAES/NARO has achieved success. Such efforts should be continued into the future. On the other hand, it should be considered whether the effort may have been biased toward the specific contents of certain research fields and whether the research results may have been biased somewhat toward a direction of generalization of obtained results. As science is rule-based, and systematic knowledge in the first place has been revealed by empirical procedures, such as observation and experimentation, it is natural and necessary for NARO to be ever-conscious of the generalization of outcomes. However, particularly with respect to project research carried out on-site, it might be necessary to be more conscious of practical application trials and the social relevance aimed at developing site-specific technologies for the trial sites, utilizing the results and networks obtained so far. In order to carry this out efficiently, site-specific preliminary work will be important, such as selecting a target that can be expected to have widespread application and significant social influence if successful at that site. For that purpose, participation by experts in wider fields and consideration of the opinions of various stakeholders will become important.
Although the above are considerations for the future, a new research

EFFORTS OF NIAES/NARO IN APPLYING GREENHOUSE GAS MITIGATION TECHNOLOGIES TO MONSOON ASIAN COUNTRIES AND INTERNATIONAL FRAMEWORKS SINCE 2011
126
project commissioned by MAFF, which was launched in late November 2018, could be a good starting point for consideration. Under this research project, rice cultivation techniques (including organic matter usage and variety selection) for monsoon Asia that could realize the long-term maintenance of the soil carbon and nitrogen contents and the present yield status while reducing by 30% the total CH4 and N2O emissions (converted into CO2-equivalents) will be developed. This will be achieved through (1) evaluation of GHG emission-reduction technologies based on field observations, (2) evaluation of soil carbon and nitrogen storage and their dynamics, and (3) long-term estimation of GHG emission-reduction effects, using mathematical models.
REFERENCES Cha-un, N., A. Chidthaisong, K. Yagi, S. Sudo, and S. Towprayoon. 2017.
Greenhouse gas emissions, soil carbon sequestration and crop yields in a rain-fed rice field with crop rotation management. Agriculture Ecosystems & Environment 237:109–120. doi:10.1016/j.agee.2016.12.0 25.
Chidthaisong, A., N. Cha-un, B. Rossopa, C. Buddaboon, C. Kunuthai, P. Sriphirom, S. Towprayoon, T. Tokida, A. Tirol-Padre, and K. Minamikawa. 2018. Evaluating the effects of alternate wetting and drying (AWD) on methane and nitrous oxide emissions from a paddy field in Thailand. Soil Science & Plant Nutrition 64(1):31–38. doi:10.1080/00380768.2017.1399044.
IPCC. 2014. 2013. Revised Supplementary Methods and Good Practice Guidance Arising from the Kyoto Protocol, T. Hiraishi, T. Krug, K. Tanabe, N. Srivastava, J. Baasansuren, M. Fukuda, and T.G. Troxler (eds). Published: IPCC, Switzerland.
Laulanié, H.D. 2011. Intensive Rice Farming in Madagascar. Tropicultura 29(3):183–187.
Liebig, M.A., A.J. Franzluebbers, C. Alvarez, T.D. Chiesa, N. Lewczuk, G. Piñeiro, G. Posse, L. Yahdjian, P. Grace, O. Machado Rodrigues Cabral, L. Martin-Neto, R. de Aragão Ribeiro Rodrigues, B. Amiro, D. Angers, X. Hao, M. Oelbermann, M. Tenuta, L.J. Munkholm, K. Regina, P. Cellier, F. Ehrhardt, G. Richard, R. Dechow, F. Agus, N. Widiarta, J. Spink, A. Berti, C. Grignani, M. Mazzoncini, R. Orsini, P.P. Roggero, G. Seddaiu, F. Tei, D. Ventrella, G. Vitali, A. Kishimoto-Mo, Y. Shirato, S. Sudo, J. Shin, L. Schipper, R. Savé, J. Leifeld, L. Spadavecchia, J. Yeluripati, S. Del Grosso, C. Rice, and J. Sawchik. 2016. MAGGnet: An international network to foster mitigation of agricultural greenhouse gases. Carbon Management 7: 243–248. doi:10.1080/17583004.2016.1180586.

EFFORTS OF NIAES/NARO IN APPLYING GREENHOUSE GAS MITIGATION TECHNOLOGIES TO MONSOON ASIAN COUNTRIES AND INTERNATIONAL FRAMEWORKS SINCE 2011
127
Minamikawa, K., T. Tokida, S. Sudo, A. Padre, and K. Yagi. 2015. Guidelines for measuring CH4 and N2O emissions from rice paddies by a manually operated closed chamber method. National Institute for Agro-Environmental Sciences, Tsukuba, Japan, 76 p. (http://www.naro.affrc.go.jp/archive/niaes/techdoc/mirsa_guidelines.pdf; Accessed 12 February 2019).
Minamikawa, K., T. Yamaguchi, T. Tokida, S. Sudo, and K. Yagi. 2018. Handbook of monitoring, reporting, and verification for a greenhouse gas mitigation project with water management in irrigated rice paddies. Institute for Agro-Environmental Sciences, NARO, Tsukuba, Japan, 42 p. (https://www.naro.affrc.go.jp/publicity_report/pub2016_or_later/files/MRV_guidebook.pdf; Accessed 12 February 2019).
Oo A.Z., S. Sudo, K. Inubushi, M. Mano, A. Yamamoto, K. Ono, T. Osawa, S. Hayashida, P.K. Patra, Y. Terao, P. Elayakumar, K. Vanitha, C. Umamageswari, P. Jothimani, and V. Ravi. 2018. Methane and nitrous oxide emissions from conventional and modified rice cultivation systems in South India. Agriculture Ecosystems & Environment 252:148–158. doi:10.1016/j.agee.2017.10.014.
Setyanto, P., A. Pramono, T.A. Adriany, H.L. Susilawati, T. Tokida, A. Tirol-Padre, and K. Minamikawa. 2018. Alternate wetting and drying reduces methane emission from a rice paddy in Central Java, Indonesia, without yield loss. Soil Science & Plant Nutrition 64(1):23–30. doi:10.1080/00380768.2017.1409600.
Sibayan, E.B., K. Samoy-Pascual, F.S. Grospe, M.E.D. Casil, T. Tokida, A. Tirol-Padre, and K. Minamikawa. 2018. Effects of alternate wetting and drying technique on greenhouse gas emissions from irrigated rice paddy in Central Luzon, Philippines. Soil Science & Plant Nutrition 64(1):39–46. doi:10.1080/00380768.2017.1401906.
Tirol-Padre, A., K. Minamikawa, T. Tokida, R. Wassmann, and K. Yagi. 2018. Site-specific feasibility of alternate wetting and drying as a greenhouse gas mitigation option in irrigated rice fields in Southeast Asia: A synthesis. Soil Science & Plant Nutrition 64(1):2–13. doi:10.1080/00380768.2017.1409602.
Tran, D.H., T.N. Hoang, T. Tokida, A. Tirol-Padre, and K. Minamikawa. 2018. Impacts of alternate wetting and drying on greenhouse gas emission from paddy fields in Central Vietnam. Soil Science & Plant Nutrition 64(1):14–22. doi:10.1080/00380768.2017.1409601.
Wickland, K.P., A.V. Krusche, R.K. Kolka, A.W. Kishimoto-Mo, R.A. Chimner, and Y. Serengil. 2014. Chapter 5. Inland wetland mineral soils. In: Hiraishi, T., Krug, T., Tanabe, K., Srivastava, N., Baasansuren, J., Fukuda, M. and Troxler, T.G. (eds) 2013 Supplement to the 2006 IPCC Guidelines for National Greenhouse Gas Inventories: Wetlands.

EFFORTS OF NIAES/NARO IN APPLYING GREENHOUSE GAS MITIGATION TECHNOLOGIES TO MONSOON ASIAN COUNTRIES AND INTERNATIONAL FRAMEWORKS SINCE 2011
128
Published: IPCC, Switzerland. (https://www.ipcc-nggip.iges.or.jp/public/wetlands/index.html; Acecessed 12
Feburary 2019).

BAYESIAN STATISTICAL MODELS FOR QUANTITATIVE SYNTHESIS OF CLIMATE CHANGE IMPACT STUDIES
129
BAYESIAN STATISTICAL MODELS FOR QUANTITATIVE SYNTHESIS OF CLIMATE CHANGE
IMPACT STUDIES
David Makowski
Institut National de la Recherche Agronomique,
Thiverval-Grignon, France Centre International de Recherche sur l'Environnement et le
Développement, Nogent-sur-Marne, France
E-mail: [email protected]
ABSTRACT
The amount of experimental and simulated data produced by scientists working on climate change impact assessment has grown exponentially during the last two decades. The growth of the literature on climate change was faster than the growth in other areas of research. Scientists are now facing a ‘data synthesis challenge’ making increasingly difficult the conduct of rigorous and comprehensive assessments. Quantitative research synthesis methods are needed to maintain a high level of credibility in the scientific assessments of climate change impacts and in the evaluation of mitigation strategies in agriculture. Here, I show that simple and efficient statistical tools could help climate and crop scientists to synthetize large sets of studies in order to provide the decision makers with reliable conclusions. More specifically, I demonstrate that Bayesian hierarchical statistical models constitute powerful tools for analyzing ensembles of experimental data. Through several examples, I illustrate how this type of statistical models can be fitted to large sets of studies for estimating the global effects of climate change on crop productions accounting for the relative accuracy of each individual study. Once fitted to data, these models can be easily run to explore a diversity of scenarios and analyze uncertainties in projections of crop responses to climate change. They can also be implemented to derive more plausible estimations of climate change impacts by constraining ensembles of process-based crop model outputs using experimental data. I advocate for the inclusion of this type of statistical model in the tool boxes of scientists working on climate change impact assessment. More rigorous quantitative syntheses could help scientists to promote evidence-based decision making.

BAYESIAN STATISTICAL MODELS FOR QUANTITATIVE SYNTHESIS OF CLIMATE CHANGE IMPACT STUDIES
130
Keywords: Bayesian, climate change, crop yield, meta-analysis, meta-model, hierarchical model
INTRODUCTION
The number of papers published on climate change is increasing exponentially. In this area of science, the annual growth rate of the number of published papers is about equal to 16%, i.e., much larger than the rate of 4% measured over all scientific domains (Minx et al. 2017). Scientists and decision makers are now facing a « data synthesis challenge »; as more and more data become available, how to conduct rigorous and comprehensive assessments on climate change?
This challenge is made difficult by the explosion of the number of papers published on climate change. At the time of the first assessment report (AR) cycle of the Intergovernmental Panel on Climate Change (IPCC) (1986-1990), 1697 studies on climate change were referenced in ISI Web of knowledge while 108277 were available at the time of the fifth AR cycle (2008-2013) (Minx et al., 2017). Only a fraction of these published studies was cited in the reports of IPCC. Although 63% of the published literature was cited in the first report (AR1) of IPCC, only 23% of the available studies was cited in the 5th assessment report (Minx et al., 2017). This result reveals that scientists are now overwhelmed by the number of publications and have difficulties to conduct rigorous and comprehensive literature synthesis.
Reliable methods are required to help scientists delivering high quality syntheses to decision makers. Meta-analysis is one of most powerful method for quantitative synthesis. Meta-analysis consists in analyzing a large collection of results from individual studies for the purpose of integrating the findings (Albert and Makowski, 2018; Borenstein et al., 2009; Makowski et al., 2018). It includes a systematic review of existing studies and a statistical analysis of the data extracted from these studies. The first step of a meta-analysis is to conduct a systematic review and to select relevant studies. The systematic review produces a set of studies dealing with a specific topic. Here, I will consider a specific problem related to climate change impact on crop yield, i.e., the estimation of the percentage of yield loss resulting from an increase of the temperature during the growing season. In this specific case, each study corresponds to one paper reporting the results of a specific experiment conducted to measure the effect of a temperature increase on crop yield. At the second step, the extracted data are used to compute the effect size for each individual study separately (here, the yield loss or yield grain resulting from +1°C), and the result is a set of individual effect sizes covering the set of selected studies. The third step is to estimate the mean effect size, i.e., the weigthed average of all individual effect sizes. The mean

BAYESIAN STATISTICAL MODELS FOR QUANTITATIVE SYNTHESIS OF CLIMATE CHANGE IMPACT STUDIES
131
effect size (MES) summarized the results across all studies. A confidence interval is computed to show the level of uncertainty in the estimated MES. The MES is a single number summarizing the whole dataset, but the individual effect sizes may vary a lot between studies and take values well below or above the MES depending on the study characteristics. In such case, it is sometimes possible to explain part of the between-study variability of the individual effect sizes using one or several covariates.
In this paper, I show how simple hierarchical Bayesian statistical models can help scientists to estimate the effect of temperature increase on crop yield from large sets of field warming experiments. I advocate for the inclusion of this type of statistical model in the tool boxes of scientists working on climate change impact assessment.
DATA
In order to illustrate the flexibility of the proposed approach, I consider here two datasets successively, one on rice and one on wheat.
The rice dataset includes 83 values of yield sensitivity calculated from the results of field warming experiments located in different sites in several countries (Zhao et al. 2016a). Data were extracted from each published study in turn. On each site, yield data were collected during several years. For each site-year, yield was measured in a field control (under ambient temperature) and in an adjoined field with an increased temperature ΔT. For each site-year, the two yield observations were used to compute the following relative yield difference
Δ𝑌 =𝑌𝑖𝑒𝑙𝑑 𝑤𝑖𝑡ℎ 𝑖𝑛𝑐𝑟𝑒𝑎𝑠𝑒𝑑 𝑡𝑒𝑚𝑝𝑒𝑟𝑎𝑡𝑢𝑟𝑒 − 𝑌𝑖𝑒𝑙𝑑 𝑖𝑛 𝑐𝑜𝑛𝑡𝑟𝑜𝑙
𝑌𝑖𝑒𝑙𝑑 𝑖𝑛 𝑐𝑜𝑛𝑡𝑟𝑜𝑙
and, then, the yield sensitivity equal to 𝑆 = 100 ∗ Δ𝑌/ΔT . The yield sensitivity S measures the yield change in % resulting from +1°C.
The wheat dataset (Zhao et al., 2016b) includes the same type of data for wheat. Yield data were collected in field warming experiments located in 14 sites in China. Several years of data are available in each site, and a yield sensitivity was calculated for each site-year as explained above. The total number of sensitivity values available for wheat is equal to 45.
STATISTICAL MODEL The model is a Bayesian version of a random-effect model including two levels, namely the within-study level and the between-study level. The within-study level describes the within-study variability of the data and is defined by:
BAYESIAN STATISTICAL MODELS FOR QUANTITATIVE SYNTHESIS OF CLIMATE CHANGE IMPACT STUDIES
132
𝑆𝑖𝑗 = 𝜇 + 𝑏𝑖 + 𝜀𝑖𝑗 (1)
where 𝑆𝑖𝑗 is the yield sensitivity in the ith study (site) and the jth year, 𝜇 is the mean sensitivity value over all studies, 𝑏𝑖~𝑁(0, 𝜎𝑏
2) is a random study effect, 𝜀𝑖𝑗~𝑁(0, 𝜎𝜀𝑖
2 ) is a random term describing the within-study variability (i.e., here, the between year variability). The two variances 𝜎𝑏
2 and 𝜎𝜀𝑖
2 correspond to the between-study variance and to the within-study variance, respectively. Here, the within-study variance is indexed by i because this variance is assumed variable across studies, depending on the level of variability of 𝑆𝑖𝑗 between years within a given study (the higher the between-year variability in study i, the higher the value of 𝜎𝜀𝑖
2 ). Each study is thus characterized by a specific value of 𝜎𝜀𝑖
2 . This model includes three types of parameters, namely 𝜇, 𝜎𝑏
2, and 𝜎𝜀𝑖2 ,
i=1, …, N. As these parameters are estimated here using a Bayesian method, it is necessary to define prior distributions for all the unknown parameters of the model. Here, non-informative priors are defined, specifically 𝜇~𝑁(0, 106), 𝜎𝑏
2, 𝜎𝜀𝑖2 ~𝐼𝑛𝑣𝐺𝑎𝑚𝑚𝑎 (
𝑘
2,
𝑘
2). Several values were tested for k
in order to analyze the sensitivity of the results to the prior, i.e., k=1, 0.2, 0.02, and 0.002.
The model described above can be expanded in order to explain part of the between-study variability using one or several covariates. This approach is illustrated here for the wheat dataset where the average temperature measured during the growing season is used to explain part of the variability of the wheat yield sensitivity to temperature increase. The model is expanded as follows:
𝑆𝑖𝑗 = 𝜇0 + 𝜇1𝑋𝑖𝑗 + 𝑏𝑖 + 𝜀𝑖𝑗 (2)
where 𝑋𝑖𝑗 is the average temperature in the site i for year j, and 𝜇1 is an additional parameter to be estimated from the data. In some meta-analyses, the model (1) is simplified and the random term 𝑏𝑖 is omitted. This simplified version of the model is often named “fixed effect model”. This model assumes that all studies share the same effect size and that the heterogeneity among studies is negligible. This assumption is often unrealistic and the use of a fixed-model in case of strong between-study variability can lead to underestimation of the level of uncertainty of the estimated values. Here, I illustrate the consequence of the inappropriate use of a fixed-model by comparing the results obtained with this model to those obtained with the random-effect model (1). All models are fitted using a Markov chain Monte Carlo algorithm

BAYESIAN STATISTICAL MODELS FOR QUANTITATIVE SYNTHESIS OF CLIMATE CHANGE IMPACT STUDIES
133
implemented using the R package MCMCglmm (Hadfield, 2010). The posterior distributions are computed with 100,000 or 1,000,000 iterations and a burnin period of size 10,000. An example of chain and of posterior distribution is shown in Fig. 1.
Fig. 1. Chain of values of 𝜇 obtained with MCMC (left) and corresponding
posterior distribution (right).
RESULTS
The results obtained with the random-effect model (1) for rice (dataset 1) are summarized in Fig. 2 and Table 1. The mean effect-size ranges from -4.87% to -5.09% depending on the prior chosen for the variance parameters of the model. The influence of the prior on the results is thus relatively weak. The individual effect sizes estimated site-by-site show contrasted values; some are smaller than 9% or even 10% while others are not different from zero. However, the results reveal that the effect size is never positive; no positive effect of +1°C on yield is estimated for the sites included in the dataset.
For wheat in China (dataset 2), the estimated effects of an increase of +1°C on yield are quite different (Fig. 3) compared to rice (Fig. 2). The MES is not significantly different from zero for wheat and this result reveals that, in average over the experimental sites, an increase of +1°C has no substantial

BAYESIAN STATISTICAL MODELS FOR QUANTITATIVE SYNTHESIS OF CLIMATE CHANGE IMPACT STUDIES
134
effect on wheat yield. However, the effect of +1°C on wheat yield strongly varies across sites. Some sites show a positive effect while the effect on yield is negative in other sites. The range of yield sensitivity values is very large, from +10% to -10%, depending on the sites.
A model including a covariate was fitted to the wheat data in order to explain part of the strong variability of wheat yield sensitivity. The selected covariate is the mean temperature recorded during the growing season. This covariate is reported in the x-axis of Fig. 4. The y-axis of this figure shows yield sensitivities site-by-site. The fitted model reveals a decreasing trend; the yield sensitivity values tend to be positive in cold areas (on the left) and to be negative in warm areas (on the right). But the uncertainty remains high and a substantial part of the variability is not explained by this covariate.
Finally, Fig. 2 and Fig. 3 show that, although the MES estimated by the fixed-effect model are similar to those obtained with the random-effect model, the level of uncertainty is strongly underestimated by the fixed-effect model; the use of a fixed-effect model gives an over-optimistic view of the level of accuracy of the estimated values. Table 1. Mean effect size (MES=mean yield sensitivity to +1°C) estimated with
model (1) for different parameter values (k) of the prior distribution
(Inverse Gamma), and lower and upper bounds of the associated
95% credibility intervals of MES
k MES Q2.5 Q97.5
1 -4.57 -8.44 -0.29
0.2 -5.02 -9.02 -0.66
0.02 -5.10 -9.26 -0.88
0.002 -5.09 -9.87 -0.64

BAYESIAN STATISTICAL MODELS FOR QUANTITATIVE SYNTHESIS OF CLIMATE CHANGE IMPACT STUDIES
135
Mean FEMean REGainesvilleGwangjuHarbinJingzhouKhumaltarLagunaLosBanosNanjingNewDelhiOkayamaShanghaiTagusValleyTamilNaduWuhan
-20 -10 0 10 20
% of yield difference
Fig. 2. Meta-analysis of field warming experiments: Rice yield sensitivity to
+1°C (ambient [CO2]). The black points correspond to the yield
sensitivity estimated for each site. The red point corresponds to the
mean effect size estimated with the random-effect model (RE) and the
orange point corresponds to the mean effect size estimated with the
fixed-effect model (FE). The bars correspond to the 95% credibility
intervals. Results were obtained with k=1 (see text).

BAYESIAN STATISTICAL MODELS FOR QUANTITATIVE SYNTHESIS OF CLIMATE CHANGE IMPACT STUDIES
136
6 8 10 12 14
-20
-10
010
20
Mean temperature (°C)
% y
ield
diff
eren
ce
Mean FEMean REDingxiDingxingGuyuanLianyungangLuanchengLuluMountainNanjingShanghaiTongweiCountyXidatanYucheng
-15 -10 -5 0 5 10 15
% of yield difference
Fig. 3. Meta-analysis of field warming experiments: Wheat yield sensitivity to
+1°C (ambient [CO2]) in China. The black points correspond to the yield
sensitivity estimated for each site. The red point corresponds to the
mean effect size estimated with the random-effect model (RE) and the
orange point corresponds to the mean effect size estimated with the
fixed-effect model (FE). The bars correspond to the 95% credibility
intervals. Results were obtained with k=1 (see text).
Fig. 4. Meta-regression: Wheat yield sensitivity vs. Mean temperature.

BAYESIAN STATISTICAL MODELS FOR QUANTITATIVE SYNTHESIS OF CLIMATE CHANGE IMPACT STUDIES
137
CONCLUSION
Bayesian hierarchical statistical models are powerful tools for analyzing the effect of climate change on crop yields from large sets of experimental studies. Here, I showed how this type of statistical models can be used to estimate the global effects of climate change on crop productions accounting for the relative accuracy of each individual study. Once fitted to data, these models can be easily run to explore a diversity of scenarios and analyze uncertainties in projections of crop responses to climate change. I advocate for the inclusion of this type of statistical model in the tool boxes of scientists working on climate change impact assessment. More rigorous quantitative syntheses could help scientists to promote evidence-based decision making.
REFERENCES Albert I., and D., Makowski. 2018. Ranking crop species using mixed
treatment comparisons. Research synthesis methods. Doi 10.1002/jrsm.1328.
Borenstein, M., Hedges, L.V., Higgins J.P.T., and H.R., Rothstein. 2009. Introduction to meta-analysis. Wiley.
Hadfield, J.D. 2010. MCMC methods for multi-response generalized linear models: the MCMCglmm R Package. Journal of statistical software 33, 2.
Makowski, D., F., Piraux, and F., Brun. 2019. Synthetizing knowledge; from the analysis of experimental network to meta-analysis. Quae, Springer, in press.
Zhao, C., S. Piao, and X. Wang, et al. 2016a. Plausible rice yield losses under future climate warming. Nature Plants 3, 16202.
Zhao, C., S. Piao S., and Y. Huang. 2016b. Field warming experiments shed lights on the wheat yield response to temperature in China. Nature communications 7, 13530.

138

A PLATFORM FOR DIGITIZING AND SCALING UP OPTIONS WITH SMALL FARMS INTO SDG: A REVIEW
139
A PLATFORM FOR DIGITIZING AND SCALING UP OPTIONS WITH SMALL FARMS
INTO SDG: A REVIEW
Attachai Jintrawet
Plant & Soil Sciences Dept. and
Center for Agricultural Resource System Research,
Faculty of Agriculture, Chiang Mai University, Chiang Mai, Thailand
E-mail: [email protected]
ABSTRACT Small farms are successfully managing household and natural resources to meet the needs of household members for food, feed, fiber, fuels, which are a part of local and national economic systems. These achievements was supported by an array of relationships and actions, organized by communities at the local, national and international level, that emphasized high quantity of outputs from a given agroecosystem using array of new crop and livestock varieties and associated agricultural technologies. The actions produced positive and negative consequences on local communities and environments, both on and off-site. These consequences, together with climate change and variability, prompted local communities, Government and private organizations to further develop better policies, technologies and innovations. The emerging Agricultural Information and Communication Technologies (AgICTs) provide platforms and opportunities for small farms, policy makers and scientists to systemically design and evaluate new agricultural technologies prioring to their actual implementations in the real farm and nonfarm settings to manage limited resources. It concludes that the substantial contributions of AgICTs to achieve SDGs must be at the core of the fundamental change needed in policy and education systems if we are to achieve a transformation of household, natural and agricultural resource management policy and practices to a sustainable and desirable common future. Keywords: Systems approaches, interactions, farm and non-farm
activities

A PLATFORM FOR DIGITIZING AND SCALING UP OPTIONS WITH SMALL FARMS INTO SDG: A REVIEW
140
INTRODUCTION Asia-Pacific is a diverse region, so there are ecologically and ethnically differing types of agricultural systems, which are household activities to produce raw materials for household consumption process and sale the surplus to markets. In particular, Thailand is home to approximately six million small farms (SFs) households (NSO, 2013) and one of the world’s few major agricultural exporters in various commodities, i.e., rice, cassava, sugar, sweet corn, and feeding high quality products to more than four times her own population from mainly rainfed and less intensive agricultural systems than its neighbors (Falvey, 2000). In 2011, agricultural systems were also contributed about 17.32% to the total national Greenhouse Gases emissions or 52.93 MtCO2eq., 38.02 and 14.91 MtCO2eq. from CH4 and N2O emissions, respectively. The report also shown CO2 emissions of 42.70 MtCO2eq. from LULUCF or Land Use, Land-Use Change, and Forestry sector (ONEP, 2015). To cope with climate change, during the 70th Session of the United Nations General Assembly New York on 29 September 2015, Thai Prime Minister of the Kingdom of Thailand stated the shared responsibility to ensure the outcome of the COP 21 (Conference of the Parties 21) and reaffirmed the National’s commitment under the INDCs (Intended Nationally Determined Contributions) to reduce Thai’s greenhouse gas emissions between 20 and 25% by the year 2030 from 2005 baseline.
The establishment of Intergovernmental Panel on Climate Change (IPCC) in 1988 have been marked by numerous advances in knowledge and publications on relationships of agriculture and climate change, i.e., its impacts, society's policy and capacity to adapt and mitigate. Therefore, agricultural systems in the world and in Thailand need some kinds of revolution to efficiently utilize limited resources, based on good agricultural practice and process to produce high quality outputs with the aim to maintain sustainability of the ecosystems (Llewellyn, 2018).
A just climate change policy, either for adaptation or mitigation, must be geared towards SFs. It is very crucial and important to the next agricultural transformations for several reasons: first, protecting the ecosystems and vulnerable people from climate change impacts, second, protecting people from disruptions of transformation, and finally, enhancing the process of envisioning and implementing an equitable post-carbon society. Serious climate policy must focus more on the near-term and on feasibility. It must consider the full range of options, even though some are uncomfortable and freighted with risk (Xu et al., 2018).
For Thailand, the challenges under changes are to utilize AgICTs in order to keep the level of diversity which are still common in Thai agricultural systems, and that a central component of future development is the small

A PLATFORM FOR DIGITIZING AND SCALING UP OPTIONS WITH SMALL FARMS INTO SDG: A REVIEW
141
farmers as an integral component of the whole society (Falvey, 2000). The Next Agricultural Revolution (NAR) must be geared towards People-Ecol-Techno-centric include: co-developing of innovations and AgICT (Agricultural Information and Communication Technologies) that are based on SFs needs and resources; considering emergent properties of the whole system; localizing innovations, team working and networking model with peer-supporting process, lowering dependency on external inputs, valuing multi-cultures and interdependent in a collaborative world, equipping with multi-way and online communication tools and platforms, demanding for quality and quantity, localizing markets that ecological-oriented, SDGs-readiness, small farm matter as learning platform, lowering debts, and better social and ecosystem health situations locally and globally.
WHAT ARE OPTIONS FOR SMALL FARMS? A system approach to address the question, under climate change, was allow users to co-develop and co-evaluate AgICTs, i.e., simulation models and its associated resource databases, to study the interactions of ecosystems and options of agricultural systems than to carry out the real experiments on the systems themselves (ICRISAT, 1984; Uehara, 1998; Marohn et al., 2013). Specifically, SFs should be able to use these AgICTs, co-developed with various research teams and implemented by government agencies, to address a set of farm-specific and short-term questions at the farm level, for example; 1. What crop/livestock options should I plant/raise on this land with the
approval of my neighbor and with my own natural and agricultural resources (especially the fragile soil ecosystems) as much as possible?
2. What crop/livestock options should I plant/raise in this season and how to precisely manage resources for community and ecosystems, i.e. reduce greenhouse gas emissions?
Agricultural systems are human activities and practices that implement options to modify natural ecosystems in order to produce raw materials to meet demands from multi-users. Therefore, it is logical to develop multi-user AgICTs consist of predictive simulation models, based on scientific understandings, and databases, based on field and remote sensing survey methods. Users can learn and collaborate to evaluate options with AgICTs as a team of end users, next users, and research team users (Fig. 1). SFs, stakeholders and users of these AgICTs could collectively apply better alternative options to collaboratively manage agricultural and natural resources to meet both local and national objectives. Specifically, these
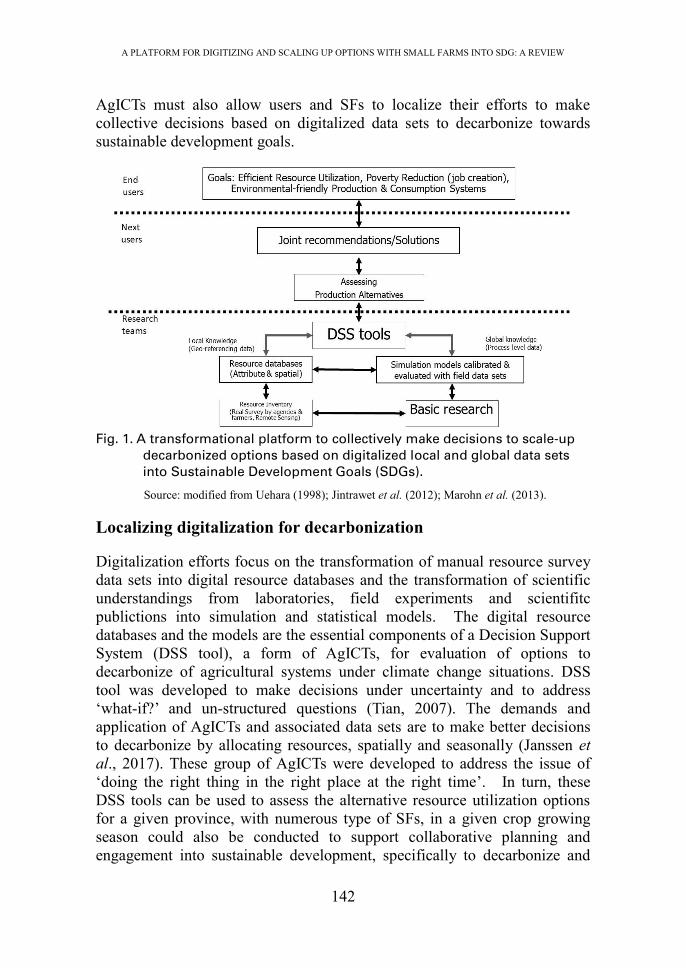
A PLATFORM FOR DIGITIZING AND SCALING UP OPTIONS WITH SMALL FARMS INTO SDG: A REVIEW
142
AgICTs must also allow users and SFs to localize their efforts to make collective decisions based on digitalized data sets to decarbonize towards sustainable development goals.
Fig. 1. A transformational platform to collectively make decisions to scale-up
decarbonized options based on digitalized local and global data sets
into Sustainable Development Goals (SDGs).
Source: modified from Uehara (1998); Jintrawet et al. (2012); Marohn et al. (2013). Localizing digitalization for decarbonization Digitalization efforts focus on the transformation of manual resource survey data sets into digital resource databases and the transformation of scientific understandings from laboratories, field experiments and scientifitc publictions into simulation and statistical models. The digital resource databases and the models are the essential components of a Decision Support System (DSS tool), a form of AgICTs, for evaluation of options to decarbonize of agricultural systems under climate change situations. DSS tool was developed to make decisions under uncertainty and to address ‘what-if?’ and un-structured questions (Tian, 2007). The demands and application of AgICTs and associated data sets are to make better decisions to decarbonize by allocating resources, spatially and seasonally (Janssen et al., 2017). These group of AgICTs were developed to address the issue of ‘doing the right thing in the right place at the right time’. In turn, these DSS tools can be used to assess the alternative resource utilization options for a given province, with numerous type of SFs, in a given crop growing season could also be conducted to support collaborative planning and engagement into sustainable development, specifically to decarbonize and

A PLATFORM FOR DIGITIZING AND SCALING UP OPTIONS WITH SMALL FARMS INTO SDG: A REVIEW
143
maintain natural resources. The digitalization of national resource databases, partially related to
decarbonization practices, in Thailand has been routinely carried out by various implementing agencies, for example; soil database by Land Deveopment Department (LDD, 2018), weather and climate database by Thailand Meteorological Department (TMD, 2018), current landuse types and related agricultural statistics database by the Office of Agricultural Economic (OAE, 2018), rice and other major crop planted area maps by the Geo-Informatics and Space Technology Development Agency (Public Organization) (GISTDA, 2018), and agricultural census report and database by the National Statistical Office (NSO, 2013). In addition, various research groups are also providing data services that can be accessed and incorporated to decarbonize studies, for example, seasonal climate forecast data sets can be accessed and linked with simulation models for seasonal rice yield forecast 3-4 months in advance (RCCES, 2018). Additional policy and joint efforts are urgently needed to incorporate variables related to greenhouse gas emission and sequestration by various agricultural and food consumption systems at various levels, i.e., plot, farm, urbanized and building zone, district, province, as well as various economy sectors, i.e., energy, industry, agricultural, waste, and LULUC.
The transformation of scientific understandings from laboratories, field experiments and scientifitc publictions into simulation and statistical models, with predictive capabilities, and associated field experimental data sets for model calibration and evaluation. These models has been developed since 1980s (Williams et al., 1989; Supit et al., 1994; de Wit et al., 2019; Bouman et al., 1996; McCown et al., 1996; Brisson et al., 1998; Jones et al., 2003; Arnold et al., 2012), revised and applied to various situations ranging from crop varietal evaluation, watershed management to climate change issues. Most models could be further improved to incorporate scientific understanding about the relationships of agricultural systems and key GHGs, include carbondioxide, methane and nitrous oxide. With good investment on local data collection, these models can be calibrated and evaluated to provide synthesis of options to decarbonize of various crop production systems.
Within The Thailand Research Fund (TRF), Precision Agriculture (dubbed called TRF-PA network and a continuation of TRF-DSS) was defined as agricultural systems that farmers or growers utilize ICTs to make better decisions to allocate natural and agricultural resources in order to improve quality and quantity of farm input-process-output, above and belowground ecosystems, while reducing the impact of agriculture on the environment. The development of PA cases in the network started in October 2015, with the coordinating unit at Chiang Mai University. Using

A PLATFORM FOR DIGITIZING AND SCALING UP OPTIONS WITH SMALL FARMS INTO SDG: A REVIEW
144
peer-support approach, the network has provided a platform for researchers to interact with farmers in order to co-develop ICTs technologies for site-specific resource management, mainly water and soil nutrient resources (Attanandana et al., 2007; Jintrawet et al., 2012). However, more efforts must be taken to handle decarbonize objective into the network and research projects to scientifically co-develop decarbonized prototypes of various systems and sectors (Berthet and Hickey, 2018).
SFs and policy makers can co-learn to adopt suitable agricultural technologies using these DSS tools by shifting from scanning and data retrieval to more qualitative steps, such as interpretation, decision-making and implementation for a creative and human-centered activity (Keller and von der Gracht, 2014) into localizing decarbonization of agricultural systems and sustainable development goals. Localizing decarbonization of agricultural systems This is a joint effort of stakeholders and requird DSS tools and political will to implement and engagement with local groups. Decarbonization of current agricultural systems should simply be managed by SFs as multipurpose agricultural production systems in a changing environment. DSS tools can be collaboratively used to address questions, at the strategic and the landscape-field levels, related to cost of, how much carbon can be removed or sequestrated, where and when to decarbonize?
At the strategic policy level, DSS tools should allow users to evaluate decarbonized options of agricultural sector include improved short-term practices to enhance soils as a long-term carbon sink project such as a voluntary action plan ‘4 per 1000 Initiative’ (UNFCCC, COP21; Soussana et al., 2017). Technologies and materials for reducing crop-related emissions and reducing and capturing livestock emissions can also be enhanced through cultivation techniques that convert atmospheric CO2 to carbon-based compounds in the soil systems, while also reducing erosion of sloping agricultural lands and the need for fertilizers and providing other benefits. Plant breeding programs that offer new varieties of plants with long roots or other characteristics favoring carbon sequestration can also enhanced agricultural sinks; and shifts in consumption patterns of consumers toward less carbon-intensive foods (Huber, 2018). Nguyen et al. (2018) also reported that rice, maize and sugarcane residue open field burning was major emitters and alternative solutions must be developed with local communities as well as Government regulations. Transformation of some chemical farming into organic farming systems could reduce GHG emissions by 0.049%, as well as mitigate methane and nitrous oxide emissions from the current shares of transportation of organic farming output across most states
A PLATFORM FOR DIGITIZING AND SCALING UP OPTIONS WITH SMALL FARMS INTO SDG: A REVIEW
145
(Squalli and Adamkiewicz, 2018). At the landscape level, with watershed management approach, various
opportunities to reduce emissions (Cai and Zhang, 2018) and enhance carbon storage using DSS tools in the LULUCF sector (Yang et al., 2016). These options can focus on maintaining or adding forests and slowing conversion to settlement or agriculture. Existing forests can be managed for greater carbon sequestration through fertilization, irrigation, switching to fast-growing planting stock, increasing intervals between harvests, decreasing harvest intensity, and increasing forest density (McKinley et al., 2011).
At the farm level, decarbonization can be carried out on site by SFs with supported from community and policy. The objective is very clear, i.e., to reduce level GHG by 50% in every decade (Rockström et al. 2017). In Thailand case, with approximately six million SFs, with a joint effort to decarbonize, by 2030 Thailand could cut 50% of GHGs from agriculture sector (that is 25 MtCO2eq. based on 2011 inventory).
At the field and plot level, N2O emissions can be reduced through improved management of nitrogen fertilizer use, such as better tailoring the quantity and timing of applications, improving fertilizer formulations, and applying fertilizer directly to roots. Fertilizer use can also be reduced through precision agriculture, which uses advanced technology such as sensors and data analysis to fine-tune the application of farm inputs to field conditions. Also, CH4 emission from flood rice fields and wetlands can also be reduced by using AWD and other infrastructure investment (NAMAFacility, 2018; Tian et al., 2018). In the Chao Phraya river basin in central Thailand, in the field trials, farmers that applied Cost Reduction Operating Principles (CROP) practices reduced costs by 6–36% (±17%) and increased net income by 21–131% (±79%) when compared with the same season in the previous year (Stuart et al., 2018). Precision agriculture can also reduce fuel requirements by reducing the areas that receive agricultural inputs and the number of applications (Gebbers and Adamchuk, 2010). Equipment cooperatives and other local mechanisms to share equipment could help overcome cost barriers for individual farms (Shannon et al., 2018). These efforts will bring about sustainable livelihoods during and after localized decarbonization process.
The effort of decarbonization of agricultural sector, as a part of the whole society, can be jointly implemented on four fronts, namely; a) decarbonizing the production of electricity, b) undertaking massive electrification (to increase reliance on clean electricity) and, where not possible, switching to cleaner fuels, c) improving efficiency and reducing waste in all sectors (building, transpor tand agriculture), and d) preserving and increasing natural carbon sinks through improved management of forests and other vegetation

A PLATFORM FOR DIGITIZING AND SCALING UP OPTIONS WITH SMALL FARMS INTO SDG: A REVIEW
146
and soils (Fay et al., 2015). These effort could be efficiently and locally implemented with the support of communities to collectively making decision. Localizing decision making for decarbonization Decision making is a process to allocate limited agricultural and natural resources to meet objectives of producing raw materials for food, feed, fiber, and fuels for socity and ecosystems with minimum GHG emissions. These process required a shift of thinking and methods by integrating both bottom-up and top-down approaches with DSS tools (Mimura, et al., 2014), for sustainable soil management (Srivastava et al., 2016), and for the creation of cost-effective and equitable adaptation plans at the local level (Girard, 2015). DSS tools can be used as tools to enhance communication between the both user groups and collectively implement lerning and adaptation of suitable decarbonize options for a given situation at a given watershed or administrative boundary (Bilali and Allahyari, 2018). This approach of decision making is based primarily and hinge on the strengths and weaknesses of local communities to observe, analyse, innovate, connect, organize collective action and become part of wider coalitions (van Noordwijk, 2017).
The bottom-up approach required that stakeholders gain understandings of the impact of global climate change on local agricultural systems and the range of adaptation and mitigation that could be locally implemented to cope with the changing climate. DSS tools can be used to progressively engage stakeholders to dialogue and explore possible consequences of options on future ecolocial and economic development, by considering a large number of factors. The output of this task should be one or several options for decarbonize, with associated assumptions, i.e. social, regulatory, economic, ecological and environmental. SFs and local communities can probably make decision to allocate resources to adopt one or two plausible decarbonize options at the plot, field, and farm level, however, some options needs supports from the top-down approach.
The top-down approach normally chooses several climate models (known as General Circulation Models: GCMs), projections and scenarios that simulated the response of the climate systems to a scenarios of future emission of GHGs concentration and aerosals (IPCC, 2013). Then the projection data sets were linked to simulation model for studies on adaptation and mitigation options of various economic sectors and ecosystems in various geographic regions. However, to yield collective actions to decarbonize, good communication about the risks and distributional impacts are needed and very critical (Fay et al., 2015). In

A PLATFORM FOR DIGITIZING AND SCALING UP OPTIONS WITH SMALL FARMS INTO SDG: A REVIEW
147
Thailand, the bioeconomy have been identified as a key component in the 20-year National Strategy of Thailand towards sustainability transition (Royal Gazette, 2018). The strategy was designed to transform Thai society to a pathway of renewable, bio-based, circular and green resources (BCG), with various short and long-term positive outcome and impacts on ecological, socio-economic and environmental dimensions.
Bridging between the two approaches required skills in climate change communication with SFs and local communities to prepare to adapt and mitigate into decarbonization and SDGs. In Thailand case, the challenge now are to preserve the quality of agricultural land, as well as that of water resources. In 1990s, greater use of fertiliser was needed to preserve soil quality (Moncharoen et al., 2001). Now, increasingly intensive use of fertilizers and pesticides could become a threat to the environment, but until recently there has been only anecdotal evidence that this has been the case (Poapongsakorn, 2006). With higher land availability per capita and lower crop yields than in most neighbouring countries, Thailand must address the challenge of producing more with more careful use of natural and agricultural resources with a practice platform for fully engaged communities into the next green revolution.
A SCALING-UP PLATFORM We are proposing a platform for systemic scaling up innovation adaptation options that promote active participation and engagement by local farmers and Government agencies (Fig. 2.), depicting activities of generic rice production systems from the beginning to the harvesting in Thailand. In these proposed scaling up platform, two layers of integrating data flows should be operate to gain better understandings of the interactions between the farmers, government workers and allow generation of minimum data sets of both farm and non-farm activities. The inner circle (green arrows) of the platform allows farmers to input data and information about his/her farm and non-farm activities from planting to harvesting of a crop in a specific plot of her/his farm. Farmers must be compensated for their participation based on the amount of quality data entered onto the system. The outer circle (blue arrows) of the platform retrieve data and information of each plot with associate attribute data about farm and non-farm activities and organize into a minimum data set for simulation models. The data sets from both the green and the blue arrows will support our cooperation to improve the model’s performance in simulating adaptation options.
This platform is built around the following three sentences: “The traditional and current platform is good if we could collect and convert manual data into digital databases. It is even better if we use the databases

A PLATFORM FOR DIGITIZING AND SCALING UP OPTIONS WITH SMALL FARMS INTO SDG: A REVIEW
148
to gain understandings and predict behaviors and dynamics of agricultural systems and climate system. It is excellent if we could collaboratively making decisions to handle risks and main our ecosystems.”
Fig. 2. A systemic and innovative approach to maintain and improve rice
productivity under climate change scenarios.
OPPORTUNITIES
Next generation of 3D-technologies, i.e., Decarbonization, Digitalization and Decision Making, research and development programs for climate change adaptation and climate change mitigation must take advantage of these technologies and opportunities to remove institutional and required data sets to decarbonize. Azhoni et al. (2017) reported barriers that need to be removed especially with regarding to accessibility to data and information, which were shaped by systemic bureaucracies and cultural attitudes. Approaching barriers with an approach that systemic, contextually interconnected cultural, geographical and political underlying factors enriches the understanding of adaptation enablers, thereby contributing to achieving a better adapted society.
Educational and organization cultural systems that must learn and listen to the voice and perspective of their intended beneficiaries, i.e., SFs (Schurman, 2018). Future of SFs under changes depends of measures to

A PLATFORM FOR DIGITIZING AND SCALING UP OPTIONS WITH SMALL FARMS INTO SDG: A REVIEW
149
stimulate and integrate the rural farm and nonfarm activities and industries that aims to providing jobs for those leaving farming, a favorable rural investment climate for all member of the rural community (Leturque and Wiggins, 2010).
A shift of society's understanding of agroecosystem-rich (that is not resource-rich ecosystems) as part of a sustainable earth and society that is distributed and responsive model of governing energy transitions. Chilvers et al. (2018) have developed and demonstrated a new perspective on ‘participation’ in socio-technical change with specific reference to energy system transitions. Notions of participation, inclusion and societal engagement have become central to realizing socio-technical transitions that are more democratic, sustainable, socially shaped, responsible, just, and responsive to public values and human needs. Such responsiveness to ecologies of diverse and continually emergent public meanings, values and actions is crucial to building more socially sustainable, inclusive, responsible and just socio-technical (energy) transitions.
SFs must be equally and fully engaged in next generation of agricultural technologies that take advantage of ICTs and transform into the climate change-ready, professionally and interdependently, member of society. We must viewed climate change, a non-monetary value of a resource, as opportunity to increase cooperation across the board, which was not moderated by individual differences, thus providing some tentative evidence for the generality of the present findings (Bastian et al., 2019).
CONCLUSION Small farms are growing in numbers worldwide and are a major producer of raw materials for livelihoods that support both local and international economy. AgICTs will provide supports for SFs in different climatic and edaphic conditions to gain btter understanding of our relationships with the Earth climate system, subsequently enhance our capacity to predict and handle both threats and opportunities. Transformation in educational systems in learning and developing new 3D-technologies are needed and must integrate SFs as an integral part of and a key actor of the whole learning experience. In sum, we can see the path forward to achieve SDGs by 2030, which need a series of collective efforts and dynamic collaboration to jointly establish systems of policy and practice for the management of natural and agricultural resources into a sustainable and desirable common future.
A PLATFORM FOR DIGITIZING AND SCALING UP OPTIONS WITH SMALL FARMS INTO SDG: A REVIEW
150
ACKNOWLEDGEMENTS I appreciate many small farms and research teams under the TRF-PA network (The Thailand Research Fund-Precision Agriculture Research, Development and Implementation Network) for their kindness and active collaboration and friendships since October 2015. NARO-MACRO-FFTC provided financial supports to join and to learn from the event during September 27-28, 2018 in Tsukuba, Japan, in a common objective to bring science to practice with small farms.
REFERENCES Arnold, J.G., D.N. Moriasi, P.W. Gassman, K.C. Abbaspour, M.J. White, R.
Srinivasan, C. Santhi, R.D. Harmel, A. van Griensven, M.W. Van Liew, N. Kannan, and M.K. Jha. 2012. SWAT: Model use, calibration, and validation. Transactions of the ASABE 55:1491-1508.
Attanandana, T., R. Yost, and P. Verapattananirund. 2007. Empowering Farmer Leaders to Acquire and Practice Site-Specific Nutrient Management Technology. Journal of Sustainable Agriculture 30:87-104.
Azhoni, A., I. Holman, and S. Jude. 2017. Contextual and interdependent causes of climate change adaptation barriers: Insights from water management institutions in Himachal Pradesh, India. Science of the Total Environment 17:817-828.
Bastian, B., M. Brewer, J. Duffy, and P.A.M. Van Lange. 2019. From cash to crickets: The non-monetary value of a resource can promote human cooperation. Journal of Environmental Psychology 61:10-19.
Berthet, E.T. and G.M. Hickey. 2018. Organizing collective innovation in support of sustainable agro-ecosystems: The role of network management. Agricultural Systems 165:44-54.
Bilali, H.E. and M.S. Allahyari. 2018. Transition towards sustainability in agriculture and food systems: role of information and communication technologies. Information Processing in Agriculture 5:456-464.
Bouman, B.A.M., H. van Keulen, H.H. van Laar, and R. Rabbinge. 1996. The ‘School of de Wit’ crop growth simulation models: A pedigree and historical overview. Agricultural Systems 52:171-198.
Brisson, N., B. Mary, D. Ripoche, M.H. Jeuffroy, F. Ruget, B. Nicoullaud, P. Gate, F. Devienne-Barret, R. Antonioletti, C. Durr, G. Richard, N. Beaudoin, S. Recous, X. Tayot, D. Plenet, P. Cellier, J.-M. Machet, J.M. Meynard, and R. Delécolle. 1998. STICS: a generic model for the simulation of crops and their water and nitrogen balances. I. Theory and parameterization applied to wheat and corn. Agronomie 18 311-346.

A PLATFORM FOR DIGITIZING AND SCALING UP OPTIONS WITH SMALL FARMS INTO SDG: A REVIEW
151
Cai, Y. and L. Zhang. 2018. Editorial: Multi-scale ecological indicators for supporting sustainable watershed management. Ecological Indicators 92:1-10.
Chilvers, J., H. Pallett, and T. Hargreaves. 2018. Ecologies of participation in socio-technical change: The case of energy system transitions. Energy Research & Social Science 42:199-210.
de Wit, A., H. Boogaard, D. Fumagalli, S. Janssen, R. Knapen, D. van Kraalingen, I. Supit, R. van der Wijngaart, and K. van Diepen. 2019. 25 years of the WOFOST cropping systems model. Agricultural Systems 168:154-167.
Falvey, L. 2000. Thai agriculture golden cradle of millennia. Bangkok, Thailand, Kasetsart University Press. 474 pp.
Fay, M., S. Hallegatte, A. Vogt-Schilb, J. Rozenberg, U. Narloch, and T. Kerr. 2015. Decarbonizing Development: Three Steps to a Zero-Carbon Future. Washington, DC, World Bank. Pp 166.
Gebbers, R. and V.I. Adamchuk. 2010. Precision Agriculture and Food Security. Science 828-831.
Girard, C. 2015. Integrating top-down and bottom-up approaches to design a cost-effective and equitable programme of measures for adaptation of a river basin to global change. Economies and finances. Montpellier SupAgro.
GISTDA (Geo-Informatics and Space Technology Development Agency (Public Organization)). 2018. Thailand rice production monitoring system using satellite data. (http://rice.gistda.or.th/) Accessed 15 December 2018.
Huber, K. 2018. Decarbonizing U.S. Agriculture, Forestry, and Land Use. (https://www.c2es.org/document/decarbonizing-u-s-agriculture-forestry-and-land-use/) Accessed 10 December 2018.
ICRISAT. 1984. Proceedings of the International Symposium on Minimum Data Sets for Agrotechnology Transfer. Minimum Data Sets for Agrotechnology Transfer, ICRISAT Center, India. Patancheru, A P. 502 324, India, International Crops Research Institute for the Semi-Arid Tropics.
IPCC (Intergovernmental Panel on Climate Change). 2013. Climate Change 2013: The Physical Science Basis. Stocker, T.F., D. Qin, G.-K. Plattner, M. Tignor, S.K. Allen, J. Boschung, A. Nauels, Y. Xia, V. Bex and P.M. Midgley (eds.). Contribution of Working Group I to the Fifth Assessment Report of the Intergovernmental Panel on Climate Change. Cambridge University Press, Cambridge, United Kingdom and New York, NY, USA, 1535 pp.
Janssen, S.J.C., C.H. Porter, A.D. Moore, I.N. Athanasiadis, I. Foster, J.W. Jones, and J.M. Antle. 2017. Towards a new generation of agricultural

A PLATFORM FOR DIGITIZING AND SCALING UP OPTIONS WITH SMALL FARMS INTO SDG: A REVIEW
152
system data, models and knowledge products: Information and communication technology. Agricultural Systems 155:200-212.
Jintrawet, A., C. Saengchyosawat, T. Onpraphai, M. Ekasingh, P. Gypmantasiri, B. Ekasingh, C. Narongrit, D. Kamthonkiat, K. HONDA, V. Sarawat, S. Ratanasriwong, P. Tantassanawong, S. Lertlum, A. Choulean, I. Sokrithy, P. Sampaongen, S. Laohasiriwong, K. Pannangpetch, R. Katawatin, W. Amaritsut, N. Boonbrah, and T. Sathonwisit. 2012. Decision Support System Research and Development Network for Agricultural and Natural Resource Management in Thailand: A TRF-DSS Experience. Southeast Asian Studies 1:141-162.
Jones, J.W., G. Hoogenboom, C.H. Porter, K.J. Boote, W.D. Batchelor, L.A. Hunt, P.W. Wilkens, U. Singh, A.J. Gijsman, and J.T. Ritchie. 2003. The DSSAT cropping system model. Europ. J. Agronomy 18:235-265.
Keller, J. and H.A. von der Gracht. 2014. The influence of information and communication technology (ICT) on future foresight processes--Results from a Delphi survey. Technological Forecasting and Social Change 85:81-92.
LDD (Land Development Department). 2018. Soil map of Thailand Bangkok, Thailand, Land Development Department (http://oss101.ldd.go.th/web_th_soilseries/INDEX_th_series.htm, Accessed 15 December, 2018).
Leturque, H. and S. Wiggins. 2011. Thailand’s progress in agriculture: Transition and sustained productivity growth. 111 Westminster Bridge Road, London SE1 7JD, UK, Overseas Development Institute. 30 pp.
Llewellyn, D. 2018. Does Global Agriculture Need Another Green Revolution? Engineering 4:449-451.
Marohn, C., G. Cadisch, A. Jintrawet, C. Buddhaboon, V. Sarawat, S. Nilpunt, S. Chinvanno, K. Pannangpetch, M. Lippe, C. Potchanasin, a. V. DQuang, e. PSchreinemachers, h. TBerger, P. Siripalangkanont, and T. T. Nguyen. 2013. Chapter 10 Integrated Modeling of Agricultural Systems in Mountainous Areas. pp 367-432, In H. L. Fröhlich, P. Schreinemachers, K. Stahr and G. Clemens. Sustainable Land Use and Rural Development in Southeast Asia: Innovations and Policies for Mountainous Areas, Springer Environmental Science and Engineering.
McCown, R.L., G.L. Hammer, J.N.G. Hargreaves, D.P. Holzworth, and D.M. Freebairn. 1996. APSIM: a novel software system for model development, model testing and simulation in agricultural systems research. Agricultural Systems 50:255-271.
McKinley, D.C., M.G. Ryan, R.A. Birdsey, C.P. Giardina, M.E. Harmon, L.S. Heath, R.A. Houghton, R.B. Jackson, J.F. Morrison, B.C. Murray, D.E. Pataki, and K.E. Skog. 2011. A synthesis of current knowledge on forests

A PLATFORM FOR DIGITIZING AND SCALING UP OPTIONS WITH SMALL FARMS INTO SDG: A REVIEW
153
and carbon storage in the United States. Ecological Applications 21:1902-1924.
Mimura, N., R.S. Pulwarty, D.M. Duc, I. Elshinnawy, M.H. Redsteer, H.Q. Huang, J.N. Nkem, and R.A. Sanchez Rodriguez. 2014. Adaptation planning and implementation, pp. 869-898. In Field, C.B., V.R. Barros, D.J. Dokken, K.J. Mach, M.D. Mastrandrea, T.E. Bilir, M. Chatterjee, K.L. Ebi, Y.O. Estrada, R.C. Genova, B. Girma, E.S. Kissel, A.N. Levy, S. MacCracken, P.R. Mastrandrea, and L.L.White (eds.). Climate Change 2014: Impacts, Adaptation, and Vulnerability. Part A: Global and Sectoral Aspects. Contribution of Working Group II to the Fifth Assessment Report of the Intergovernmental Panel on Climate Change. Cambridge University Press, Cambridge, United Kingdom and New York, NY, USA.
Moncharoen, P., T. Vearasilp, and H. Eswaran. 2001. Land Resource Constraints for Sustainable Agriculture in Thailand. Sustaining the Global Farm, 10th International Soil Conservation Organization, Purdue University, West Lafayette, IN, 24-29 May 1999.
NAMAFacility. 2018. Thai Rice NAMA. http://stories.nama-facility.org/better-rice, Accessed 15 December, 2018
Nguyen, T.K.O., D.A. Permadi, P.K. Hopke, K.R. Smith, N.P. Dong and A.N. Dang. 2018. Annual emissions of air toxics emitted from crop residue open burning in Southeast Asia over the period of 2010–2015. Atmospheric Environment 187:163-173.
NSO (National Statistics Office). 2013. Agricultural Census. Bangkok, Thailand, National Statistics Office (http://www.nso.go.th/sites/2014/Pages/Agri/2556/summary.aspx, Accessed 15 December, 2018).
OAE (Office of Agricultural Economics). 2018. Agricultural production data. Bangkok, Thailand, Office of Agricultural Economics. (http://www.oae.go.th/view/1/ขอ้มูลการผลิตสินคา้เกษตร/TH-TH, Accessed 15 December 2018).
ONEP (Office of Natural Resources and Environmental Policy and Planning). 2015. Thailand’s First Biennial Update Report. Office of Natural Resources and Environmental Policy and Planning, 60/1 Soi Phibunwattana 7, Rama 6 Road, Samsennai, Phayathai District, Bangkok 10400, Thailand, Ministry of Natural Resources and Environment, Thailand (http://www.onep.go.th/env_data/2016/01_73/, Accessed 23 December, 2018).
Poapongsakorn, N. 2006. The Decline and Recovery of Thai Agriculture: Causes, Responses, Prospects and Challenges. Rapid Growth of Selected Asian Countries, Lessons and Implications for Agriculture and Food

A PLATFORM FOR DIGITIZING AND SCALING UP OPTIONS WITH SMALL FARMS INTO SDG: A REVIEW
154
Security. Bangkok, Thailand, FAO, Regional FAO Office for Asia and the Pacific.
RCCES. 2018. Seasonal Climate Forecast from Weather Research Forecast-CFSv2 for DSSAT Models. Chiang Mai University, Chiang Mai, Thailand, Reginal Climate Center and Environment Studies (http://rcces.soc.cmu.ac.th/climate/dssat, Accessed 16 December, 2018).
Rockström, J., O. Gaffney, J. Rogelj, M. Meinshausen, N. Nakicenovic, and H.J. Schellnhuber. 2017. A roadmap for rapid decarbonization. Science 355:1269-1271.
Royal Gazette. 2018. The National Strategy (2018-2037). Bangkok, Thailand, Royal Gazette. 135. 1-74.
Schurman, R. 2018. Micro(soft) managing a ‘green revolution’ for Africa: The new donor culture and international agricultural development. World Development 112:180-192.
Shannon, D.K., D.E. Clay, and K.A. Sudduth. 2018 An Introduction to Precision Agriculture. pp 1-12, In D. K. Shanon, D. E. Clay and N. R. Kitchen. Precision Agriculture Basics. American Society of Agronomy, Crop Science Society of America, and Soil Science Society of America, Inc.
Soussana, J.-F., S. Lutfalla, F. Ehrhardt, T. Rosenstock, C. Lamanna, P. Havlík, M. Richards, E. Wollenberg, J.-L. Chotte, E. Torquebiau, P. Ciais, P. Smith, and R. Lal. 2017. Matching policy and science: Rationale for the ‘4 per 1000 - soils for food security and climate’ initiative. Soil and Tillage Research, In Press, Corrected Proof.
Squalli, J. and G. Adamkiewicz. 2018. Organic farming and greenhouse gas emissions: A longitudinal U.S. state-level study. Journal of Cleaner Production 192:30-42.
Srivastava, P., R. Singh, S. Tripathi, and A.S. Raghubanshi. 2016. An urgent need for sustainable thinking in agriculture – An Indian scenario. Ecological Indicators 67:611-622.
Stuart, A.M., A.R.P. Pame, D. Vithoonjit, L. Viriyangkura, J. Pithuncharurnlap, N. Meesang, P. Suksiri, G.R. Singleton, and R.M. Lampayan. 2018. The application of best management practices increases the profitability and sustainability of rice farming in the central plains of Thailand. Field Crops Research 220:78-87.
Supit, I., A.A. Hooijer, and C.A. van Diepen. 1994. System description of the WOFOST 6.0 crop simulation model implemented in CGMS, vol. 1: Theory and Algorithms. Luxembourg, Joint Research Centre, Commission of the European Communities.
Tian, J., Y. Wang, H. Li, L. Li, and K. Wang. 2007. DSS development and applications in China. Decision Support Systems 42:2060-2077.

A PLATFORM FOR DIGITIZING AND SCALING UP OPTIONS WITH SMALL FARMS INTO SDG: A REVIEW
155
Tian, Z., Y. Niu, D. Fan, L. Sun, G. Ficsher, H. Zhong, J. Deng, and F.N. Tubiello. 2018. Maintaining rice production while mitigating methane and nitrous oxide emissions from paddy fields in China: Evaluating tradeoffs by using coupled agricultural systems models. Agricultural Systems 159:175-186.
TMD (Thailand Meteorological Department). 2018. Thai Meteorological Department Automatic Weather Station. Bangkok, Thailand, Thai Meteorological Department (http://www.aws-observation.tmd.go.th/web/main/index.asp, Accessed 15 December, 2018).
Uehara, G. 1998. Synthesis. pp 389-392, In G. Y. Tsuji, G. Hoogenboom and P. K. Thornton. Understanding Options for Agricultural Production. Great Britain, Kluwer Academic Publishers.
van Noordwijk, M. 2017. Integrated natural resource management as pathway to poverty reduction: Innovating practices, institutions and policies. Agricultural Systems, In Press, Corrected Proof.
Williams, J.R., C.A. Jones, J.R. Kiniry, and D.A. Spanel. 1989. The EPIC Crop Growth Model. Transactions of the ASABE 32:497-511.
Xu, Y., V. Ramanathan and D.G. Victor. 2018. Global warming will happen faster than we think. Nature 564:30-32.
Yang, X., S. Blagodatsky, M. Lippe, F. Liu, J. Hammond, J. Xu, and G. Cadisch. 2016. Land-use change impact on time-averaged carbon balances: Rubber expansion and reforestation in a biosphere reserve, South-West China. Forest Ecology and Management 372:149-163.

156

EVALUATION OF FUZZY LOGIC SYSTEMS TO ASSESS CLIMATE SUITABILITY OF ITALIAN RYEGRASS
157
EVALUATION OF FUZZY LOGIC SYSTEMS TO ASSESS CLIMATE SUITABILITY OF ITALIAN
RYEGRASS
Shinwoo Hyun1 and Kwang Soo Kim1,2,3
1Department of Plant Science,
Seoul National University, Seoul, Korea 2Interdisciplinary Program in Agricultural and Forest Meteorology, Seoul National University, Seoul, Korea 3Research Institute of Agriculture and Life Sciences,
Seoul National University, Seoul, Korea
E-mail: [email protected]
ABSTRACT Assessment of climate suitability for a crop would provide information to develop adaptation options to climate change in a region. A climate suitability index at a site of interest can be determined using a fuzzy logic system, which makes use of expert knowledge or existing data to develop a model. The hierachical fuzzy logic system that depends on rule statements and logical operation between them has been developed to assess climate suitability of forage crops. In the present study, alternative operators and rules for the fuzzy logic system were explored to improve reliability of the climate suitability assessment model. Annual yield data of Italian ryegrass were compared with climate suitability index under the assumption that climate suitability index would represent potential yield. The fuzzy logic system was modified applying standard union, standard intersection, bounded sum, and bounded difference to the logical operation that combines suitability of temperature and precipitation. A simple form of the fuzzy logic system was also developed using the rule statements that characterize suitability of temperature and precipitation based on the duration of optimum temperature condition and precipitation amount under a favorable temperature condition, respectively. It was found that the use of standard union resulted in greater coefficient of determination (0.68) between yield and the climate suitability index for given seasons than the original model (0.53), which suggested that application of an alternative logical operator could improve reliability of the model. Application of an alternative rule statement also resulted in a reasonable assessment of climate suitability. In particular, application of a boundary regression analysis indicated that the

EVALUATION OF FUZZY LOGIC SYSTEMS TO ASSESS CLIMATE SUITABILITY OF ITALIAN RYEGRASS
158
climate suitability index obtained from the simple form of the fuzzy logic system could be compared with the potential yield at a given site. For example, the root mean square error of the simple model was relatively small for Italian ryegrass when the climate suitability index was compared with yields near the boundary line, e.g., within 95% confidence limit, which would represent the potential yield at a site. The climate suitability model based on the fuzzy logic system explained a large variation (70.3 %) of average yield for an extended period. The alternative model was also useful to identify countries where climate suitability was gerater for alfalfa in Europe. This suggested that the variants of fuzzy logic system would be useful to assess climate suitability of a production area, which would provide information on decision making and adaptation planning under a given climate condition. These models can be applied to climate change scenario data in a region, which would provide reliable information for small scale farmers who attempt to introduce crops to their farms under a future climate condition. Keywords: Species distribution model, fuzzy logic, uncertainty, minor
crop, climate change adaptation
INTRODUCTION Changes in a cropping system have been suggested as an adaptation option to minimize the negative impact of climate change on crop production (Butt et al., 2005; Chen et al., 2012; de Jong et al., 2001; Howden et al., 2007; Lobell et al., 2008; Robert et al., 2003). For example, cropping practices such as planting date could be shifted depending on future climate conditions (Alexandrov et al., 2002; Tubiello et al., 2002). New cultivars that have more tolerance to environmental stress could be used in the future (Beebe et al., 2011; Nyabako et al., 2012). Practices in tillage, irrigation, and fertilizer application could also be used as an option for climate change adaptation.
Forage crops can be introduced into a cropping system as an additional option for climate change adaptation (Howden et al., 2007). Cultivation of forage crops would have various effects on ecosystem services including a negative impact on soil erosion, reduction of greenhouse gas emission through enhancement of the biogeochemical cycle (Cavigelli et al., 2013; Davis et al., 2012; Lugnot and Martin, 2013; Lemaire et al., 2014). Forage crops would be less affected by environmental stress (Olesen et al., 2011), which would help stable primary production under changing climate conditions. Still, assessment of climatic suitability for a forage crop would be desirable before it is introduced into a cropping system in a region.
Considerable efforts have been made to develop a model to predict the

EVALUATION OF FUZZY LOGIC SYSTEMS TO ASSESS CLIMATE SUITABILITY OF ITALIAN RYEGRASS
159
productivity of forages. For example, Johnson et al. (2003, 2008) developed a model to support decision-making on pasture management, such as DairyMod and SGS Pasture models. Models that determine the daily growth of crop have also been used to predict yields of forage crops (Kiniry et al., 1995; Ojeda et al., 2016) and to assess climate change impacts on pasture systems (Cullen et al., 2009). Such models are often dependent on local management information, e.g., variety, fertilizer application rate, and irrigation, which is often limited to specific sites (Abraha and Savage, 2008).
Alternatively, a climate suitability model can be used to assess the environmental feasibility of forage and minor grain crops in a region (Ramirez-Villegas et al., 2013). In particular, a fuzzy logic system would facilitate development of a climate suitability model for forage crops of which exact or specific information is limited (Okeke and Karnieli, 2006; Zadeh, 1965). Center and Verma (1998) suggested that fuzzy logic would be useful for modeling in biological and agricultural systems. Kim et al. (2018) developed a fuzzy logic system to predict climate suitability of three forage crops.
A fuzzy logic system is often implemented using rules derived from current knowledge. This would help prediction of climate suitability for a forage crop in a region with minimum sets of data, e.g., monthly temperature and precipitation. Still, rules can be modified to determine the values of climate suitability index for greater efficiency. For example, a simple form of rules can be used to calculate climate suitability index without penalty in reliability.
The objectives of this study were to develop and to evaluate the variants of a climate suitability model for Italian ryegrass, which is an important forage crops in Korea and Japan (Koizumi et al., 1993; Sugawara et al., 2006; Valan et al., 2014). Evaluation of such models would provide an insight to make the best use of fuzzy logic system for reliable assessment of climate suitability in a region. This would help identify crop production areas under a given climate condition, which would aid the climate smart agriculture.
MATERIALS AND METHODS Yield and climate data Yield data of Italian ryegrass were used to compare the climate suitability index obtained from different types of fuzzy logic systems. The yield dataset includes annual yield data at 18 sites in three countries including the USA, Belgium, and Australia. Daily weather data including daily minimum and maximum temperatures, and precipitation were collected at those sites from weather databases. For example, weather data at the sites in the US and

EVALUATION OF FUZZY LOGIC SYSTEMS TO ASSESS CLIMATE SUITABILITY OF ITALIAN RYEGRASS
160
Belgium were obtained from the Utah Climate Center (https://climate.usurf.usu.edu/). Daily weather data at Australian sites were collected from the Bureau of Meteorology, Australia (http://www.bom.gov.au/). Daily weather data were summarized by month to prepare input data to the fuzzy logic system for calculation of climate suitability index. Detailed description of these data sets can be found in Kim et al. (2018).
A fuzzy logic system to assess climate suitability of Italian ryegrass
Kim et al. (2018) developed the hierarchical fuzzy logic system that evaluates rules associated with climate conditions for growth and survival of a crop (Fig. 1). The fuzzy logic system consists of a fuzzy set and logical operation between fuzzy sets. The fuzzy set converts a crisp value of a variable into a degree of membership using its membership function. For example, a given precipitation, e.g., 200 mm, is translated into a degree of membership, e.g., 0.2, using a fuzzy set of “suitable” for precipitation. A detailed description of fuzzy sets can be found in Ahamed et al. (2000).
The membership function of a fuzzy set is defined using parameter values that can be determined using experimental data. The parameter values can also be determined using existing knowledge. For example, Kim et al. (2018) used the EcoCrop database to determine those values (Table 1). This approach would require no calibration process to identify parameter values that result in the least difference between observation and prediction through iteration. In particular, it would be challenging to calibrate a climate suitability model beacause only a small set of data would be available for minor crops such as forage crops.
Alternative logical operation to the fuzzy logic system
The hierarchical fuzzy logic system has been designed to evaluate the rule statements of suitability of temperature and precipitation for a crop, respectively (Fig. 1). The rule statement is combination of sub-rule statements such as “temperature is suitable” and “precipitation is suitable”. The sub-rule statement takes into account detailed conditions for temperature and precipitation such as the range of temperature and precipitation, which would affect survival and growth of a crop.

EVALUATION OF FUZZY LOGIC SYSTEMS TO ASSESS CLIMATE SUITABILITY OF ITALIAN RYEGRASS
161
Θm
βm ORm
ANDm
Nm
Pm
Xm hR
Input data
Fuzzy set
Fuzzified value
Interface function
product/t-norm
sum/t-conorm
Fig. 1. The structure of the hierarchical fuzzy logic system to assess climate
suitability of a crop in a month. The operator in gradient color indicates
a logical operator used to combine the outcome of rule statements. Pm,
Nm and Xm indicate precipitation, minimum temperature and maximum
temperature in a month m, respectively. Psuitable, Tfavorable, and Tsuitable are
fuzzy sets of precipitation and temperature, respectively. βm and Θm
represent suitability index of precipitation and temperature,
respectively. ORm and ANDm are climate suitability index in a given
month using t-conorm and t-norm, respectively. The symbols in a
gradient color represent the logical operator between fuzzy values.
The rules of temperature and precipitation can be connected using logical operations including OR and AND, which are called t-conorm and t-norm, respectively. In the orginal model, the logical operation of rule statements including t-conorm and t-norm were defined using algebraic sum and algebraic product as follows (Klir and Yuan, 1995): 𝑅𝑥 𝑜𝑟 𝑅𝑦 = 𝑅𝑥 + 𝑅𝑦 − 𝑅𝑥 ∙ 𝑅𝑦 and (Eq. 1) 𝑅𝑥 𝑎𝑛𝑑 𝑅𝑦 = 𝑅𝑥 ∙ 𝑅𝑦. (Eq. 2)
In fuzzy logic, alternative operator can be used to define t-conorm and t-norm. For example, bounded sum and bounded difference can be used to quantify the logical connection between two statements. These alternative operators are defined as follows (Klir and Yuan, 1995): 𝑅𝑥 𝑜𝑟 𝑅𝑦 = min (1, 𝑅𝑥 + 𝑅𝑦) and (Eq. 3) 𝑅𝑥 𝑎𝑛𝑑 𝑅𝑦 = max (0, 𝑅𝑥 + 𝑅𝑦 − 1). (Eq. 4)

EVALUATION OF FUZZY LOGIC SYSTEMS TO ASSESS CLIMATE SUITABILITY OF ITALIAN RYEGRASS
162
Table 1. Climate and management conditions for Italian ryegrass
Abbreviation Description Valuea
Gmin minimum growing period (d) 90
Gmax maximum growing period (d) 270
Tkill killing temperature (oC) -4b
Tmin Minimum absolute temperature (oC) 2
Tmax maximum absolute temperature (oC) 38
TOPmin minimum optimal temperature (oC) 14
TOPmax maximum optimal temperature (oC) 30
Rmin minimum absolute rainfall (oC) 200
Rmax maximum absolute rainfall (oC) 1800
ROPmin minimum optimal rainfall (oC) 500
ROPmax maximum optimal rainfall (oC) 900
aThe values of crop parameters were obtained from the EcoCrop database (http://ecocrop.fao.org), which is operated by Food and Agriculture Organization (FAO).
bThe hierarchical fuzzy logic system was dependent on the parameter values of -11oC for Tkill.
It is possible to make use of standard union and standard intersection to determine the values of t-conorm and t-norm, respectively, which are defined as follows (Klir and Yuan, 1995): 𝑅𝑥 𝑜𝑟 𝑅𝑦 = max ( 𝑅𝑥 , 𝑅𝑦) and (Eq. 5) 𝑅𝑥 𝑎𝑛𝑑 𝑅𝑦 = min ( 𝑅𝑥 , 𝑅𝑦). (Eq. 6)
No calibration process would be needed for logical operators because they require no parameter, which would minimize the need for the observation data. However, these logical operators would cause variation in the values of climate suitability index. Evaluation of alternative operators would provide a hint to develop a reliable climate suitability model.
Climate suitability indices derived from each logical operator were examined if they could represent variation of yield by site. Eqs. 3-6 were used to determine the values of climate suitability index. These values were compared with yield data at site-years as well as those of the original model. A climate suitability index would be an indirect indicator for crop yield. Thus, the coefficient of determination was calculated between the climate suitability index and crop yield at sites of interest to examine reliability of climate suitability index obtained from the variants of the fuzzy logic system.

EVALUATION OF FUZZY LOGIC SYSTEMS TO ASSESS CLIMATE SUITABILITY OF ITALIAN RYEGRASS
163
Alternative rule to the fuzzy logic system In the present study, it was attempted to calculate climate suitability index using alternative rules. For example, the original model had the rule statements to evaluate a moisture condition for a prolonged period. Assessment of extreme conditions was also applied to determine the values of climate suitability index. These terms would be useful to evaluate conditions that would occur infrequently. Still, monthly data were used as inputs to the model to determine the climate suitability index, which would have limitation to represent such an extreme condition.
A simple form of rule statements was used to focus more on ordinary climate conditions for growth of crops. The rule statement for temperature suitability was defined to take into account the length of time during which the optimum temperature occurred. Amount of precipitation and temperature condition during the given period were included in the rule statement to determine suitability of precipitation. The climate suitability in a given month m was determined using alternative rules as follows: 𝑚 = 𝑇𝑠𝑢𝑖𝑡(𝑋𝑚, 𝑁𝑚) and (Eq. 7) 𝛽𝑚 = 𝑃𝑠𝑢𝑖𝑡(𝑃𝑚) ∙ 𝑇𝑓𝑎𝑣(𝑋𝑚, 𝑁𝑚). (Eq. 8) where m and m represent the degree of suitability for temperature and precipitation in m, respectively. Monthly suitability index can also be determined as follows: 𝑂𝑅𝑚 = 𝑚 + 𝛽𝑚 − 𝑚 ∙ 𝛽𝑚 and (Eq. 9) 𝐴𝑁𝐷𝑚 = 𝑚 ∙ 𝛽𝑚. (Eq.10) where ORm and ANDm are suitability index in m using t-conorm and t-norm, respectively.
For the given planting date at each site-year, the seasonal suitability index was determined from a group of suitability indices by a potential growing season. Because the length of a growing season would differ by region, it was assumed that a crop would be grown during one of the potential growing seasons. In the EcoCrop database, there is a record such that growing periods for Italian ryegrass would range from 3 - 9 months. In each potential growing season, seasonal suitability index Gs was calculated as follows:
𝐺𝑠 = ∑ M𝑚𝑚 /𝑙𝑠, (Eq.11)

EVALUATION OF FUZZY LOGIC SYSTEMS TO ASSESS CLIMATE SUITABILITY OF ITALIAN RYEGRASS
164
where Mm and ls indicate monthly suitability index, e.g., ORm or ANDm, and the number of month in a potential growing season s, respectively. To determine the seasonal suitability index, the median of the Gs values was used. Comparison between yield and climate suitability index
The distribution of yield and climate suitability index obtained from the variants of the fuzzy logic system was examined with visual inspection. The outcomes of fuzzy logic system using the alternative logical operator were also compared with yield data at sites where no disease risk was reported. Sites where diseases have caused problems in forage production were excluded in the analysis to take into account potential yields under a given climate condition. For example, crown rust (Puccinia coronate) is the most serious foliar disease of ryegrass species (Takahashi et al., 2005; Reheul and Ghequiere, 1996). White and Lemus (2014) suggested that crown rust would occasionally occur at sites near the coastal regions in the US including Poplarville and Beaumont.
For the variants derived from alternative rules, the distribution of yield and climate suitability index was examined with a boundary line analysis. A climate suitability index would represent the impact of climate conditions on crop yield. Thus, climate suitability would indicate the potential yield rather than an actual yield (Watsons, 1963), which would be affected by crop management and soil conditions as well as climate conditions. In particular, yield data obtained under field conditions would be affected by biotic and abiotic stresses, e.g., diseases or a spell of extreme weather, which can not be assessed using monthly climate data. A boundary line would be a reasonable approach to examine the reliability of climate suitability indices for the potential yield instead of a conventional regression analysis, e.g., linear regression (Cade and Noon, 2003; Vaz et al., 2008). A quantile regression analysis was performed to obtain a boundary line between climate suitability index and yield at site-years. To minimize the impact of an outlier from yield data, the 0.95 quantile was applied to obtain boundary lines. SAS 9.3 (SAS Institute Inc., Cary, NC, USA) was used to perform the quantile regression analysis.
The degree of agreement between observed and estimated yields was analyzed for site-years at which yields were near the boundary line. A reliable climate suitability model would have a small variation of yields along the boundary line obtained from quantile regression analysis because such a model would be able to predict the potential yield accurately under different conditions, e.g., at different sites. As a result, it is likely that the degree of agreement statistics between observed and estimated yields near

EVALUATION OF FUZZY LOGIC SYSTEMS TO ASSESS CLIMATE SUITABILITY OF ITALIAN RYEGRASS
165
the boundary line, e.g., within a confidence interval at 95%, would be greater for a reliable model compared with the other models. Site-years at which observed yields were within the confidence interval of the boundary line at 95% were selected by models. Then, the coefficient of determination and root mean square error (RMSE) were determined using estimates of yield for climate suitability index values and observed yields at those site-years.
Averages of yield reported for an extended period were compared with those of climate suitability index by site. Climate suitability in a region would be associated with a long-term yield rather than an annual yield. It was assumed that periods more than or equal to three years would represent an extended period. Yield averages and climate suitability index were calculated for the sites where yield data were available at least for three years.
Assessment of climate suitability of alfafa using the alternative rule The model with alternative rule was applied to assess climate suitability of Medicago sativa L. in Europe. Yield data of alfalfa in European countries were obtained from the Eurostat website (http://ec.europa.eu/eurostat). Countries where yield data were available for more than or equal to three years were included in the further analysis. To identify locality where M. sativa L. would be grown, occurrence data of M. sativa were obtained from Global Biodiversity Information Facility (GBIF) database (http://www.gbif.org). The parameters for M. sativa were obtained from the FAO-EcoCrop database.
Climate suitability index for alfalfa was calculated by cell using gridded climate data. Because yield data available by country, it was necessary to calculate climate suitability index within the boundary of countries. Climate conditions would differ by region even in a small country, a gridded calculation of climate suitability index was needed. In the present study, the E-OBS gridded datasets were used as inputs to the model (Haylock et al., 2008).
In gridded calculation, the starting date for a growing season was unknown. Thus, climate suitability index was calculated for each day in a season. The maximum value of climate suitability index was chosen as the final suitability index in the given season. The values of final suitability index were determined for the periods from 2000 to 2014 at each cell. Climate suitability index at occurrence site was averaged within the administrative boundary of countries in Europe.

EVALUATION OF FUZZY LOGIC SYSTEMS TO ASSESS CLIMATE SUITABILITY OF ITALIAN RYEGRASS
166
RESULTS Application of alternative logical operation Reliability of the fuzzy logic systems differed by the logical operator (Fig. 2). Application of standard union to the logical operation between rule statements for suitability of temperature and precipitation explained the greater variation of yield using the climate suitability index. In contrast, combination of these rule statements using the standard intersection had the lower coefficient of determination. Overall, t-conorm resulted in higher values of R2 than t-norm for combination of rules to evaluate suitability of temperature and precipitation. Application of alternative rule to the existing model
The scattering patterns between climate suitability indices and yield at given site-years were similar to a triangular shape for the fuzzy logic system based on t-conorm (Fig. 3A). Yield tended to increase with increasing climate suitability index obtained from the fuzzy logic system with the alternative rule, which was similar to that of the original model. For example, yields at Gatton in 1994 were lower than 1985. The climate suitability indices from the fuzzy logic system were 0.64 and 0.92 in 1994 and 1985, respectively. Climate suitability index was relatively high at Beaumont in 2005 (0.92) when the yield was considerably low (6,054 kg ha-1). As a result, a clear boundary line was obtained between climate suitability for the fuzzy logic system based on t-conorm and yield at site-years. In contrast, such a trend was less evident in the distribution of yield for climate suitability index obtained from t-norm (Fig. 3B).

EVALUATION OF FUZZY LOGIC SYSTEMS TO ASSESS CLIMATE SUITABILITY OF ITALIAN RYEGRASS
167
A. Standard unionYi
eld
(kg
ha-1
)
0
5000
10000
15000
20000
25000
30000B. Bounded sum
C. Standard intersection
Climate Suitability Index
0.0 0.2 0.4 0.6 0.8 1.0
Yiel
d (k
g ha
-1)
0
5000
10000
15000
20000
25000
30000D. Bounded difference
Climate Suitability Index
0.0 0.2 0.4 0.6 0.8 1.0
y = 14,526 x + 3,652R2 = 0.58
y = 12,323 x + 3,786R2 = 0.51
y = 19,287 x + 6,830R2 = 0.42
y = 22,483 x + 7,626R2 = 0.42
Fig. 2. Distribution of observed yields at site-year for climate suitability index
values obtained using (A) standard union t-conorm, (B) bounded sum
t-conorm, (C) standard intersection t-norm, and (D) bounded difference
t-norm. The names of t-conorm and t-norm were used after Klir and Yuan
(1995).
The degree of agreement between yield data estimated and reported at
site-years of which yield were near boundary line was considerably high for the fuzzy logic system based on t-conorm (Fig. 4). For example, the R2 value for the fuzzy logic system was 0.95. The root mean square error (RMSE) for the model was relatively small (1,297 kg ha-1), which was about 11% of average yield at sites of interest. However, the fuzzy logic system based on t-norm had climate suitability index values that clustered together for a certain range of yield.

EVALUATION OF FUZZY LOGIC SYSTEMS TO ASSESS CLIMATE SUITABILITY OF ITALIAN RYEGRASS
168
Climate suitability index
0.0 0.2 0.4 0.6 0.8 1.0
Yie
ld (k
g ha
-1)
0
5000
10000
15000
20000
25000
30000
A06 A07
A08A09
A10
B05B06B07
K08
C09
F07
G84
G85
G86
G87
G89
G91 G92G93
G94G95G96
G97
H08
H10
H11
H12H13
H14
J07L99
L01L03L04L05
L06
L07
L08
L09L10
L11
L12
L13
M08M09
M10
U99U00
U01
U02
U03U04
U05
N99N00N01N02
N03N04N05
N06
N07
N08N10 N11
N12N13 N14
O05
O06
O07
O09 P99
P00
P08P11P12P13
P14
R99R00
R01R02
E07
S01
S02S03
S04S05S06
S07
S08 S10S11
S12S13S14
W07
B
Climate suitability index
0.0 0.2 0.4 0.6 0.8 1.0
A06A07
A08A09
A10
B05B06B07
K08
C09
F07
G84
G85
G86
G87
G89
G91 G92G93G94
G95 G96G97
H08
H10
H11
H12H13
H14
J07L99
L01L03L04L05
L06
L07
L08
L09 L10L11
L12
L13
M08M09
M10
U99U00
U01
U02
U03U04U05
N99N00N01N02
N03N04N05N06
N07
N08N10N11
N12N13N14
O05
O06
O07
O09 P99
P00
P08P11P12P13
P14
R99R00
R01R02
E07
S01
S02S03
S04S05S06
S07
S08S10S11
S12S13S14W07
y = 22,843 x + 2,576
y = 20,879 x + 12,789A
Fig. 3. Distribution of observed site-year yield for climate suitability index of the
fuzzy logic system based on the alternative rule using (A) t-conorm and
(B) t-norm. A line in each plot represents boundary lines at 0.95
quantile for corresponding models. Individual site-year was denoted by
the first letter of site name and a season.
A
t-conorm (kg ha-1)
5000 10000 15000 20000 25000
Obs
erva
tion
(kg
ha-1
)
5000
10000
15000
20000
25000
K08
G85
G89
G91
G94
H08H14
L99
L09L12
M08
M09
N02
R02
S02
B
t-norm (kg ha-1)
5000 10000 15000 20000 25000
G84
G85
G91 G93
G94
G95 G96
M08
M09
M10
U05
O07
Fig. 4. The relationship between reported and estimated yields at site-years of
which yields were within the 95% confidence limit of the boundary line
for the alternative fuzzy logic system using (A) t-conorm and (B) t-norm.
Individual site-year was denoted by the first letter of the site name and
a season. The line in the plot indicates 1:1 line.

EVALUATION OF FUZZY LOGIC SYSTEMS TO ASSESS CLIMATE SUITABILITY OF ITALIAN RYEGRASS
169
Averages of climate suitability index for an extended period explained a large variation (70%) in those of reported yield at sites where no disease risk was reported (Fig. 5). The fuzzy logic system that depends on alternative rules had a highly significant correlation between averages of yields and climate suitability (p = 0.0098) when t-conorm was used to combine the rule statements. In contrast, no significant correlation between averages of yield and climate suitability index obtained from the fuzzy logic system based on t-norm was found.
A
Climate suitability index
0.0 0.2 0.4 0.6 0.8 1.0
Yie
ld (k
g ha
-1)
0
4000
8000
12000
16000
20000
A
G
H
L
M
U
N
O
S
B
Climate suitability index
0.0 0.2 0.4 0.6 0.8 1.0
A
G
H
L
M
U
N
O
S
y = 18,900*x - 187R2 = 0.703
y = 25,102*x +5,798R2 = 0.353
Fig. 5. The relationship between averages of yield and climate suitability index
for the fuzzy logic system based on (A) t-conorm and (B) t-norm,
respectively. A line in each plot represents a regression lines for
corresponding models. Yields and climate suitability index for an
extended period, e.g., ≥ three years, were averaged for a given site. The
individual site was denoted by the first letter of site name. Application of alternative model to alfalfa When the regression coefficient obtained from the analysis of annual ryegrass was used as the slope of a regression line between climate suitability index and average yields of countries, it appeared that these yields were aligned with two regression lines (Fig. 6). There was a group of countries where the yield of alfalfa was considerably higher than other countries for a given climate suitability index. Those countries include Poland, Italy, Denmark, Estonia, Spain, and Croatia. For the second group of countries, the intercept of a regression line between climate suitability index and alfalfa yield was considerably low, e.g., 7,268 kg ha-1. Although climate suitability index was considerably high, e.g., > 0.78, in Serbia and Bosnia and Herzegovina, yield of alfalfa was relatively low, e.g., < 4500 kg ha-1.

EVALUATION OF FUZZY LOGIC SYSTEMS TO ASSESS CLIMATE SUITABILITY OF ITALIAN RYEGRASS
170
Climate suitability index
0.0 0.2 0.4 0.6 0.8 1.0
Yiel
d (k
g ha
-1)
2000
6000
10000
14000
18000Poland
Italy
Denmark
Estonia
Spain
Croatia
France
GermanyCzech_RepublicLuxembourgSlovakiaAustriaSlovenia
Yugoslav
RomaniaHungary
BulgariaGreece
Serbia
Bosnia&Herz
y = 18,900 x + 1514
y = 18,900 x - 7268
Fig. 6. Distribution of alfalfa yields for climate suitability index during extended
periods in European countries. After the slope of the line was fixed to
be 18,900, the intercept of lines were obtained from regression analysis
for two groups of countries where yields of alfalfa was considerably
different for given climate suitability index. Yield data in Bosnia and
Herzegovina (Bosnia&Herz) and Serbia were excluded from the
analysis. The former Yugoslav republic of Macedonia was denoted by
Yugoslav. Yields and climate suitability index were averaged for the
period during which yield records were available ≥ three years.
DISCUSSION This study illustrated that the climate suitability index obtained from the variants of the fuzzy logic system would be useful to estimate the potential yield of Italian ryegrass. Climate suitability would represent the potential yield at a site under given climate condition when the impact of extreme weather events and non-climate factors, e.g., soil and disease, would be minimal. The potential yield based on climate suitability would be greater than or equal to actual yield, which would result in a triangular distribution between actual yield and climate suitability index (Greenberg et al., 2015; Maller, 1990; Vaz et al., 2008). Using the fuzzy logic system, such a

EVALUATION OF FUZZY LOGIC SYSTEMS TO ASSESS CLIMATE SUITABILITY OF ITALIAN RYEGRASS
171
distribution was obtained for individual seasons. The fuzzy logic system also had a significant relationship between yields and climate suitability for an extended period at sites with relatively low disease risks.
It appeared that the type of logical operator such as standard union over standard intersection would have a considerable impact on reliability of climate suitability index because the rules of suitability for temperature and precipitation are combined in a different way. For example, the R2 value of the fuzzy logic system with standard intersection was considerably lower than that of the fuzzy logic system with standard union although difference between these systems was the logical operator between the rule statements. This suggested that an optimum set of logical operator can be found. For example, Genesis and Jonas (2014) used a complex function to combine multiple terms for prediction of yield. Thus, it would be merited to explore additional set of logical operators, which could improve the reliability of climate suitability assessment.
Although the choice of logical operators affected the reliability of the fuzzy logic system to determine climate suitability index, the rule statement of the fuzzy logic system would also have considerable impact on reliability of climate suitability index. In the present study, it was shown that t-norm would be inferior to t-conorm for evaluation of two rule statements on temperature and precipitation. Nevertheless, application of simple rule did not decrease the reliability of climate suitability assessment, which suggested that the simple form of fuzzy logic system would be useful to reduce the computation time. In particular, gridded assessment of climate suitability would help individual farmers who plan to introduce a new crop in their farm in a given region (Zabel et al., 2014).
Climate suitability of a crop has been used to evaluate suitable areas to cultivate certain crop in the future with projected climate scenarios (Ramirez-Villegas et al., 2013). In those studies, long-term averages of climate data have been used as inputs to determine climate suitability indices. For example, the time resolution of climate surfaces is usually limited to monthly averages for normal years, e.g., 30 years. Thus, it would be worthwhile to compare the outcomes of climate suitability assessment using long-term averages of climate data as inputs to the model and averages of climate suitability index values for the period. Spatial averages of climate suitability index could also be used for reliable assessment of climate suitability. Thus, further studies would be merited to examine the impact of spatial and temporal characteristics of climate data on the reliability of climate suitability index. Still, spatial assessment of climate suitability index would help growers identify crop production areas with suitable climate conditions, which would aid climate smart agriculture.

EVALUATION OF FUZZY LOGIC SYSTEMS TO ASSESS CLIMATE SUITABILITY OF ITALIAN RYEGRASS
172
CONCLUSION The fuzzy logic system into which knowledge of ecological envelope for a crop can be formulated has been implemented using a diverse set of options including logical operators and rules. Evaluation of these variations would help reliable assessment of climate suitability for a crop. In particular, forage crops including Italian ryegrass can be benefit from the climate suitability model because few crop models are available for these minor crops. Further studies would be merited to examine climate suitability of other minor crops such as vegetables. Such studies would provide information for small farmers who try to implement the climate smart agriculture.
ACKNOWLEDGEMENT This study was supported by the Korea Ministry of Environment (MOE) as “Climate Change Correspondence Program” (Project Number 2014001310008)
REFERENCES Abraha, M.G. and M.J. Savage. 2008. The soil water balance of rainfed and
irrigated oats, Italian ryegrass and rye using the CropSyst model. Irrigation Science 26(3): 203-212.
Ahamed, T.R.N., K.G. Rao, and J.S.R. Murthy. 2000. GIS-based fuzzy membership model for crop-land suitability analysis. Agricultural Systems 63(2): 75-95.
Alexandrov, V., J. Eitzinger, V. Cajic, and M. Oberforster. 2002. Potential impact of climate change on selected agricultural crops in north-eastern Austria. Global Change Biology 8(4): 372-389.
Beebe, S., J. Ramirez, A. Jarvis, I.M. Rao, G. Mosquera, J.M. Bueno, and M.W. Blair. 2011. Genetic Improvement of common beans and the challenges of climate change. In: Yadav SS, Redden RJ, Hatfield JL, Lotze-Campen J, Hall AE, editors. Crop adaptation to climate change. Oxford: Wiley-Blackwell Publishing. pp. 356-369.
Butt, T.A., B.A. McCarl, J. Angerer, P.T. Dyke, and J.W. Stuth. 2005. The economic and food security implications of climate change in Mali. Climatic change 68(3): 355-378.
Cade, B.S. and B.R. Noon. 2003. A gentle introduction to quantile regression for ecologists. Frontiers in Ecology and the Environment 1(8): 412-420.

EVALUATION OF FUZZY LOGIC SYSTEMS TO ASSESS CLIMATE SUITABILITY OF ITALIAN RYEGRASS
173
Cavigelli, M.A., S.B. Mirsky, J.R. Teasdale, J.T. Spargo, and J. Doran. 2013. Organic grain cropping systems to enhance ecosystem services. Renewable Agriculture and Food Systems 28(2): 145-159.
Center, B. and B.P. Verma. 1998. Fuzzy logic for biological and agricultural systems. In Artificial Intelligence for Biology and Agriculture pp. 213-225. Springer, Dordrecht.
Chen, C., C. Qian, A. Deng, and W. Zhang. 2012. Progressive and active adaptations of cropping system to climate change in Northeast China. European Journal of Agronomy 38: 94-103.
Cullen, B.R., I.R. Johnson, R.J. Eckard, G.M. Lodge, R.G. Walker, R.P. Rawnsley, and M.R. McCaskill. 2009. Climate change effects on pasture systems in south-eastern Australia. Crop and Pasture Science 60(10): 933-942.
Davis, A.S., J.D. Hill, C.A. Chase, A.M. Johanns, and M. Liebman. 2012. Increasing cropping system diversity balances productivity, profitability and environmental health. PloS One 7(10): e47149.
de Jong, R., K.Y. Li, A. Bootsma, T. Huffman, G. Roloff, and S. Gameda. 2001. Crop yield variability under climate change and adaptive crop management scenarios. Final report for climate change action fund project A080. Eastern Cereal and Oilseed Research Centre (ECORC). Agriculture and Agri-Food Canada, 49pp.
Genesis, T.Y. and A. Jonas. 2014. Crop yield gaps in Cameroon. Ambio 43(2): 175-190.
Greenberg, J.A., M.J. Santos, S.Z. Dobrowski, V.C. Vanderbilt, and S.L. Ustin. 2015. Quantifying environmental limiting factors on tree cover using geospatial data. PloS One 10(2): e0114648.
Haylock, M.R., N. Hofstra, KleinTank, A.M.G., E.J. Klok, P.D. Jones, and M. New. 2008. A European daily high-resolution gridded dataset of surface temperature and precipitation for 1950-2006. Journal of Geophysical Research 113(D20).
Howden, S.M., J. Soussana, F. Tubiello, N. Chhetri, Dunlop, and H. Meinke. 2007. Adapting agriculture to climate change. Proceeding of the National Academy of Sciences 104: 19691-19696.
Johnson, I.R., D.F. Chapman, V.O. Snow, R.J. Eckard, A.J. Parsons, M.G. Lambert, and B.R. Cullen. 2008. DairyMod and EcoMod: biophysical pasture-simulation models for Australia and New Zealand. Australian Journal of Experimental Agriculture 48(5): 621-631.
Johnson, I.R., G.M. Lodge, and R.E. White. 2003. The sustainable grazing systems pasture model: description, philosophy and application to the SGS National Experiment. Australian Journal of Experimental Agriculture 43(8): 711-728.

EVALUATION OF FUZZY LOGIC SYSTEMS TO ASSESS CLIMATE SUITABILITY OF ITALIAN RYEGRASS
174
Kim, H., S.W. Hyun, G. Hoogenboom, C.H. Porter, K.S. Kim. 2018. Fuzzy Union to Assess Climate Suitability of Annual Ryegrass (Lolium multiflorum), Alfalfa (Medicago sativa) and Sorghum (Sorghum bicolor). Scientific Reports 8:https://doi.org/10.1038/s41598-018-28291-3.
Kiniry, J.R., D.J. Major, R.C. Izaurralde, J.R. Williams, P.W. Gassman, M. Morrison, R. Bergentine, and R.P. Zentner. 1995. EPIC model parameters for cereal, oilseed, and forage crops in the northern Great Plains region. Canadian Journal of Plant Science 75(3): 679-688.
Klir, G.J. and B. Yuan. 1995. Fuzzy Sets and Fuzzy logic. Englewood Cliffs, NJ: Prentice-Hall.
Koizumi, H., Y. Usami, and M. Satoh. 1993. Carbon dynamics and budgets in three upland double-cropping agro-ecosystems in Japan. Agriculture, Ecosystems & Environment 43(3): 235–244.
Lemaire, G., A. Franzluebbers, P.C. de Faccio Carvalho, and B. Dedieu. 2014. Integrated crop-livestock systems: Strategies to achieve synergy between agricultural production and environmental quality. Agriculture, Ecosystems and Environment 190: 4-8.
Lobell, D.B., M.B. Burke, C. Tebaldi, M.D. Mastrandrea, W.P. Falcon, and R.L. Naylor. 2008. Prioritizing climate change adaptation needs for food security in 2030. Science 319: 607-610.
Lugnot, M.G. and G. Martin. 2013. Biodiversity provides ecosystem services: scientific results versus stakeholders’ knowledge. Regional Environmental Change 13(6): 1145-1155.
Maller, R.A. 1990. Some aspects of a mixture model for estimating the boundary of a set of data. ICES Journal of Marine Science 46(2): 140-147.
Nyabako, T. 2012. An assessment of the adaptability to climate change of commercially available maize varieties in Zimbabwe. Environment and Natural Resources Research 2(1): 32.
Ojeda, J.J., K.G. Pembletonc, M.R. Islame, M.G. Agnusdei, and S.C. Garcia. 2016. Evaluation of the agricultural production systems simulator simulating Lucerne and annual ryegrass dry matter yield in the Argentine Pampas and south-eastern Australia. Agricultural Systems 143: 61-75.
Okeke, F. and A. Karnieli. 2006. Methods for fuzzy classification and accuracy assessment of historical aerial photographs for vegetation change analyses. Part Ⅰ: Algorithm development. International Journal of Remote Sensing 27(1): 153-176.
Olesen, J.E., M. Trnka, K.C. Kersebaum, A.O. Skjelvåg, B. Seguin, P. Peltonen-Sainio, F. Rossi, J. Kozyra, and F. Micale. 2011. Impacts and adaptation of European crop production systems to climate change. European Journal of Agronomy 34(2): 96-112.

EVALUATION OF FUZZY LOGIC SYSTEMS TO ASSESS CLIMATE SUITABILITY OF ITALIAN RYEGRASS
175
Ramirez-Villegas, J., A. Jarvis, and P. Läderach. 2013. Empirical approaches for assessing impacts of climate change on agriculture: The EcoCrop model and a case study with grain sorghum. Agricultural and Forest Meteorology 170: 67-78.
Reheul, D. and A. Ghequiere. 1996. Breeding perennial ryegrass with better crown rust resistance. Plant Breeding 115(6): 465-469.
Robert, K.D., S. Joe, and G. Sandra. 2003. Life on the edge: vulnerability and adaptation of African ecosystems to global climate change. Mitigation and Adaptation Strategies for Global Change 8: 93-113.
Sugawara, K., T. Inoue, M, Yamashita, and H. Ohkubo. 2006. Distribution of the endophytic fungus, Neotyphodium occultans in naturalized Italian ryegrass in western Japan and its production of bioactive alkaloids known to repel insect pests. Grassland Science 52(4): 147–154.
Takahashi, W., M. Fujimori, Y. Miura, T. Komatsu, Y. Nishizawa, T. Hibi, and T. Takamizo. 2005. Increased resistance to crown rust disease in transgenic Italian ryegrass (Lolium multiflorum Lam.) expressing the rice chitinase gene. Plant Cell Reports 23(12): 811-818.
Tubiello, F.N., C. Rosenzweig, R.A. Goldberg, S. Jagtap, and J.W. Jones. 2002. Effects of climate change on US crop production: simulation results using two different GCM scenarios. Part I: Wheat, potato, maize, and citrus. Climate Research 20(3): 259-270.
Valan Arasu, M., S. Ilavenil, D.H. Kim, S. Gun Roh, J.-C. Lee, and K.C. Choi. 2014. In Vitro and In Vivo Enhancement of Adipogenesis by Italian Ryegrass (Lolium multiflorum) in 3T3-L1 Cells and Mice. PLoS ONE 9: e85297.
Vaz, S., C.S. Martin, P.D. Eastwood, B. Ernande, A. Carpentier, G.J. Meaden, and F. Coppin. 2008. Modelling species distributions using regression quantiles. Journal of Applied Ecology 45(1): 204-217.
Watsons, D.J. 1963. Climate, weather, and plant yield. In: Evans LT, editors. Environmental control of plant growth. New York: Academic Press. pp. 337-350.
White, J.A. and R. Lemus. 2014. Long-Term Summary of Ryegrass Varieties and Ploidy Types in Mississippi. American Journal of Plant Sciences 5(21): 3151-3158.
Zabel, F., B. Putzenlechner, and W. Mauser. 2014. Global agricultural land resources-a high resolution sutability evaluation and its perspectives until 2100 under climate change conditons. PloS ONE 9(9): e107522.
Zadeh, L.A. 1965. Fuzzy sets. Information and Control 8(3): 338-353.

176

IMPACT OF CLIMATE CHANGE ON RICE PRODUCTIVITY AND ADAPTATION STRATEGY IN JAPAN
177
IMPACT OF CLIMATE CHANGE ON RICE PRODUCTIVITY AND ADAPTATION STRATEGY IN
JAPAN
Yasushi Ishigooka1, Motoki Nishimori1, Tsuneo Kuwagata1, and Toshihiro Hasegawa2
1Institute for Agro-Environmental Sciences,
National Agricultural and Food Research Organization (NARO),
Tsukuba, Japan 2Tohoku Agricultural Research Center, NARO, Morioka, Japan
E-mail: [email protected]
ABSTRACT
The recent trend of increasing temperatures has affected agriculture in many ways, including the productivity and quality of rice, which is the staple food in Japan. These effects are predicted to be even more frequent and more severe under climate change projections. This study aimed to evaluate the impact of the projected increasing temperatures due to climate change on the yield and quality of rice and to present the regional differences in the effectiveness of moving the transplanting date, which has been one of the most effective adaptation measures, to avoid the negative effects of high temperatures on rice yield and quality. As an indicator of rice quality, we used the heat stress index HD_m26, calculated as the cumulative temperature within 20 days after the heading date, which is related to the decreased percentage of first-grade rice caused by high temperatures. As the impact assessment model, a process-based rice growth and yield projection model (the Hasegawa/Horie model) was employed. Simulations were conducted based on 18 multiple projected climate scenarios (six GCMs × three RCPs) obtained from CMIP-5 during 1981–2100. Transplanting date for each grids were obtained from the statistics data from 2006 of sub-prefectural regions and were moved at 7-day intervals within the range from −70 to +70 days from the standard transplanting date. The predominant cultivar in each prefecture in 2006 was assigned to grids in the respective prefectures. The estimated yield was categorized into three classes with different degrees of quality decrease risk according to the values of HD_m26. The results showed that when the transplanting date was not changed, total rice production was predicted to increase until the middle of
IMPACT OF CLIMATE CHANGE ON RICE PRODUCTIVITY AND ADAPTATION STRATEGY IN JAPAN
178
this century and subsequently to decrease slightly toward the end of this century; however, the proportion of rice at high risk of quality decrease (following exposure to high temperatures within the early ripening period) was predicted to increase. In the case of selecting the transplanting date that provides the maximum yield without heat stress negatively affecting the quality, the increased risk of a decrease in quality can be avoided while maintaining total productivity. However, a large decrease in yield was predicted in some areas, suggesting that the current rice-producing regions would be separated into distinctly suitable and unsuitable areas as the temperature increases. Keywords: Climate change adaptation, rice yield, rice quality, moving
transplanting date
INTRODUCTION
Rice is one of the most important crops in Japan, and stable rice production under changing climatic conditions is an important issue in terms of national food security. In the past, the main target of climate change impact measures regarding rice production in Japan was to prevent damage due to low temperatures. However, with the tendency toward the increasing frequencies of high-temperature summers since the 1990s, the apparent decline in rice quality, as indicated by the decrease of first-grade rice caused by the increase in the proportion of immature grains due mainly to high temperatures, has emerged, particularly in western Japan. In extremely hot summers such as that of 2010, decreases in rice yield due to high temperatures were observed in some prefectures. The negative effects of high temperature on rice productivity and quality have already been reported in Japan. On the other hand, in recent years, carbon dioxide (CO2) levels in the atmosphere have exceeded 400 ppm, an increase which is due largely to human activities. In the future, global warming progression associated with an increase in greenhouse gases is certain to occur. In this situation, it is necessary to clarify how predicted climate changes will affect rice productivity and quality and to examine practical and feasible adaptation measures to mitigate the negative impacts and the expected effects of these measures.
In this study, we first describe the effects of high temperature that have already been observed on rice production in Japan. We additionally introduce some recent research results related to the impact assessment of projected climate change on rice productivity and quality in Japan at a national scale, followed by an evaluation of the impacts of moving the transplanting date as an adaptation measure to mitigate the effects of heat stress on rice yield and quality.

IMPACT OF CLIMATE CHANGE ON RICE PRODUCTIVITY AND ADAPTATION STRATEGY IN JAPAN
179
RECENT TREND OF HIGH TEMPERATURES AND ITS EFFECT
ON RICE PRODUCTION
The average temperature in summer (June–August), which greatly affects rice production in Japan, has risen by 0.97°C over the past 100 years, with an increase in annual mean temperature of 1.36°C (Fig. 1). Particularly, since the 1990s, unprecedented extremes of high temperatures have been reported. In 2007, the highest recorded temperature of 40.9°C was simultaneously observed at the Kumagaya observation station in Saitama Prefecture and at the Tajimi observation station in Gifu Prefecture, which broke the previous highest temperature record in Japan (40.8°C in Yamagata, 1933) since 74 years. In 2013, only 6 years later, a temperature of 41.0°C was recorded at the Ekawasaki observation station in Kochi Prefecture. Five years later, in 2018, a new highest temperature of 41.1°C was recorded again at the Kumagaya observation station; this is the current record of the highest temperature in Japan. Because the observation instruments, the environment around the observation site, and the method of detecting extreme temperatures have all changed over time, these frequent increases in the highest temperature recorded is not necessarily due to climate change. However, the trend of increasing temperatures in recent years is clear from the fact that a majority of the years that have been ranked in the top ten in terms of the highest average summer temperature have occurred since 1990, with 2010 being the year with the current highest average temperature.

IMPACT OF CLIMATE CHANGE ON RICE PRODUCTIVITY AND ADAPTATION STRATEGY IN JAPAN
180
Fig. 1. Time-series change in the mean summer temperature (June–August).
The values represent the difference from the average for the period
1971–2000. The curve represents the 5-year moving average. Data were
obtained from the website of the Japan Meteorological Agency
(https://www.data.jma.go.jp/cpdinfo/temp/list/mon_jpn.html).
In this situation, especially since the 1990s, the warming trends have
already significantly affected nearly all types of crops in Japan (Sugiura et al., 2012). In the case of rice, the decrease in quality caused by the high temperatures is extremely serious. Particularly in the Kyushu region, the decline in the proportion of first-grade rice since 2000 has been remarkable. The grade of rice quality is based on the percentage of undamaged grains; therefore, the increasing frequency of white immature grains or spotted grains causes a decrease in the grade of rice quality. The main cause of white immature grains (chalky grains) is considered to be high temperature during the early ripening period; the frequency of immature grains increases when the average temperature within 20 days after the heading date is more than 26~27°C (Morita et al., 2016). In 2010, the average summer temperature was the highest historically, with high-temperature injuries occurring in rice crops throughout the country. In particular, the impact on the quality of rice grain has been severe; in most regions with the exception of Hokkaido, a decrease in the proportion of first-grade rice has been observed, especially in

IMPACT OF CLIMATE CHANGE ON RICE PRODUCTIVITY AND ADAPTATION STRATEGY IN JAPAN
181
Niigata Prefecture, Gunma Prefecture, and Saitama Prefecture, where the lowest level of rice quality in the past 30 years was recorded. As the decline in quality leads to a decrease in farmers’ income, it is necessary to mitigate these detrimental effects as soon as possible.
With respect to the effect of high temperature on rice yield, the decrease in rice yield is caused by the increase in spikelet sterility as a result of fertilization failure at very high temperatures during the flowering period (“high-temperature sterility”), and by the decrease in the length of the growth period from transplanting to maturity by the acceleration of crop growth at high temperatures, resulting in a reduction in biomass accumulation as cumulative photosynthesis decreases. As for the high-temperature sterility, the National Institute for Agro-Environmental Sciences, and the Institute of Crop Science, National Agriculture and Food Research Organization, have investigated the rice crop damage caused by the very high temperatures in 2007 in the Kanto and Tokai regions. The results showed that spikelet sterility tended to be found largely in paddy fields which were exposed to high temperatures at the times of heading and flowering (Hasegawa et al., 2009). So far, the large-scale decrease in rice yield caused by high temperature, which appears clearly in statistical literature, has not occurred in Japan. However, there is a possibility that the decrease in rice yield due to the high-temperature sterility will emerge as global warming progresses.
LARGE-SCALE IMPACT ASSESSMENT AND
ADAPTATION MEASURES
Rice is the most important cereal crop in Japan, so that the impact of projected climate change on rice productivity has attracted much attention. Therefore, impact assessment studies on rice have been carried out at the regional or national scale in many previous studies. Here we introduce a case study with respect to the impact assessment on Japanese rice production and quality under the projected climate conditions (Ishigooka et al., 2017), with this study examining the effects of moving the transplanting date as an adaptation measure for preventing the high-temperature impacts on either yield or quality. We outline the research process and present some major results from this study; please refer to the original paper (Ishigooka et al., 2017) for more details.
As an impact assessment model, a process-based model that allows the identification of individual impact factors and the setting of adaptation options is appropriate to evaluate not only the climate impact but also the effects of adaptation. In this study, we employed the Hasegawa–Horie model, a process-based rice simulation model for estimating rice phenological development and yield developed by Hasegawa and Horie (1997) and

IMPACT OF CLIMATE CHANGE ON RICE PRODUCTIVITY AND ADAPTATION STRATEGY IN JAPAN
182
modified by Fukui et al. (2015) and Yoshida et al. (2015). This model consists mainly of the growth process and the photosynthetic process; the former calculates the developmental stage (panicle formation period, heading period, maturity period, etc.), while the latter calculates the amount of biomass (dry matter production) by the net assimilation product formation process (the balance between carbon fixation by photosynthesis and respiratory consumption). In the photosynthetic process, the biomass increase due to the CO2 fertilization effect is also taken into account.
The model was implemented based on the “second-order mesh,” which had been standardized by the Japanese Industrial Standards and defined as a resolution of 5′ latitude by 7.5′ longitude (approximately 10 km × 10 km). Japan as a whole is covered by about 4700 grids. The evaluation period was 120 years from 1981 to 2100, and the climate change scenarios as inputs (daily) were obtained from six global climate models (GCMs) with three greenhouse gas emission scenarios (Representative Concentration Pathways; RCPs) (18 scenarios in total). To clarify the effect of moving the cropping calendar as an adaptation measure to reduce the negative impact of climate change on rice production and quality, the transplanting date in 2006 was considered to be the standard, being assigned to each mesh from the statistical data and was moved at 7-d intervals within the range of–70 to +70 days from the standard transplanting date as the starting point. The purpose of this study was to clarify the effect of moving only the transplanting date as an adaptation measure under the climate change conditions, so that the other conditions, such as the cultivars planted, the fertilizer application strategies, etc., were fixed under the current conditions.
We used the heat index (HD_m26: cumulative temperature above 26°C during the 20 days after the heading date) as the indicator of the risk of rice quality decrease due to high temperatures, based on the fact that there was a qualitative relationship between HD_m26 and the proportion of first-grade rice at the prefecture level, independent of cultivar (Ishigooka et al., 2011). Here, referring to the relationship between the HD_m26 value summarized in each prefecture and the proportion of first-grade rice, it was decided to show the degree of risk by the following criteria:
0°C·days ≤ HD_m26 < 20°C·days: Low risk of heat-induced quality
decrease (Class A) 20°C·days ≤ HD_m26 < 40°C·days: Middle risk of heat-induced quality
decrease (Class B) 40°C·days ≤ HD_m26: High risk of heat-induced quality decrease
(Class C)
By this standard, the calculated yield in each year was classified into three
IMPACT OF CLIMATE CHANGE ON RICE PRODUCTIVITY AND ADAPTATION STRATEGY IN JAPAN
183
classes and an average value was calculated every 20 years. In other words, the average yield and the constituent ratio of each classification representing the risk of quality decrease due to high temperature for every 20-year period were calculated for each calculation unit (i.e., approximately 10 km × 10 km mesh). Based on these values, the optimal transplanting date was determined according to the following two adaptation types by moving the transplanting date for each 20-year period: the transplanting date was moved to maximize the 20-year average of total yield (adaptation 1: yield-oriented type), or the transplanting date was moved to maximize the 20-year average of Class A yield (adaptation 2: quality-oriented type).
Here, we show the yield estimation result based on HadGEM2-ES (a climate model) with RCP8.5 (a greenhouse gas emission scenario), which estimates a relatively large temperature increase as that the average temperature at the end of the 21st century increases by 5.3°C on the nationwide average compared to the end of 20th century, as an example of the simulation result by “no-adaptation.” Fig. 2 shows the distribution map of the percentage of the 20-year total yield average (2081–2100) relative to that in the baseline period (1981–2000). While the yield increases from northern Japan to the central mountainous region as a whole, there is no significant change in the west from Kanto or Hokuriku, and the decrease is observed in some inland basins and plains in south-central Japan. In the projection of future environmental conditions (the temperature increase and the CO2 concentration elevation), the yield is increased by the CO2 fertilizer effect and by the decrease in cold damage, while the yield is decreased by the shortening of the growth period and by the increase in spikelet sterility as the temperature increases. In the model, the yield is calculated as the balance of these factors. In the case of this example, the total increased-yield effects of CO2 fertilization and decreased cold damage is significantly greater than the decreased-yield effects of shortened growing period, resulting in large yield increases in northern Japan, while the CO2 fertilization effect seems to be cancelled out by the shortening in growing period, so that significant yield changes are not observed in many regions in the west from Kanto, with significant declines in yield being observed in some plains as a result of increased occurrence of spikelet sterility due to the high temperatures.

IMPACT OF CLIMATE CHANGE ON RICE PRODUCTIVITY AND ADAPTATION STRATEGY IN JAPAN
184
Fig. 2. Distribution maps of the percentage of the 20-year average of the total
yield in 2081–2100 relative to that in the baseline period (1981–2000)
based on HadGEM2-ES with RCP8.5 by “no-adaptation.” Black areas
indicate the areas where paddy fields do not exist (from Ishigooka et al.,
2017).
The total rice production was estimated by aggregating the yield
calculated in each grid weighted by the percentage of paddy area in each grid in the whole country. The time-series change in total production and the components of each class for every 20-year period based on HadGEM2-ES with RCP8.5 is shown in Fig. 3. Here, the total production of each 20-year period is classified into Class A ~ C by different color according to the value of HD_m26. The total production increased throughout the former half of the period, while it declined slightly in the latter half of the period. On the other hand, the proportion classified into quality Class B or C increased continuously throughout the period, and the majority of all rice production was composed of Class C by the latter half of the period. In other words, most of the production will possibly be occupied by low-quality rice in some climate scenarios without introducing any adaptation measures, although the total rice production of the entire country is sufficiently secure.

IMPACT OF CLIMATE CHANGE ON RICE PRODUCTIVITY AND ADAPTATION STRATEGY IN JAPAN
185
Fig. 3. Time series of changes in total rice production and components in each
quality class based on HadGEM2-ES with RCP8.5 by “no-adaptation.”
Production levels are expressed as the percentage of those at the
baseline (1981–2000) (from Ishigooka et al., 2017).
Then, in order to evaluate the effect of the moving the transplanting date as an adaptation, the optimum transplanting date was selected for each mesh by every 20-year period, according to adaptation 1 (yield-oriented) or adaptation 2 (quality-oriented). In the above case, the total nationwide production and the percentage of the grain in each class were summarized. As an example, in the case of adaptation 2, based on HadGEM2-ES with RCP8.5, the distribution map of the percentage of the 20-year average for total yield (2081–2100) relative to that in the baseline period (1981–2000) is shown in Fig. 4, while the time-series change in the total production and quality components in each class by every 20-year period is shown in Fig. 5. As shown in Fig. 5, no marked increase or decrease in total production was found throughout the entire period, with no increased risk of quality loss, indicating that the predicted negative effects of temperature increase on both yield and quality can be avoided by selecting the appropriate transplanting date at the national level. However, it can also be seen that rice yield will be greatly reduced in some regions (Fig. 4), suggesting that it seems to be difficult to avoid the negative impact of increasing temperatures simply by moving the transplanting date in such regions. This is considered to be partly due to the narrow width of the selectable transplanting date as a result of the climatic restrictions. If, for example, a late transplanting date is required to avoid high temperatures, the crop will be unable to intercept sufficient solar

IMPACT OF CLIMATE CHANGE ON RICE PRODUCTIVITY AND ADAPTATION STRATEGY IN JAPAN
186
radiation in the shortened ripening period by moving the transplanting date to after the autumn, causing a yield reduction. In such cases, it will be difficult to reduce the impact of the increased temperatures by only moving the transplanting date, but it will be necessary to consider the application of other adaptive technology options, such as the introduction of cultivars having different heading dates and of cultivars tolerant to high-temperature stress.
Fig. 4. Distribution maps of the percentage of the 20-year average of total yield
in 2081–2100 relative to that in the baseline period (1981–2000) based
on HadGEM2-ES with RCP8.5 by “adaptation 2.” Black areas indicate
the areas where paddy fields do not exist (from Ishigooka et al., 2017).

IMPACT OF CLIMATE CHANGE ON RICE PRODUCTIVITY AND ADAPTATION STRATEGY IN JAPAN
187
Fig. 5. Time series of changes in total rice production and components of each
quality class based on HadGEM2-ES with RCP8.5 by “adaptation 2.”
Production levels are expressed as percentage of the baseline
production (1981–2000) (from Ishigooka et al., 2017).
CONCLUSION
In this study, we illustrate the impact assessment and the effects of the introduction of adaptation measures based on only one climate scenario, but there is considerable width for each scenario in the future climate projection, and it is essential to take into account the uncertainty of climate projections. In the examples presented here, we used 18 climatic scenarios, each of them had been given different output results. However, it was observed that the regional distribution of rice yield and the time-series change in total production were relatively similar. On the other hand, the difference between the climatic scenarios was large in terms of the rice quality, and it can be said that the uncertainty is large at the present stage.
In addition to the uncertainties in climate projection, there are uncertainties inherent in the impact assessment model. Therefore, it is important to present the evaluation results that can be interpreted as multiple simulation results in a stochastic manner. Additionally, the effort to reduce the uncertainty of the impact assessment model itself is also important. As for the rice growth model, the uncertainty of the estimation result can be clarified by advancing the elucidation of the environmental response mechanism in each process and by reflecting the acquired knowledge into the model. In particular, in the case of impact assessment under future

IMPACT OF CLIMATE CHANGE ON RICE PRODUCTIVITY AND ADAPTATION STRATEGY IN JAPAN
188
projected environmental conditions, it is important to clarify the interactive influences of high temperature and elevated CO2 level.
In considering the implementation of adaptation measures in response to predicted global warming, it is not enough to develop adaptive technologies for individual phenomena, but it is essential to consider indirect impacts such as the combined effects of each impact and the costs associated with implementing adaptation measures and other risks that may arise. In the case of introducing the change in the transplanting date as the adaptation measure in rice cultivation, it can be said that it is a relatively low-cost adaptation, but actually in some cases it is difficult to move the transplanting period significantly due to irrigation practices or from the viewpoint of securing labor. It should also be considered that the late transplanting date will possibly lead to water resource scarcity at the puddling stage, interaction with the typhoon period, and other risks such as changes in agricultural ecosystems and pests.
REFERENCES
Fukui, S., Y. Ishigooka, T. Kuwagata, and T. Hasegawa. 2015. A methodology for estimating phenological parameters of rice cultivars utilizing data from common variety trials. Journal of Agricultural Meteorology 71(2): 77–89.
Hasegawa, T. and T. Horie. 1997. Modelling the effect of nitrogen on rice growth and development. In Applications of systems approaches at the field level. (ed. by Kropff MJ, Teng PS, Aggarwal PK, Bouma J, Bouman BAM, Jones JW, van Laar HH). Kluwer, Dordrecht, pp. 243–257.
Hasegawa, T., M. Yoshimoto, T. Kuwagata, Y. Ishigooka, M. Kondo, and T. Ishimaru. 2009. A study on the high temperature sterility of rice plants in summer 2007. Agriculture and Horticulture 84(1): 42–45. (in Japanese).
Ishigooka, Y., T. Kuwagata, M. Nishimori, T. Hasegawa, and H. Ohno. 2011. Spatial characterization of recent hot summers in Japan with agro-climatic indices related to rice production. Journal of Agricultural Meteorology 67(4): 209–224.
Ishigooka, Y., F. Fukui, T. Hasegawa, T. Kuwagata, M. Nishimori, and M. Kondo. 2017. Large-scale evaluation of the effects of adaptation to climate change by shifting transplanting date on rice production and quality in Japan. Journal of Agricultural Meteorology 73(4): 156–173.
Morita, S., H. Wada, and Y. Matsue. 2016. Countermeasures for heat damage in rice grain quality under climate change. Plant Production Science 19(1): 1–11.
Sugiura. T., H. Sumida, S. Yokoyama, and H. Ono. 2012. Overview of recent effects of global warming on agricultural production in Japan. JARQ

IMPACT OF CLIMATE CHANGE ON RICE PRODUCTIVITY AND ADAPTATION STRATEGY IN JAPAN
189
46(1): 7–13. Yoshida, R., S. Fukui, T. Shimada, T. Hasegawa, Y. Ishigooka, I. Takayabu,
and T. Iwasaki. 2015. Adaptation of rice to climate change through a cultivar-based simulation: a possible cultivar shift in eastern Japan. Climate Research 64: 275–290.

190

IMPROVEMENTS IN CLIMATE CHANGE RISK ASSESSMENT FOR GLOBAL CROP PRODUCTION
191
IMPROVEMENTS IN CLIMATE CHANGE RISK ASSESSMENT FOR GLOBAL CROP PRODUCTION
Toshichika Iizumi
Institute for Agro-Environmental Sciences, National Agriculture and Food Research Organization (NARO), Tsukuba, Japan
E-mail: [email protected]
ABSTRACT
Accumulated evidence indicates that agricultural production is being affected by climate change. Between 1981 and 2010, the global average annual production loss caused by climate change, relative to that caused by the non-warming counterfactual climatic conditions, accounted for 22.3, 13.6, 6.5, 0.8 billion US dollars for maize, wheat, soybean and rice, respectively. These findings confirm that climate change has resulted in food production losses, and till date, food production has not been sufficiently adapted to offset the negative impacts of climate change, particularly at lower latitudes. Adaptation technology, in addition to crop yield-increasing technology, is therefore necessary to maintain yield growth at rates necessary to meet the increasing demand for food. Climate change risk assessments are a basis of national adaptation policy making and planning. As consumers in many countries are becoming more dependent on food imports than before, national governments and commercial entities in import-dependent countries are paying close attention to variations in food production and export prices in major food-exporting countries, as well as to their own domestic production. For this reason, both global assessments and detailed country-based assessments are vital for national food agencies. However, global assessments often suffer from a lack of data, imperfect modeling, and uncertainties associated with various sources. This chapter describes the recent efforts made by the National Agriculture and Food Research Organization, with the help of research collaborators, to address some of these issues. The topics discussed in this article include improvements to global gridded crop modeling, spatially explicit global and historical crop datasets, and climate change risk assessments for changes in yield growth and variability with respect to major crops at the global scale. Keywords: Climate change, global assessment, yield growth, yield
variability

IMPROVEMENTS IN CLIMATE CHANGE RISK ASSESSMENT FOR GLOBAL CROP PRODUCTION
192
INTRODUCTION Global demand for food has been anticipated to increase two-fold in 2050 compared with that in 2005 (Ray et al., 2013). In other words, the anticipated food demand in the middle of this century will be 1.6 times higher than that in 2016. Although a 2.4% annual yield growth is required to meet this supply goal without further land clearing, the actual yield growth rates of major crops in the past decades (1989−2008; 0.9%–1.6%) were lower than the target rate (Ray et al., 2013). More importantly, yield stagnation has been observed for some crop–country combinations (Ray et al., 2012, Grassini et al., 2013, Iizumi et al., 2014). These findings indicate that global agriculture is already under pressure to meet the increasing demand for food even without being affected by climate change.
Recent climate change has proved to be an additional burden for crop production systems worldwide. A report by the Japan Meteorological Agency (JMA) revealed that, as of February 2019, all of five warmest years regarding global annual mean surface temperature, relative to 1981–2010, occurred in the 2010s, namely, 2016 (+0.45°C), 2015 (+0.42°C), 2017 (+0.38°C), 2018 (+0.31°C) and 2014 (+0.27°C) (JMA, 2018). This warming is attributed to a main climatic factor leading to 5.5% and 3.8% decline in global production for wheat and maize, respectively, compared with what would have been achieved without the effect of warming during 1980–2008 (Lobell et al., 2011). These production losses are not negligible considering the global food demand–supply balance if these losses are considered to be approximately equal to the annual production of wheat in France (33 Mt) and maize in Mexico (23 Mt) (Lobell et al., 2011).
Recently, temperature and precipitation changes have been identified to contribute in some degree to the recent yield stagnation of wheat and barley in Europe (Moore and Lobell, 2015); however, it is very likely that changes in environmental policy and economy contributed more to the reported yield stagnation (Brisson et al., 2010). This poses a question that needs to be addressed by research: how will future yield growth be affected by projected climate change? Process-based crop models are essential tools in climate change risk assessment, but it is not easy to answer this question because assumptions regarding future agronomic technologies are necessary. Improvements to global crop modeling to simulate yield growth To address the aforementioned question, a global gridded crop model Crop Yield Growth Model with Assumption on climate and socioeconomy (CYGMA; Iizumi et al., 2017) has been developed. The model globally operates at the 0.5° resolution with a daily time step. Yields under rainfed

IMPROVEMENTS IN CLIMATE CHANGE RISK ASSESSMENT FOR GLOBAL CROP PRODUCTION
193
and irrigated conditions are separately simulated and then combined when calculating the average yield over a given spatial domain (e.g., country).
In the model, crop development is modeled as a fraction of the accumulated growing degree-days relative to the crop’s thermal requirements. Leaf growth and senescence are determined according to the fraction of the growing season using the prescribed shape of the leaf area index curve. Yields are computed from the photosynthetically active radiation intercepted by the crop canopy, radiation-use efficiency (RUE), effects of CO2 fertilization on RUE, and fraction of total biomass increments allocated to the harvestable component. The soil water balance submodel, which is coupled with the snow cover submodel, is used to calculate the actual evapotranspiration. Five different stress types, nitrogen (N) deficit, heat, cold, water deficit, and water excess, are taken into account. The most dominant stress type for each day reduces the daily potential increase in the leaf area and yield. All the stress types, except N deficit, are the functions of daily weather, and the tolerance of each crop to these stresses increases as the knowledge stock increases. Knowledge stock is an economic indicator that is calculated as the sum of the annual agricultural research and development expenditures for each country since the 1961, with a certain obsolescence rate, and it represents the average level of technology and management used by farmers in the country in question.
The N application rates in the model increase and level according to the changes in a country’s annual per capita gross domestic product and per capita agricultural area. Sowing dates in the model are updated annually in response to changes in temperature and moisture regimes. Crop thermal requirements are also updated annually based on long-term mean temperature conditions, which represent the use of longer-season varieties to prevent shortened crop durations and associated yield decreases. Additional modeling details and validation results have been reported in the study by Iizumi et al. (2017). Production losses associated with historical climate change By using the historical and non-warming counterfactual climate conditions derived from the atmospheric general circulation model simulation as the inputs to the CYGMA model, Iizumi et al. (2018b) demonstrated that climate change has decreased the global mean yields of maize, wheat, and soybeans by 4.1%, 1.8%, and 4.5%, respectively, relative to the non-warming counterfactual, even when CO2 fertilization and agronomic adjustments are considered. For rice, no significant yield impacts (+0.9%) were detected at the global scale. The estimates are comparable to those derived from statistical regression reported by Lobell et al. (2011) (−3.8%, +2.9%, and

IMPROVEMENTS IN CLIMATE CHANGE RISK ASSESSMENT FOR GLOBAL CROP PRODUCTION
194
−2.5% for maize, rice, and wheat, respectively), with a discrepancy for soybean (+1.3%). The estimates of yield impacts between 1981 and 2010 indicate average annual production losses over the globe as a result of climate change, relative to the non-warming counterfactual, valued at 22.3, 13.6, 6.5, 0.8 billion US dollars for maize, wheat, soybean and rice, respectively. These findings are based on the process-based climate and crop modeling, and underpin the ideas that global crop production is being affected by climate change and that net production losses have occurred. The similarities between statistical and process-based approaches improve our confidence in the impacts of historical climate change on global crop production. More details on the simulated historical and non-warming counterfactual climate data are available from Shiogama et al. (2016), Imada et al. (2017), and Mizuta et al. (2017), as well as from Iizumi et al. (2018b). Anticipated yield growth under future climate change Using the CYGMA model and bias-corrected atmosphere–ocean coupled general circulation model daily outputs generated in phase 5 of the Coupled Model Intercomparison Project (CMIP5), Iizumi et al. (2017) revealed that the global mean maize yield for a temperature increase of 1.8°C would stagnate slightly, compared to the no-climate-change case (it assumes that future climate change is fixed to be the level of the 1981−2010 period). The yield stagnation of maize would be more severe under warming conditions (1.11 with a 2.7°C increase and 1.02 with a 3.2°C increase when average yield in the base period 2001−2010 is scaled to be 1.00) and would eventually result in a net decrease in yield at a temperature increase of 4.9°C (0.61) (Fig. 1). A net decrease in the global mean yield was also found for soybean, while yield stagnation under extreme warming (4.9°C) was found for both rice and wheat even though CO2 fertilization and agronomic adjustments had been taken into account. Although rice and wheat on a global mean basis are found to be relatively less sensitive to warming than maize and soybean, note that yield stagnation of rice and wheat with a 1.8°C temperature increase is projected at lower latitudes (Iizumi et al., 2017). These outlooks suggest that adoption of more advanced adaptation technology beyond simple agronomic adjustments (such as changing sowing date and using long-season cultivars) is unavoidable if we are to maintain yield growth in coming decades under anticipated conditions of climate warming.

IMPROVEMENTS IN CLIMATE CHANGE RISK ASSESSMENT FOR GLOBAL CROP PRODUCTION
195
Fig. 1. Responses of global decadal mean yield at the end of this century
(2091−2100) to warming relative to preindustrial levels. The global
decadal mean surface temperature changes, relative to 1850–1900,
have been used as the indicators of warming. Decadal mean yields are
scaled so that the average yield in 2001–2010 is 1.00. The
middle-of-road socioeconomic development pathways [known as the
Shared Socioeconomic Pathways (SSP) 2; O’Neill et al. (2014)] has been
used to derive future agronomic technologies and management
scenarios. The data shown here are sourced from those presented in
the study by Iizumi et al. (2017).
Improvements to global crop datasets Climate change risk assessments are the basis of adaptation policy making and planning. Continual improvements to basic tools, such as crop models and datasets, are therefore necessary to enable researchers conducting such an assessment to aim to address questions related to more recent political agendas, including the United Nations Sustainable Development Goals (SDGs) (the United Nations (UN), 2018). As already shown, the climate change impacts on recent and future yield growth are one example of such questions related to the food security target in SDGs 2 and the climate change target in SDGs 13.

IMPROVEMENTS IN CLIMATE CHANGE RISK ASSESSMENT FOR GLOBAL CROP PRODUCTION
196
Another example of such a question is: have recent changes in weather extremes had a measurable influence on yield variability? To address this question, annual time series data of crop yields are required. At this moment in time, only two different global historical yield datasets are available. One was compiled by Ray et al. (2012), which is a crop yield and area harvested database covering ~2.5 million statistics in ~13,500 political units globally for the period 1961−2008. The other is described by Iizumi et al. (2014) and is a hybrid of national yield statistics reported by the Food and Agriculture Organization of the United Nations (FAO) and a satellite-derived crop-specific vegetation index. Our dataset (Iizumi et al., 2014) initially covered the period 1982−2006 with the grid size of 1.125° (version 1; Table 1) but was extended to cover the period 1981−2011 (Iizumi and Ramankutty, 2016) (version 1.1). Furthermore, the latest version 1.2 of our dataset was improved to have a spatial resolution of 0.5°, while the year coverage was the same as the earlier version (1981−2011) (Iizumi et al., 2018a).
To the best of our knowledge, Iizumi et al. (2018a) was the first study to explore uncertainties in the estimated areas with yield variability changes associated with different yield datasets and spatial resolutions. They found that the conclusion of Iizumi and Ramankutty (2016) (that a decrease in yield variability is the main trend worldwide across crops, though yields in some regions of the world have become more unstable) was robust, especially for maize and soybean (Fig. 2). For rice and wheat, however, the conclusion on yield variability changes was relatively sensitive to the choice of dataset and resolution. Nevertheless, in most cases across the possible combinations of datasets and resolutions, for rice and wheat, the extent of areas with increased yield variability were comparable to that with decreased yield variability. Importantly, on a global scale, over 21% of the yield variability change could be explained by climate change (Iizumi and Ramankutty, 2016). It is evidence showing that recent changes in daily temperature and precipitation extremes have affected yield variability in many parts of the world. Given the projection that yield variability would increase in a warmer climate (Tigchelaar et al., 2018), these findings have implications for national governments and commercial entities in import-dependent countries to have greater preparedness in terms of response to production and price shocks in food-exporting countries as a result of climate extremes.

IMPROVEMENTS IN CLIMATE CHANGE RISK ASSESSMENT FOR GLOBAL CROP PRODUCTION
197
Table 1. Improvements to global datasets of historical yields
Version 1.0 Version 1.1 Version 1.2
Reference Iizumi et al. (2014) Iizumi and
Ramankutty
(2016)
Iizumi et al.
(2018a)
Period 1982–2006 1981–2011
Resolution 1.125° 0.5°
Crops Maize (major/secondary), soybean, rice
(major/secondary), wheat (winter/spring)
Yield statistics FAO national yield statistics (FAO, 2018)
Satellite
products
Second generation
GIMMS 0.073° 15-day
NDVI (Pinzon et al.,
2005, Tucker et al.,
2005)
Third generation GIMMS 0.083°
15-day LAI and FPAR (Zhu et al.,
2013)
Radiation JRA-25 reanalysis (Onogi et al., 2007)
Harvested area M3-Crops (Monfreda et al., 2008)
Calendar SAGE (Sacks et al., 2010)
Production share
by season
Major world crop areas and climatic profiles (U.S.
Department of Agriculture, 1994)
Fig. 2. Yield variability changes of maize, soybean, rice, and wheat during 1981–
2008 calculated using the global dataset of historical yields version 1.2
(see Table 1 for details). The data are classified into the four categories
of yield variability change. The data shown here are sourced from those
presented in the study by Iizumi et al. (2018a). The similar but colored
figure is found in Figure G in Supporting Information of Iizumi et al.
(2018a).

IMPROVEMENTS IN CLIMATE CHANGE RISK ASSESSMENT FOR GLOBAL CROP PRODUCTION
198
CONCLUSION
This article describes the recent efforts achieved at NARO with collaborating researchers to improve climate change risk assessments for global crop production. The improvements to the global gridded crop model and the global crop dataset described earlier lead to insights on what has occurred in global crop production systems over the past decades and what can be anticipated in terms of global food security in coming decades because of climate and socioeconomic change. Our assessment results highlight the importance of advanced adaptation technology to maintain yield growth at rates necessary to meet increasing global food demand. At the same time, efforts to make production systems more resilient to climate variability and extremes are important in the face of climate change.
ACKNOWLEDGEMENTS T.I. was partly supported by the Grant-in-Aid for Scientific Research (B, 16KT0036 and 18H02317 and C, 17K07984) of Japan Society for the Promotion of Science, the Environment Research and Technology Development Fund (S-14) of the Environmental Restoration and Conservation Agency and the Joint Research Program of Arid Land Research Center, Tottori University (30F2001).
REFERENCES Brisson, N., P. Gate, D. Gouache, G. Charmet, F-X Oury, and F. Huard. 2010
Why are wheat yields stagnating in Europe? A comprehensive data analysis for France. Field Crops Research, 119, 201-212.
FAO. 2018. FAOSTAT. http://www.fao.org/faostat/en/#home. Accessed on 25 October, 2018.
Grassini, P., K.M. Eskridge, and K.G. Cassman. 2013. Distinguishing between yield advances and yield plateaus in historical crop production trends. Nature Communications, 4, 2918, doi:10.1038/ncomms3918.
Iizumi, T., N. Ramankutty. 2016. Changes in yield variability of major crops for 1981–2010 explained by climate change. Environmental Research Letters, 11, 034003, doi:10.1088/1748-9326/11/3/034003.
Iizumi, T., M. Yokozawa, G. Sakurai, M.I. Travasso, V. Romanenkov, P. Oettli, T. Newby, Y. Ishigooka, and J. Furuya. 2014. Historical changes in global yields. Global Ecology and Biogeography, 23, 346-357.
Iizumi, T., J. Furuya, Z. Shen, W. Kim, M. Okada, S. Fujimori, T. Hasegawa, and M. Nishimori. 2017. Responses of crop yield growth to global
IMPROVEMENTS IN CLIMATE CHANGE RISK ASSESSMENT FOR GLOBAL CROP PRODUCTION
199
temperature and socioeconomic changes. Scientific Reports, 7, 7800, doi:10.1038/s41598-017-08214-4.
Iizumi, T., M. Kotoku, W. Kim, P.C. West, J.S. Gerber, and M.E. Brown. 2018a. Uncertainties of potentials and recent changes in global yields of major crops resulting from census- and satellite-based yield datasets at multiple resolutions. PLoS ONE, 13(9), e0203809, https://doi.org/10.1371/journal.pone.0203809.
Iizumi, T., H. Shiogama, Y. Imada, N. Hanasaki, H. Takikawa, and M. Nishimori. 2018b. Crop production losses associated with anthropogenic climate change for 1981–2010 compared with preindustrial levels. International Journal of Climatology, 38, 5405–5417.
JMA. 2018. global annual mean surface temperature anomaly. http://www.data.jma.go.jp/cpdinfo/temp/an_wld.html. Accessed on 25 October.
Imada, Y., S. Maeda, M. Watanabe, H. Shiogama, R. Mizuta, M. Ishii, and M. Kimoto. 2017. Recent enhanced seasonal temperature contrast in Japan from large ensemble high-resolution climate simulations. Atmosphere, 8, 57.
Lobell, D.B., W. Schlenker, and J. Costa-Roberts. 2011. Climate trends and global crop production since 1980. Science, 333, 616-620.
Mizuta, R., A. Murata, M. Ishii, H. Shiogama, K. Hibino, N. Mori, O. Arakawa, Y. Imada, K. Yoshida, T. Aoyagi, H. Kawase, M. Mori, Y. Okada, T. Shimura, T. Nagatomo, M. Ikeda, H. Endo, M. Nosaka, M. Arai, C. Takahashi, K. Tanaka, T. Takemi, Y. Tachikawa, K. Temur, Y. Kamae, M. Watanabe, H. Sasaki, A. Kitoh, I. Takayabu, E. Nakakita, and M. Kimoto. 2017. Over 5000 years of ensemble future climate simulations by 60 km global and 20 km regional atmospheric models. Bulletin of the American Meteorological Society, 98, 1383-1398.
Monfreda, C., N. Ramankutty, and J.A. Foley. 2008. Farming the planet: 2. Geographic distribution of crop areas, yields, physiological types, and net primary production in the year 2000. Global Biogeochemical Cycles, 22, GB1022, https://doi.org/10.1029/2007GB002947.
Moore, F.C. and D.B. Lobell. 2015. The fingerprint of climate trends on European crop yields. Proceedings of the National Academy of Sciences of the United States of America, 112, 2670-2675.
O’Neill B.C., E. Kriegler, K. Riahi, K.L. Ebi, S. Hallegatte, T.R. Carter, R. Mathur, and D. van Vuuren. 2014. A new scenario framework for climate change research: the concept of shared socioeconomic pathways. Climatic Change, 122, 387-400.
Onogi, K., J. Tsutsui, H. Koide, M. Sakamoto, S. Kobayashi, H. Hatsushika, T. Matsumoto, N. Yamazaki, H. Kamahori, K. Takahashi, S. Kadokura, K. Wada, K. Kato, R. Oyama, T. Ose, N. Mannoji, and R. Taira. 2007. The

IMPROVEMENTS IN CLIMATE CHANGE RISK ASSESSMENT FOR GLOBAL CROP PRODUCTION
200
JRA-25 reanalysis. Journal of the Meteorological Society of Japan 85, 369-432.
Pinzon, J., M.E. Brown, and C.J. Tucker. 2005. Satellite time series correction of orbital drift artifacts using empirical mode decomposition. In: Huang NE, Shen SSP, editors. Hilbert-Huang Transform: Introduction and Applications, World Scientific, Toh Tuck Link, pp. 167–186.
Ray, D.K., Ramankutty, N.D. Mueller, P.C. West, and J.A. Foley. 2012. Recent patterns of crop yield growth and stagnation. Nature Communications, 3, 1293, doi:10.1038/ncomms2296.
Ray, D.K., N.D. Mueller, P.C. West, and J.A. Foley. 2013. Yield trends are insufficient to double global crop production by 2050. PLoS ONE 8(6), e66428, doi:10.1371/journal.pone.0066428.
Sacks, W.J., D. Deryng, J.A. Foley, and N. Ramankutty. 2010. Crop planting dates: an analysis of global patterns. Global Ecology and Biogeography, 19, 607-620.
Shiogama, H., Y. Imada, M. Mori, R. Mizuta, D. Stone, K. Yoshida, O. Arakawa, M. Ikeda, C. Takahashi, M. Arai, M. Ishii, M. Watanabe, and M. Kimoto. 2016. Attributing historical changes in probabilities of record-breaking daily temperature and precipitation extreme events. SOLA, 12, 225-231.
Tigchelaar, M., D.S. Battisti, R.L. Naylor, and D.K. Ray. 2018. Future warming increases probability of globally synchronized maize production shocks. Proceedings of the National Academy of Sciences USA, 115, 6644-6649.
Tucker CJ, J.E. Pinzon, M.E. Brown, D.A. Slayback, E.W. Pak, R. Mahoney, E.F. Vermote, and N.E. Saleous. 2005. An extended AVHRR 8-km NDVI data set compatible with MODIS and SPOT Vegetation NDVI data. International Journal of Remote Sensing, 26, 4485-4498.
UN. 2018. About the Sustainable Development Goals. https://www.un.org/sustainabledevelopment/sustainable-development-goals/. Accessed on 25 October 2018.
USDA. 1994. Major world crop areas and climatic profiles. http://www.usda.gov/oce/weather/pubs/Other/MWCACP/MajorWorldCropAreas.pdf. Accessed on 25 October 2018.
Zhu Z., J. Bi, Y. Pan, S. Ganguly, A. Anav, L. Xu, A. Samanta, S. Piao, R.R. Nemani, and B.R. Myneni. 2013. Global data sets of vegetation leaf area index (LAI)3g and fraction of photosynthetically active radiation (FPAR)3g derived from global inventory modeling and mapping studies (GIMMS) normalized difference vegetation index (NDVI3g) for the period 1981 to 2011. Remote Sensing, 5, 927-948.

MAKING THE SMALLHOLDER FARMERS IN SOUTHEAST ASIA CLIMATE SMART - THE CCAFS R4D THRUST
201
MAKING THE SMALLHOLDER FARMERS IN SOUTHEAST ASIA CLIMATE SMART
- THE CCAFS R4D THRUST
Leocadio S. Sebastian and Eisen Bernard V. Bernardo
CGIAR Research Program for Climate Change, Agriculture and Food Security (CCAFS)
IRRI-CCAFS Office, Agricultural Genetics Institute,
Hanoi, Vietnam
E-mail: [email protected]
ABSTRACT
Southeast Asia (SEA) is one of the world’s most vulnerable regions to climate change, severely affected by the impacts of climate-related disasters. The UN Food and Agriculture Organization (2017) reported that from 2005 to 2015, USD 14.5 billion worth of crop and livestock production was lost due to natural disasters in Southeast Asia. Millions of people, about 80% of who are smallholder farmers) are constantly at risk due to increased incidence of drought, flooding, and sea level rise. To help minimize the adverse impacts of climate change in agriculture, the CGIAR Research Program on Climate Change, Agriculture and Food Security (CCAFS) promotes climate-smart agriculture (CSA) to smallholder farmers as an approach to disaster risk reduction and climate change adaptation. Since its inception in 2013, CCAFS has done various interventions with its partners in Southeast Asia (SEA) in focus countries such as Cambodia, Lao PDR, and Vietnam. Likewise, it also implemented specific projects with partners in Indonesia, Myanmar, and the Philippines. These regional R4D activities contextualized the four CCAFS Flagships: FP1 – Priorities and Policies for CSA; FP2 – Climate-Smart Technologies and Practices; FP3 – Low Emissions Development; and FP4 – Climate Services and Safety Nets in the aforementioned countries. With the goal of ensuring food security amidst climate change in the region, CCAFS SEA works with its partners to integrate climate change adaptation and mitigation in regional and national development plans. To pursue CCAFS’ vision for Southeast Asian agriculture, more strategic R4D activities are being carried out with partners to address the following opportunities and challenges in the region: 1) coping with climate change for smallholder farmers; 2) sustaining national and regional food and nutrition security; 3) enhancing

MAKING THE SMALLHOLDER FARMERS IN SOUTHEAST ASIA CLIMATE SMART - THE CCAFS R4D THRUST
202
competitiveness in agriculture; and, 4) moving towards regional integration. In addressing the foregoing challenges and opportunities, CCAFS is implementing an integrated R4D approach targeting the region’s food baskets (e.g., Mekong River Delta and Basin, Ayeyarwady River Delta and Central Dry Zone of Myanmar, Red River Delta and Central Highlands in Vietnam, and other big river basins). Aside from their strategic importance in the region’s economy and food and nutrition security, these areas are also highly vulnerable to the adverse effects of climate change.
Keywords: Southeast Asia, climate change, climate-smart agriculture (CSA)
INTRODUCTION
With their significant impacts and contributions, it is important to study the role of smallholder farmers in agricultural development. Usually associated with a farm size of less than two hectares (FAO 2015), the term smallholder encompasses small-scale farms in terms of social, economic, and spatial indicators (Rigg et al, 2015). Globally, it is estimated that 80 percent of the 500 million small farms are managed by smallholders (IFAD 2013). A large majority of them (around 87 percent) are located in Asia, specifically in China, Indonesia, and Vietnam, accounting for 193 million, 17 million, and 10 million, respectively (Rigg et al, 2015). With this great number, smallholder farmers are able to provide as much as 80 percent of the food products being consumed in developing countries (IFAD 2013).
In Southeast Asia, smallholders, such as small-scale farmers, pastoralists, forest keepers, and fishers remain as the dominant force in agricultural production. For instance, more than 80 percent of farms in the region are below two hectares (OECD 2017). In the coconut industry, for example, smallholders account for 80-90% of primary coconut production (OECD FAO 2017). While in fisheries and aquaculture, around 90% of fishers and fish farmers globally are smallholders – an estimated 14.5 million; of which 5.4 million are the fish farmers in the region (FAO, 2017c) (OECD 2017).
Regardless of their significant contributions to the region’s agricultural development, smallholders still belong to the most marginalized sectors. They are confronted by series of intersecting challenges (IFAD 2013), such as competition for land and water, increase in prices of inputs, the unpredictability of markets, limited access to resources, information, and technology, unavailability of capital and assets, and ecosystem degradation. To worsen their condition, the emergence of climate change in recent decades has made smallholders more vulnerable to various climate-related risks and has experienced negative impacts on agriculture.
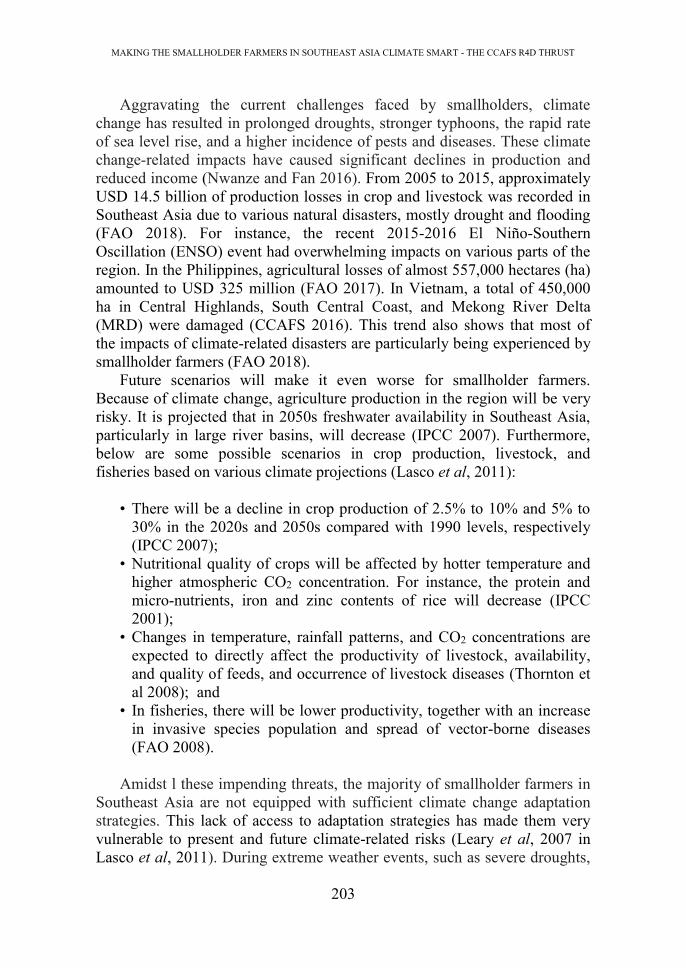
MAKING THE SMALLHOLDER FARMERS IN SOUTHEAST ASIA CLIMATE SMART - THE CCAFS R4D THRUST
203
Aggravating the current challenges faced by smallholders, climate change has resulted in prolonged droughts, stronger typhoons, the rapid rate of sea level rise, and a higher incidence of pests and diseases. These climate change-related impacts have caused significant declines in production and reduced income (Nwanze and Fan 2016). From 2005 to 2015, approximately USD 14.5 billion of production losses in crop and livestock was recorded in Southeast Asia due to various natural disasters, mostly drought and flooding (FAO 2018). For instance, the recent 2015-2016 El Niño-Southern Oscillation (ENSO) event had overwhelming impacts on various parts of the region. In the Philippines, agricultural losses of almost 557,000 hectares (ha) amounted to USD 325 million (FAO 2017). In Vietnam, a total of 450,000 ha in Central Highlands, South Central Coast, and Mekong River Delta (MRD) were damaged (CCAFS 2016). This trend also shows that most of the impacts of climate-related disasters are particularly being experienced by smallholder farmers (FAO 2018).
Future scenarios will make it even worse for smallholder farmers. Because of climate change, agriculture production in the region will be very risky. It is projected that in 2050s freshwater availability in Southeast Asia, particularly in large river basins, will decrease (IPCC 2007). Furthermore, below are some possible scenarios in crop production, livestock, and fisheries based on various climate projections (Lasco et al, 2011):
• There will be a decline in crop production of 2.5% to 10% and 5% to
30% in the 2020s and 2050s compared with 1990 levels, respectively (IPCC 2007);
• Nutritional quality of crops will be affected by hotter temperature and higher atmospheric CO2 concentration. For instance, the protein and micro-nutrients, iron and zinc contents of rice will decrease (IPCC 2001);
• Changes in temperature, rainfall patterns, and CO2 concentrations are expected to directly affect the productivity of livestock, availability, and quality of feeds, and occurrence of livestock diseases (Thornton et al 2008); and
• In fisheries, there will be lower productivity, together with an increase in invasive species population and spread of vector-borne diseases (FAO 2008).
Amidst l these impending threats, the majority of smallholder farmers in
Southeast Asia are not equipped with sufficient climate change adaptation strategies. This lack of access to adaptation strategies has made them very vulnerable to present and future climate-related risks (Leary et al, 2007 in Lasco et al, 2011). During extreme weather events, such as severe droughts,

MAKING THE SMALLHOLDER FARMERS IN SOUTHEAST ASIA CLIMATE SMART - THE CCAFS R4D THRUST
204
extreme rainfall and floods, and stronger typhoons, the limited resources and capabilities have resulted in significant loss of livelihood and properties among smallholders. During these times, they are severely affected by higher food prices, as they buy more food than they sell agricultural produce (Vermeulen 2014). To cope with the economic challenges brought by these disasters, they look for off-farm employment opportunities and reduce food consumption (Vermeulen 2014).
With this difficulty of adapting to climate change impacts, the limitations of smallholder further constrain their productivity and resilience (Nwanze and Fan 2016). Because increasing production and income are more of their priority; mitigation activities are also being overlooked. Along with this, smallholder farmers resort to over intensification in agriculture, (IFAD 2013) using technologies and practices like habitat modification, over-extraction of water and nutrients, and use of pesticides, contributing to ecosystem degradation, biodiversity loss, and global warming.
Despite the rapid social and economic development in the Southeast Asian region, smallholders remain to be the largest group dominating the regional agricultural sector (Rigg et al, 2015). With this dominance, the focus should be given to smallholders as they are in the front lines of the battle against climate change. To minimize significant losses in production and ensure the food security in the region, the impacts of climate change should be addressed by focusing on productivity improvement and adaptation of the agriculture sector (ADB in Lasco et al, 2011). As they also contribute to greenhouse gas (GHG) emissions and environmental degradation, smallholders have strong potential to implement mitigation activities, maintain ecosystem services, and protect biodiversity and natural resources (Nwanze and Fan 2016). By investing in adaptation measures, together with mitigation initiatives, the resilience of smallholder farmers to the various climate shocks can be strengthened.
CLIMATE-SMART AGRICULTURE FOR SMALLHOLDERS
In addressing the challenges being faced by smallholders, a multiple-win solution is highly needed. There is a need for a strategy that will promote high productivity and ensure high income, and at the same time, will address the impacts of climate-related disasters and reduce agriculture’s contributions to climate change. With this, a new agricultural paradigm has emerged to tackle the interlinking challenges of climate change, agriculture, and food security. Climate-smart agriculture (CSA) is defined as an approach that guides actions needed to transform and reorient agricultural systems to effectively support sustainable development and ensure food security in a changing
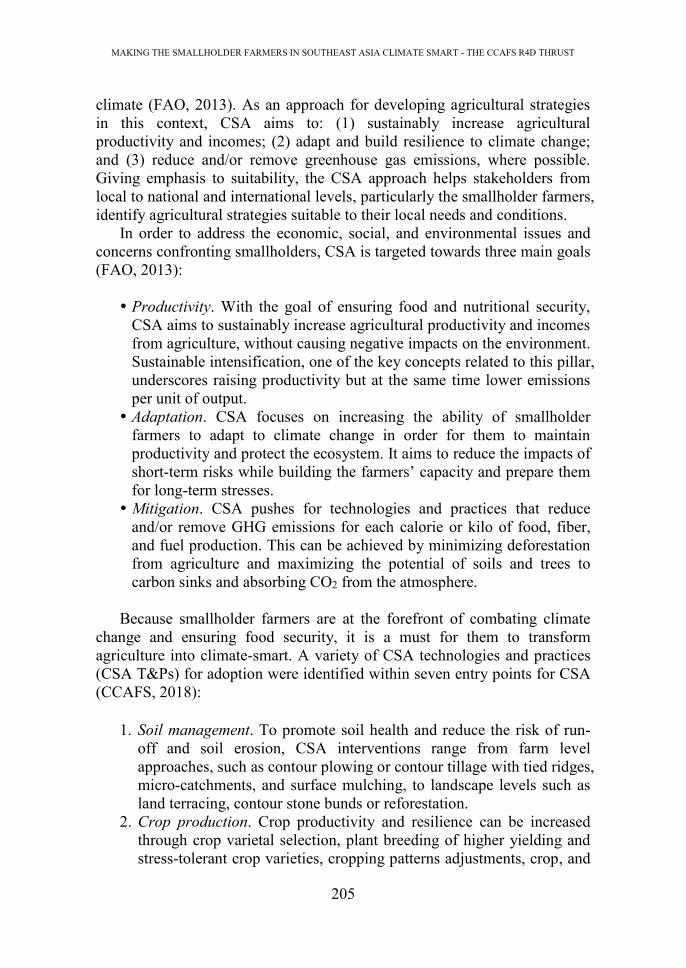
MAKING THE SMALLHOLDER FARMERS IN SOUTHEAST ASIA CLIMATE SMART - THE CCAFS R4D THRUST
205
climate (FAO, 2013). As an approach for developing agricultural strategies in this context, CSA aims to: (1) sustainably increase agricultural productivity and incomes; (2) adapt and build resilience to climate change; and (3) reduce and/or remove greenhouse gas emissions, where possible. Giving emphasis to suitability, the CSA approach helps stakeholders from local to national and international levels, particularly the smallholder farmers, identify agricultural strategies suitable to their local needs and conditions.
In order to address the economic, social, and environmental issues and concerns confronting smallholders, CSA is targeted towards three main goals (FAO, 2013):
Productivity. With the goal of ensuring food and nutritional security,
CSA aims to sustainably increase agricultural productivity and incomes from agriculture, without causing negative impacts on the environment. Sustainable intensification, one of the key concepts related to this pillar, underscores raising productivity but at the same time lower emissions per unit of output.
Adaptation. CSA focuses on increasing the ability of smallholder farmers to adapt to climate change in order for them to maintain productivity and protect the ecosystem. It aims to reduce the impacts of short-term risks while building the farmers’ capacity and prepare them for long-term stresses.
Mitigation. CSA pushes for technologies and practices that reduce and/or remove GHG emissions for each calorie or kilo of food, fiber, and fuel production. This can be achieved by minimizing deforestation from agriculture and maximizing the potential of soils and trees to carbon sinks and absorbing CO2 from the atmosphere.
Because smallholder farmers are at the forefront of combating climate
change and ensuring food security, it is a must for them to transform agriculture into climate-smart. A variety of CSA technologies and practices (CSA T&Ps) for adoption were identified within seven entry points for CSA (CCAFS, 2018):
1. Soil management. To promote soil health and reduce the risk of run-off and soil erosion, CSA interventions range from farm level approaches, such as contour plowing or contour tillage with tied ridges, micro-catchments, and surface mulching, to landscape levels such as land terracing, contour stone bunds or reforestation.
2. Crop production. Crop productivity and resilience can be increased through crop varietal selection, plant breeding of higher yielding and stress-tolerant crop varieties, cropping patterns adjustments, crop, and

MAKING THE SMALLHOLDER FARMERS IN SOUTHEAST ASIA CLIMATE SMART - THE CCAFS R4D THRUST
206
crop nutrient management, and other ecosystem management approaches.
3. Water management. Climate-smart water management practices like supplemental irrigation and rainfall capture aim to reduce or eliminate the risk of crop water stress and yield reduction. Other CSA technologies like alternate wetting and drying, not only save water but also reduce methane emissions.
4. Livestock management. CSA Technology and Practices (T&P) can help improve animal health and increase their heat tolerance. CSA can also reduce GHGs by focusing on feed management, enteric fermentation, and manure management.
5. Forestry and agroforestry. CSA promotes sustainable forest management through afforestation, reforestation, and agroforestry to increase tree cover and reduce deforestation and increase carbon sequestration.
6. Capture fisheries and aquaculture. CSA aims to enhance fisheries and aquaculture productivity and livelihood security by sustainably intensifying production, using better-integrated systems, improving stocks and reducing losses from disease, will increase productivity.
7. Energy management. CSA envisions agriculture systems to utilize alternative energy sources such as bioenergy, solar energy, and other renewables such as hydro, geothermal, and other sustainable means of usage of biomass.
Comparing with other agricultural and sustainable development concepts,
CSA possesses distinct characteristics which are leaning more towards smallholders (CCAFS, 2018):
1. Using a landscape approach to promote the maintenance of ecosystem,
CSA is more holistic and integrative in planning and management. CSA directly addresses and systematically includes climate change in the planning and development of sustainable agricultural systems. Being the most vulnerable group to the impacts of climate change, smallholders will benefit from this holistic and integrative approach.
2. CSA is context-specific. It looks into the unique interactions of biophysical and socioeconomic and political factors at a specific landscape. Using participatory approaches, it takes into account the unique set of needs and objectives identified by the stakeholders, including smallholder farmers.
3. The CSA concept is beyond the set of practices or technologies but can be an integration of multiple interventions at the food system, landscape, value chain, and/or policy level. This can help address the

MAKING THE SMALLHOLDER FARMERS IN SOUTHEAST ASIA CLIMATE SMART - THE CCAFS R4D THRUST
207
concerns of smallholder farmers through the development of technologies and practices up to the elaboration of climate change models and scenarios, information technologies, insurance schemes, value chains, and the strengthening of institutional and political enabling environments.
4. CSA prioritizes the most vulnerable sectors to climate change, such as the rural poor, women, indigenous peoples, and other marginalized groups. By involving all the stakeholders in decision making, networks of cooperation will be built and appropriate CSA interventions will be identified and successfully implemented.
With the goal of making smallholder farmers’ productive and resilient,
CSA offers a wide array of options of technologies and practices that can be applied at the farm and field levels. From improved seed varieties to ecological engineering and water-saving technologies, farmers can transform their farms into more sustainable and climate-resilient ones. However, collective action is needed to address the issues of climate change and food security. The widespread adoption of CSA is expected to result in higher agricultural productivity and substantial reduction of GHGs from agricultural activities. In order to achieve significant impacts, scaling up and out of CSA should be done by all the stakeholders at all levels, most importantly by the smallholders.
CCAFS CSA INITIATIVES IN SOUTHEAST ASIA
To give more emphasis to addressing climate change through the promotion of CSA, the CGIAR implemented its research program on Climate Change, Agriculture and Food Security (CCAFS). Led by the International Center for Tropical Agriculture (CIAT), CCAFS brings together the world’s best agricultural scientists and climate experts to study and address the interactions, synergies, and trade-offs between climate change, agriculture and food security. The program has been implemented in five regions of the world, such as East Africa, West Africa, Latin America, South Asia, and Southeast Asia.
CCAFS aims to generate evidence and support adoption of CSA policies, practices, and services that will help reduce poverty, increase gender equity, and support sustainable landscapes. Since its inception in Southeast Asia in 2013, CCAFS has envisioned the region to have a stable food supply, with consumers, particularly rural and urban poor having adequate access to food commodities. Giving more focus to smallholders, CCAFS has been working on the promotion of CSA T&Ps to farmers and communities to make them more productive and adapted to climate change. The program also aims to

MAKING THE SMALLHOLDER FARMERS IN SOUTHEAST ASIA CLIMATE SMART - THE CCAFS R4D THRUST
208
ensure that institutional, public, and private sector capacities to implement climate change measures are strong and the climate change adaptation and mitigation measures are integrated into regional and national development plans. Through these interventions, CCAFS hopes that these will lead to more resilient agriculture in the region, with a reduced GHG contribution.
The CCAFS in Southeast Asia (CCAFS SEA) program focuses on three countries namely, Cambodia, Lao PDR, and Vietnam because they are among the most vulnerable in the region causing them to have higher developmental intervention needs. Likewise, CCAFS SEA also implemented specific projects with partners in Indonesia, Myanmar, and the Philippines. These regional R4D activities contextualized the four CCAFS Flagships: FP1 – Priorities and Policies for CSA; FP2 – Climate-Smart Technologies and Practices; FP3 – Low Emissions Development; and FP4 – Climate Services and Safety Nets in the aforementioned countries. Moreover, as a regional priority, the Gender and Social Inclusion (GSI) dimensions are integrated into research, planning, and implementation of these interventions. For the past five years, these flagship programs have carried interventions that aimed at improving the various aspects of the lives of the smallholder farmers in the region. Priorities and Policies for CSA CCAFS SEA has been helping the countries in the region to establish their decision-support mechanism on agriculture, climate change, and food security policies. Using research-generated data, modeling output, and innovative scenario assessment through collaborative work and partnerships with the regional economic and development bodies, major regional organizations, and concerned national agencies, CCAFS SEA has supported institutions to review and develop policies that will provide an enabling environment for CSA. Here are some of CCAFS SEA’s initiatives to mainstream CSA in government policies:
• CCAFS SEA worked with the Ministry of Agriculture and Irrigation (MOAI) of Myanmar in developing Myanmar’s Climate-Smart Agriculture Strategy. The document provided a framework to transform the agricultural sector in the context of climate change impacts and socio-economic growth. The strategy envisions the development of technical, policy, and investment conditions to achieve food and nutrition security through climate-resilient and sustainable agriculture (Hom et al, 2015).
• Through IFPRI and the National Economic Development Authority (NEDA) in the Philippines, CCAFS helped establish a decision-

MAKING THE SMALLHOLDER FARMERS IN SOUTHEAST ASIA CLIMATE SMART - THE CCAFS R4D THRUST
209
support mechanism on agricultural, climate change and food security policies, that uses newly generated data, modelling output and innovative scenario assessment. The recommendations of the study have been utilized to inform various government agencies (e.g. DBM, Senate AgCom, NEDA) including the formulation of the strategies for the Philippine economic sectors, including agriculture, during the preparation of the Philippine Development Plan 2017-2022 (IFPRI, 2018).
• In Vietnam, CCAFS provided inputs to the country’s various commitments to international agreements related to climate change in agriculture (i.e. inputs in the preparation country submissions). In the preparation of Vietnam’s National Adaptation Plan in agriculture, CCAFS is providing inputs on potential CSA T&Ps (i.e., AWD) for implementation under the plan and is supporting consultation workshops with relevant government agencies to review the draft plans.
• CCAFS implemented the Policy Information and Response Platform on Climate Change and Rice in ASEAN and its Member Countries (PIRCCA) project which aimed to bridge the gap between science and policy and to establish informal and operational linkages with stakeholders, most especially farmers. The project implemented studies in Myanmar and Vietnam aimed at understanding gender differences on households’ perception of climate change, farm-level, and household adaptation strategies, how households build resilience and to what extent climate change related policies can support them. The project also supported the integration of the rice restructuring strategy developed by MARD and IRRI into the rice master plan of Vietnam.
• CCAFS has developed socio-economic and climate scenarios at regional levels as a tool for strategic policy planning and investment decisions. In Cambodia, scenario-guided planning was used in the development of the country’s Climate Change Priorities Action Plan that aims at strengthening smallholder farmers' agricultural resilience.
Climate-smart technologies and practices
Under this flagship, various initiatives have been done to engage stakeholders in identifying and addressing the technological priorities and related concerns of farmers, particularly the smallholders. CCAFS SEA has implemented research for development (R4D) interventions, using participatory action research, to build the capacity of local communities and

MAKING THE SMALLHOLDER FARMERS IN SOUTHEAST ASIA CLIMATE SMART - THE CCAFS R4D THRUST
210
local governments in upscaling CSA through the Climate-Smart Village (CSV) approach.
CCAFS came up with the CSV concept to generate evidence on the effectiveness of CSA. Being implemented in Asia, Africa, and Latin America, the CSV approach aims “to generate evidence at local scales of what CSA options work best, where, why, and how, and use this evidence to draw out lessons for policymakers, agricultural development practitioners, and investors from local to global levels” (Aggarwal et al, 2018). As venues for site-specific research, CSV sites under CCAFS represent different agro-ecologies with specific climate risks and socio-political elements. The different situations among these CSVs provide comparison and diversity of context that will be very useful in developing solutions to anticipated future impacts of climate change. Specifically, the CSV approach aims to: evaluate CSA options for productivity, adaptation, and mitigation; develop solutions for future climate change impacts; learn the factors affecting adoption; and identify effective socially-inclusive and integrative financial and policy tools (Aggarwal et al, 2018). Major components of a typical CSV approach are practices, technologies, climate information services, insurance, institutions, policies, and finance (Aggarwal et al, 2018).
Introduced by CCAFS in 2015, CSVs were established in the region to serve as models of climate-resilient communities and field laboratories of CSA T&Ps. CCAFS SEA established seven CSVs in the region, including Ma, My Loi, and Tra Hat in Vietnam; Phailom and Ekxang in Laos; Rohal Suong in Cambodia; and Guinayangan in the Philippines. Through the leadership of the various centers such as CIAT, the World Agroforestry Centre (ICRAF), the International Rice Research Institute (IRRI), and the International Insititute for Rural Reconstruction (IIRR), the CSVs have served as a multisectoral platform for testing the technological and institutional options for climate change adaptation and mitigation in agriculture. The CSVs in Southeast Asia has served the convergence points of different interventions that are implemented by CCAFS-funded projects, other CGIAR projects, and other development projects that operate in the villages.
In the span of three years, CCAFS SEA, through the CSV implementation, has produced significant outputs and outcomes (Bonilla-Findji and Bui 2017):
1. Ma CSV. CSA T&Ps were introduced in Ma CSV, such as the improved cookstove for generating bioenergy and biochar, techniques for crop residue and animal manure management, System of Rice Intensification, and intercropping on sloping lands. CCAFS SEA, together with its partners, also implemented participatory land-use

MAKING THE SMALLHOLDER FARMERS IN SOUTHEAST ASIA CLIMATE SMART - THE CCAFS R4D THRUST
211
planning (PLUP) with the involvement of villagers and stakeholders. Capacity-building and engagement activities were also done, such as engaging innovative farmers and local governments in roving workshops; and organizing the Photovoice to capture climate change issues from farmers’ point of view. Ma CSV serves as the learning site for CSA in Yen Bai province and nearby communities.
2. My Loi CSV. Through participatory CSA testing and evaluation, My Loi CSV successfully developed scalable CSA T&Ps, such as orange-based agroforestry systems, black pepper home gardens, acacia-based agroforestry systems, and vermiculture. Several CSA T&Ps tested in My Loi CSV were selected for scaling and incorporated in the commune development plan, New Rural Development plan, and district farmer union and DARD programs. In terms of climate information services, farmers in My Loi CSV were able to: build a simple meteorological station that generates more accurate weather forecasts; and produce forecasts and agro-advisories using participatory scenario planning. In the village, CCAFS also studied the implementation of the Community Innovation Fund (CIF) ─ a loan allowing farmer interest groups to implement CSA initiatives in their communities (Le et al, 2018). Participatory communication and social engagement activities were also conducted, such as Photovoice, engaging youth in art and climate change activities, technology exhibits, and trade fairs.
3. Tra Hat CSV. Pest Smart interventions such as ecological engineering (EE), extension services through Plant Clinic, and education and awareness raising activities were implemented in Tra Hat CSV (Sivapragasm et al, 2017). Rice cultivars grown have been assessed in the village to identify ‘entry points’ for disseminating improved varieties to specific locations and seasons. Other CSA T&Ps were also introduced to the farmers like using rice straw for mushroom production and gasifier stoves.
4. Rohal Suong CSV. Benefiting more than 100 households, CSA T&Ps were implemented in Rohal Suong CSV, such as climate-stress tolerant rice varieties, community-managed water storage ponds, and pest smart agriculture. These CSA T&Ps were also selected as priorities for scaling out in several neighboring communities. In Cambodia, Rohal Suong CSV has been selected as a demonstration site of the International Fund for Agricultural Development -funded ASPIRE project.
5. Phailom. To address the water scarcity during the dry season, a model to design cost-effective roof-top rainwater harvesting system was developed in the CSV. This simple decision support tool that can be

MAKING THE SMALLHOLDER FARMERS IN SOUTHEAST ASIA CLIMATE SMART - THE CCAFS R4D THRUST
212
adapted to the various conditions of Southeast Asia has been promoted, and its guidelines have been distributed to farmers in Lao CSVs. The promotion of the effective use of community ponds for aquaculture and irrigation was also done. Furthermore, community-based seed system was implemented through seed fairs, farmer field schools, and information campaigns. Photovoice was also conducted in Phailom CSV to increase and deepen the farmers’ understanding of local climate change issues, the concept of CSA, and the viable options.
6. Ekxang CSV. Pest Smart initiative in Ekxang CSV has boosted the confidence of farmers, especially women, and increased their capacity to mitigate upcoming pest outbreaks. A complementary training program was also conducted to increase the capability of extension workers to manage plant clinics effectively and engage a large group of farmers. The CSV has also the venue for demonstrating and disseminating new climate-resilient rice varieties and promoting groundwater use for irrigation.
7. Guinayangan. Unlike the other CSVs, Guinayangan is not a village but a municipality located in the Philippines. It is composed of 54 barangays in coastal and mountainous areas and it is known for rice and coconut production. Various CSA T&Ps have been successfully implemented in Guinayangan, such as drought-resilient crop varieties, short-cycle tilapia-raising, community-based seed production, and impoundment systems to improve water supply (IIRR 2017). Guinayangan was also successful in promoting watershed management, community savings for sustaining environmental services, coastal bio-shield (planting mangroves as a natural barrier for tsunamis and storm surges), and scaling out of alternative pig feed production. The Guinayangan model is a good example of how an operative multi-stakeholder approach, which involves the local government units, national government agencies, non-governmental organizations, and smallholder farmers, will work. The knowledge-generated in Guinayangan is being used in the implementation of the Philippine government’s Adaptation and Mitigation Initiative in Agriculture project to effectively scale out CSA to the whole country and develop sub- and national CSA frameworks.
As a venue for knowledge-sharing on CSV implementation, CCAFS has
conducted the CSV roving workshop. Using experiential and on-site learning approaches, the workshop specifically aims to: enhance the participants’ knowledge of CSA T&Ps; facilitate sharing of knowledge and experiences on CSA T&Ps among farmers and CSV support teams, and demonstrate community-based CSA approaches that are successful. Farmers from the
MAKING THE SMALLHOLDER FARMERS IN SOUTHEAST ASIA CLIMATE SMART - THE CCAFS R4D THRUST
213
seven Southeast Asian CSVs first attended the roving workshop in the municipality of Guinayangan, Philippines last September 2015. The succeeding workshops were held in Vietnam and Cambodia, in May 2016 and August 2017, respectively.
Recently, together with the IIRR and International Development Research Center(IDRC), four new CSVs were established in the different agro-ecological zones of Myanmar, namely: Ma Sein village in Bogale (delta), Htee Pu village in Nyaung-Oo (dry zone), Kyaung Taung village in Nyaung Shwe (uplands), and Sakthal village in Hakha (hilly) (Barbon et al, 2017). Through these new CSVs, the scaling out of CSA T&Ps will be done using community-based adaptation strategies. A potential solution to food security and nutrition challenges in the country, the CSVs will serve as learning platforms for scaling-out CSA at the township level.
Low emissions development
A study conducted by CCAFS found that out that smallholder farmers are responsible for approximately 5% of global GHG emissions, including 32% from the agriculture sector and 29% from the agriculture-driven land-use change (Vermeulen and Wollenberg 2017). With this CCAFS R4D agenda on low emissions development (LED) also focuses on options for smallholders to reduce GHG emissions and increase carbon sequestration in their respective agricultural systems. Adoption of low-emissions agriculture provides an opportunity for more efficient use of agricultural inputs, which in turn, may provide immediate economic benefits for smallholders (Vermeulen and Wollenberg 2017).
CCAFS SEA has supported national efforts to reduce GHG emissions in the various agricultural systems by supporting the development of approaches and strategies for scaling mitigation technologies and quantification procedure/protocol guidelines. Some of the project highlights are:
1. The AWD technology, developed by IRRI and its partners, addresses
the twin problems of adaptation and mitigation through efficient water management (Richards and Sander 2014). This water-saving approach enables farmers to save up on irrigation water by up to 30% and reduces methane emissions by 30-70% without a yield penalty. Through the Mitigation Options to Reduce Methane Emission in Paddy Rice project, CCAFS promoted the outscaling of the AWD technology in Vietnam, through the support of national plans with suitability maps.

MAKING THE SMALLHOLDER FARMERS IN SOUTHEAST ASIA CLIMATE SMART - THE CCAFS R4D THRUST
214
2. CCAFS also funded various researches to inform Vietnam’s LED plans, such as: the analysis of the costs, incentives and economic returns of the two low emission options (AWD and Mid-season Drainage) for rice; the climatic suitability mapping in MRD to promote AWD+ outscaling; the GHG emission measurements in rice fields in Central Vietnam under continuous flooding and AWD treatments; and the estimation of GHG emission in ruminants in three sub-agro-ecological zones of Ba Vi Province.
3. In Indonesia, CCAFS investigated the global warming potential of current farming practices of dairy farms in Lembang district, West-Java. The research found out that an average dairy farm in Lembang emits 33 ton CO2e per year, which is equal to 1.9 kg CO2e per kg fat and protein corrected milk (FPCM), a unit of measurement that allows comparison of the carbon footprint of dairy products (De Vries et al, 2017). Using scenario analysis, CCAFS identified several improved feeding and manure management practices (i.e., maize silage feeding, improved manure management through reducing the amount of discharged manure and adding roughage in the diet) that have potential to reduce emissions from dairy farms in Lembang.
4. Through organizing consultation workshops, the program has also supported the development of a regional support system (e.g., clearing house) for a more effective Nationally Appropriate Mitigation Action (NAMA) implementation of among the Southeast Asian countries.
5. In the preparation of Vietnam’s INDC before COP 21 in Paris, studies such as those conducted by IFPRI and IRRI on the effectiveness of various agricultural mitigation options were important in helping determine the emission reduction targets in agriculture. Simulation models and scenario outputs were shared to determine AgINDC emission reduction targets. MARD also requested CCAFS to support the national consultation prior to the submission of the agriculture INDC in 2015 After Vietnam submitted its INDC, MARD sought to review INDC for the crop, livestock, forestry, and aquaculture options, and develop an implementation plan. A study also found out the very low awareness of the stakeholders, including farmers, on climate change mitigation measures and NDC. CCAFS recommended the government to conduct information campaigns on GHG emission reduction stated in the NDC plan among farmers, government officials, and other stakeholders (Trung et al., 2017).
6. CCAFS also provided inputs in Vietnam’s membership in the Climate and Clean Air Coalition (CCAC) in 2017.

MAKING THE SMALLHOLDER FARMERS IN SOUTHEAST ASIA CLIMATE SMART - THE CCAFS R4D THRUST
215
Climate services and safety nets
In Southeast Asia, particularly in countries like Vietnam, Cambodia, and Lao PDR, relevant government agencies provide seasonal forecasts, agro-advisories, and other climate services that to some extent can be utilized during crop seasons. National and community-based mass media such as television, radio, and village loudspeakers serve as platforms where these services are delivered to the people. However, not everyone, most especially the resource-deficient smallholders, can easily access these platforms, let alone climate services (Simelton et al, 2018). Moreover, there are discrepancies between accessible and preferred platforms, which implies that climate services are being delivered in formats that do not necessarily fit the needs or preferences of the target end-users, particularly smallholder farmers.
To address this gap, CCAFS has implemented research activities on climate services and safety nets to understand and act on agro-meteorological information needs of various stakeholders and their support network. By developing innovative ways by harnessing modern and traditional information and communication technologies, CCAFS aims to provide early warning systems for various climate-related risks and to establish effective on-farm delivery systems for climate information and products. Together with local and international partners, CCAFS SEA has conducted the development of effective climate information and advisory services for farmers and climate-informed safety net interventions.
In many countries, men farmers can access agro-climatic information more easily, which constrains women’s participation in decision making at various levels. To enable women farmers, ethnic minority farmers, and agricultural planners to better anticipate and respond to risks and opportunities from changes in weather patterns, CCAFS SEA implemented the Agro-Climate Information Services for women and ethnic minority farmers in Southeast Asia (ACIS) project. Led by ICRAF and CARE International, the project provides practical agro-climatic information and guidance, with particular attention given to the unique gendered aspects of disseminating this information, in Vietnam, Lao PDR, and Cambodia from 2015 to 2018. For the past three years, ACIS has helped the smallholder farmers through the: development and distribution of participatory agroadvisories in 89 villages in the three priority countries; improvement of community weather stations; downscaling of seasonal forecasts; and capacity development, particularly for the women and youth.
Another climate-risk information system successfully developed by CCAFS SEA, the Climate-Smart Maps and Adaptation Plans (CS-MAP) was adopted in the 13 provinces of MRD to promote sustainable rice production (Son et al, 2018). CS-MAP, a highly participatory approach, engages experts

MAKING THE SMALLHOLDER FARMERS IN SOUTHEAST ASIA CLIMATE SMART - THE CCAFS R4D THRUST
216
from the national and local levels to identify climate-related risks; determine potential affected areas and their risk levels using technical, infrastructure and topographic data, and local knowledge; assess and improve proposed adaptive measures; and develop integrated adaptation plans for rice production from regional to provincial levels. Using the CS-MAP methodology, risk maps for flooding, drought and salinity intrusion and corresponding monthly adaptive cropping schedule, both for normal and severe years were developed for the whole MRD. Through a resolution, MARD adopted the CS-MAP for rice production management in the region, with six provinces already operationalizing the methodology.
In rural areas, radio is still an effective channel to disseminate information. In 2015, CCAFS together with the Philippine Federation of Rural Broadcasters (PFRB) implemented a radio campaign called “Climate Change i-Broadkas Mo” (Cruz et al, 2016). The campaign mobilizes rural communities to advocate principles and the practice of CSA. A set of 156 interviews and 165 scripts in local languages were prepared and distributed to 153 rural broadcasters. These were aired in at least 78 radio stations nationwide, reaching about 2 million listeners, mostly smallholder farmers. An offshoot of the radio campaign, a school-on-the-air (SOA) project on climate-smart agriculture (CSA) was conceptualized and implemented in Cagayan Valley, Philippines from February to March 2018. Spearheaded by the Philippine Department of Agriculture (DA)—through its Regional Field Office 2 (DA-RFO2)—together with PFRB, the Philippine Agriculture Journalists, Philippine Rice Research Institute, CCAFS SEA and 12 partner agencies, 60 modules on CSA T&Ps were shared with more than 10,000 initial farmer-learners in the major rice producing provinces in the region. This approach will be outscaled in other regions in partnership with the Agricultural Training Institute (ATI) and State Universities and Colleges (SUCs).
Gender and social inclusion
Women and children are the most vulnerable groups to the impacts of climate change. This makes gender and social analysis a very critical aspect in understanding the various socioeconomic factors affecting agriculture and climate change. Thus, gender equality and social inclusion (including the youth) cut across all the R4D activities of CCAFS – from CSA to climate risk management, LED, and policies and institutions. Through participatory methodologies, CCAFS SEA has engaged women and the youth in various research activities and community interventions. With the goal of harnessing their capabilities and increasing their participation in decision-making,

MAKING THE SMALLHOLDER FARMERS IN SOUTHEAST ASIA CLIMATE SMART - THE CCAFS R4D THRUST
217
CCAFS SEA has successfully implemented various projects across the region.
Previously discussed under the flagship programs, it is evident that gender issues and other related social concerns are being addressed by CCAFS. At the policy level, CCAFS’s recommendations focus on addressing gender disparities and social differentiation to ensure gender equality, improved welfare, and adaptive capacity to climate change. Aside from increasing women and the youth’s participation in CSA research, efforts have been done to study the gender dimension and social implications of various CSA interventions. Moreover, in improving climate information services in the region, CCAFS SEA has put women and other marginalized groups in the forefront, like what has been done in the ACIS project.
Studies were also done by CCAFS to ensure that rural women benefit from its contribution to poverty reduction, enhanced environmental resilience, and improved food security, human health and nutrition. CCAFS SEA’s R4D activities on gender resulted to: improved knowledge on perception of climate change risks, effects on and changing gender roles, and labour distribution by gender in rice production; understanding barriers and constraints faced by men and women in CSA adoption; and identification of enabling factors that could enhance adoption and scaling out of CSA by men and women.
With a 50-60 year average age of farmers across the region, there is an urgent imperative to engage the youth in agriculture. Rising up to this challenge, the Philippine Rice Research Institute, together with CCAFS SEA, pursued an Infomediary Campaign to cultivate the interest of young people in rice farming (Manalo et al, 2015). In the campaign, high school students were tapped to serve as information providers on climate-smart agriculture for rice (CSA4Rice) to farming communities. Aside from the basics of rice farming and climate change, they were taught how to access platforms to get agricultural information, which they could pass on to the larger farming communities. From 2012-2016, the campaign involved over 200 high schools nationwide, of which 81 are vocational high schools.
OUTLOOK FOR SOUTHEAST ASIA
With the goal of ensuring food security amidst climate change in the region, CCAFS SEA is working with its partners, not only to improve the well-being of smallholder farmers but also to integrate climate change adaptation and mitigation in regional and national development plans. To pursue CCAFS’ vision for Southeast Asian agriculture, more strategic R4D activities are being carried out to address the following opportunities and challenges in the region:

MAKING THE SMALLHOLDER FARMERS IN SOUTHEAST ASIA CLIMATE SMART - THE CCAFS R4D THRUST
218
1. Coping with climate change. To cope with extreme weather events and changing climatic conditions, CCAFS will focus on scaling up and out CSA technologies and practices in its priority countries that will help cope with drought, flooding, salinity intrusion, rainfall variability, heat stress, and cold spells. Better access to climate information services such as early warning, seasonal forecast, and risk mapping will also be intensified to help farmers make informed decisions, manage risks, take advantage of favorable climate conditions, and adapt to climate change. Moreover, development of climate index-based crop insurance will be further evaluated as a major risk mitigation strategy, especially for smallholder farmers in the region. It is noted that crop insurance for small holders in the region is highly subsidized or non-existent because of the high risk to extreme events of many of the countries.
2. Sustaining national and regional food and nutrition security. The current goal of CCAFS is to catalyze positive change towards CSA, and resilient, low emission food systems and landscapes, with emphasis on improving food and nutrition security. To ensure that the Southeast Asians, most especially the smallholders and their families, will be food- and nutrition-secure, agriculture must withstand the effects of climate change and adequately produce nutritious food for human health.
3. Enhancing competitiveness in agriculture. With an increasing role of Southeast Asia in the global agro-food trade, there is a need to elevate the quality of its products to meet international standards through more efficient and productive technologies and practices. Smallholder farmers should be equipped with proper skills and resources to increase not only their productivity but also their competitiveness. Towards this, bigger investments in agriculture R4D are needed to foster sustainable and more competitive agriculture in the region.
4. Towards a regional integration. As part of the establishment of the ASEAN Economic Community in 2015, the integration of agriculture initiatives across the region will be very crucial in addressing the impacts of climate change. There is a need for stronger regional collaboration and coordination in planning and implementing mitigation and adaptation activities. Along with this, the smallholders and the role they play should be a major consideration in harmonizing agro-economic policies, production systems, and value chains.

MAKING THE SMALLHOLDER FARMERS IN SOUTHEAST ASIA CLIMATE SMART - THE CCAFS R4D THRUST
219
In addressing the foregoing challenges and opportunities, CCAFS SEA will implement an integrated R4D approach targeting the region’s food baskets (e.g., Mekong River Delta and Basin, Ayeyarwady River Delta and Central Dry Zone of Myanmar, Chao Phraya River Basin in Thailand, Red River Delta and Central Highlands in Vietnam, and the big river basins in Indonesia and Philippines). Aside from their strategic importance in the region’s economy and food and nutrition security, these areas are also highly vulnerable to the adverse effects of climate change (Fig. 1). To have a more integrated set of activities and interventions, CCAFS will converge the activities of its four R4D flagships in the CSVs.
Fig. 1. CCAFS program framework for Southeast Asia.
An illustrative case could be pursued at the Mekong River Basin
addressing major impacts of climate change in the area. The FP4 (Climate Services and Safety Nets) project will provide climate services to FP2 (Climate- Smart Technologies and Practices) or FP3 (Low Emissions Development), project interventions ensuring their effectiveness, and FP1 (Priorities and Policies for CSA) will look at the broader impact of the interventions on food systems and determine policy requirement to support upscaling of FP2, FP3, and FP4 interventions.
By refocusing its R4D framework and revisiting its research approaches, CCAFS SEA has identified its new set of targets and priorities starting in 2019:

MAKING THE SMALLHOLDER FARMERS IN SOUTHEAST ASIA CLIMATE SMART - THE CCAFS R4D THRUST
220
1. Priorities and Policies for CSA. Supporting policy formulation, CCAFS SEA will evaluate the impact of climate change and the effect of various CSA interventions in the broader context of food systems at different levels in the region. The research will be done on the effect of various CSA interventions in the food system in relation to the synergies and trade-offs in health, environment, and economic outcomes. CCAFS SEA aims to continue providing policy recommendations at the ASEAN and national levels and in supporting the countries in the implementation of their NAP and NDC.
2. Climate-Smart Technologies and Practices. Under this flagship, the goal is to improve the adaptation and resilience of smallholders for Southeast Asia in the large rainfed and flood/drought-prone areas which are also the most vulnerable to the impacts of ENSO. CCAFS SEA will tests, evaluate, and most importantly, link emerging evidence to influence investment and scaling out. Priority will be given to testing and evaluation of transformative technologies and business models that will include components on drought and flooding risk mapping, innovative technologies, and arrangements for water management, including solar irrigation, stress tolerant crop seed systems, crop diversification, agroforestry, and climate advisory services. Targeting women and minorities, CCAFS will introduce gender-sensitive CSA options and business models that will sustain and upscale the interventions. With the presence of CSVs in these areas, the preferred geographic targets for these interventions are the Mekong basin (Cambodia and Laos), Central Coast of Vietnam, and/or the Central Dry Zone in Myanmar.
3. Low Emissions Development. The goal of the project is to reduce GHG emission in major rice production areas in the region, particularly the big river deltas such as Mekong River Delta (Vietnam), Chao Phraya River Basin, and Ayeyarwady River Delta (Myanmar), CCAFS SEA will develop the evidence base and tools that will allow rapid mainstreaming and upscaling of LED technologies that will help the target countries attain their GHG emission reduction targets. Also, CCAFS will continue to develop feasible low-emission strategies for Indonesian smallholder dairy farmers that will: sustainably increase farm productivity of smallholder dairy farmers, while reducing greenhouse gas emissions; improve resource use efficiency, and increase farmer income.
4. Climate Services and Safety Nets. Supporting the operationalization of climate information services across vulnerable areas in Southeast Asia, the program’s priority areas of research include adaptability of the Enhancing National Climate Services (ENACTS) approach to SEA,
MAKING THE SMALLHOLDER FARMERS IN SOUTHEAST ASIA CLIMATE SMART - THE CCAFS R4D THRUST
221
enhancements to seasonal drought prediction, delta region hydrology/salinity risk mapping, and early warning. CCAFS will also move towards integrating climate information services in all of its flagship projects and activities. Aside from improving the accessibility of decision-makers and farmers to climate information services, developing climate index-based crop insurance as a major risk mitigation strategy for smallholder farmers will be another CCAFS SEA’s priority.
SUMMARY Despite their huge number, smallholder farmers still belong to the marginalized sectors in Southeast Asia. With limited access to technology, resources, and information, smallholders have become highly vulnerable to climate change and its impacts. To address production challenges and achieve adaptation and mitigation, CSA is an approach that smallholder farmers can adopt for more sustainable agriculture. CGIAR, through CCAFS, has done various R4D on climate change to help uplift the capacities of smallholders to cope with climate change. CCAFS has successfully promoted CSA through its various interventions through its flagship programs on priorities and policies for CSA, climate-smart technologies and practices, LED, and climate services and safety nets, and gender and social inclusion. As the challenges posed by climate change intensify, CCAFS will continue to support Southeast Asia in helping its smallholder farmers cope with climate change; sustaining national and regional food and nutrition security; enhancing its competitiveness in agriculture, and strengthening the regional integration.
From this experience of promoting CSA, CCAFS SEA is recommending strategic actions to make smallholders in Southeast Asia more climate-smart:
1. From CSVs to Deltas/Basins - The need for a holistic or integrated
approach. Integrated management of landscapes is important to support food production, maintain ecosystem services, and improve the livelihood of smallholder farmers. Through a more holistic approach, the interlinking relationships of the biological elements (e.g., water resources, agriculture, and biodiversity) and other related factors (e.g., political, socio-economic, and cultural) in the landscape are understood and taken into consideration. Using integrated planning and management strategies, factors like the varying stakeholders’ interests, synergies, and trade-offs among different land use can be identified and harmonized. Through this, the concerns of the smallholders will not be neglected from the planning up to the

MAKING THE SMALLHOLDER FARMERS IN SOUTHEAST ASIA CLIMATE SMART - THE CCAFS R4D THRUST
222
implementation of any CSA intervention. Moreover, to effectively scale CSA, it is important to study and invest in all the enabling factors, such as policies and institutional arrangements, stakeholder involvement and gender considerations, infrastructure, insurance schemes, and weather information and advisory services.
2. Practical and innovative - Developing location-, time-, and risk-specific options. To have a more targeted response system to climate-related risks, the establishment of a comprehensive early warning system is a prerequisite. Using geographical information system and information and communication technology, the system could identify the spatial distribution and levels of potential impacts. Through risk maps, information related to climatic pattern, topography, hydrology, cropping system, crop calendar, infrastructure (e.g., roads, dykes, canals, sluices), vulnerability (e.g., including poverty and ethnic groups), risks (flood, drought, saline intrusion) and recommended actions (e.g., crop calendar adjustment, planting tolerant varieties) should be consolidated. Furthermore, a strategic communication platform should also be in place to provide timely alerts and advisories to well defined affected areas. This location-, time-, and risk-specific system will allow more effective preparation of contingency actions. The development and implementation of this mechanism should be with the involvement of all the disciplines and stakeholders from various sectors, particularly the smallholders (i.e. CS-MAP implemented in Vietnam).
3. Mainstreaming CSA in programs and/investment plans. To effectively scale CSA, most especially among smallholder farmers, the creation and implementation of appropriate policies integrating CSA into national programs and investments are necessary. It should not be treated as a standalone program or investment plan. CSA should be integrated into the national and regional strategies and plans including the NAPs, NDCs, and NAMAs, and in the agriculture and food security plans included in national development and poverty reduction strategies. This can be done through: capacity building of policymakers, institutions and relevant stakeholders; developing and promoting decision support tools; providing evidence for CSA scaling; and strengthening partnerships and implementing collaborative activities with relevant government and private institutions.

MAKING THE SMALLHOLDER FARMERS IN SOUTHEAST ASIA CLIMATE SMART - THE CCAFS R4D THRUST
223
ACKNOWLEDGMENT
This work was implemented as part of the CGIAR Research Program on Climate Change, Agriculture and Food Security (CCAFS), which is carried out with support from the CGIAR Trust Fund and through bilateral funding agreements. For details please visit https://ccafs.cgiar.org/donors. The views expressed in this document cannot be taken to reflect the official opinions of these organizations.
REFERENCES Aggarwal et al. 2018. The climate-smart village approach: framework of an
integrative strategy for scaling up adaptation options in agriculture. Ecology and Society 23(1), 14.
Barbon W.J., R. Vidallo, and J. Gonsalves. 2017. The Promotion of Climate-Smart Villages to Support Community-Based Adaptation Programming in Myanmar. CCAFS Working Paper no. 213. Wageningen, The Netherlands: CGIAR Research Program on Climate Change, Agriculture and Food Security (CCAFS).
Bonilla-Findji O. and Y. Bui Tan. 2017. Southeast Asia Climate-Smart Villages AR4D sites: 2016 Inventory. Wageningen, The Netherlands: CGIAR Research Program on Climate Change, Agriculture and Food Security (CCAFS).
CCAFS. 2018. What is climate-smart agriculture? Retrieved May 2018, from CSA Guide: https://csa.guide/csa/what-is-climate-smart-agriculture.
CCAFS. 2016. Severe drought and salinity intrusion in Vietnam assessed by research centers. Retrieved September 2018, from https://ccafs.cgiar.org/research-highlight/severe-drought-and-salinity-intrusion-vietnam-assessed-research-centers#.W5NM9M4zbIW.
Cruz A.C., L. Tabing, and R. Navarro. 2016. Climate change reporting for rural broadcasters: Mobilizing the Philippine media for climate change awareness. CCAFS Working Paper No. 177. Copenhagen, Denmark: CGIAR Research Program on Climate Change, Agriculture and Food Security (CCAFS).
De Vries M., A.P. Wouters, and T.V. Vellinga. 2017. Environmental impacts of dairy farming in Lembang, West Java; Estimation of greenhouse gas emissions and effects of mitigation strategies. CCAFS Working Paper no. 221. Wageningen, the Netherlands: CGIAR Research Program on Climate Change, Agriculture and Food Security (CCAFS).
FAO. 2008. The State of World Fisheries and Aquaculture 2008. FAO Fisheries and Aquaculture Department, Food and Agriculture Organization of the United Nations, Rome, Italy.

MAKING THE SMALLHOLDER FARMERS IN SOUTHEAST ASIA CLIMATE SMART - THE CCAFS R4D THRUST
224
FAO. 2013. Climate-Smart Agriculture Sourcebook. Rome: Food and Agriculture Organization of the United Nations.
FAO. 2015. The economic lives of smallholder farmers: An analysis based on household data from nine countries. Rome, Italy: Food and Agriculture Organization of the United Nations.
FAO. 2017. El Nino and La Nina in the Philippines. Bangkok, Thailand: Regional Office for Asia and the Pacific Food and Agriculture Organization of the United Nations.
FAO. 2018. 2017: The impact of disasters and crises on agriculture and food security. Rome, Italy: Food and Agriculture Organization of the United Nations.
IFAD. 2013. Smallholders, food security, and the environment. Rome, Italy: International Fund for Agricultural Development.
IIRR. 2017. Towards a Portfolio of Climate Resilient Technological Options: Community level participatory adaptive research. Philippines: Philippine Country Program Regional Center for Asia International Institute of Rural Reconstruction.
Hom, N.H., N.M. Htwe, Y. Hein, S.M. Than, M. Kywe, and T. Htut. 2015. Myanmar Climate-Smart Agriculture Strategy. Ministry of Agriculture and Irrigation (MOAI). Naypyitaw, Myanmar: CGIAR Research Program on Climate Change, Agriculture and Food Security (CCAFS), International Rice Research Institute (IRRI).
IFPRI, 2018. Addressing the impacts of climate change in the Philippine agriculture sector (PACC). Retrieved September 2018, from http://www.ifpri.org/project/addressing-impacts-climate-change-philippine-agriculture-sector-pacc.
ILO. 2014. Wanted: Younger Generation of Farmers to Feed Asia. Bangkok, Thailand: ILO Regional Office for Asia and the Pacific. Retrieved September 2018, from http://apyouthnet.ilo.org/news/wanted-younger-generation-of-farmers-to-feed-asia.
IPCC. 2001. Climate Change 2001: Impacts, Adaptation, and Vulnerability. Contribution of Working Group II to the Third Assessment Report of the Intergovernmental Panel on Climate Change, McCarthy JJ, Canziani OF, Leary NA, Dokken DJ, and White KS (eds), Cambridge University Press, Cambridge, United Kingdom.
IPCC. 2007. Asia, In Climate Change 2007: Impacts, Adaptation and Vulnerability. Contribution of Working Group II to the Fourth Assessment Report of the Intergovernmental Panel on Climate Change. Cambridge University Press, Cambridge, United Kingdom, 469-506.
Lasco R.D., C.M.D. Habito, R.J.P. Delfino, F.B. Pulhin, and R.N. Concepcion. 2011. Climate Change Adaptation for Smallholder Farmers in Southeast Asia. World Agroforestry Centre, Philippines. 65p.

MAKING THE SMALLHOLDER FARMERS IN SOUTHEAST ASIA CLIMATE SMART - THE CCAFS R4D THRUST
225
Le T.T., E. Simelton, and H.V. Le. 2018. Community Innovation Fund from implementation to scaling out of climate-smart agriculture practices. Wageningen, The Netherlands: CGIAR Research Program on Climate Change, Agriculture and Food Security (CCAFS).
Manalo J.A. IV, J.C. Berto, K.P. Balmeo, F.M. Saludez, J.D. Villaflor, and A.M. Pagdanganan. 2015. Mobilizing Science for Climate Change, Agriculture and Food Security: Engaging the Southeast Asian Media. CCAFS Working Paper No. 158. Muñoz, Nueva Ecija, Laguna, Philippines: CGIAR Research Program on Climate Change, Agriculture and Food Security (CCAFS).
Nwanze K.F. and S. Fan. 2016. Climate change and agriculture: Strengthening the role of smallholders. In 2016 Global Food Policy Report. Chapter 2. Pp. 12-21. Washington, D.C.: International Food Policy Research Institute (IFPRI).
OECD. 2017. Building Food Security and Managing Risk in Southeast Asia. Paris, France: Organisation for Economic Co-operation and Development.
OECD-FAO. 2017. Agricultural Outlook 2017-2026 (Southeast Asia: Prospects and challenges). Paris, France: Organisation for Economic Co-operation and Development.
Richards M. and B.O. Sander. 2014. Alternate wetting and drying in irrigated rice. Climate-Smart Agriculture Practice Brief. Copenhagen, Denmark: CGIAR Research Program on Climate Change, Agriculture and Food Security (CCAFS).
Rigg J., A. Salamanca, and E.C. Thompson. 2015. The puzzle of East and Southeast Asia's persistent smallholder. Journal of Rural Studies 43 (2016) 118e133. Amsterdam, The Netherlands: Elsevier.
Simelton E, et al. 2018. Actionability of Climate Services in Southeast Asia: Findings from ACIS baseline surveys in Vietnam, Lao PDR and Cambodia. CCAFS Info Note. Wageningen, Netherlands: CGIAR Research Program on Climate Change, Agriculture and Food Security (CCAFS).
Sivapragasam A, H.V. Chien, S.L. Khing, and L.M. Duong. 2017. Pest Smart interventions and their influence on farmer pest management practices in Tra Hat village, Bac Lieu Province, Vietnam. CCAFS Working Paper no. 212. Wageningen, The Netherlands: CGIAR Research Program on Climate Change, Agriculture and Food Security (CCAFS).
Son, N.H., B.T. Yen, and L.S. Sebastian. 2018. Development of Climate-Related Risk Maps and Adaptation Plans (Climate Smart MAP) for Rice Production in Vietnam’s Mekong River Delta. CCAFS Working Paper no. 220. Wageningen, the Netherlands: CGIAR Research Program on

MAKING THE SMALLHOLDER FARMERS IN SOUTHEAST ASIA CLIMATE SMART - THE CCAFS R4D THRUST
226
Climate Change, Agriculture and Food Security (CCAFS). Available online at: www.ccafs.cgiar.org.
Thornton P.K., J. Van de Steeg, A. Notenbaert, and M. Herrero. 2008. The livestock climate-poverty nexus: A discussion paper on ILRI research in relation to climate change. ILRI Discussion Paper No. 11, ILRI, Nairobi, Kenya, p 76.
Trung, N.D., L.H. Anh, N.T. Thang, and L.S. Sebastian, 2017. The Challenges in Implementing Vietnam’s Nationally-Determined Contribution (NDC) in the Agriculture Sector under the Current Supporting Laws, Regulations, and Policies. CCAFS Working Paper No. 217. Wageningen, the Netherlands: CGIAR Research Program on Climate Change, Agriculture and Food Security (CCAFS). Available online at: www.ccafs.cgiar.org.
Vermeulen S. and E. Wollenberg. 2017. A rough estimate of the proportion of global emissions from agriculture due to smallholders. CCAFS Info Note. Copenhagen, Denmark: CGIAR Research Programme on Climate Change, Agriculture and Food Security.
Vermeulen S.J. 2014. Climate change, food security and small-scale producers. CCAFS Info Brief. CGIAR Research Program on Climate Change, Agriculture and Food Security (CCAFS). Copenhagen, Denmark.

PAVING THE PATHWAY FOR CLIMATE SMART AGRICULTURE AMONG SMALL SCALE FARMERS IN THE PHILIPPINES
227
PAVING THE PATHWAY FOR CLIMATE SMART AGRICULTURE AMONG SMALL SCALE FARMERS
IN THE PHILIPPINES Robert Patrick M. Cabangbang1 , Maria Victoria O. Espaldon1,
Heidi D. Mendoza1, Justine Angelo M. Lacson1, Ria Jhoanna C. Ducusin1, Decibel F. Eslava1, Moises A. Dorado2, Vicente G.
Ballaran, Jr.2, Melvin D. Ebuenga3, Concepcion L. Khan4, Bong
M. Salazar5, Calixto M. Protacio5, Edna A. Aguilar5, and Victorino A. Bato, Jr.5
1University of the Philippines Los Baños (UPLB)
School of Environmental Science and Management 2UPLB College of Engineering and Agricultural Technology
3UPLB National Crop Protection Center 4UPLB Institute of Computer Science
5UPLB College of Agriculture and Food Science
E-mail: [email protected]
ABSTRACT
The climate variability and extreme events that the Philippines is currently experiencing should compel people to rethink our ways of doing. For the Philippine agriculture sector, one of the many ways to adapt to climate change and risks associated with it is to make science and technology work for Filipino farmers. This paper presents the endeavor to develop and deploy the technologies of the action-research program “Smarter Approaches to Reinvigorate Agriculture as an Industry in the Philippines (Project SARAI).” Project SARAI is anchored on harnessing a proactive monitoring and forecasting system with the ultimate goal of providing farmers with site-specific and near real-time crop advisories. The monitoring and forecasting system uses Geographic Information System (GIS), remote sensing, crop modeling, and field validation activities. This system is able to develop and provide recommendations on daily farm issues such as pests and diseases, crop-water stress, crop-weather recommendations, and nutrient and soil dynamics. Project SARAI is currently being mainstreamed in and adopted by the Department of Agriculture (DA) Central Operations, Region 3, and Region MIMAROPA.

PAVING THE PATHWAY FOR CLIMATE SMART AGRICULTURE AMONG SMALL SCALE FARMERS IN THE PHILIPPINES
228
Keywords: Monitoring and forecasting, GIS, crop advisories, farm recommendations, project SARAI
Profile of Filipino farmers Globally, the intensification of disasters and climate hazards has been elevating. Climate change has already manifested its harmful effects on the environment. The Philippines is among the countries highly exposed and vulnerable to climate change. The vulnerability varies across regions, sectors, communities and at individual level. At the national level, the services sector had the highest number of workers followed by agriculture then the industry. In 1995, there were more agricultural workers than the services sector; however, the severe El Niño during the period of 1995-1996 have dropped the number of agriculture workers since then. The decline in the employment in agriculture was associated with the increase in the number of employments in services and industry. Moreover, the daily basic pay in agriculture was the lowest among the sectors.
Based on the report of Philippine Statistics Authority (2018), there were 11.3 million agricultural workers in 2015 where 74.25% were male and 25.75% were female. Majority (61.5%) of the agriculture workers belong to the prime working age bracket. Among the three sectors, agriculture had the highest number of older and elderly workers. Most of the young workers were in industry while the prime working age were in services. In terms of educational attainment, most of the least educated sector were in agriculture where 28% have only obtained tertiary undergraduate and graduate as compared to industry and services at 60% and 74%, respectively. The report also revealed that majority (62.4%) of the poor employed workers were in the agriculture sector.
At the regional level, most of the agriculture workers were concentrated in Western Visayas (10.37%), Central Visayas (7.95%), and ARMM (7.74%). It is interesting to note that the real wage rate of these regions was below the middle and below the nominal wage rate despite the high number of employed farmers. This may be associated with the incomplete schooling up to secondary education at 73%, 81%, and 78%, respectively. Contribution of agriculture in the national economy Stressing the importance of enhancing climate resilience, agriculture is continuously growing in size of its contribution to the national economy. For the first quarter of 2018, the agriculture sector accounted for around 10.1% of the national Gross Domestic Product (GDP) in current prices; where Php 252.2 billion pesos or around 57% is from the crop subsector. The subsector

PAVING THE PATHWAY FOR CLIMATE SMART AGRICULTURE AMONG SMALL SCALE FARMERS IN THE PHILIPPINES
229
share has grown from the past first quarter numbers of the last 2 years being 48% and 52%. This is then related to the growth of the whole agriculture sector in general which has grown from the last 5 years by 30%. Different crops have been identified to contribute to this growth some of which are from priority crops included in project SARAI. Crops included in the program that have positively contributed to the increase in agriculture sector GDP for the first quarter of 2018 are banana and corn while those that decreased it are sugarcane and tomato. These effects on the national output are attributed to price changes but it is still largely acknowledged that causes of fluctuations in production volume are weather and climate related disturbances. The most common and destructive disturbance of which would be the presence of typhoons that decrease output at the quarter the event is recorded on and could increase eventual production. However, occurrence and increase in frequency of strong rainfall and typhoons also significantly affect production volume. A specific example is palay production in Central Luzon, Region IV-MIMAROPA, and SOCCSKSARGEN has increased in the same period, first quarter of 2018, and this was seen to have occurred because of favorable weather conditions as partnered with ideal seed varieties. In showing how production may increase after a period of unfavorable climate conditions, coconut production in the Davao Region has improved after experiencing dry episodes in 2016.
Another purpose of giving importance to the sector’s resilience is the large portion of the nation’s population employed in it despite the sector having the smallest share in the national output and also being the most vulnerable. The vulnerability varies across regions, sectors, communities and at the individual level. At the national level, services sector had the highest number of workers followed by agriculture then the industry. In 1995, there were more agricultural workers than the services sector; however, the severe El Niño during the period of 1995-1996 have dropped the number of agriculture workers since then. The decline in the employment in agriculture was associated with the increase in the number of employments in services and industry. Moreover, the daily basic pay in agriculture was the lowest among the sectors.
Based on the report of Philippine Statistics Authority (2018), there were 11.3 million agricultural workers in 2015 where 74.25% were male and 25.75% were female. Majority (61.5%) of the agriculture workers belong to the prime working age bracket. Among the three sectors, agriculture had the highest number of older and elderly workers. Most of the young workers were in industry while the prime working age were in services. In terms of educational attainment, most of the least educated sector were in agriculture where 28% have only obtained tertiary undergraduate and graduate as compared to industry and services at 60% and 74%, respectively. The report

PAVING THE PATHWAY FOR CLIMATE SMART AGRICULTURE AMONG SMALL SCALE FARMERS IN THE PHILIPPINES
230
also revealed that majority (62.4%) of the poor employed workers were in the agriculture sector.
At the regional level, most of the agriculture workers were concentrated in Western Visayas (10.37%), Central Visayas (7.95%), and ARMM (7.74%). It is interesting to note that the real wage rate of these regions was below the middle and below the nominal wage rate despite the high number of employed farmers. This may be associated with the incomplete schooling up to secondary education at 73%, 81%, and 78%, respectively. Paving pathways for Climate-Smart Agriculture (CSA): The case of smarter approaches to reinvigorate agriculture as an industry in the Philippines (Project SARAI) Climate-Smart Agriculture (CSA) is a defined as approach to develop the enabling mechanisms in terms of technical, policy, and investment conditions to achieve sustainable agriculture development in the context of food security in a changing climate (Food and Agriculture Organization, 2013). As a sustainable mechanism to agriculture development, CSA is anchored on three pillars: increase productivity, enhance resilience and adaptive capacities of livelihoods and ecosystems, and reduce greenhouse gas emissions (FAO, 2013). In 2013, an action-research program dubbed as Smarter Approaches to Reinvigorate Agriculture as an Industry in the Philippines (Project SARAI) was funded by the Department of Science and Technology – Philippine Council for Agriculture and Aquatic Resources Research and Development (DOST-PCAARRD), and was led by the University of the Philippines Los Baños (UPLB). Project SARAI aims to establish a real-time crop monitoring and forecasting system for rice, corn, banana, coconut, coffee, and cacao. The system uses crop models, ensemble of weather and climate data, real-time weather data, remote sensing, geographic information system (GIS), and field monitoring reports to come up with near real-time crop monitoring information, and seasonal crop forecast. Examples of real-time crop monitoring information include site-specific crop growth stage, crop health, weather and crop relationships, and possible pest and disease infestations.
In 2018, Project SARAI was granted a Phase 2 to continue its research work, and strengthen its capacity building and extension efforts. The phase 2 of the program covered new crops to be included in the system – sugarcane, tomato, and soybean. Project SARAI also included in its framework other DOST-PCAARRD funded research Drought and Crop Assessment and Forecasting (DCAF). With DCAF on board, Project SARAI can now establish crop and drought indices, and provide near real-time crop-drought forecasts to local government units (LGUs), state universities and colleges

PAVING THE PATHWAY FOR CLIMATE SMART AGRICULTURE AMONG SMALL SCALE FARMERS IN THE PHILIPPINES
231
(SUCs), and farmers. Currently, the program is working closely with 11 co-implementing SUCs and four partner national agencies to establish SARAI community hubs. Contributing to the national CSA initiatives The country already has several CSA initiatives such as Philippine Rice Information System (PRISM), Strengthening Implementation of Adaptation and Mitigation Initiative in Agriculture (AMIA), among many others. These initiatives focus on developing CSA technologies for rice, corn, and starting works on high value crops. Project SARAI contributes to the national efforts in terms of prioritizing the country’s emerging industry for perennial crops.
On another level, Project SARAI contributes to the national CSA movement by providing a complementary proactive monitoring and forecasting system. The country’s current agricultural monitoring protocol and operations are handled by the Philippine Statistics Authority (PSA). PSA is the mandated central agency for the primary statistical data collection, including that of agricultural data and processes. On June 5, 2017, PSA has released an updated conduct of four surveys on agricultural crops, namely:
1) 2017 Palay and Corn Production Survey (PCPS); 2) 2017 Palay and Corn Stocks Survey (PCSS); 3) 2017Monthly Palay and Corn Situation Reporting Problem
(MPCSRS); and 4) 2017 Crop Production Survey (CrPS) (PSA, 2017). All these monitoring protocols are done through farmer surveys on a
quarterly basis. The survey method is not invalid; however, the survey methodology needs a complementary methodology to increase its accuracy and effectiveness (Cai et al., 2017). Project SARAI can provide a near real-time monitoring information using remote sensing and GIS. These pieces of information can be used to validate field monitoring data, and can also be used to compute for damage assessment after typhoons and other extreme weather conditions. SARAI community-based CSA technologies and practices At a community level, Project SARAI provides rich opportunities for communities to start adopting CSA frameworks, technologies, and practices. Project SARAI is currently establishing SARAI community hubs to be operated by SUCs, in partnership with LGUs. The community hubs are envisioned to serve as the go-to venue of farmers where they can report real-
PAVING THE PATHWAY FOR CLIMATE SMART AGRICULTURE AMONG SMALL SCALE FARMERS IN THE PHILIPPINES
232
time farm problems such as pest occurrences, post questions on site-specific nutrient management, and discuss with other farmers about their experiences on adopting SARAI technologies. Advancing the agriculture sector with technologies and innovations 1. Promoting a proactive agricultural sector through the SARAI-
Enhanced Agricultural Monitoring System (SEAMS) According to PAGASA, the Philippines is visited by an average of 20 typhoons annually because it is located in the Pacific Typhoon Belt. The Agriculture Sector suffers significant damage due to these extreme weather conditions. In 2018, NDRRMC reported crop losses of 8.96 billion pesos to rice and 4.49 billion pesos to corn due to Tyhoon Ompong (International name Mangkhut) alone. When it comes to these situations, Filipino farmers feel helpless when strong winds and intense rains cause severe damages to their crops. The Food and Agriculture Organization reported that agriculture monitoring and forecasting is a helpful tool in the context of food security by enabling the agriculture sector with crop-weather information making them climate resilient.
By utilizing information from advanced technologies from geographic information systems, remote sensing, and historical agrometeorological data, The SARAI-Enhanced Agricultural Monitoring System (SEAMS) is able to produce near real-time information on crop area, stage, and status throught the use of normalized difference vegetation index (NDVI). Monitoring of crop production areas is particularly useful in the national, regional, provincial, down to the farmer level. By providing crop-weather information and advisories to stakeholders on the occurrence of extreme weather conditions such as typhoons and droughts, the system can serve as an agricultural early warning system. Furthermore, SEAMS can also be used as a damage assessment tool for local government units enabling them to better allocate government resources in times of severe weather disturbances. Also, timely crop-weather advisories can help farmers adjust their daily farming activities to minimize the effects of climate change to their production by allowing farmers and other stakeholders to create better decisions in terms of daily farm activities. Farmers will be able to improve resource utilization, efficiency, and reduce crop losses therefore increasing their resilience to climate variability.
The system is currently being refined by improving its data gathering protocols through the involvement of farmers and farmer groups. This can be achieved through the encouragement of farmer field reporting. Agricultural

PAVING THE PATHWAY FOR CLIMATE SMART AGRICULTURE AMONG SMALL SCALE FARMERS IN THE PHILIPPINES
233
information gathered from the ground is a significant input to the generation of crop advisories and forecasts. 2. Improving crop protection using the smarter pest identification
technology (SPId Tech) One of the primary concerns of Filipino farmers is the occurrence of pests and diseases which is a common problem when it comes to crop production. Pests and diseases infestation often result in significant crop losses. The typical response of farmers is the use of chemical pesticides which is generally not sustainable because pests and diseases develop resistance to these chemical compounds. Crops can be protected using other management practices, however, proper identification of pest and diseases is important for them to be effective. To address this, Project SARAI developed a pest and diseases identification by utilizing recent advances in image processing and machine learning technology. The Smarter Pest Identification Technology (SPId Tech) is a mobile and web-based application which allows users to quickly identify pest and diseases. The application also has the capability to recommend management protocols and remotely report agricultural pests and diseases. Mobile pest and disease identification The Insect Pests and Diseases Identification can recognize pests and diseases through the following: Capturing live image using built-in phone camera This allows the user to remotely capture images of unfamiliar pest/disease that are present in their farms and indicated which crop is infested. The result will show the list of possible identified pest/disease with the indicated level of accuracy. The application will provide the basic information such as common name, Filipino name, scientific name, and description. Further, it also provides damage characteristics and management practices on how to control the pest. Uploading image from the gallery or phone storage This works by selecting an existing photo stored in the phone gallery. Once uploaded, it will follow the same procedure as taking a live picture.

PAVING THE PATHWAY FOR CLIMATE SMART AGRICULTURE AMONG SMALL SCALE FARMERS IN THE PHILIPPINES
234
Taking a dichotomous key quiz A dichotomous key is a tool that allows the user to identify the identity of unknown pest/disease by answering a series of description choices which leads the user to the correct name of the pest/disease. However, this feature is still under development. Pests and diseases library The Pests and Diseases Library is a compilation of the most common pests and diseases of SARAI priority crops. Users can manually search for pests and diseases depending on their crop grown. The application provides relevant information for each pest and disease including interventions on how to employ proper pest and diseases management. This feature is currently being updated to improve user experience.
SPId Tech aims to aid Filipino farmers to be more resilient to pest and diseases attacks especially now where erratic climate conditions lead to unpredictable occurrence of pests and diseases. The application provides the farmer the advantage of early detection and real-time help which helps them avoid further crop damage and losses. 3. Understanding coffee and cacao crop phenology for a better
integrated management The Food and Agriculture Organization reported in 2016 that the average yield of coffee and cacao in the Philippines is around 500 kg/ha. This yield figure is significantly lower than reported yields in other neighboring countries which is around 2.0-4.6 tons/ha. Although there are recent efforts by the Department of Agriculture and other organizations to revive the coffee and cacao industry in the Philippines, we are still challenged by low productivity due to pests and diseases infestation, declining soil fertility, unpredictable agrometeorological conditions among others. By understanding crop phenology for perennial crops like coffee and cacao, development of effective farm management practices that suit our climatic conditions is possible. The most feasible strategy is through Integrated Crop Management (ICM), which involves the incorporation of modern and enhanced technology to the traditional farming systems. ICM combines different crop production and management strategies in order to maximize yield while maintaining economic balance and environmental sustainability.

PAVING THE PATHWAY FOR CLIMATE SMART AGRICULTURE AMONG SMALL SCALE FARMERS IN THE PHILIPPINES
235
ICM practices on Coffee and Cacao Rejuvenation This is done through the cutting of vertical stems of aging and unproductive trees. This is a widely accepted practice in reinvigorating coffee farms and is reported to a more viable strategy rather than replanting. The aim of Project SARAI is to convince coffee farmers that rejuvenation is a sustainable practice to significant increase productivity. Fertilization Studying coffee and cacao phenology using the BBCH scale will identify the crucial stages in which fertilization is most required. The required nutrients can be supplied with urea (46-0-0), solophos (0-18-0), and muriate of potash, MP (0-0-60). Fertilizers are applied in a ring 50 cm from the base of the tree in 2-3 splits beginning at anthesis and every 2 months afterward. Pruning Pruning is done to (a) control the tree geometry; b) to remove damaged and unproductive parts; c) to provide easier access to the plant for other management activities; d) to inhibit pest and disease occurence; and e) to promote the growth of productive branches. This is usually done between after harvest and before flowering. Shade management Too much shade imposed by intercropped trees can encourage abnormal tree growth which affect tree geometry and make it more difficult to control plant growth and perform farm activities. Proper maintenance of shade trees should also be observed to monitor the light received by coffee and cacao trees. Cover cropping The use of cover crops such as Calopogonium sp. and Arachis pintoi can prevent soil erosion because these plants develop a strong mat of rooted stolons thus, suitable for conservation of soil in steep slopes. Being leguminous plants, they help condition the soil by promoting the production of nitrogen and other soil nutrients.

PAVING THE PATHWAY FOR CLIMATE SMART AGRICULTURE AMONG SMALL SCALE FARMERS IN THE PHILIPPINES
236
Pest and diseases management The encouragement physical and biological pest and disease management such as traps and parasitoids can reduce the use of chemical pesticides which makes the system more environmentally sustainable. Harvesting Harvesting is one of the most labor-intensive activities in coffee and cacao production. Using the appropriate harvesting method in coffee involves selective picking of ripe berries rather than strip harvesting. This method produces higher quality beans which also minimizes losses in the processing of green coffee beans. Primary processing Following the most suitable method of processing can dictate the final quality and market price of the processed green coffee beans and cacao beans. 4. Good agricultural practices: Rehabilitation strategies for banana Growth and development of banana heavily depends on weather and climatic condition in order to produce good yields. The presence of extreme weather conditions such as typhoons leaves banana plants very susceptible to crop damage. In 2012, the Department of Agriculture reported that typhoon “Pablo” (international name Bopha) caused about 7.4 billion pesos crop damage to banana alone in the Mindanao area. This is due very strong winds and flooding due to heavy rains. It is also important to note that the recovery process will be slow because banana takes a full 9 months from replanting to harvesting. This could greatly hamper the banana industry and could result into further revenue losses.
A banana rehabilitation program is being proposed by Project SARAI Banana Group to give support to the typhoon-struck banana production areas. The rehabilitation program utilizes good agricultural management practices (GAMP). Fertilizer management Appropriate fertilizer management is crucial in the rehabilitation program. The result of the rehabilitation process heavily depends on the strict compliance of farmers in the schedule and rate of fertilizer application.

PAVING THE PATHWAY FOR CLIMATE SMART AGRICULTURE AMONG SMALL SCALE FARMERS IN THE PHILIPPINES
237
Water management Banana is known for its rapid growth and high water consumption. Carr (2009) noted that water is probably the most limiting non-biological factor affecting banana production. Banana has a average daily water requirement of 3.6 mm rainfall (Bassoi, et al. 2004). For areas with pronounced dry periods, efficient use of irrigation system is recommended. Population management For newly established banana farms, pruning shall be done as soon as possible after third month from planting to select potential follower. Desuckering, thinning, or re-planting shall be done to control the plant population in the farm. In permanent plantations, the population shall be 1 mother plant and 1-2 sucker(s) ratio. Crop protection Regular monitoring is done to check for any presence of pests and diseases and suggest implementation of intervention, treatment, and eradication of infected banana plants. Weed control can be done either manually (slashing bolos and sickle), mechanically (weed cutter), cultural practice (mulching) and chemical application (FPA-approved herbicide only). Stem and mat sanitation are done by removing dead leaves and sheaths to minimize the chance of insect infestation. Also, regular sanitation of tool and equipment used in farm operations shall be observed to prevent the spread of unwanted diseases.
Due to financial constraints, it is important for banana farmers to receive fertilizer support specially during the rehabilitation process given the significant contribution of banana to the Philippine economy and income of small farmers. The development of crop insurance for banana would allow risk management to enable banana farmers to immediately rehabilitate their crop after a devastating typhoon. 5. SARAI crop suitability maps The crop suitability maps developed by Project SARAI aims to evaluate the agricultural lands in the Philippines according to the soil, rainfall, and temperature requirements of agricultural crop commodities such as rice, corn, coconut, banana, coffee, and cacao. The generated maps can be used by farmers, policy and decision makers, and entrepreneurs in planning and development of agricultural lands.

PAVING THE PATHWAY FOR CLIMATE SMART AGRICULTURE AMONG SMALL SCALE FARMERS IN THE PHILIPPINES
238
6. Maize nutrient expert The Maize Nutrient Expert was developed with collaboration with the International Plant Nutrition Institute. Project SARAI enhanced the system by providing a digital platform for the technology. The system can provide the user with a comprehensive farm analysis including site-specific fertilizer rates and profit comparison between farmers’ practice and recommended practice.
CONCLUSION The challenges of climate change and food security is global in scale. It requires the agriculture sector to be adaptive and be able to mitigate the effects of changing climate to agricultural production. Climate-smart agriculture is aiming to (1) increase agricultural productivity and income through sustainable agriculture; (2) build an adaptive and resilient agriculture sector; and (3) explore ways to reduce greenhouse gas emissions (Willams, et. al., 2015). The goal is to identify the most suitable combination of strategies in terms of local climate, physical characteristics, and socio-economic condition. However, large-scale implementation demands an immense amount of investment, and requires support from various stakeholders from the national down to the farmer level, and from various sectors, with emphasis on the necessary involvement and commitment of private sector.
REFERENCES
Bassoi, L.H., A.H. Teixeira, J.M. Filho, J.A. Silva, E.E. Silva, C.M. Ramos,
and G.C. Sediyama. 2004. Guidelines for irrigation scheduling of banana crop in São Francisco Valley, Brazil. II - Water consumption, crop coefficient, and physiologycal behavior. Revista Brasileira De Fruticultura,26(3), 464-467. doi:10.1590/s0100-29452004000300022.
Briones, R. 2017. Characterization of agricultural workers in the Philippines. Discussion Paper Series No. 2017-31. Philippine Institute for Development Studies.
Cai, X., J. Magidi, L. Nhamo, and B. van Koppen. 2017. Mapping irrigated areas in the Limpopo Province, South Africa. Colombo, Sri Lanka: International Water Management Institute (IWMI). 37p. (IWMI Working Paper 172). [doi: 10.5337/2017.205].

PAVING THE PATHWAY FOR CLIMATE SMART AGRICULTURE AMONG SMALL SCALE FARMERS IN THE PHILIPPINES
239
Carr, M.K. 2009. The Water Relations and Irrigation Requirements Of Banana (Musa Spp.). Experimental Agriculture,45(03), 333. doi:10.101 7/s001447970900787x.
FAO. 2013. Definition of Climate-Smart Agriculture. FAO. 2013. Climate-Smart Agriculture: Managing Ecosystems for
Sustainable Livelihoods. FAO. 2014. Crop Monitoring and Forecasting. FAO. 2018. FAOSTAT: Top 20 Countries Production of Coffee, green
(2016). PAGASA. 2018. Tropical Cyclone Information: Average Tropical Cyclone
Frequency (1948-2017). 'Pablo' agri damage climbs to P11.57-B. 2012, December 12). Rappler.com.
Retrieved January 11, 2019, from https://www.rappler.com/business/ 17813-pablo-agri-damage-climbs-to-p11-57-b.
Philippine Statistics Authority. 2018. Gender-based indicators of labor and employment in agriculture. Report No. 2018-9.

240

ADAPTATION STRATEGIES AND PRACTICES TO ADVERSE EFFECTS FROM CLIMATE CHANGE: TAIWAN’S EXPERIENCE AND IMPLICATIONS
241
ADAPTATION STRATEGIES AND PRACTICES TO ADVERSE EFFECTS FROM CLIMATE CHANGE: TAIWAN’S EXPERIENCE AND IMPLICATIONS
Chwen-Ming Yang
Taiwan Agricultural Research Institute, Taichung, Taiwan
E-mail: [email protected]
ABSTRACT
The world population is expected to grow to near ten billions before the year 2050, with the most increased areas are predicted to be in the sub-Saharan, Africa and south Asian regions. It is estimated that the global food production must be multiplied to feed these populations and hence, agricultural productivity needs to be sustainably improved to meet the increased demand. However, challenges to agri-food supply chains are enormous. Food production is worsening through the depletion of natural resources, energy shortage, limited arable land, environmental degradation and other challenges of global concerns facing today, including climate change. Increasing fossil fuel energy use and emission of greenhouse gases (GHGs) are considered the major anthropogenic factors accelerating pace of warming climate. According to the latest scenarios of Intergovernmental Panel for Climate Change (IPCC), air temperature will rise about 2–5°C by the late 21st century, depending on the region and emissions condition. The diversified effects of changing climate are not only about temperature increase, but also the induction of phenomena such as irregular precipitation patterns, weather extremes, sea level rise and increasing carbon dioxide concentration. For example, the erratic and unpredictable nature of droughts and floods increased in Taiwan over the last decades. Changes in the magnitude of rainfall and its distribution will cause significant agricultural disasters as well as affect the availability of water for crops production. Many countries are now actively using a variety of applicable technologies and tools to engage in agricultural research and development in response to climate change. The outputs from R&D activities will support building of resilience systems to reduce constraints and risks imposed by abiotic and biotic stresses from abnormal weather and climate patterns. In Taiwan, a series of cross-domain integrated research projects
ADAPTATION STRATEGIES AND PRACTICES TO ADVERSE EFFECTS FROM CLIMATE CHANGE: TAIWAN’S EXPERIENCE AND IMPLICATIONS
242
have been initiated and implemented since 2012, in order to develop the necessary technologies and practices for realization of policies to ensure the sustainable development of agriculture and food security under climate change. The grand challenge and concern of policy is that while most of the effects of climate change will happen in the future much of the mitigation and adaptation costs are already currently felt now. As such, multidisciplinary and multi-sectoral collaborations have been promoted to study in reducing GHG emissions from the agricultural sector and developing integrated climate-smart management of cropping systems domestically. Research on climate-smart farming is mainly working on adapting and constructing multiple resilience to cope with climate change and their impacts on agriculture and food production. The efforts and expectations are to help establish local agriculture as a dynamic and highly competitive industry, and to increase farmers’ income and welfare and upgrade the farm sector’s competitiveness, making agriculture as a model of Lifestyle of Health and Sustainability (LOHAS).
Keywords: Agricultural productivity, research and development activity, cross-domain integrated research project, policy, resilience.
INTRODUCTION
The world population is expected to grow to near ten billions before the year 2050, with the most increased areas predicted to be in the sub-Saharan, African and south Asian regions. It is estimated that the global food production must be multiplied to feed these populations (Foley et al. 2011). Therefore, the most pressing world issues relevant to food production should be carefully considered and resolved. With that, agricultural productivity is of top priority that should be sustainably improved to meet the increased food demand and so as to ensure sustainable agricultural development. Further, public health issues such as food security and food safety can only be solved under the premise of adequate food production.
However, near-term challenges to agri-food supply chains are enormous and complex (Fig. 1). Food production is worsening through the depletion of natural resources, energy shortage, limited arable land, environmental degradation and other challenges of global concerns facing today, including climate change. The phenomenon of global warming is now well-recognized and is considered as one of the primary causes of ongoing climate change. The effects of climate change have been already observed across the globe and are anticipated to be intensified in the future. According to the climate

ADAPTATION STRATEGIES AND PRACTICES TO ADVERSE EFFECTS FROM CLIMATE CHANGE: TAIWAN’S EXPERIENCE AND IMPLICATIONS
243
change scenarios provided by the reports of Intergovernmental Panel for Climate Change (IPCC), a scientific and intergovernmental body under the auspices of the United Nations (UN), even if everything possible were done to reduce and stabilize emissions of greenhouse gases (GHGs), negative impacts of climate change are projected to become more intense and severe in the near future (IPCC 2014).
Fig. 1. Near-term challenges facing global agriculture.
In the face of such a complicated and difficult situation, global communities must seek solutions to challenges in a different way from the past. There should be a consistent endeavor to strengthen multidisciplinary and multi-sectoral collaboration and cooperation on issues related to climate change, with continued efforts to promote adaptive agricultural research and development and its sustainable management and to reduce GHG emissions (Yang and Yao 2018). Increasing fossil fuel energy use and emission of GHGs are now considered the major anthropogenic factors accelerating pace of warming climate.

ADAPTATION STRATEGIES AND PRACTICES TO ADVERSE EFFECTS FROM CLIMATE CHANGE: TAIWAN’S EXPERIENCE AND IMPLICATIONS
244
CLIMATE CHANGE AND FOOD SECURITY
The majority of climate scientists agreed that a rapid climate change is real and can be felt. As declared by the Food and Agriculture Organization (FAO) of the UN, climate change will affect all four dimensions of food security: food availability, food accessibility, food utilization and food system stability (FAO 2008). As a result, it will impose profound impact on human health, livelihood, food production and marketing, etc. Risks to hunger and malnutrition will also be increased causing a serious threat to global food security. In terms of short-term impacts, it will result to more frequent extreme weather events, while long-term influences are mainly caused by the warming temperatures, irregular precipitation patterns, sea level rise and increased carbon dioxide (CO2) emissions. Climate change and food security together have multiple interrelated risks and uncertainties to agriculture for societies and ecologies.
Uncertainty in climate forecasting and impacts Unfortunately, on the basis of the latest scenarios of IPCC, air temperature will rise about 2−5°C by the late 21st century, depending on the region and emissions condition. Further, the diversified effects of changing climate are not only about temperature increase, but also through the induction of phenomena such as irregular precipitation patterns, weather extremes and sea level rise (Fig. 2). Comparing the temperature records in the period of 1880-2017, it is clear that the future temperature will develop in a hotter direction and the rate will increase (Table 1). Some facts are summarized and listed below:
• It is the 41th consecutive year that annual temperature above the 20th century average since 1977.
• All 17 years in the 21th century are among 18 warmest years on record (1998 is ninth).
• Seven warmest years have all occurred since 2010 and 4 warmest years have been last 4 years.
• Temperatures in 2015-2016 were majorly influenced by strong El Niño.
• Temperature increased 0.07℃ per decade since 1880 while 0.17℃ since 1970.
• The year 2017 was the third warmest year in the National Oceanic and Atmospheric Administration’s 138-year series of weather record.

ADAPTATION STRATEGIES AND PRACTICES TO ADVERSE EFFECTS FROM CLIMATE CHANGE: TAIWAN’S EXPERIENCE AND IMPLICATIONS
245
Fig. 2. The relationship between climate change (CC) and food security (FS).
Table 1. The global combined land and ocean annually-averaged
temperature rank and anomaly (change from 20th century
average) for each of the 10 warmest years on record (1880-2017)
Rank
1= warmest
Period of record:
1880-2017
Year Anomaly, ℃ Anomaly, ℉
1 (rank out of 138 years) 2016 0.94 1.69
2 2015 0.90 1.62
3 2017 0.84 1.33
4 2014 0.74 1.33
5 2010 0.70 1.26
6 2013 0.67 1.21
7 2005 0.66 1.19
8 2009 0.64 1.15
9 1998 0.63 1.13
10 2012 0.62 1.12
From NOAA State of the Climate, https://www.ncdc.noaa.gov/sotc/global/201613. As to precipitation pattern changes, rainfall is increasing and the
intensity is more concentrated, but the distribution is uneven (IPCC WGI AR5 Summary for Policy Makers and NOAA state of the Climate). In river

ADAPTATION STRATEGIES AND PRACTICES TO ADVERSE EFFECTS FROM CLIMATE CHANGE: TAIWAN’S EXPERIENCE AND IMPLICATIONS
246
flow projection, it is projected a non-stationarity of river flows. The future is not like the past, less water in rivers in sub-tropical regions (Milly et al. 2008). The rise of sea level will also put food producing land at risk (Chang et al. 2012). Based on scenarios of RCP4.5, 6.0, and 8.5 of AR5, ocean acidification poses substantial risks to marine ecosystems, especially polar ecosystems and coral reefs. It will puts ocean based food at risk.
In recent years, weather extremes happen more frequently around the world. Some extreme weather events have been attributed to human-induced global warming and climate change. In Taiwan, for example, the erratic and unpredictable nature of the droughts and floods increased over the last decades and gave rise to huge agricultural and economic losses. Changes in the magnitude of rainfall and its distribution also caused significant agricultural hazards as well as affected the availability of water for crops production recently.
Multifaceted impacts and interventions To those agriculture-based communities/societies that are already vulnerable to food insecurity, such as people living by the sea, low-lying areas, drylands, the Arctic and in mountains, it is likely to be the first affected. They may face immediate risk of increased crop failure, lack of appropriate crop and animal varieties, outbreaks of new species of pests, diseases and weeds, and yet, not ready for proper adaptive managements. This may also lead to shifting the levels of vulnerabilities of food systems in both developing and developed countries. In fact, agriculture, forestry and fisheries are all affected by climate change and contribute to food insecurity as a whole. It is necessary to strengthen the resilience capacity of all food production systems and the mitigation of the climate challenge (Yang and Yao 2018). Likewise, the implications for other components of the food supply chain deserve equal consideration and take a broader view to explore. What we like to emphasize is that impact of climate change on food security is not limited to a specific region, but global and comprehensive. Evidence of climate change in Taiwan As a member of global community and part of the ecological environment, Taiwan is also suffering from the impact of climate change and its influences on agricultural production. Temperature has increased by about 1.4°C over the past century. The number of total rainfall days has decreased yet it has more extreme rainfall events. Sea level has been rising 5.77 mm per year in the period of 1993-2003. In terms of seasonality, summer months become longer while shorter in winter and spring. Days of warm night have increased

ADAPTATION STRATEGIES AND PRACTICES TO ADVERSE EFFECTS FROM CLIMATE CHANGE: TAIWAN’S EXPERIENCE AND IMPLICATIONS
247
but a decreasing trend in the occurrence of cold nights. There is no long-term trend in the number of typhoon, but decadal variation is significant, less frequent in 1950’s and 1970-1990 (4.0 per year) and more frequent in 1960’s and 2000-2010 (5.4 per year). The duration of typhoon is longer, with more heavy rainfall. The projected Impacts on agricultural productivity is substantial and variability in crop production is high. Approaches of mitigation and adaptation When it comes to tackling climate change to prevent the impacts on the different elements of the earth system, there are two main ways being applied: mitigation and adaptation (FAO 2008, IPCC 2014). Mitigation may refer to actions to reduce and curb GHG emissions, while adaptation refers to the process by which an organism or a system to reduce vulnerability to climate change. In other words, mitigation attends to the causes of climate change, yet adaptation addresses its impacts and adaptive methods. Mitigating climate change Major practices for mitigating climate change include reducing GHG emissions and sequestering or storing carbon in the short term and systematic curbing emissions of GHG from various aspects of agricultural production, practice energy efficiency and greater use of renewable energy over the long term. Although the entire food system is a source of GHG emissions, primary production is by far the most important component. Considering it should be the foremost solution, incentives are needed to encourage or persuade crop and livestock producers, agro-industries and ecosystem managers to adopt good practices for mitigating climate change. Mitigation measures for agricultural sector Mitigation measures for climate change are mainly to reduce GHG emissions, followed by carbon sequestration and storage. In an energy conservation and carbon reduction action plan, such as those considered by Taiwan’ Council of Agriculture (Yang and Yao 2018), the following measures are suggested for planning:
• Establish GHG estimation, investigation and monitoring system; • Improve rice farming techniques to reduce methane (CH4) emissions; • Ameliorate nitrogen fertilizer technology to reduce nitrous oxide (N2O)
emissions; • Improve livestock management to reduce CH4 emissions;

ADAPTATION STRATEGIES AND PRACTICES TO ADVERSE EFFECTS FROM CLIMATE CHANGE: TAIWAN’S EXPERIENCE AND IMPLICATIONS
248
• Reduce the number of fishing vessels to reduce CO2 emissions; • Enhance soil carbon sequestration and storage; • Increase energy crops cultivation and use of forest biomass to replace
fossil fuels; and • Strengthen tree planting and afforestation.
Managing climate risk through adaptation Risk exists when there is uncertainty about the future outcomes of ongoing processes or about the occurrence of future events, especially under climate change scenario. Adaptation is about reducing and responding to the risks climate change poses to people’s lives and livelihoods and ecosystems. Reducing uncertainty by improving the information base and devising innovative schemes for securing against climate change hazards will both be important for successful adaptation. Adaptive management can be a particularly valuable tool for devising strategies and measures that respond to the unique risks to which different ecosystems and livelihood groups are exposed. It is also the primary practice that can directly bring benefits to farmers. Adaptation measures for agricultural production In terms of adaptation measures, many actions have been developed to help reducing vulnerability and enhancing resilience to the consequences of climate change. Some feasible and effective measures that have been adopted in Taiwan are listed as follows:
• Flexible and diverse crops cultivation for climate disasters; • Variety improvement to increase the resistance/tolerance to abiotic and
biotic stresses; • Research and development of adaptive practices on possible adverse
effects; • Preparation of preventive and precautionary mechanism to climate and
production risks; • Use of protected cultivation for vulnerable crops; and • Efficient use of resources by applications of water-conserving,
energy-saving and carbon-reduction technologies. Strengthening resilience To increase climate resilience of vulnerable farmers, it is always including their livelihoods and agro-ecosystems against the impacts of climate variability. Generally strengthening resilience involves adopting practices

ADAPTATION STRATEGIES AND PRACTICES TO ADVERSE EFFECTS FROM CLIMATE CHANGE: TAIWAN’S EXPERIENCE AND IMPLICATIONS
249
that enable vulnerable smallholders to protect existing livelihood systems, diversify their sources of income, change their livelihood strategies or migrate, if this is the best option. Changing consumption patterns and food preparation practices, including food loss and waste reduction, are important to protect food security in many circumstances. Safeguarding food security in the face of climate change also implies avoiding the disruptions or declines in global and local food supplies that could result from changes in temperature and precipitation regimes and new patterns of pests, diseases and weeds.
Most of all, raised productivity from improved agricultural management is crucial to ensure food supply and food security both domestically and globally, and sustainable management practices to food production systems for adaptation and associated mitigation should be given high priority (Yang and Yao 2018). Conservation agriculture (CA), which widely adopted in the developing countries, is an alternative choice of food production system that can make a significant difference to efficiency of water use, soil quality, capacity to withstand extreme events, and carbon sequestration. Although with lower-yielding production, practices of CA to promote agrobiodiversity, soil health and effective use of natural resources are important for local adaptation and resilience that in turn can sustain long term crop productivity. In addition, the climate-smart agricultural operation mode, which has received widespread attention recently, also takes into account the considerations and functions of adaptation and mitigation. 2017 Taiwan’s national action guidelines for mitigation and adaptation Taiwan revised its implementation guidelines for mitigation and adaptation to cope with climate change in 2017. The summary is as the followings: Agriculture mitigation
• Implement eco-friendly agricultural cultivation to stabilize agricultural production
• Promote low-carbon agriculture, improve agricultural resource recycling
• Strengthen forest resource management; raise the net quantity of national carbon sinks
Agriculture adaptation
• Safeguard resources for agricultural production
ADAPTATION STRATEGIES AND PRACTICES TO ADVERSE EFFECTS FROM CLIMATE CHANGE: TAIWAN’S EXPERIENCE AND IMPLICATIONS
250
• Strengthen the monitoring and early warning system • Reinforce government subsidies and insurance system • Integrate technology to improve the capacity for climate resilience in
agriculture, forestry, fishery and animal husbandry • Ensure food security • Build sustainable agriculture that is adaptive to climate risks Additionally, policy challenges have also been taken into consideration.
Since exact nature of effects and effectiveness of adaptation and mitigation are uncertain, issue on ‘most effects in future but much of mitigation and adaptation, costs now’ was vigorously discussed. It has been agreed that the grand challenge today is how much to invest now in mitigation and adaptation in interest to future parties at likely cost of current.
CLIMATE-SMART AGRICULTURE According to FAO, climate-smart agriculture (CSA) is an approach that helps to guide actions needed to transform and reorient agricultural systems to effectively support development and ensure food security in a changing climate (FAO 2018, http://www.fao.org/climate-smart-agriculture/en/, visited on 09/15/2018). Its aims are to tackle three main objectives: (1) sustainably increasing agricultural productivity and incomes, (2) adapting and building resilience to climate change, and (3) reducing and/or removing GHG emissions, where possible. In other words, CSA is not only an approach for developing agricultural strategies to secure sustainable food security under climate change, but also a way providing the means to help stakeholders from local to national and international levels identify agricultural strategies suitable to their local conditions. Its context can be summarized in Fig. 3. Practices for CSA
From the aforementioned description of CSA, this comprehensive approach aims to guide the agricultural production system to adapt to the climate change scenarios. Therefore, any practice or method that can maintain proper agricultural production under the changing climate can meet this definition. Here we recommend six measures with various practices that can be adapted to fit for specific conditions, as that are being applied in Taiwan. 1. Adjust breeding and planting practices
• Enhance the breeding work for biotic and abiotic stress resistance and/or tolerance to the new environment and variations in pest sources brought about by climate change

ADAPTATION STRATEGIES AND PRACTICES TO ADVERSE EFFECTS FROM CLIMATE CHANGE: TAIWAN’S EXPERIENCE AND IMPLICATIONS
251
• Cultivate a diverse suite of crop species and varieties and adjust cultivation locations with corresponding planting and harvesting day
• Change of farming system, including rotation, mixed farming of trees and non-tree crops and others, to new farming conditions
Fig. 3. The objectives and context of climate-smart agriculture (CSA).
CC: climate change. FS: food security.
2. Improve cultivation techniques and risk management • Improve water and fertilizer use efficiency and unit water and
fertilizer productivity • Reduce energy input and improve GHG emissions • Strengthen forecasting and early warning capabilities to reduce
production risks
3. Alternate management to changes of pests, diseases and weeds • Explore the changes in diseases, insects and weeds caused by climate
change and develop collective management methods to reduce their harmful effects
• Adapt to changes in local pests, diseases and weeds caused by climate change, changing cultivated crops and their cultivation methods

ADAPTATION STRATEGIES AND PRACTICES TO ADVERSE EFFECTS FROM CLIMATE CHANGE: TAIWAN’S EXPERIENCE AND IMPLICATIONS
252
4. Improve water use and management • Strengthen the development, utilization and management of water
sources to reduce risks of flood and drought • Select drought-tolerant varieties and adopt water-saving cultivation for
areas with shortage of irrigation water sources 5. Improve farmers' ability to adjust to climate change
• Training of growers/farmers to adapt to climate change and the corresponding methods of adaptation to maintain agricultural production
• Rewarding non-essential energy consumptions that help reduce GHG emissions
6. Adjust agricultural food policy and its dissemination • Improve food self-sufficiency rate to maintain food security • Publicize the importance of local production and local consumption • Support the government's various food and agriculture policy Practically, CSA approach can be combined with a variety of practices,
mixing with adaptive and mitigation means of solutions. In any case, it is important that such an approach maintains proper agricultural production under climate change and in aid of ensuring food security.
CONCLUDING REMARKS─ THE WAY FORWARD
Agriculture is a bio-based industry which people rely on living and hence, has to meet the challenge of increasing food production on land already in use for the growing of global population, especially under the current climate change scenario. Climate change has multidimensional implications and will be a continuous process for a long period of time. Food production is at risk in many places, and production is shifting and will shift more. Extremes are of concern and responses to vulnerability and resilience should be identified, planned and implemented. Adopting CSA approach is one way of helping the agriculture sector to develop climate-resilience strategies to secure sustainable food production under climate change.
In the food and agriculture sector, adaptation and mitigation are often side by side of each other so that adopting an integrated strategic approach act for the ‘smart way’ solutions is strongly encouraged. Both public and private investments on activities aiming at reducing GHG emission and increasing resilience and adaptability to the negative impacts of climate change are necessary. Many mitigation actions, as well as adaptation

ADAPTATION STRATEGIES AND PRACTICES TO ADVERSE EFFECTS FROM CLIMATE CHANGE: TAIWAN’S EXPERIENCE AND IMPLICATIONS
253
practices, have high payoffs within the food and agriculture sectors of low-income developing countries in the Asia-Pacific Region and is worth developing and promoting, especially those adaptive mechanisms that directly benefit farmers. It may also be possible to apply additional resources from regional and international aid agencies, which are becoming increasingly interested in investing applicable resources in adaptive responses to climate change influences.
One important activity of climate change work for a country or regional and international organization is to build a platform or network to promote local or multi-lateral dialogue. Key items, such as what the impacts of climate change are likely to be and what options exist for reducing vulnerability and enhancing resilience, are of important concerns. Moreover, international cooperation is a work that is worthy of long-term promotion and implementation by each country. It can help solve cross-regional issues through bilateral or multilateral experience exchange, collaborative research and joint projects. As such, it would provide local, regional or international communities with site-specific or suitable solutions.
REFERENCES Chang, C.C., C.C. Chen, and B.A. McCarl. 2012. Evaluating the Economic
Impacts of Climate Change Induced Sea Level Rise with Possible Adaptation Strategies on Taiwan Agricultural Sector. Agric. Econ. 43:205-214.
FAO. 2008. Climate change and food security: A framework document. Interdepartmental Working Group on Climate Change, Food and Agriculture Organization of the United Nations. Rome.
Foley, J.A., N. Ramankutty, K.A. Brauman, E.S. Cassidy, J.S. Gerber, and M. Johnston, et al. 2011. Solutions for a cultivated planet. Nature 478:337–342.
IPCC. 2014. Climate change 2014: Synthesis Report. Contribution of Working Groups I, II and III to the Fifth Assessment Report of the Intergovernmental Panel on Climate Change [Core Writing Team, R. K. Pachauri and L. A. Meyer (eds.)]. IPCC, Geneva, Switzerland. 151 pp.
Milly P. C.D., J. Betancourt, M. Falkenmark, R.M. Hirsch, Z.W. Kudzewicz, D.P. Lettenmaier, and R.J. Stouffer. 2008. Climate Change: Stationarity is Dead: Whither Water Management? Science 319:573-74.
Yang, C.-H. and M.-H. Yao. 2018. Cross-domain cooperation to create a fit-for-purpose adaptation mechanism for coping with climate change. Agric. Policy Farm. Prof. 313:12-21. (in Chinese).

254

JAPANESE RICE-BREEDING RESEARCH APPROACH TO ADAPT TO GLOBAL WARMING
255
JAPANESE RICE-BREEDING RESEARCH APPROACH TO ADAPT TO GLOBAL WARMING
Hiroyuki Sato
Institute of Crop Science, National Agriculture and Food
Research Organization (NARO), Tsukuba, Japan
E-mail: [email protected]
ABSTRACT
In Japan, the impacts of global warming (GW) on agriculture have been observed over the past decade, especially on paddy rice. Injuries due to high temperatures to rice plants and increased incidences of infestations and infections by insects and pathogens (such as brown planthopper, rice stripe virus, blast, brown spot, and bacterial grain rot) have caused serious problems. Chalky rice grains, induced by high temperatures (≥27°C) during the ripening period, often cause a decrease in the rice grade (appearance grade) and also the eating quality. Brown planthopper caused serious yield reduction in the hot year, 2013, which incurred losses valued at 10 billion yen. Additionally, high-temperature-induced sterility has been predicted to occur in the near future. Some rice varieties with resistance to chalky grains have been bred; however, their cultivation area is limited. One of the reasons for the limited adoption of these varieties is that they carry almost no resistance genes to insects or pathogens. To adapt to the challenges of GW, the National Agriculture and Food Research Organization (NARO) recently bred two new varieties, ‘Akiharuka’ and ‘Nijinokirameki’, which exhibit good grain appearance under high temperatures and carry resistance genes against insects and pathogens exacerbated by GW. This report will introduce the breeding program that targets increased adaptation to GW and that is one of the four major breeding programs implemented by NARO. Keywords: Global Warming, adaptation, rice-breeding program,
chalky grains, high- temperature-induced sterility

JAPANESE RICE-BREEDING RESEARCH APPROACH TO ADAPT TO GLOBAL WARMING
256
INTRODUCTION As a result of global warming (GW), temperatures in Japan have increased over the past century (1.19°C/100 years), and it is predicted that temperatures in 2100 will be 1.1°C–4.4°C higher than the current (2014) temperatures (JMA 2016). The frequency of heavy rain (>50 mm/h) in Japan has also increased (JMA 2016). GW is expected to have a serious impact on Japan’s agriculture, especially on rice production. For instance, chalky grains, induced by high temperatures (>26°C) during the ripening period, is a serious problem affecting grain yield and quality, while cracked rice, where a mature rice grain cracks due to a rapid change in water content, is recognized as another high-temperature injury. In 2013, serious yield losses (valued at 10 billion yen) were reported due to brown planthopper. According to some prediction studies, the potential incidence of high-temperature-induced sterility will exceed 5% in the Chikushi (Saga prefecture), Wakayama (Wakayama prefecture) and Nobi (Aichi prefecture) Plains in 2090s. A study has reviewed the impact of GW on Japan’s agriculture (MAFF 2007).
It is reasonably straightforward to breed rice varieties with increased tolerance to high temperatures (and consequent chalky grains) for adapting to GW. Some tolerant varieties, namely ‘Kinumusume’, ‘Nikomaru,’ and ‘Tsuyahime’, have been bred; however, the acreage planted to them is currently limited (6.6%, in 2016). One of the reasons why the cultivation area of these varieties is limited is that they have almost no resistance genes against pests and pathogens. Therefore, to breed rice varieties adapted to GW, breeding a variety with resistance to pests and pathogens and tolerance to high temperatures is necessary.
NARO recently breed two new varieties, ‘Akiharuka’ and ‘Nijinokirameki,’ both of which showed good grain appearance under high-temperature conditions and carried resistance genes to the main insects and pathogens diseases exacerbated by GW. This report introduces the breeding program concerning adaptation to GW, which is one of the four major rice-breeding programs implemented by NARO.
THE FOUR MAJOR RICE-BREEDING PROGRAMS IN NARO:
THE 4th MID-TERM (2016-2020)
From April 1, 2016, NARO embarked on the fourth mid-term breeding programs for FY2016–2020, focusing on 1) commercial varieties for use in the food industry (high-yielding, high-quality, and/or suitable for rice flour); 2) the development of new resistant/tolerant varieties for adaptation to GW; 3) forage rice varieties; and 4) high-yielding varieties (more than 12 t/ha).

JAPANESE RICE-BREEDING RESEARCH APPROACH TO ADAPT TO GLOBAL WARMING
257
CHARACTERISTICS OF TWO NEW CHALKY GRAIN RESISTANCE VARIETIES,
‘AKIHARUKA’ AND ‘NIJINOKIRAMEKI’ 1. ‘Akiharuka’; translation of Japanese name: “Landscape where
rice grows far away in autumn”
‘Akiharuka’ was introduced by the Kyushu Okinawa Agricultural Research Center, NARO (KARC /NARO) in 2017 and is a non-glutinous rice variety, belonging to the moderate maturation group in Kyushu region. When grown under high temperatures, it exhibits an attractive grain appearance (Fig. 1) and is high yielding (Table 1). The consumption quality of cooked rice of ‘Akiharuka’ is comparable with that of ‘Hinohikari,’ which is one of the best varieties for high eating quality in western Japan. ‘Akiharuka’ carries four resistance genes, namely, Bph11 against brown planthopper, Pi39 and Pb1 against rice blast, and Stvb-i against rice stripe virus (RSV). It was mainly planted in Saga prefecture (500 ha), and the rice products, i.e., rice balls and bento rice, were suitable for commercial use. Table1.Yeild trial data of 'Akiharuka'(KARC/NARO:Chikugo, Fukuoka)
Fertilization Varieties Days to Days to Culm Panicle Panicle Lodging 1000-grain Grain quality Eating
levels Heading Maturity length length number (0: No ~ weight (1:Excellent~ quality
(N: kg/10a) (cm) (cm) (/m2) 5: All) (t/ha) (%) (g) 9:Unacceptable)
Medium Akiharuka 95 140 87 20.1 322 0.2 5.7 115 22.9 4.5 Good
(N=8.0) Hinohikari 92 137 83 19.0 343 0.6 4.8 100 22.6 6.3 Good
High Akiharuka 89 143 94 20.6 350 0.9 59.8 112 22.3 4.3 Good
(N=10.5~12.0) Hinohikari 93 142 88 18.9 385 1.2 53.6 100 22.3 5.8 Good
Yield
(Brown rice base)
Fig. 1. Grain appearance of ‘Akiharuka’.
Akiharuka (Good) Hinohikari (Poor)
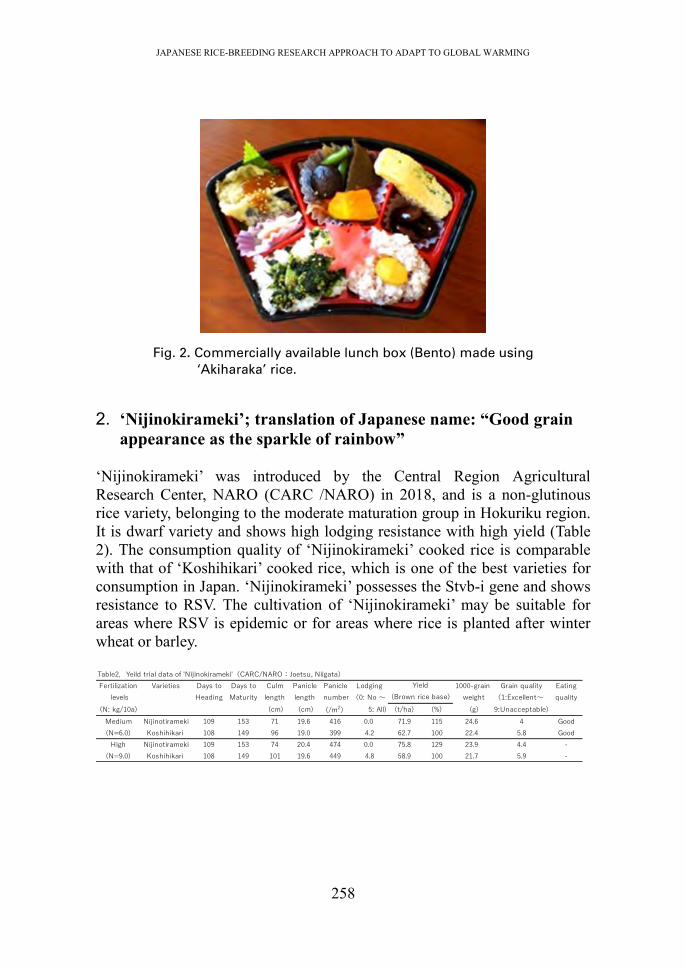
JAPANESE RICE-BREEDING RESEARCH APPROACH TO ADAPT TO GLOBAL WARMING
258
Fig. 2. Commercially available lunch box (Bento) made using
‘Akiharaka’ rice.
2. ‘Nijinokirameki’; translation of Japanese name: “Good grain appearance as the sparkle of rainbow”
‘Nijinokirameki’ was introduced by the Central Region Agricultural Research Center, NARO (CARC /NARO) in 2018, and is a non-glutinous rice variety, belonging to the moderate maturation group in Hokuriku region. It is dwarf variety and shows high lodging resistance with high yield (Table 2). The consumption quality of ‘Nijinokirameki’ cooked rice is comparable with that of ‘Koshihikari’ cooked rice, which is one of the best varieties for consumption in Japan. ‘Nijinokirameki’ possesses the Stvb-i gene and shows resistance to RSV. The cultivation of ‘Nijinokirameki’ may be suitable for areas where RSV is epidemic or for areas where rice is planted after winter wheat or barley. Table2.Yeild trial data of 'Nijinokirameki'(CARC/NARO:Joetsu, Niigata)
Fertilization Varieties Days to Days to Culm Panicle Panicle Lodging 1000-grain Grain quality Eating
levels Heading Maturity length length number (0: No ~ weight (1:Excellent~ quality
(N: kg/10a) (cm) (cm) (/m2) 5: All) (t/ha) (%) (g) 9:Unacceptable)
Medium Nijinotirameki 109 153 71 19.6 416 0.0 71.9 115 24.6 4 Good
(N=6.0) Koshihikari 108 149 96 19.0 399 4.2 62.7 100 22.4 5.8 Good
High Nijinotirameki 109 153 74 20.4 474 0.0 75.8 129 23.9 4.4 -
(N=9.0) Koshihikari 108 149 101 19.6 449 4.8 58.9 100 21.7 5.9 -
Yield
(Brown rice base)

JAPANESE RICE-BREEDING RESEARCH APPROACH TO ADAPT TO GLOBAL WARMING
259
Fig. 2. Grain appearance of ‘Nijinokirameki’.
Fig. 3. Plant habit of ‘Nijinokirameki’ in the field. ‘Nijinokirameki’ has a short
culm and shows lodging resistance.
BASIC RESEARCH CONTRIBUTING TO RICE BREEDING
FOR ADAPTATION TO GW
To develop rice varieties that are adapted to progressive GW at the earliest, it is necessary to obtain suitable genetic information, such as gene mapping and whole-genome survey. Basic genetic information helps the breeder to introduce new traits and/or to perform gene pyramiding, assembling multiple desirable genes, particularly disease-resistance genes, into one elite line using new genetic resources. Japanese rice researchers and breeders
Nijinokirameki (Good) Koshihikari (Fair)
Nijinokirameki Koshihikari (lodging)

JAPANESE RICE-BREEDING RESEARCH APPROACH TO ADAPT TO GLOBAL WARMING
260
cooperate and are striving to acquire genetic information on tolerance to heat-damage (chalky grains and sterility) and resistance to pests and pathogens that are exacerbated by GW. 1. Chalky grain tolerance
Kobayashi et al. (2007) performed quantitative traits locus (QTL) analysis using F3 lines derived from a cross between ‘Hana-echizen’ (tolerant) and ‘Niigata-wase’ (susceptible). They detected four QTLs on chromosomes 3, 4, 6, and 9. Among them, three tolerance QTLs (qWB3, qWB4, and qWB6) were alleles from ‘Hana- echizen’ while the remaining qWB9 was derived from ‘Nigata-wase’. The qWB6 was a major QTL and its additive effect was more than 30%. Another QTL for reducing the occurrence of chalky grains was identified in an indica rice variety, ‘Habataki’ (Murata et al. 2014). This QTL was named Apq1 (Appearance quality of brown rice 1), and its candidate gene is Sucrose synthase 3. This gene was introduced into the famous Japanese variety, ‘Koshihikari’ by repeated backcrossing, and two varieties harboring Apq1 were released in 2018 (Kojima 2018). Fig. 4. QTLs for reducing chalky grain frequency at high temperatures.
(Kobayashi et al. 2007)
2. High-temperature-sterility tolerance
Hakata et al. (2017) developed a novel assay system for high-temperature-sterility by using artificial rice paddies in phytotrons to conduct a highly reproducible assay throughout the year (involving a 3-d heat treatment of 35°C-day/29°C-night cycles). Using this system, they identified ten excellent heat-tolerant lines (exceed the tolerant variety, N22) from 116 accessions, which are being used to breed heat-tolerant varieties.

JAPANESE RICE-BREEDING RESEARCH APPROACH TO ADAPT TO GLOBAL WARMING
261
Fig. 5. Artificial rice paddies in phytotrons in KARC/NARO.
(Hakata et al. 2017)
3. Brown spot resistance
Brown spot of rice, which is caused by the fungus Bipolaris oryzae, is one of the most serious rice diseases worldwide. In temperate regions such as Japan, high temperatures during rice flowering and grain-filling stages tend to increase the severity of brown spot epidemics
Sato et al. (2015) performed QTL analysis on recombinant inbred lines from ‘Tadukan’ (resistant) × ‘Hinohikari’ (susceptible), and three resistance QTLs (qBSfR1, qBSfR4, and qBSfR11) were detected on chromosomes 1, 4, and 11, respectively. The ‘Tadukan’ alleles at qBSfR1 and qBSfR11 and the ‘Hinohikari’ allele at qBSfR4 increased resistance. Near-isogenic lines with the major resistance QTL, qBSfR11, in a susceptible background (‘Koshihikari’) exhibited significant field resistance, confirming the effectiveness of qBSfR11. Genetic markers flanking qBSfR11 will be powerful tools for marker-assisted selection to accelerate breeding for increased brown spot resistance.

JAPANESE RICE-BREEDING RESEARCH APPROACH TO ADAPT TO GLOBAL WARMING
262
4. Bacterial grain rot resistance
Bacterial grain rot, caused by the bacterial pathogen Burkholderia glumae, is a destructive disease of rice. At anthesis, rice panicles are attacked by the pathogen, and the infection causes unfilled or aborted grains, reducing grain yield and quality. Because the optimal temperature range for the growth of B. glumae is high (30–35°C), GW may cause bacterial grain rot to become even more destructive.
Mizobuchi et al. (2013) performed QTL analysis of backcrossed inbred lines from ‘Kele’ (resistant) × ‘Hitomebore’ (susceptible) and detected one major resistance QTL (RBG2) on chromosome 1. Recently, they have tried to conduct fine mapping of RBG2 (Mizobuchi et al. 2015).
CONCLUSION In Japan, obvious impacts of GW on agriculture has been observed over the past decade, especially in paddy field rice, High-temperature injury to rice plants and increased incidence of insects and pathogens (brown planthopper, RSV, blast, brown spot, and bacterial grain rot) have become major problems. NARO has embarked on the 4th mid-term breeding programs for FY2016-2020, focusing on the development of new pest- and disease-resistant varieties and high-temperature stress-tolerant varieties for adaptation to GW. The conclusions of this report are as follows: 1. It is necessary for us to breed rice varieties that adapt to progressive GW. 2. NARO has bred two new varieties (‘Akiharuka’and ‘Nijinokirameki;)
with good grain appearance under high-temperature stress and with pest- and disease-resistance genes.
3. Basic research is also necessary to obtain the genetic information to facilitate breeding for adaptation to GW, enabling the breeder to introduce new traits and/or to perform gene pyramiding, using new plant genetic resources, in the future.
REFERENCES
Hakata, M., H. Wada, C. Masumoto‑Kubo, R. Tanaka, H. Sato, and S. Morita. 2017. Development of a new heat tolerance assay system for rice spikelet sterility. Plant Methods 13:34.
JMA 2016. Climate Change Monitoring Report, Chapter2- Climate change. (http://www.jma.go.jp/jma/en/NMHS/ccmr/4_ccmr2016_chapter2.pdf)
Kobayashi, A., B. Genliang, Y. Shenghai, and K. Tomita. 2007. Detection of quantitative trait loci for white-back and basal-white kernels under

JAPANESE RICE-BREEDING RESEARCH APPROACH TO ADAPT TO GLOBAL WARMING
263
high temperature stress in japonica rice varieties. Breed. Sci. 57: 107-116.
Kojima Y. 2018. Blanding of new rice cultivars to motivate farmers in Toyama. The Hokuriku Crop Science 53:65-66.
MAFF. 2007. Impact of Global Warming on Agriculture, Forestry and Fisheries and Possible Countermeasures in Japan, Report on Research and Development in Agriculture. Forestry and Fisheries No.23.
(http://www.affrc.maff.go.jp/docs/e/attach/pdf/Data2-1.pdf). Mizobuchi, R., H. Sato, S. Fukuoka, T. Tanabata, S. Tsushima, T. Imbe, and
M. Yano. 2013. Mapping a quantitative trait locus for resistance to bacterial grain rot in rice. Rice. 6:13.
Mizobuchi, R., H. Sato, S. Fukuoka, S. Tsushima, and M. Yano. 2015. Fine mapping of RBG2, a quantitative trait locus for resistance to Burkholderia glumae, on rice chromosome 1. Mol Breeding. 35:15.
Murata, K., Y. Iyama, T. Yamaguchi, H. Ozaki, Y. Kidani, and T. Ebitani. 2014. Identification of a novel gene (Apq1) from the indica rice cultivar 'Habataki' that improves the quality of grains produced under high-temperature stress. Breed. Sci. 64: 273-281.
Sato, H., K. Matsumoto, C. Ota, T. Yamakawa, J. Kihara, and R. Mizobuchi. 2015. Confirming a major QTL and finding additional loci responsible for field resistance to brown spot (Bipolaris oryzae) in rice. Breed. Sci. 65: 170-175.

264

COUNTERMEASURES AGAINST THE OCCURRENCE OF CHALKY GRAIN DURING RICE RIPENING UNDER HIGH TEMPERATURES
265
COUNTERMEASURES AGAINST THE OCCURRENCE OF CHALKY GRAIN DURING RICE RIPENING
UNDER HIGH TEMPERATURES
Hiroshi Nakano
Kyushu Okinawa Agricultural Research Center, National Agriculture and Food Research Organization (NARO), Chikugo,
Japan
E-mail: [email protected]
ABSTRACT
Owing to global warming, rice plants are exposed to higher temperatures during ripening. Chalky grain is one of the main types of damage caused by high temperatures (in addition to low solar radiation). Chalky grains are categorized into several types based on the position of the chalky appearance, such as milky-white, basal-white, and white-back. Rice comprising a high proportion of chalky grains when coocked has reduced palatability. Furthermore, farmers are extremely concerned about the occurrence of chalky grains because brown rice containing a high proportion of chalky grains has a low selling price. One of the leading rice varieties in western Japan is ‘Hinohikari,’ which when coocked has high palatability; however, this variety is particularly susceptible to high temperatures during ripening. The deterioration of the grain quality of ‘Hinohikari’ has become an important problem. To resolve this problem, a heat-tolerant variety called ‘Nikomaru’ was developed by NARO in 2005. ‘Nikomaru’ exhibits reduced occurrence of chalky grain at high temperatures. Recently, in addition to ‘Nikomaru’, several heat-tolerant varieties, such as ‘Sagabiyori,’ have been developed, and the area planted with such varieties has gradually been extended to southwestern Japan. However, the area planted with ‘Hinohikari’ still remains high at approximately 40% of the total rice area planted in southwestern Japan. Therefore, in these areas, the development of cultivation techniques that reduce the frequency of chalky grains is necessary. As a countermeasure against high temperatures, we are now developing a novel weather-adaptive top-dressing technique based on the results of analyzing conditions that result in the occurrence of each type of chalky grain and the weather forecast during ripening. The frequency of basal-white and white-back grains was found to increase when rice plants

COUNTERMEASURES AGAINST THE OCCURRENCE OF CHALKY GRAIN DURING RICE RIPENING UNDER HIGH TEMPERATURES
266
with low nitrogen concentrations ripen under high-temperature conditions. When high temperatures are forcast prior to ripening, the amount of top-dressing can be optimized based on the leaf color before heading and an equation to reduce the occurrence of basal-white and white-back grains. In contrast, when high temperatures are not expected prior to ripening, the amount of top-dressing is decided according to conventional farming methods. We further plan to increase the accuracy of the technique by conducting demonstration experiments in farmers' fields. This technique may facilitate consistant rice production under climate changes.
Keywords: Chalky grain, countermeasure, cultivation technique,
global warming, rice, top-dressing variety, rice quality
INTRODUCTION
Rice plants are increasingly being exposed to high temperatures during ripening due to global warming. Chalky grain is one of the main types of visible damage caused by high temperatures (and low solar radiation). Starch granules in the endosperm cells of chalky grains are loosely packed, and numerous air spaces between the starch granules cause random light reflections that create a chalky appearance (Tashiro and Ebata 1975; Tashiro and Wardlaw 1991; Zakaria et al. 2002).
Chalky grains are categorized into several types according to the position on the grain with chalky appearance (Fig. 1). The three major types are milky-white, basal-white, and white-back grains. A milky-white grain has a chalky ring in the cross section of the endosperm. A basal-white grain has a chalky appearance near the embryo. A white-back grain has a chalky appearance on the side opposite to the embryo. In addition to these three major types, white-core and white-belly grains are also observed. A white-core grain has a chalky appearance in the center similar to milky-white grains. However, the area of the chalky appearance in white-core grains is smaller than that in milky-white grains. A white-belly grain has a chalky appearance on the same side as the embryo.

COUNTERMEASURES AGAINST THE OCCURRENCE OF CHALKY GRAIN DURING RICE RIPENING UNDER HIGH TEMPERATURES
267
Fig. 1. Three major types of chalky grains.
The palatability of cooked rice exhibits a quadraic relationship with temperature during ripening , with a peak at about 25℃ in the leading Japanese varieties ‘Koshihikari’ and ‘Hinohikari’ (Mastue et al. 2012). In addition, the hardness (H)/adhesion (–H) ratio has a quadratic relationship with temperature during ripening, showing a peak at 24 ℃ in these varieties. Wakamatsu et al. (2007) found that the paratability of cooked rice decreases with increasing the proportion of chalky grains. The concentrations of amylose and super-long chains of amylopectin concentrations in rice grains demonstrate positive correlations with the retrodegradation in starch of cooked rice (Yoshii et al. 1997; Inouchi 2010). Amylose concentration in rice grain increases with decreasing temperature during ripening (Asaoka et al. 1985; Inatsu 1988; Matsue et al. 1991). In contrast, the concentrations of super-long chains of amylopectin in rice grains increases with increasing temperature during ripening (Umemoto et al. 1999; Okuda et al. 2006; Yamakawa et al 2007; Igarashi et al. 2008). Thus, the concentrations of amylose and super-long chains of amylopectin may cause differences in palatability of cooked rice that is associated with high temperatures during ripening.
In Japan, farmers are extremely concerned regarding the occurrence of chalky grain because brown rice containing a high proportion of chalky grains has a low selling price. Brown rice containing undamaged grains in the proportion of >70%, 60%, or 45% is classified as first, second, or third grade, respectively, whereas a proportion of <45% is considered to be non-standard. The price of brown rice differs by approximately 1,000 yen per 60 kg between the grades.
To reduce the occurrence of chalky grains, the development of heat-tolerant varieties and cultivation techniques are necessary. This paper described some heat-tolerant varieties that are cultivated in southwestern Japan, the conditions under which each type of chalky grain occurs, and countermeasures that can be undertaken to minimize the occurrence of

COUNTERMEASURES AGAINST THE OCCURRENCE OF CHALKY GRAIN DURING RICE RIPENING UNDER HIGH TEMPERATURES
268
chalky grains during ripening under high temperatures (or low solar radiation).
HEAT-TOLERANT RICE VARIETIES FOR WESTERN JAPAN
The introduction of heat-tolerant varieties is a powerful countermeasure against the occurrence of chalky grain during the ripening of rice under high temperatures. Farmers can select heat-tolerant varieties suitable for their fields before planting in preparation for high temperatures. Leading variety ‘Hinohikari’ and heat-tolerant variety ‘Nikomaru’
One of the leading varieties in western Japan is ‘Hinohikari,’ which is planted in 27 prefectures (Fig. 2). The area planted with this variety in 2017 is estimated at approximately 130,000 ha (representing 8.9% of the rice acreage grown in Japan) (Beikokukiko 2018). The coocked rice of ‘Hinohikari’ has high palatability ; however, this variety is susceptible to high temperatures during ripening. The deterioration of the grain quality of ‘Hinohikari’ has become an important problem.
Fig. 2. Leading rice variety ‘Hinohikari’ and its area planted in Japan.
Green-colored areas indicate prefectures where ‘Hinohikari’ is planted.
To resolve this problem, a heat-tolerant variety called ‘Nikomaru’ was developed by NARO and released in 2005 (Fig. 3) (Sakai et al. 2007). ‘Nikomaru’ exhibits a reduced occurrence of chalky grain caused by high temperatures. Since its release, the area in which ‘Nikomaru’ is planted has been steadily increasing. Morita and Nakano (2011) examined the ripening features of ‘Nikomaru’ under high temperatures, and revealed that it could

COUNTERMEASURES AGAINST THE OCCURRENCE OF CHALKY GRAIN DURING RICE RIPENING UNDER HIGH TEMPERATURES
269
accumulate a greater amount of stem non-structural carbohydrates before heading, which could be translocated to the grain to sustain an accelerated grain-growth rate under high temperatures, resulting in the enhancement of ripening performance. In addition, Nagata et al. (2013) found that ‘Nikomaru’ has a high resistance to grain cracking. Several heat-tolerant varieties, namely ‘Minoritsukushi’ and ‘Natsuhonoka’ have been developed,using ‘Nikomaru’ as one of the parents (Wada et al. 2016; Wakamatsu et al. 2016).
Fig. 3. Heat-tolerant rice variety ‘Nikomaru.’
(Provided by Dr. Makoto Sakai, NARO)
Brown rice quality of ‘Nikomaru’ in high temperature year Morita (2005) investigated the relationship between daily mean temperature during early ripening (i.e., 20 days after heading), which affects the occurrence of chalky grains, and the proportion of chalky grains in ‘Koshihikari’ and found that chalky grains begin to occur at approximately 24℃ with a slope approximately 10% per 1oC from 28 to 29oC.
Fig. 3 shows the daily mean temperature during the 2010 rice growing season. The temperature from summer to autumn was much higher than that in normal years. In southwestern Japan, ‘Hinohikari’ seedlings are transplanted in late June, the rice plants head in late August, and are then harvested in early October. The daily mean temperature during early ripening was about 28℃ in

COUNTERMEASURES AGAINST THE OCCURRENCE OF CHALKY GRAIN DURING RICE RIPENING UNDER HIGH TEMPERATURES
270
2010, about 2oC higher than that in normal years. Fig. 4 shows the grains harvested at our research center, which is located in Chikugo, Fukuoka, southwestern Japan, in 2010. ‘Hinohikari’ had a high proportion of chalky grains but ‘Nikomaru’ had a markedly lower proportion. Therefore, ‘Nikomaru’ showed greater tolerance to heat than ‘Hinohikari’ in this year.
Fig. 4. Daily mean temperature during rice growing season in 2010 in Chikugo,
Fukuoka, Japan.
Fig. 5. Rice grains harvested at an experimental field at Chikugo, Fukuoka,
Japan in 2010.
One hundred grains of each variety obtained at random were divided
into chalky and undamaged grains. (Provided by Dr. Makoto Sakai,
NARO)

COUNTERMEASURES AGAINST THE OCCURRENCE OF CHALKY GRAIN DURING RICE RIPENING UNDER HIGH TEMPERATURES
271
Fig. 6 shows the proportion of varieties planted in southwestern Japan. Recently, in addition to ‘Nikomaru,’ several heat-tolerant varieties, such as ‘Sagabiyori,’ have been developed, and the area planted with these varieties has gradually extended in southwestern Japan. However, the area planted area with ‘Hinohikari’ still remains high at about 40% of the total rice planted area in southwestern Japan. Therefore, in these area, the development of cultivation techniques to reduce the occurrence of chalky grains has been necessary.
Fig. 6. Proportions of rice varieties planted in southwestern Japan.
CONDITIONS AFFECTING THE FREQUENCY OF EACH TYPE
OF CHALKY GRAIN
Chalky grains are categorized into several types, mostly according to the position on the grain of the chalky appearance. To develop cultivation techniques to ameliorate the detrimental effects of high temperatures during grain ripening, it is important to analyze the conditions under which each type of chalky grain occurs. Solar radiation and daily mean temperature during early ripening Some research groups have analyzed the relationships between the proportion of each type of chalky grain and the weather or growing conditions. Wakamatsu et al. (2009) examined the relationships between solar radiation during early ripening (i.e., 20 days after heading) and revealed that the proportion of milky-white grains increased with decreasing solar radiation.

COUNTERMEASURES AGAINST THE OCCURRENCE OF CHALKY GRAIN DURING RICE RIPENING UNDER HIGH TEMPERATURES
272
Kobata et al. (2004) reported that milky-white grains occured when the ability of the sources to supply carbohydrate to each developing grain is insufficient. These results mean that the frequency of milky-white grains increaseed when rice plants ripened under high temperatures coupled with low solar radiation. In contrast, basal-white and white-back grains increased when rice plants ripened under high temperatures (Morita et al. 2005a; Wakamatsu et al. 2008). Nitrogen status of rice plants Several research groups have analyzed the relationships between nitrogen status of the rice plant (e.g., the protein concentration in the grain and the leaf chlorophyll content, as measured with a SPAD chlorophyll meter) and the proportion of white-back and basal-white grains. Wakamatsu et al. (2008) showed that the proportion of white-back grains had a significant negative correlation with grain protein concentration. Furthermore, the proportion of basal-white grains was significantly negatively correlated with not only grain protein concentration (Morita et al. 2005), but also with the SPAD value at full heading (Morita et al. 2015). These results mean that white-back and basal-white grains increase in frequency when rice plants with low nitrogen concentrations ripen under high temperatures (Morita et al. 2016). Therefore, the frequency of basal-white and white-back grains might be reduced by nitrogen application.
A WEATHER-ADAPTIVE TOP-DRESSING TECHNIQUE
As a countermeasure against the damage caused by high temperatures, a novel weather-adaptive top-dressing technique, based on the results of analysis of the conditions under which each type of chalky grain occurred, and the weather forecast during ripening is being developed (Morita 2011; Morita et al. 2015).
In this technique, leaf color is measured before heading (Fig. 7). When high temperatures are forecast prior to ripening, the amount of top-dressing nitrogen applied can be optimized based on the leaf color and an equation to calculate the amount of nitrogen applied, to reduce the occurrence of basal-white and white-back grains. In contrast, when high temperatures are not forecast prior to ripening, the amount of top-dressing applied is decided according to the conventional method used by farmers. We are currently conducting demonstration experiments in farmers' fields. In addition, nitrogen application just before heading has a risk of increasing the protein concentration of the grain. There is a negative correlation between the protein concentration in the grain and the palatability of cooked rice (Ishima et al.

COUNTERMEASURES AGAINST THE OCCURRENCE OF CHALKY GRAIN DURING RICE RIPENING UNDER HIGH TEMPERATURES
273
1974). A top-dressing technique, which can manage to decrease the proportion of chalky grains while avoiding high protein concentrations in grain leading to low palatavility of cooked rice, will be necessary.
The frequency of milky-white grains increases mainly when rice plants ripen under low levels of solar radiation (Wakamatsu et al. 2009). To reduce the occurrence of milky-white grains, it is important to increase the available assimilate supply per grain. Kobata et al. (2004) reported that the occurrence of milky-white grains could be reduced by decreasing the number of spikelets per panicle. It was considered that, when low solar radiation is forcast prior to ripening, the amount of top-dressing nitrogen should be reduced (Morita 2011). However, this strategy contains the risk of decreasing grain yield by decreasing the number of spikelets.
It is anticipated that this technique will facilitate consistant rice production under climate changes.
Fig. 7. Weather-adaptive top-dressing technique.
This scheme was modified from that reported by Morita (2011).

COUNTERMEASURES AGAINST THE OCCURRENCE OF CHALKY GRAIN DURING RICE RIPENING UNDER HIGH TEMPERATURES
274
CONCLUSION
Heat-tolerant varieties such as ‘Nikomaru’ have been developed and have demonstrated tolerance in high-temperature years such as 2010. The introduction of heat-tolerant varieties is effective at reducing the frequency of low-quality grain types.
It was found that basal-white and white-back grains increase when rice plants with a low nitrogen concentration ripen under high temperatures. Based on this result, we are developing a novel weather-adaptive top-dressing technique. When high temperatures are expected prior to ripening, the amount of top-dressing can be optimized based on the leaf color and an equation to reduce the occurrence of basal-white and white-back grains. We plan to increase the accuracy of the technique through demonstration experiments in farmers' fields.
REFERENCES
Asaoka, M., K. Okuno, and H. Fuwa. 1985. Effect of environmental
temperature at the milky stage on amylose content and fine structure of amylopectin of waxy and nonwaxy endosperm starches of rice (Oryza sativa L.). Agricultural and Biological Chemistry, 49: 373–379.
Beikokukiko. 2018. Trend of the proportion of rice varieties planted area in 2017. (http://www.komenet.jp/pdf/H29sakutuke.pdf; Accessed 21 October 2018).
Inatsu, O. 1988. Studies on improving the eating quality of Hokkaido rice. Report of the Hokkaido Prefectural Agricultural Experiment Station, 66: 1–89.
Inouchi, N. 2010. Study on the structures and physical properties of endosperm starches of rice and other cereals. Jouranl of Applied Glycoscience 57: 13–23.
Igarashi, T., H. Kanda, and M. Kinoshita. 2008. Grain-filling temperature of rice influences the content of super-long chain of amylopectin and its unit-chain distribution. Journal of Applied Glycoscience, 55: 191–197.
Ishima, T., H. Taira, H. Taira, and K. Mikoshiba. 1794. Effect of nitrogenous fertilizer application and protein content in milled rice on organoleptic quality of cooked rice. Report of National Food Research Institute, 29: 9–15.
Kobata, T., N. Uemuki, T. Inamura, and H. Kagata. 2004. Shortage of assimilate supply to grain increases the proportion of milky white rice kernels under high temperatures. Japanese Journal of Crop Science, 73: 315–322.
Matsue, Y. 2012. Rice palatability science from the viewpoint of crop

COUNTERMEASURES AGAINST THE OCCURRENCE OF CHALKY GRAIN DURING RICE RIPENING UNDER HIGH TEMPERATURES
275
production. Yokendo, Bunkyo-ku, Tokyo, Japan. 141 pp. Matsue, Y., K. Mizuta, K. Furuno, and T. Yoshida. 1991. Studies on
palatability of rice grown in northen Kyushu. Japanese Journal of Crop Science, 60: 490–496.
Morita, S. 2005. White immature kernels. Poor palatability, and grain weight decrease of rice due to high temperature during the grain-filling periods. Agricultural Technology, 60: 442–446.
Morita, S., O. Kusuda, J.-I. Yonemaru, A. Fukushima, and H. Nakano. 2005. Effects of topdressing on grain shape and grain damage under high temperature during ripening of rice. Proceedings of the World Rice Research Conference: Rice is life: Scientific perspectives for the 21st century Tsukuba, Japan (pp. 560–562). Los Baños: International Rice Research Institute and Tsukuba: Japan International Research Center for Agricultural Sciences.
Morita, S., S. Miyawaki, H. Nakano, H. Wada, M. Hakata, and R. Tanaka. 2015. Decision method of the optimum amount of nitrogen application in weather-adaptive top dressing technique to diminish white-base grains under high temperature conditions. The 239th Meeting of Crop Science Society of Japan, pp. 145.
Morita, S. 2011. Ine no kouon syougai to taisaku [High temperature damage in rice and its measures]. Tokyo: Nosan Gyoson Bunka Kyokai.
Morita S. and H. Nakano. 2011. Nonstructural carbohydrate content in the stem at full heading contributes to high performance of ripening in heat-tolerant rice cultivar Nikomaru. Crop Science, 51: 818–828.
Nagata, K., R. Sasaki, and Y. Ohdaira. 2013. Cultivar differences in the grain cracking of rice under the high air temperature conditions during grain filling. Japanese Journal of Crop Science, 82: 42–48.
Okuda M, K. Hashizume, M. Joyo, M. Numata, N. Goto–Yamamoto, and S. Mikami. Changes in mean air temperature after heading and starch characteristics of rice grains for sake making among harvest years and areas. Journal of the Brewing Society of Japan, 105: 97–105.
Sakai, M., M. Okamoto, K. Tamura, R. Kaji, R. Mizobuchi, H. Hirabayashi, F. Souichi, M. Nishimura, and T. Yagi. 2007. ‘Nikomaru’, a new rice variety with excellent palatability and grain appearance developed for warm region of Japan. Breeding Research, 9: 67–73.
Tashiro, T. and M. Ebata. 1975. Studies on white-belly rice kernel: IV. Opaque rice endosperm viewed with a scanning electron microscope. Japanese Journal of Crop Science 44: 205–214.
Tashiro, T. and I.F. Wardlaw. 1991. The effect of high temperature on the accumulation of dry matter, carbon and nitrogen in the kernel of rice. Australian Journal of Plant Physiology, 18: 259–265.
Umemoto, T., K. Terashima, Y. Nakamura, and H. Satoh. 1991. Differences

COUNTERMEASURES AGAINST THE OCCURRENCE OF CHALKY GRAIN DURING RICE RIPENING UNDER HIGH TEMPERATURES
276
in amylopectin structure between two rice varieties in relation to the effects of temperature during grain‐filling. Starch, 51: 58–62.
Wada, T., T. Inoue, M. Tsubone, T. Ogata, K. Miyahara, Y. Hamachi, M. Furusho, M. Miyazaki, O. Yamaguchi, M. Ishibashi, H. Sato, and Y. Matsue. 2016. ‘Minoritsukushi’, a new rice cultivar with medium-late maturity, high yield, fine palatability and tolerance to high temperature during ripening period. Bulletin of the Fukuoka Agriculture and Forestry Research Center, 2: 1–7.
Wakamatsu, H., O. Sasaki, and A. Tanaka. 2009. Effects of the amount of insolation and humidity during the ripening period on the grain quality of brown rice in warm regions of Japan. Japanese Journal of Crop Science, 78: 476–482.
Wakamatsu K., O. Sasaki, I. Uezono, and A. Tanaka, A. 2007. Effects of high air temperature during the ripening period on the grain quality of rice in warm regions of Japan. Japanese Journal of Crop Science, 76: 71–78.
Wakamatsu K., O. Sasaki, I. Uezono, and A. Tanaka. 2008. Effect of the amount of nitrogen application on occurrence of white-back kernels during ripening of rice under high-temperature conditions. Japanese Journal of Crop Science, 77: 424–433.
Wakamatsu, K., I. Yamane, M. Sato, Y. Komaki, M. Oouchida, K. Mori, J. Sonoda, H. Goto, T. Shigemizu, H. Kuwahara, A. Tanaka, and S. Nagayoshi. 2016. Breeding a new rice cultivar ‘Natsuhonoka’. Bulletin of the Kagoshima Prefectural Institute for Agricultural Development, 10: 9–20.
Yamakawa, H., T. Hirose, M. Kuroda, and Yamaguchi T. 2007. Comprehensive expression profiling of rice grain filling-related genes under high temperature using DNA microarray. Plant Physiology, 144: 258–277.
Yoshii, Y., M. Arisaka, T. Jou, and T. Hayakawa. 1997. Phytochemical properties of low amylose rice. Nippon Shokuhin Kagaku Kogaku Kaishi, 44: 353–360.
Zakaria, S., T. Matsuda, S. Tajima, and Y. Nitta. 2002. Effect of high temperature at ripening stage on the reserve accumulation in seed in some rice cultivars. Plant Production Science, 5: 160–168.
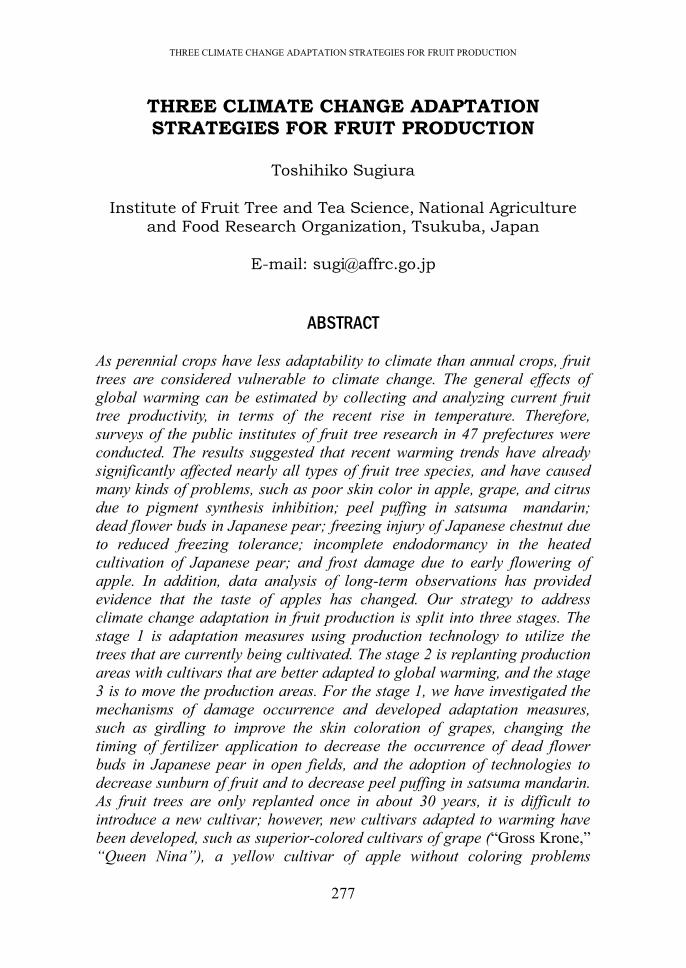
THREE CLIMATE CHANGE ADAPTATION STRATEGIES FOR FRUIT PRODUCTION
277
THREE CLIMATE CHANGE ADAPTATION STRATEGIES FOR FRUIT PRODUCTION
Toshihiko Sugiura
Institute of Fruit Tree and Tea Science, National Agriculture and Food Research Organization, Tsukuba, Japan
E-mail: [email protected]
ABSTRACT
As perennial crops have less adaptability to climate than annual crops, fruit trees are considered vulnerable to climate change. The general effects of global warming can be estimated by collecting and analyzing current fruit tree productivity, in terms of the recent rise in temperature. Therefore, surveys of the public institutes of fruit tree research in 47 prefectures were conducted. The results suggested that recent warming trends have already significantly affected nearly all types of fruit tree species, and have caused many kinds of problems, such as poor skin color in apple, grape, and citrus due to pigment synthesis inhibition; peel puffing in satsuma mandarin; dead flower buds in Japanese pear; freezing injury of Japanese chestnut due to reduced freezing tolerance; incomplete endodormancy in the heated cultivation of Japanese pear; and frost damage due to early flowering of apple. In addition, data analysis of long-term observations has provided evidence that the taste of apples has changed. Our strategy to address climate change adaptation in fruit production is split into three stages. The stage 1 is adaptation measures using production technology to utilize the trees that are currently being cultivated. The stage 2 is replanting production areas with cultivars that are better adapted to global warming, and the stage 3 is to move the production areas. For the stage 1, we have investigated the mechanisms of damage occurrence and developed adaptation measures, such as girdling to improve the skin coloration of grapes, changing the timing of fertilizer application to decrease the occurrence of dead flower buds in Japanese pear in open fields, and the adoption of technologies to decrease sunburn of fruit and to decrease peel puffing in satsuma mandarin. As fruit trees are only replanted once in about 30 years, it is difficult to introduce a new cultivar; however, new cultivars adapted to warming have been developed, such as superior-colored cultivars of grape (“Gross Krone,” “Queen Nina”), a yellow cultivar of apple without coloring problems

THREE CLIMATE CHANGE ADAPTATION STRATEGIES FOR FRUIT PRODUCTION
278
(“Morinokagayaki”), a Japanese pear cultivar resistant to dead flower buds (“Rinka”), a citrus resistant to peel puffing (“Mihaya”), and a peach cultivar with a low chilling requirement (“Sakuhime”). For the stage 3, the movement of production areas, we have created predictive maps showing suitable growing areas for various fruit trees for the future, for producers and local governments. Maps of future suitable areas for orchards have been developed for apple satsuma mandarins, which are the most common fruit trees in Japan, and for tankans, which are subtropical citrus fruits.
Keywords: Cultivar, fruit sunburn, global warming, poor skin color,
suitable area
INTRODUCTION
Climate change affects agriculture significantly, and adaptation measures must be developed as countermeasures against the risks to agricultural productivity worldwide (IPCC, 2014). A temperature increases of 1.2 ºC has been observed over the past 100 years in Japan (JMA, 2018). Considering that the development of cultivars and fruit cultivation technology has undergone major improvements in Japan over the past century, it is difficult to identify the impacts of temperature increase on agricultural productivity by comparing conditions between now and 100 years ago. Looking at changes in average temperature in Japan since the 1970s, major changes have occurred from the end of the 1980s onward. Mean temperatures from 1990 onward are approximately 0.7 ºC higher than the mean temperature between 1970 and 1989.
As perennial crops have less adaptability to climate than annual crops, fruit trees are considered particularly vulnerable to climate change (MAFF, 2015). Already, the effects of global warming on fruit tree productivity in Japan are apparent. This report covers assessments of global warming impacts on fruit tree production in the past and future, and the countermeasures that Japan has developed and will develop in the future.
CLIMATE CHANGE EFFECTS ON FRUIT TREES
Current fruit damage In order to develop climate change adaptation measures, scientific impact assessment is a prerequisite. The general effects of climate change can be estimated by collecting and analyzing data from various agricultural systems on production changes due to this recent temperature rise.

THREE CLIMATE CHANGE ADAPTATION STRATEGIES FOR FRUIT PRODUCTION
279
Therefore, the National Agriculture and Food Research Organization carried out a survey of already-manifested impacts of warming on agriculture in all 47 prefectures of Japan (Sugiura et al., 2012). All prefectures reported at least one phenomenon caused by warming with respect to fruit trees (Fig. 1). This clearly demonstrated that the impacts of warming have spread across the entire country with respect to the fruit tree industry.
Fig. 1. Number of prefectures reporting at least one change in different
sectors of agricultural production caused by recent warming.
The survey suggested that recent warming trends have already
significantly affected nearly all types of fruit tree species, and the tree species can be classified into two types based on the responses of fruit development to recent warming (Fig. 2; Sugiura et al., 2007). The first group is the earlier developing type and the second is the prolonged development type.

THREE CLIMATE CHANGE ADAPTATION STRATEGIES FOR FRUIT PRODUCTION
280
Fig. 2. Tree species have been classified into two types based on the
responses of fruit development to recent warming trends.
The “earlier development” type includes those tree species in which both flowering and harvesting periods had accelerated; these include Japanese pears, peaches, and Japanese apricots. The “prolonged development” type includes those tree species in which the flowering period had accelerated, but not the harvesting period; this type includes apples, Japanese persimmons, grapes, and satsuma mandarins.
Phenological and physiological changes
The most important and common impact of warming on fruit trees is the delayed and poor coloring of fruit skin. Poor coloration reduces marketability. The normal development of the coloring of apples and grapes is brought about by the loss of chlorophyll and the synthesis of anthocyanins, and these processes occur rapidly under low-temperature conditions. We investigated the relationship between skin color and air temperature in grape production areas of 18 prefectures. When the mean air temperature during the 40 days before harvest date was ≥24°C, the skin color ratings (the higher the color rating, the stronger the coloration) of “Kyoho,” “Pione,” and “Suzuka” grape were significantly negatively correlated with air temperature (Sugiura et al., 2018). The skin color ratings decreased by about 1 unit per 1°C increase (Fig. 3). Temperatures of 25°C or lower are appropriate for the synthesis of anthocyanins in apples (Arakawa, 1991).

THREE CLIMATE CHANGE ADAPTATION STRATEGIES FOR FRUIT PRODUCTION
281
Fig. 3. The relationship between the skin color rating of “Kyoho” grape at
harvest and the mean air temperature during the 40 days before the
harvest date. Linear regression at air temperatures ≥24°C is shown.
A similar principle applies to carotenoid accumulation, which turns citrus
and Japanese persimmons yellow and bright red, respectively. Therefore, if temperatures increase due to global warming during the color development stage, the coloring of the fruit will be adversely affected.
If flowering accelerates as a result of warming, it can be expected that the harvest time will also accelerate. In reality, the harvest dates for Japanese pears, peaches, etc. are indeed tending to be earlier as a result of warming. However, among fruits, such as apples and Japanese persimmon, in which pigment development is an important indicator in determining the time of harvest, since high temperatures impede coloration, the harvest date remains unchanged even if the flowering date is accelerated. In such cases, the development period of the fruit, that is, the number of days from flowering to harvest, will actually increase. The harvesting period of fruit of the prolonged development type is often determined by the degree of coloring, so the delay in skin coloring under elevated temperatures is the reason why the harvesting period of this type has not accelerated.
Changes in fruit quality traits, such as fruit enlargement, peel puffing (Fig. 4), reduction of acid concentration, reduction of soluble tannin concentration of Japanese persimmon, softening of fruit flesh, and tendency to spoil rapidly, might all be associated with the increment in the fruit

THREE CLIMATE CHANGE ADAPTATION STRATEGIES FOR FRUIT PRODUCTION
282
development period. Therefore, most of these changes in fruit quality are more noticeable in the prolonged development type fruits than in the earlier development type fruits.
Based on records covering 30–40 years, we obtained evidence that the taste and textural attributes of apples have changed as a result of warming (Fig. 5; Sugiura et al., 2013). Decreases in acid concentration, fruit firmness, and watercore development were observed regardless of the maturity index used for the harvest date (e.g., calendar date, number of days after full bloom, peel color, and starch concentration); all such changes may have resulted from earlier blooming and higher temperatures during the maturation period. These results suggest that the qualities of apples on the market are undergoing long-term changes.
Fig. 4. Peel puffing in satsuma mandarin (left-hand picture). The right-hand
picture shows a normal fruit.
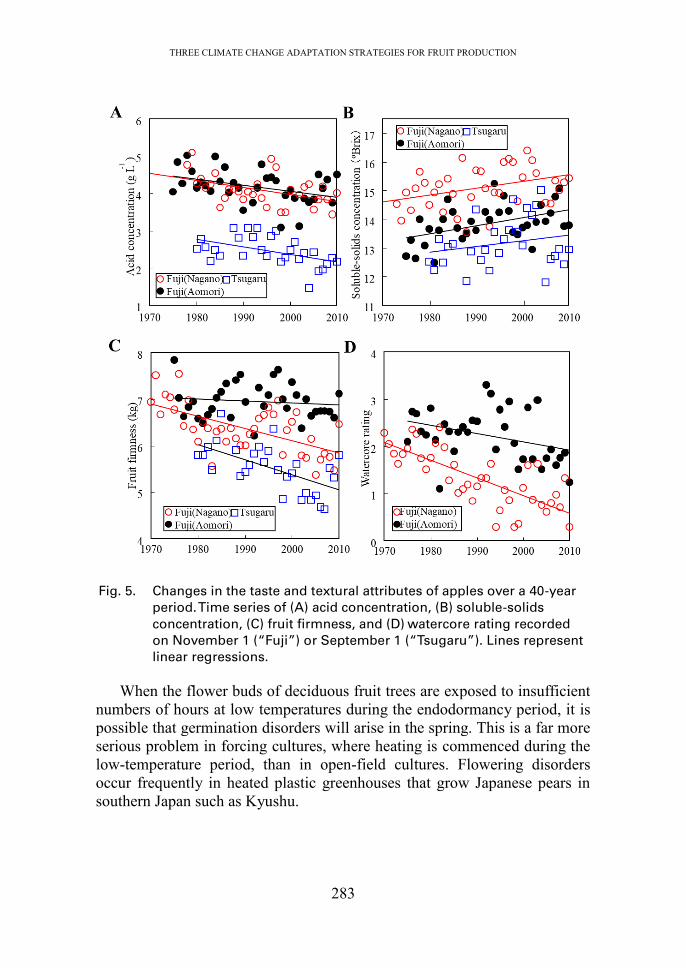
THREE CLIMATE CHANGE ADAPTATION STRATEGIES FOR FRUIT PRODUCTION
283
Fig. 5. Changes in the taste and textural attributes of apples over a 40-year
period. Time series of (A) acid concentration, (B) soluble-solids
concentration, (C) fruit firmness, and (D) watercore rating recorded
on November 1 (“Fuji”) or September 1 (“Tsugaru”). Lines represent
linear regressions.
When the flower buds of deciduous fruit trees are exposed to insufficient numbers of hours at low temperatures during the endodormancy period, it is possible that germination disorders will arise in the spring. This is a far more serious problem in forcing cultures, where heating is commenced during the low-temperature period, than in open-field cultures. Flowering disorders occur frequently in heated plastic greenhouses that grow Japanese pears in southern Japan such as Kyushu.

THREE CLIMATE CHANGE ADAPTATION STRATEGIES FOR FRUIT PRODUCTION
284
Meteorological disasters Warming also leads to meteorological disasters. Sunburn is a disorder where the skin of the fruit turns brown as a result of extremely high temperatures (Fig. 6). This symptom tends to occur in those parts of the fruit that are exposed to sunlight; however, the cause is associated more with a temperature increase rather than with the rays of sunlight. Those parts of the fruit that are exposed to the sun in the afternoon (west side) are more prone to scorching damage than those exposed during the morning when temperatures are lower.
Fig. 6. Sunburn of an apple (left-hand photo) and a citrus fruit (right-hand
photo).
Despite a dramatic increase in mild winters as a result of global warming, freezing damage, such as dead flower buds in Japanese pear (Ito et al., 2018) and winter-kill of young Japanese chestnut trees (Sakamoto et al., 2015a, 2015b), has increased in deciduous fruit trees. If temperatures remain high from fall to the start of winter, fruit trees are slow to acquire cold tolerance and struggle to attain their peak cold tolerance, making them prone to freezing damage when exposed to severe cold at the start of winter and during the midwinter season. In particular, cold tolerance cannot be acquired when defoliation is delayed and new tree tops is continuing to produce new leaves under relatively high temperatures. Even after peak cold tolerance has been attained, it can temporarily decline if warm temperatures subsequently occur for three or four days, thereby increasing the risk of freezing damage.
Since warming leads to an acceleration of the flowering period, if flowering occurs too early and the period from bud break to young fruit then

THREE CLIMATE CHANGE ADAPTATION STRATEGIES FOR FRUIT PRODUCTION
285
overlaps with the frost season, there is a higher incidence of frost damage and a potentially serious decrease in fruit production (Asakura et al., 2011).
ADAPTATION OF FRUIT TREES TO CLIMATE CHANGE
Our strategy to address climate change adaptation in fruit production is split into three stages. The stage 1 is adaptation measures using production technology to utilize the trees that are being cultivated now. Most of the adaptation measures currently being undertaken belong in this stage 1, which includes methods to avoid high temperatures and methods to increase high-temperature tolerance. The stage 2 of adaptation is replanting with cultivars that are better adapted to warming, and the stage 3 is to move the production areas.
Avoidance of high temperatures (stage 1) One method to reduce the temperature of fruit is to limit the amount of fruit exposure to sunlight. Methods to prevent sunburn include using shading materials (Fig. 7) or fruit bags with high shielding performance and having numerous shoots in order to block out direct sunlight, especially the west sun. Regarding citrus fruits, thinning (or removal) of fruit near the surface and near the top of trees is an effective method to prevent sunburn and peel puffing.
Fig. 7. Use of shading materials to prevent sunburn of fruit. The right picture
shows the material to avoid only the western sun.
By reducing the temperature of entire trees, it is also possible to reduce
the temperature of fruit. Among fruit species such as grapes that develop color before midsummer, the coloring period can be induced under low-temperature conditions by forcing cultivation in plastic greenhouses (Sugiura et al, 2019). This is an extremely effective technique to develop better color

THREE CLIMATE CHANGE ADAPTATION STRATEGIES FOR FRUIT PRODUCTION
286
in the berries. When trees are exposed to water stress, the stomata on fruits and leaves
close, causing an inhibition of transpiration; as a consequence, the latent heat of vaporization cannot be relieved, and the temperature of the fruit and the trees increases. Accordingly, it is important to irrigate the soil to prevent soil from drying during periods when there is risk of fruit sunburn. Tolerance of high temperatures (stage 1) The chemical structure of anthocyanins, which are the main pigments causing the red to black colors in fruits such as apples and grapes, include a short chain of sugar molecules, created by photosynthesis and that are stored in the fruit as sugars. Therefore, when there are a lot of photosynthates, such as after a sunny summer, this facilitates the synthesis of anthocyanins even if temperatures are high, making it easier for fruits to develop color. The amount of photosynthesis can be increased by laying reflective mulch under the fruit trees in fields to increase the amount of light striking the trees.
Increasing the amount of photosynthesis in trees is not easy. Another method to boost the sugar content of each fruit without increasing photosynthesis is to reduce the number (“thinning”) of fruits per tree. By doing this, photosynthate competition between fruits within a cluster is reduced, thereby resulting in increased sugar content in each fruit. Although this method entails some sacrifice in terms of yield, it is particularly effective in the case of grape.
Girdling (Fig. 8) is a technique to increase fruit coloration by boosting the photosynthates in fruits without reducing the number of fruits per tree (Yamane and Shibayama, 2006; Koshita et al., 2011). This technique entails peeling bark off the trunk before the fruit starts developing color. The photosynthates produced in leaves are distributed upward and downward to fruits, branches, trunks, and roots through phloem sieve tubes, which lie just beneath the bark. When girdling is carried out, because the sieve tubes in the phloem also peel off with the bark, the photosynthates produced in the leaves are not distributed to the lower parts of the peeled bark such as roots. By doing this, the amount of photosynthates distributed to the fruit is increased. The peeled bark recovers naturally in a few weeks and photosynthates can be sent to the roots once again.
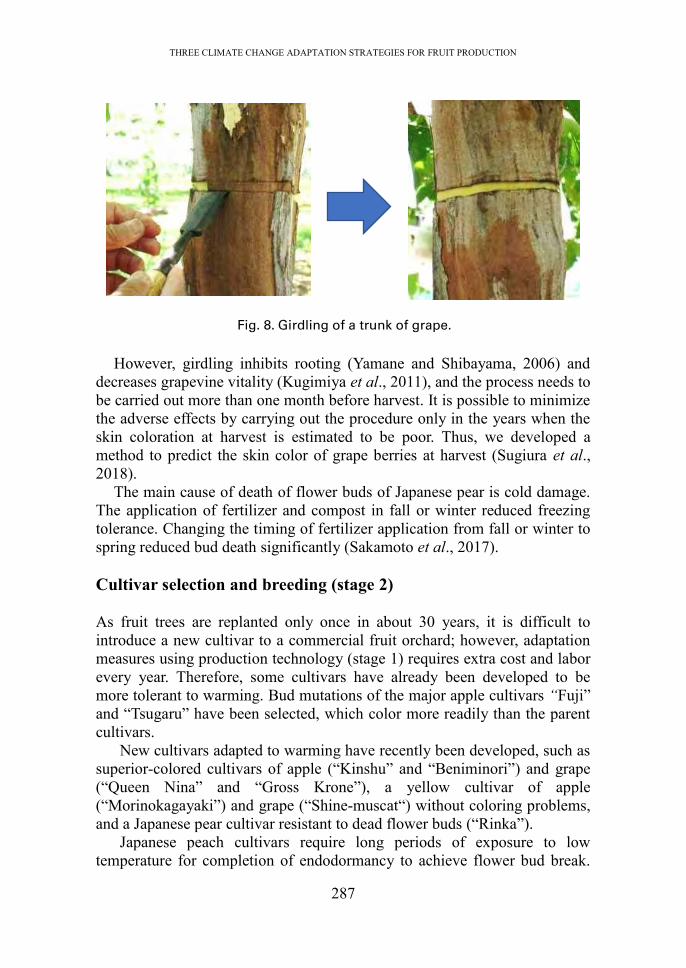
THREE CLIMATE CHANGE ADAPTATION STRATEGIES FOR FRUIT PRODUCTION
287
Fig. 8. Girdling of a trunk of grape.
However, girdling inhibits rooting (Yamane and Shibayama, 2006) and
decreases grapevine vitality (Kugimiya et al., 2011), and the process needs to be carried out more than one month before harvest. It is possible to minimize the adverse effects by carrying out the procedure only in the years when the skin coloration at harvest is estimated to be poor. Thus, we developed a method to predict the skin color of grape berries at harvest (Sugiura et al., 2018).
The main cause of death of flower buds of Japanese pear is cold damage. The application of fertilizer and compost in fall or winter reduced freezing tolerance. Changing the timing of fertilizer application from fall or winter to spring reduced bud death significantly (Sakamoto et al., 2017).
Cultivar selection and breeding (stage 2) As fruit trees are replanted only once in about 30 years, it is difficult to introduce a new cultivar to a commercial fruit orchard; however, adaptation measures using production technology (stage 1) requires extra cost and labor every year. Therefore, some cultivars have already been developed to be more tolerant to warming. Bud mutations of the major apple cultivars “Fuji” and “Tsugaru” have been selected, which color more readily than the parent cultivars.
New cultivars adapted to warming have recently been developed, such as superior-colored cultivars of apple (“Kinshu” and “Beniminori”) and grape (“Queen Nina” and “Gross Krone”), a yellow cultivar of apple (“Morinokagayaki”) and grape (“Shine-muscat“) without coloring problems, and a Japanese pear cultivar resistant to dead flower buds (“Rinka”).
Japanese peach cultivars require long periods of exposure to low temperature for completion of endodormancy to achieve flower bud break.

THREE CLIMATE CHANGE ADAPTATION STRATEGIES FOR FRUIT PRODUCTION
288
However, endodormancy completion of some foreign cultivars needs only a short chilling period. As these cultivars do not have such good quality as the Japanese cultivars, a peach cultivar combining a low chilling requirement with high fruit quality (“Sakuhime”; Sawamura et al., 2017) has been developed by crossing the foreign cultivar with Japanese cultivars.
New citrus cultivars, such as “Siranui,” “Setoka,” “Harehime,” and “Mihaya,” have good flavor and can also be peeled by hand like a satsuma mandarin. These have been developed by cross-breeding satsuma mandarin with oranges that are resistant to peel puffing and are better suited to higher temperatures.
Movement of production areas (stage 3)
Since fruit trees are vulnerable to the effects of climate change, there is a possibility that the areas suitable for fruit cultivation will change because of global warming. For the stage 3, the movement of production areas, we have created predictive maps showing future areas suitable for several fruit tree crops, for producers and local governments.
For example, most apple trees are currently cultivated in the northern part of the temperate zone in Japan, since they need to be planted in cold climates. The temperature ranges assumed to be appropriate for the cultivation of apple are 6–14°C in terms of annual mean temperatures. A database (Yokozawa et al., 2003) was used to simulate possible changes in favorable regions for the cultivation of apple, with approximately 10 × 10 km resolution.
The favorable regions to cultivate apples were predicted to gradually move northwards. Many parts of the current apple producing districts in Japan will possibly be unfavorable by the 2060s (Fig. 9; Sugiura and Yokozawa, 2004). Maps of future suitable areas were also developed for satsuma mandarins (Sugiura, 2016), which are the most common fruit trees in Japan, and for tankans (Sugiura et al., 2014), which are subtropical citrus fruits.
Satsuma mandarin is currently suitable for growing in the area along the Pacific Ocean side of eastern Japan and western Japan, but predicted climate change over the next 50 years means that this may move to the Japan Sea side of Honshu and the coastal area of south Tohoku. Coastal areas of the current satsuma mandarin–producing regions in Japan will then be suitable for tankan production by 2050 (Fig. 10).
For these reasons, planting of new fruit trees is progressing slowly. Peaches are being planted instead of apple in the northern part of Tohoku, while growers have succeeded in cultivating the subtropical fruit blood orange in place of satsuma mandarin in Ehime Prefecture. Fields of citrus

THREE CLIMATE CHANGE ADAPTATION STRATEGIES FOR FRUIT PRODUCTION
289
fruits, Japanese persimmons, and grapes, which are often cultivated on sloping land, are being relocated to higher altitudes in some places.
A
B
Fig. 9. Predicted change in the spatial distribution of regions suitable for
apple production under (A) current climate (1971–2000) and (B)
predicted climate in the 2060s.

THREE CLIMATE CHANGE ADAPTATION STRATEGIES FOR FRUIT PRODUCTION
290
Fig. 10. Predicted change in the spatial distribution of regions suitable for
tankan production under (A) current climate (1981–2000) and (B–D)
predicted climate in (B) 2011–2030, (C) 2031–2050, and (D) 2051–2070.
CONCLUSION
The impact of climate change on fruit trees has already become obvious. We have developed many adaptation measures, but it is considered that climate change will progress even further. Therefore, the development of adaptation measures needs to continue into the future.

THREE CLIMATE CHANGE ADAPTATION STRATEGIES FOR FRUIT PRODUCTION
291
REFERENCES Arakawa, O. 1991. Effect of temperature on anthocyanin accumulation in
apple fruit as affected by cultivar stage of fruit ripening and bagging. Journal of Horticultural Science 66:763–768.
Asakura, T., H. Sugiura, D. Sakamoto, T. Sugiura, and H. Gemma. 2011. Evaluation of frost risk in apple by modeling changes in critical temperatures with phenology. Acta Horticulturae 919:65–70.
IPCC. 2014. Summary for policymakers. In: Climate Change 2014. Impacts, Adaptation, and Vulnerability. Part A: Global and Sectoral Aspects. Contribution of Working Group II to the Fifth Assessment Report of the Intergovernmental Panel on Climate Change [eds. Field, C.B. et al.] Cambridge University Press, Cambridge, United Kingdom and New York, NY, USA, pp. 1-32.
Ito, A., T. Sakaue, O. Fujimaru, A. Iwatani, T. Ikeda, D. Sakamoto, T. Sugiura, and T. Moriguchi. 2018. Comparative phenology of dormant Japanese pear (Pyrus pyrifolia) flower buds: a possible cause of ‘flowering disorder’. Tree Physiology 38:825–839.
JMA (Japan Meteorological Agency). 2018. Climate change monitoring report 2017. JMA, Tokyo, Japan.
Koshita, Y., T. Yamane, H. Yakushiji, A. Azuma, and N. Mitani. 2011. Regulation of skin color in ‘Aki Queen’ grapes: Interactive effects of temperature, girdling, and leaf shading treatments on coloration and total soluble solids. Scientia Horticulturae 129:98–101.
Kugimiya, N., Y. Imai, S. Kawada, S. Kiyohara, and M. Ueyama. 2011. Methods for improving the coloration of the grape variety ‘Pione’. Bulletin of Oita Prefectural Agriculture, Forestry and Fisheries Research Center 1:89–101. (In Japanese with English abstract).
MAFF (Ministry of Agriculrure, Forestry and Fisheries). 2015. Climate Change Adaptations Plan of Ministry of Agriculrure, Forestry and Fisheries.
(http://www.maff.go.jp/j/kanbo/kankyo/seisaku/pdf/pdf/tekiou_eng.pdf, Accessed 1 January 2019)
Sakamoto, D., H. Inoue, and S. Kusaba. 2015. Effect of soil moisture conditions during the period from late autumn to early spring on the freezing tolerance of the Japanese chestnut (Castanea crenata Sieb. et Zucc.). Bulletin of the National Institute of Fruit Tree Science 20:21–28.
Sakamoto, D., H. Inoue, S. Kusaba, T. Sugiura, and T. Moriguchi. 2015. The effect of nitrogen supplementation by applying livestock waste compost on the freezing tolerance of Japanese chestnut. Horticulture Journal 84(4):314–322.
Sakamoto, D., K. Fujikawa, T. Sakaue, H. Inoue, A. Ito, T. Moriguchi, A.

THREE CLIMATE CHANGE ADAPTATION STRATEGIES FOR FRUIT PRODUCTION
292
Higashi, and T. Sugiura. 2017. Application of livestock waste compost as a source of nitrogen supplementation during the fall-winter season causes dead flower buds in Japanese pear 'Kosui'. Horticulture Journal 86(1):19–25.
Sawamura, Y., Y. Suesada, T. Sugiura, and H. Yaegaki. 2017. Chilling requirements and blooming dates of leading peach cultivars and a promising early maturing peach selection, Momo Tsukuba 127. Horticulture Journal 86(4):426–436.
Sugiura, T. 2016. Changes in locations suitable for satsuma mandarin and tankan cultivation due to global warming in Japan. Acta Horticulturae 1130:91–94.
Sugiura, T. and M. Yokozawa. 2004. Impact of global warming on environments for apple and satsuma mandarin production estimated from changes of the annual mean temperature. Journal of the Japanese Society for Horticultural Science 73:72-78. (In Japanese with English abstract)
Sugiura, T., H. Kuroda, and H. Sugiura. 2007. Influence of the current state of global warming on fruit tree growth in Japan. Horticultural Research Japan 6:257-263. (In Japanese with English summary).
Sugiura, T., H. Ogawa, N. Fukuda, and T. Moriguchi. 2013. Changes in the taste and textural attributes of apples in response to climate change. Scientific Reports 3:2418.
Sugiura, T., D. Sakamoto, Y. Koshita, H. Sugiura, and T. Asakura. 2014. Predicted changes in locations suitable for tankan cultivation due to global warming in Japan. Journal of the Japanese Society for Horticultural Science 83(2):117–121.
Sugiura, T., M. Shiraishi, S. Konno, and A. Sato. 2018. Prediction of skin coloration of grape berries from air temperature. Horticulture Journal 87:18–25.
Sugiura, T., M. Shiraishi, S. Konno, and A. Sato. 2019. Assessment of deterioration in skin color of table grape berries due to climate change and effects of two adaptation measures. Journal of Agricultural Meteorology 75(2): (DOI: 10.2480/agrmet.D-18-00032)
Sugiura, T. H. Sumida, S. Yokoyama, and H. Ono. 2012. Overview of recent effects of global warming on agricultural production in Japan. Japan Agricultural Research Quarterly (JARQ) 46(1):7–13.
Yamane, T. and K. Shibayama. 2006. Effect of trunk girdling and crop load levels on fruit quality and root elongation in ‘Aki Queen’ grapevines. Journal of the Japanese Society for Horticultural Science. 75:439–444.
Yokozawa M., S. Goto, Y. Hayashi, and H. Seino. 2003. Mesh climate change data for evaluating climate change impacts in Japan under gradually increasing atmospheric CO2 concentration. Journal of Agricultural Meteorology 59:117–130.

CLIMATE RISKS AND VULNERABILITY ASSESSMENT TOOLS IN SUPPORT OF POLICY PLANNING AND CLIMATE SMART AGRICULTURE
293
CLIMATE RISKS AND VULNERABILITY ASSESSMENT TOOLS IN SUPPORT OF POLICY
PLANNING AND CLIMATE SMART AGRICULTURE
Hideki Kanamaru1 and Mariko Fujisawa2
1Food and Agriculture Organization of the United Nations (FAO), Regional Office for Asia and the Pacific, Bangkok, Thailand
2FAO, Rome, Italy
E-mail: [email protected]
ABSTRACT Climate change will pose considerable risks to agriculture and food security in Asia and the Pacific Region. Strengthening resilience and enhancing carbon sinks are key priorities for agriculture. It is recognized that incremental adaptation will not be enough and transformational adaptation will be required in some agro-ecosystems — a transition to more resilient society, beyond a typical rural development project and one-time investment, with innovations made available to smallholder farmers. An important element to support transformational changes is building robust evidence about past and future climate risks and vulnerabilities, and identification and appraisal of adaptation practices. Climate change adaptation is a long-term iterative process from the farm to national levels, and it requires a robust evidence base to design investments and interventions. However, beyond assessments of the impacts of historical trends in climate variables and projected climate change on the yield of key crops, understanding of climate change risks for agriculture and food security in the Region is weak. Critical knowledge gaps that need to be addressed to craft effective responses, at various scales, to risks posed by climate change to agricultural systems in the Region are highlighted. Insufficient capacities of many countries and their experts to produce evidence are gaps to be addressed. There is a need for climate change risks and vulnerability assessment tools that can fill both knowledge and capacity gaps. FAO developed Modelling System for Agricultural Impacts of Climate Change (MOSAICC) for this purpose. It packages multiple models from different disciplines into one system where researchers can work in collaborative manner to assess climate change impacts in agriculture. MOSAICC is transferred to countries together with extensive training programs. It was successfully implemented in the

CLIMATE RISKS AND VULNERABILITY ASSESSMENT TOOLS IN SUPPORT OF POLICY PLANNING AND CLIMATE SMART AGRICULTURE
294
Philippines, Indonesia, Morocco, Peru, Paraguay, Uruguay, Malawi, and Zambia. In all these countries, an interdisciplinary technical working group was established where modelers, data providers, and policy makers together design the assessment study, run simulations, interpret results, and produce policy briefs. Efforts are made to link evidence from MOSAICC with major policy processes such as National Adaptation Plan by engaging relevant stakeholders early in the process and fostering enabling environment. There are high expectations for science community to translate research models and methodologies into practical risk and vulnerability assessment tools for decision making at the national and sub-national levels. There are opportunities for further strengthening collaboration between the academia and the development community. Keywords: Climate change, impacts, vulnerability, risks, adaptation,
agriculture, food security
INTRODUCTION
Climate change is affecting agriculture particularly in low latitudes. Around 2.5 billion small-scale farmers in developing countries are most vulnerable to climate change and their food security is at risk. According to the latest UN report, the number of food insecure people in the world has declined from 945 million in 2005 to 784 million in 2014. However the declining trend reversed since 2014, and the number of undernourished people reached an estimated 821 million in 2017 (FAO, 2018). Climate affects all dimensions of food security: food availability, food access, food utilization and food safety. Most researches focus on the relationship between climate and food availability — how much productivity is reduced (crop yields), how much cropping areas are changed, or how the number of crops grown within a year (cropping intensity) change, due to climate change. Food access may be impaired through food price increase and volatility, and income loss (due to reduced food production), following extreme weather events. Food utilization and food safety may be affected as climatic conditions can change the pattern of pests and diseases, or affect food storage and crop contamination. Climate variability and extremes are identified as one of the major causes behind the recent rise in global hunger. Among various climatic hazards, floods, droughts, storms, and extreme heat affect food production the most. Drought is estimated to be responsible for more than 80% of the total damage and losses in agriculture, particularly for livestock and crops. Impacts on fisheries are mostly from storms, while forestry impacts are mainly caused by floods and storms. Thirty-six percent of the countries with

CLIMATE RISKS AND VULNERABILITY ASSESSMENT TOOLS IN SUPPORT OF POLICY PLANNING AND CLIMATE SMART AGRICULTURE
295
a rise in undernourishment since 2005 experienced severe agricultural drought. There is also a strong link between drought and stunting (i.e. short height for age) in children. For example, droughts in Bangladesh are correlated with a higher stunting rate around five and nine months after the beginning of the drought event. In Zimbabwe, one to two year olds under drought effects have lower growth velocity than those with average rainfall.
GLOBAL AGENDAS
World leaders established major global agendas that frame the issue of climate change and agriculture over the past few years. The Sustainable Development Goals (SDGs), agreed in 2015 at the United Nations General Assembly, is a set of 17 global goals by 2030 towards achieving a better and more sustainable future for the world. SDG-2 aims to achieve zero hunger, and one of the indicators (2.4.11) under this second goal highlights climate change as an underlying challenge2. SDG-13 is about taking urgent action to combat climate change and its impacts, and it aims at strengthening resilience and adaptive capacity to climate-related hazards and natural disasters in all countries. One of the indicators (13.2.13) tracks the progress in integrating climate change measures into national policies, strategies and planning, “in a manner that does not threaten food production”. Both food security and climate change goals recognize the interlinked nature of the challenges. The Sendai Framework for Disaster Risk Reduction is a 15-year agreement (2015-2030) where the countries try to reduce disaster risk, with seven targets and four priorities for action. The primary objective is to substantially reduce "disaster risk and losses in lives, livelihoods and health and in the economic, physical, social, cultural and environmental assets of persons, businesses, communities and countries". Its target C aims to reduce direct disaster economic loss in relation to global GDP by 2030, and C2 particularly monitors direct agricultural loss attributed to disasters. On the longer-term climate change timescale, the Paris Agreement in 2015 aims to strengthen the world's commitment to reducing greenhouse gas
1Proportion of agricultural area under productive and sustainable agriculture. 2Target 2.4: By 2030, ensure sustainable food production systems and implement resilient agricultural
practices that increase productivity and production, that help maintain ecosystems, that strengthen capacity for adaptation to climate change, extreme weather, drought, flooding and other disasters and that progressively improve land and soil quality.
3Number of countries that have communicated the establishment or operationalization of an integrated policy/strategy/plan which increases their ability to adapt to the adverse impacts of climate change, and foster climate resilience and low greenhouse gas emissions development in a manner that does not threaten food production (including a national adaptation plan, nationally determined contribution, national communication, biennial update report or other).

CLIMATE RISKS AND VULNERABILITY ASSESSMENT TOOLS IN SUPPORT OF POLICY PLANNING AND CLIMATE SMART AGRICULTURE
296
emission to keep a global temperature increase below 2°C above pre-industrial levels, with an effort to limit it further to 1.5°C, and to strengthen the ability of countries to adapt to climate change "in a manner that does not threaten food production". Here, safeguarding food security is regarded as the fundamental priority, and "the particular vulnerabilities of food production systems to the adverse impacts of climate change" is recognized. All countries submitted (intended) nationally determined conditions (NDCs) where their climate actions to reduce national emissions and adapt to the impacts of climate change are defined. On the other hand, the National Adaptation Plan (NAP) processes, established in 2010 under the UNFCCC, are domestic planning processes where countries identify, address and review adaptation needs in order to adapt to climate change through medium- to long-term planning.
FOCUS ON ADAPTATION
There are many challenges for climate actions to materialize in the agriculture sector. Climate-smart agriculture is a concept that promotes mitigation and adaptation in the sector in support of achieving food security for all. A number of farm- to community-scale projects have already demonstrated farming practices that are better suited to changing climate conditions. It is imperative to scale up those climate-smart actions from project to regional and national level actions, while recognizing best climate-smart practices in one area may not be directly applicable to a neighboring area or larger surrounding areas due to their location- and context-specificity. In order to support scaling-up of climate-smart agriculture, climate finance should be made available, which meets the needs of a broad range of agricultural value chain actors that are involved from the farm to the final consumer. Climate-smart agriculture needs to be promoted while meeting transparency requirements for monitoring and verification. A mechanism for reporting progress in GHG reduction and sequestration and in adaptation, in a transparent manner, will be crucial for ensuring national and international climate goals are met.
Food and Agriculture Organization of the United Nations has been supporting countries with tackling climate change both for mitigation and adaptation. In FAO's analysis of NDCs, it was evident that strengthening resilience and enhancing carbon sinks are key priorities for agriculture in Asia-Pacific countries. Although not required, most countries chose to include an adaptation component in their NDC in addition to mitigation commitments. Most developing countries' share of greenhouse gas emissions is not significant but climate change affects everyone, regardless of emission levels, prompting timely adaptation actions.

CLIMATE RISKS AND VULNERABILITY ASSESSMENT TOOLS IN SUPPORT OF POLICY PLANNING AND CLIMATE SMART AGRICULTURE
297
It is recognized that incremental adaptation will not be enough and transformational adaptation will be required in some agro-ecosystems (Jones and Thornton, 2009; Kates et al., 2012). Incremental adaptation maintains the essence and integrity of a system or process at a given scale, while transformational adaptation changes the fundamental attributes of a system in anticipation of climate change and its impacts (IPCC, 2014). In the agriculture sector, improvements to crops (e.g. drought or flood tolerant variety) or on-farm management practices (e.g. irrigation timing and quantity, fertilizers, adjusting cropping calendars, use of weather forecast, seasonal climate forecast and agrometeorological advisories) can be considered as incremental adaptation. Transformational adaptation takes a variety of forms — switching crop types, shifting locations for producing certain crops and livestock, shifting farming systems new to an area, exploring alternative livelihood strategies, etc. (Rippke et al. 2016). Major climate finance mechanisms such as Green Climate Fund intend to support a paradigm shift to low-emission and climate-resilient development by promoting innovations that are catalytic to transformational changes. Transformational adaptation carries a long-term perspective, beyond typical time frame of disaster risk reduction in face of currently prevalent extreme weather events. Investments should have a multiplying effect of an initial financing, setting a path for climate-resilient and low-emission pathways. Innovative technologies need to be made accessible for smallholder farmers while improving food security.
There are several important elements that are necessary for supporting transformational adaptation, and are highly relevant to agrometeorological research. Designing transformational adaptation requires a robust climate rationale – information on climate risks and vulnerabilities of the agro-ecosystem. The climate rationale (evidence) at the local scale justifies the choice of adaptation options, and investments on adaptation interventions at the project level. Evidence at a larger spatial scale (sub-national to national) forms the basis for adaptation planning and policies at the national level. Climate change adaptation is a long-term iterative process — learning from lessons after projects and revising subsequent strategies to adapt better. Countries need to have capacities in the full cycle of the process, from producing evidence, planning policies, developing and implementing projects, and monitoring and evaluating the progress. Most of the evidence can be highly scientific but they need to be well linked with policy making process. Research agendas should be formulated in response to emerging policy-relevant questions, and the research results need to be channeled into decision making. These essential elements needed for transformational adaptation, with an emphasis on evidence and capacities, will be discussed in the following sections with examples from countries we worked in.

CLIMATE RISKS AND VULNERABILITY ASSESSMENT TOOLS IN SUPPORT OF POLICY PLANNING AND CLIMATE SMART AGRICULTURE
298
EVIDECE-BASED ADAPTATION
We identify five main types of evidence that facilitate evidence-based adaptation planning and decision making. The first is about what happened in the past — historical climate trends, including extreme weather events, and their impacts on agriculture. The second type of evidence is similar but for the future — projection of climate and its impacts on agriculture. Characterized risks and vulnerability to climate change and social and environmental factors is the third type of evidence. The fourth type of evidence is identification and appraisal of potential adaptation practices. They include on-farm trials, and desktop studies such as cost-benefit analysis and biophysical assessments. Lastly, implemented adaptation practices need to be monitored and evaluated to assess their effectiveness for the next iteration in the adaptation pathway. The complex nature of food security and climate change challenges complicates the process of producing these types of evidence. Sub-sectors of agriculture — crops, livestock, fisheries, aquaculture, and forest — are interlinked with each other in an agro-ecosystem. Much attention is paid to the production dimension of food security, but access to food, utilization and safety of food, and stability of food systems are equally important to ensure food security. The temporal scale for evidence varies from days (weather and agronomic practice), monthly, seasonal, yearly, decades, to a century (long-term climate projections). The spatial scale of relevance also varies from farm to national level. Looking at currently existing evidence, large knowledge gaps are apparent in Asia and the Pacific. FAO assessed papers cited in Chapter 7 (Food security and food production systems) of Working Group II contribution to the fifth assessment report of the IPCC (Porter et al. 2014), which deals mainly with the first three types of evidence. The majority of papers in the chapter about developing countries in the Region are for India and China, and the literature is scarce for the rest of the Region. Papers about crops are abundant but literature on other sub-sectors are noticeably lacking. Capacities of countries and their experts in producing evidence are insufficient, particularly in least developed countries. Even in middle income countries such as Indonesia and the Philippines, a lot of research are conducted by international scientists with only minimal involvement of local researchers. Most of climate risk assessment tools for producing evidence are developed as research tools to answer academic questions in their own discipline, and they are not designed for use by other researchers and for answering policy questions. There is a need for more climate risks and vulnerability assessment tools that address both gaps — knowledge

CLIMATE RISKS AND VULNERABILITY ASSESSMENT TOOLS IN SUPPORT OF POLICY PLANNING AND CLIMATE SMART AGRICULTURE
299
(evidence) and capacities.
MOSAICC
Objectives of the modelling system FAO developed a capacity development tool, Modelling System for Agricultural Impacts of Climate Change (MOSAICC), in an attempt to fill these gaps. It packages multiple models from different disciplines into one system where researchers can work in a collaborative manner to assess climate change impacts in agriculture. MOSAICC is transferred to countries together with extensive training programs. An innovative software design of MOSAICC supports participatory and integrated modelling environment in an interdisciplinary working group.
MOSAICC addresses common climate impacts on agriculture in an integrated way and in a modular system. Currently it combines five different components from diverse academic disciplines: statistical downscaling of climate change projections, yield simulation of crops, surface hydrology simulation, forest landscape model, and macroeconomic model.
All components of MOSAICC run on a server and exchange data through a central geospatial database. This system design brings together very different models that are usually run independently by separate groups of researchers. MOSAICC facilitates and fosters collaboration of researchers from different disciplines who tend to work only in their own domains. System design MOSAICC’s basic design was determined to meet the requirements elaborated in a series of consultations with international scientists and economists, and government officials.
The five main components of the models (Fig. 1) are: • Statistical methods for downscaling climate projections from General
Circulation Models (GCMs) • Crop growth models to simulate future crop yields • A hydrological model for estimating river water resources • A forest model to simulate biomass and tree species distributions • A CGE (Computable General Equilibrium) model to assess the effect
of changing yields and water availability on national economies
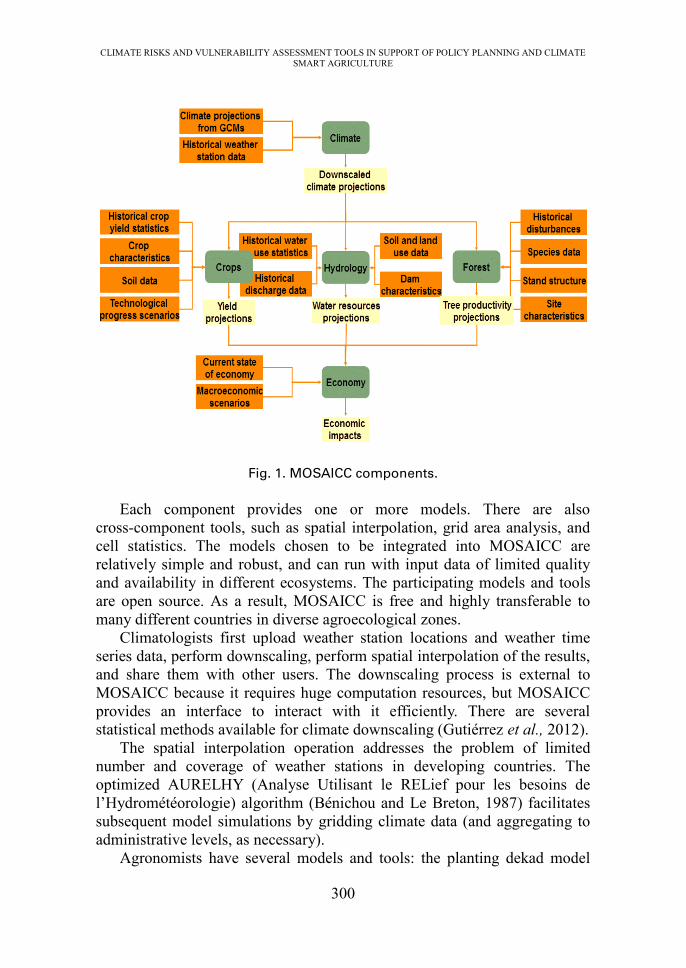
CLIMATE RISKS AND VULNERABILITY ASSESSMENT TOOLS IN SUPPORT OF POLICY PLANNING AND CLIMATE SMART AGRICULTURE
300
Fig. 1. MOSAICC components.
Each component provides one or more models. There are also
cross-component tools, such as spatial interpolation, grid area analysis, and cell statistics. The models chosen to be integrated into MOSAICC are relatively simple and robust, and can run with input data of limited quality and availability in different ecosystems. The participating models and tools are open source. As a result, MOSAICC is free and highly transferable to many different countries in diverse agroecological zones.
Climatologists first upload weather station locations and weather time series data, perform downscaling, perform spatial interpolation of the results, and share them with other users. The downscaling process is external to MOSAICC because it requires huge computation resources, but MOSAICC provides an interface to interact with it efficiently. There are several statistical methods available for climate downscaling (Gutiérrez et al., 2012).
The spatial interpolation operation addresses the problem of limited number and coverage of weather stations in developing countries. The optimized AURELHY (Analyse Utilisant le RELief pour les besoins de l’Hydrométéorologie) algorithm (Bénichou and Le Breton, 1987) facilitates subsequent model simulations by gridding climate data (and aggregating to administrative levels, as necessary).
Agronomists have several models and tools: the planting dekad model

CLIMATE RISKS AND VULNERABILITY ASSESSMENT TOOLS IN SUPPORT OF POLICY PLANNING AND CLIMATE SMART AGRICULTURE
301
(PLD) (Franquin, 1973), the water balance model (WABAL) (Frère and Popov, 1986), and the crop water productivity model (AQUACROP) (Steduto et al., 2009). AQUACROP simulates crop yield and is used usually in specific locations because it requires a number of data collected in the field. WABAL is a simpler model with limited requirements of input data and produces crop-specific water balance variables as outputs. The variables are used to construct statistical models to simulate crop yield. The WABAL approach is more suitable for assessments at larger spatial scale. Many different crops can be simulated as long as necessary data are available.
Hydrologists work with a model called STREAM (Spatial Tools for River Basins and Environment and Analysis of Management Options) (Aerts et al., 1999). It is a rainfall-runoff model that simulates discharges in river basins. The water availability is calculated at sub-basin level, depending on data availability.
For foresters, MOSAICC provides LANDIS (Landscape Disturbance and Succession) (Scheller and Mladenoff, 2004), which simulates forest succession, disturbance (including fire, wind, harvesting, insects), and seed dispersal across large landscapes. LANDIS requires a huge number of parameters. MOSAICC provides an interface to deal with all the details and re-arranges the information in required files. The results are post-processed to generate key variables: forest biomass, tree species distributions, biodiversity, establishments, forestry evolution, Leaf Area Index (LAI), and non-wood products.
Economists have the DCGE (Dynamic Computable General Equilibrium) model (Lofgren et al., 2002) to work with. It simulates the current and future economy under different climate projections. The model distinguishes the national economy and that of the rest of the world, between which goods and services are exchanged. The model uses crop yields and water availability generated by agronomists and hydrologists as shocks to the national economy. The main outputs are macro indicators (GDP), domestic market variables, external trade variables, and prices.
Key outputs of MOSAICC simulations are future projected values of these different variables simulated by each model. All the models can use the data generated from other models through a central geospatial database. The user works on MOSAICC with a web browser to connect to the MOSAICC server over the Internet. Data, models and results are all on the server. Nothing is required on the user’s computer. The systems installed in countries can be easily upgraded remotely by MOSAICC developers.

CLIMATE RISKS AND VULNERABILITY ASSESSMENT TOOLS IN SUPPORT OF POLICY PLANNING AND CLIMATE SMART AGRICULTURE
302
IMPLEMENTATION OF MOSAICC IN COUNTRIES Information needs and capacity assessments MOSAICC was successfully implemented in the Philippines, Indonesia, Morocco, Peru, Paraguay, Uruguay, Malawi, and Zambia. In order to ensure that local researchers use MOSAICC to produce information that are useful for stakeholders, we emphasize a country-driven process for implementing MOSAICC. A typical implementation of MOSAICC in a new country starts with a stocktaking exercise of existing information in the country about climate change impacts on agriculture. Once gaps in information availability become clear, national ministries are consulted as main stakeholders. They provide their views about needs for information about climate impacts in the sector for adaptation policies and programmes. In many cases, ministry of agriculture and its climate change office are the main stakeholders. They have responsibility for developing climate change adaptation policies and programmes. Information on potential climate change impacts support their work. For example, in Peru, the Ministry of Agriculture and Irrigation (MINAGRI) was identified as the main stakeholder and its Vice-minister chaired the steering committee of the project that implemented MOSAICC. Other ministries such as the Ministry of Environment were also consulted.
In parallel with information needs assessment, country's technical and institutional capacities in filling the gaps are assessed, across national research institutes and universities. In Peru, the National Meteorological and Hydrological Services, the National Agrarian University in La Molina, the Office of Economic and Statistical Studies in MINAGRI, were found to possess relevant knowledge and skills. Interdisciplinary technical working group If MOSAICC appears to address country's information and capacity gaps, we start forming an interdisciplinary technical working group that is composed typically of ministries, national research institutes, and universities, and the group is supervised by the project steering committee. The main members of the group are subject experts that will be responsible for running simulations with each component of MOSAICC. Climatologists in national weather service often take responsibility for climate component. National agricultural research institutes may take on crop simulations. The group also includes policy makers as a main stakeholder. They guide a climate change study as a member of the working group from study design to communication of the results. Other technical offices of the government can also provide necessary

CLIMATE RISKS AND VULNERABILITY ASSESSMENT TOOLS IN SUPPORT OF POLICY PLANNING AND CLIMATE SMART AGRICULTURE
303
data and expertise as a member of the group. The agencies mentioned in the previous section constituted the Peruvian technical working group. In the Philippines, the Department of Agriculture, Philippine Atmospheric, Geophysical and Astronomical Services Administration, Philippine Rice Research Institute, University of the Philippines – National Institute of Geological Sciences were the main members of the technical working group.
Data collection is a time-consuming process. MOSAICC requires relatively small amount of data as inputs to models, but data are often scattered across different offices, and not in a format suitable for computer processing. We also make sure that the data providers agree on sharing the data with all members of the technical working group so that a truly collaborative research is possible. Digital elevation model (DEM), land use, soil properties, weather data, hydrological data, crop yield statistics, and crop parameters are examples of data that are necessary for MOSAICC simulations.
As a next step, the technical working group agrees on the study objectives, study design (including time periods, target crops, study areas, basins, etc.), taking account of stakeholder needs and data availability. In the process, the group members have an opportunity to reflect on country’s context, and to build a common understanding about what would constitute a successful adaptation to climate change in the agriculture sector, and what kind of information MOSAICC should produce in support of achieving the goal.
The Philippines decided to examine climate change impacts up to mid-21st century. The climate statistical downscaling work is considered to complement dynamical downscaling work conducted in the past, and to provide up-to-date information with a new set of climate projections (CMIP5). Their MOSAICC crop and hydrology work were designed to highlight differentiated impacts of climate change in different locations across the whole country with a focus on rice and corn at the province level, and 24 river basins. Peru was interested in extending the projections up to the end of the 21st century, with a set of 29 crops at the region level, and 16 river basins that represent different agroecological systems.
Usually at least two Representative Concentration Pathways are examined (e.g. RCP 4.5 and RCP 8.5). Also at least three climatic models are evaluated in order to account for uncertainties from GCMs. The spatial scale for simulations is flexible, but MOSAICC’s system design and model choices are most appropriate for national-level studies with sub-national disaggregation. MOSAICC primarily deals with medium- to long-term climate change time scale, beyond 10 years. The downscaled climate projections are daily data so aggregation to any temporal scales (10-day, month, season, year, etc.) is possible, and changes in frequency and intensity

CLIMATE RISKS AND VULNERABILITY ASSESSMENT TOOLS IN SUPPORT OF POLICY PLANNING AND CLIMATE SMART AGRICULTURE
304
of extreme events, for example, can also be studied. Capacity development and simulations Capacity development is another important focus in our MOSAICC implementation strategy. Climate change adaptation planning is a long and iterative process that should be periodically reviewed with new evidence, science, and outcomes from adaptation interventions. The capacities of country experts to carry out science work that forms an evidence-base about climate impacts and adaptation are key to a sustainable policy planning process. We provide extensive training programs to the identified local experts for use of each component of MOSAICC. At least one week of training per component is usually provided. The sustainability of strengthened technical capacities of individual experts is ensured by commitment of all stakeholders represented in the interdisciplinary technical working group.
The idea is that country experts can perform simulations using their country's own data in support of national planning. The trainers, who are original developers of participating MOSAICC models, continue to provide technical support to make sure the experts can accomplish simulation studies, after training. It takes about three months (per component) for experts to perform simulations provided dedicated researchers are assigned to the task.
Communication of results Running simulations is only part of climate impact studies. The simulation results need to be analysed, interpreted, and visualized for stakeholders. They would inform policy makers of which areas / sub-sectors / crops / basins / forest species are more vulnerable than others are. The information would strengthen evidence-bases that support adaptation planning and allow strategic resource allocations, investment programmes, research and development, and prioritization of adaptation interventions.
The technical working group is tasked to make sure that the modellers can communicate the implications of model outputs to aid policy processes. Communication of the results can take a number of other forms: presentation in conferences, paper and electronic publications, and web site. MOSAICC is designed to publish results from the simulation server in a seamless manner as graphs/maps to the web server.
The work in the Philippines was presented in a national project conference hosted by the Department of Agriculture, with wide participation from other Departments, Climate Change Commission, research institutes, universities, international development agencies, NGOs, and media. The nation-wide assessment work was highly appreciated and forms a basis for National

CLIMATE RISKS AND VULNERABILITY ASSESSMENT TOOLS IN SUPPORT OF POLICY PLANNING AND CLIMATE SMART AGRICULTURE
305
Adaptation Plans in the agriculture sector, Philippine Development Plan, National Climate Change Action Plan, and other policy processes.
In the following section, we provide two case studies. The Paraguay case focuses more on scientific results while the Malawi case examines the country-driven implementation process.
CASE STUDIES
Paraguay Climate change impact assessment in the agriculture sector in Paraguay was conducted as part of the Analysis and Mapping of Impacts under Climate Change for Adaptation and Food Security (AMICAF) project. Climate downscaling in Paraguay was based on the historical meteorological information from 12 meteorological stations for the entire country. The historical reference time considered was 1981 to 2010. The models under analysis showed that a reduction in precipitation is expected for both time periods up to 2070, while temperatures (maximum and minimum) are expected to increase. The models showed a range of possible decrease in precipitation from 2.40% to 10.24% under RCP4.5 while a possible decrease in precipitation for RCP8.5 was 3.27 % to 15.92 %. Projected temperature increases are from 1.8 to 2.7°C (TMax) and 1.8 to 3.3°C (TMin) under the RCP4.5 and from 2.3 to 3.3°C (TMax) from 2.18 to 4°C (TMin) under the RCP8.5.
The impact assessment of climate change on crops included the analysis of historic yields and projected trends for the future. 8 crops were selected for this analysis: sugarcane, common beans, cassava, corn, wheat, soybean, irrigated rice and non-irrigated rice. The results showed great heterogeneity in terms of future impacts on the yield of crops at the department level due to climate change, with both increasing and decreasing projections for different departments/crops. For several crops, no significant differences between historical and expected future yields were reported, or different GCM projections lead to inconsistent results. Fig. 2. shows the result for cassava (“mandioca”). This crop, which is strongly associated with family small-scale agriculture, could significantly increase its yield in Alto Paraguay, Amambay, Canindeyú, Caazapá and Concepción departments. The yield increase was consistent in both scenarios (RCP4.5 and RCP8.5). Results for soybean were mostly heterogeneous, with significant decrease on future yields projected in Misiones (MPI model, RCP4.5), Alto Parana and Amambay departments (CANES model, RCP4.5 and RCP8.5). Upland and irrigated rice yields show a different behavior: the most affected by climate change is expected to be upland rice, with significant reduction in yields in the departments of Itapua

CLIMATE RISKS AND VULNERABILITY ASSESSMENT TOOLS IN SUPPORT OF POLICY PLANNING AND CLIMATE SMART AGRICULTURE
306
Fig. 2. Projected Cassava yield changes under RCP 4.5 and 8.5 for different
GCMs.
(red – decrease; green – increase; yellow – no significant changes) and Canindeyú. Irrigated rice shows instead positive changes in yields in the departments of Cordillera and Misiones, and negative for Paraguarí.
In summary, negative impacts of climate change are expected for sugarcane (in five departments), soybeans in three departments, and upland rice in two departments. Interestingly, cassava shows a positive impact of climate change on yields for approximately the same region for which

CLIMATE RISKS AND VULNERABILITY ASSESSMENT TOOLS IN SUPPORT OF POLICY PLANNING AND CLIMATE SMART AGRICULTURE
307
negative impact is observed for sugarcane. Common bean yields are expected to increase in three departments, and decrease in three other departments. We can conclude that higher climate change risks concern sugarcane, soybeans and upland rice, while wheat, maize and common beans show no significant changes, or both positive and negative changes. We can consider these crops as the most resilient, while cassava yields appear to mainly benefit from climate change effects. These Paraguay results are a good example of evidence that facilitates transformational adaptation planning with potential options such as shifting cultivating areas of key crops within a country. Malawi The Government of Malawi is committed to taking action to tackle food security and climate change challenges. Over the last two decades, Malawi has scaled up its efforts to identify vulnerabilities and related adaptation priorities, and to mainstream climate change adaptation into development and sectoral planning. The National Adaptation Plan process was launched in 2014 to provide medium- to long-term options for Malawi to address adaptation needs. In 2017, Malawi Growth and Development Strategy (MGDS) III was established to move the country to a sustainable development growth path. MDGS III recognizes that climate change has adverse impacts on the agriculture sector.
FAO began supporting the integration of the agriculture sectors into the Malawi NAP process in 2015. FAO is also a member of the NAP Core Team – the formal coordinating mechanism at national level, driving this process and reporting to the National Climate Change Technical Committee (NCCTP). A stocktaking exercise found that decisions at ministry level are reached without the backing of data and evidence, which make it difficult to monitor policies for success or failure. FAO supported the use of MOSAICC by domestic experts with the objective to incorporate a strong evidence base in policy making. In the 2015-2016 rainfall season Malawi was hit by a prolonged dry spell, and agriculture was severely affected by the drought. It was estimated that this season saw 12.4% decline from the 2014/15 season in overall food production, which was already down by about 30% (due to 2015 floods) compared to the 2013/14 season (Government of Malawi, 2016). These two extreme weather events together became a strong drive within the country to assess the impacts of climate change on agriculture.
Key national stakeholders are engaged at every stage in the MOSAICC process to ensure that the outputs exemplify local expertise and national priorities. By bringing together national experts from across institutions, participants in the process can prioritize activities taking the various

CLIMATE RISKS AND VULNERABILITY ASSESSMENT TOOLS IN SUPPORT OF POLICY PLANNING AND CLIMATE SMART AGRICULTURE
308
perspectives and objectives into consideration. Stakeholder engagement also ensures long-term sustainability and capacity development. Upon completion of the MOSAICC process, local experts have the capacity to repeat the exercises if new information (e.g. emission scenarios, updated data) becomes available or national adaptation goals change. Also the Parties to the UNFCCC are required to update National Communication every four years, which include the types of evidence that MOSIACC produces. In Malawi, key stakeholders involved are the Lilongwe University of Agriculture and Natural Resources, the Department of Climate Change and Meteorological Services, and the Departments of Agriculture Research Services, Agriculture Planning Services, and Irrigation and Water Development. MOSAICC is also used in the University as a training tool for students, who will be contributing to the relevant work in academia or in the ministries in the future.
Country ownership is prioritized in the implementation of MOSAICC. The process starts with the collection of data (meteorological, crop yield, etc.), a process that also acts as a stocktaking exercise to identify potential data gaps within the country. One of the issues encountered at this stage was that some of the meteorological data are not in digital format, and records on paper had to be digitized and manually entered into a database. Another issue was the lack of systematic recoding of crop planting dates, which required capacity and time to harmonize for use in any data processing activity.
Capacity building is a core element of MOSAICC and ensures that lessons learned in establishing a climate information system are sustainable. A computer server was provided to the country on which MOSAICC is installed. Trainings on each module of MOSAICC, IT maintenance, climate and crop were carried out. The trained experts were supported by FAO experts until the completion of simulations using MOSAICC and report writing. The final outputs of MOSAICC in Malawi include long-term climate projections downscaled to local level, and projected crop yields, for five major crops across eight districts up to 2070. The responsibility, management, and ownership of the data, tools and results remain in the country. The final results were presented to stakeholders in the final technical workshop. This workshop served as the opportunity for validation of the results by stakeholders, and the results were treated as the material to start discussion within and across the ministries. The stakeholders were mostly convinced of the results of the analysis, while they disagreed with some of the outputs. It was pointed out that several key management practices such as irrigation were not well considered, which resulted in misleading projections of crop productions in the future. The Department of Agriculture Irrigation and Water Development particularly showed a great interest in the simulation outputs, as the results may directly affect their plan for selecting the location of new irrigation systems in the very near future.

CLIMATE RISKS AND VULNERABILITY ASSESSMENT TOOLS IN SUPPORT OF POLICY PLANNING AND CLIMATE SMART AGRICULTURE
309
Currently Malawian team is in the process to finalize the technical report and disseminate their results to relevant stakeholders including several ministries, reflecting the discussion at the final technical workshop. With various degree of agreement due to spatial aggregation and future projections range, they were able to identify consistency in climate projections in specific areas, crops particularly sensitive (or insensitive) to this change, or areas particularly impacted for most of the crops, for instance. The nation-wide information, directly related to policy relevant administrative boundaries, provides a new basis for improving adaptation measures (e.g. new crops of relevance, irrigation option) for the government.
Several important lessons were learned in the implementation process. Participating experts referred to the lack of human resources within the ministries as a limiting factor in maintaining momentum to complete the MOSAICC process. Strong encouragement of the team leader and senior management of the ministries to push the process forward is necessary to successfully coordinate the various components and to keep the experts engaged throughout. The final objectives and key milestones should be clearly laid out to incentivize the work. The utility of learning these models and the transferability of the skills gained should be clear to the experts as additional motivations to be involved in MOSAICC exercises.
CONCLUSION
Agriculture is widely recognized as one of the most vulnerable sectors to climate change, and it requires urgent action, from the farm to global level. Global agendas that frame the challenges are in place – Sustainable Development Goals, Sendai Framework for Disaster Risk Reduction, and Paris Agreement. Scaling up measures for climate-smart agriculture, and particularly adaptation actions are important in the agriculture sector for many developing countries. In view of promoting transformational adaptation, critical knowledge and capacity gaps have been identified in Asia-Pacific countries – lack of policy-relevant information on evidence about climate risks and vulnerability in agriculture (and its sub-sectors) at the right spatial and temporal scales; and limited capacities to produce evidence in the country and to link them with policies.
Modelling System for Agricultural Impacts of Climate Change (MOSAICC) has been developed and transferred to countries to address the gaps. This in-country, simple, robust and modular nature of the platform makes it a useful and accessible tool for nation-wide, nation-relevant, collaborative and integrated assessment. This approach contributes to building more sustainable institutional capacities within countries, hence improving ownership, relevance and uptake of the assessment. The trained national
CLIMATE RISKS AND VULNERABILITY ASSESSMENT TOOLS IN SUPPORT OF POLICY PLANNING AND CLIMATE SMART AGRICULTURE
310
experts can further promote the agricultural planning and policy based on the evidence-base. It also enables national actors to periodically and independently revisit climate change information in response to new science and evidence. The locally developed evidence that is relevant to national context supports policy discussions at the national level. The assessment, conducted by the national experts, serves as a basis and a trigger for inter-ministerial discussions. This brings relevant ministries to the same table, and through stakeholder and expert validations, the outputs of the analysis are reviewed and reflected in adaptation planning.
The involvement of the governmental people brings another benefit: promotion of evidence-based adaptation within the community of practice. They attend regional and international workshops on climate change adaptation frequently, and exchange information with other countries. A successful experience of a country in implementing agricultural policies based on robust evidence motivates other countries to do so in their own country too. South-south cooperation has also been facilitated by FAO between Philippines and Indonesia, and Peru and Paraguay, where the lessons learned in one country are communicated to the other, resulting in successful implementation.
Although not discussed in this paper, FAO is also developing a tool to analyze daily weather observation data, from agronomic point of view, in terms of intensity and frequency of extreme weather events, with dozens of indices defined for crop-specific agronomic seasons. The tool facilitates visualization of the trends in the weather indices with ability to set user-defined thresholds for extremes. The philosophy for the agronomic weather indices is the same as MOSAICC — easy-to-use, policy-relevant, decision-making and capacity development tool, in support of adaptation planning.
There are high expectations for science community to contribute to the climate change and agriculture agenda by making scientific information available to national policy making process, and by making tools more accessible to the global community of adaptation practitioners. Models and methodologies originally developed for research can be translated into practical tools for decision making. More application-oriented research can be designed which may influence national and sub-national policies and actions. The adaptation community, with un-biased assistance from scientists, will be able to make an informed decision about how to produce evidence — choice of tools and requirement of data. A guidance on selection of tools is particularly important because any tool is developed for specific purposes and for answering certain types of questions, and there is no one single best tool. However it is difficult for practitioners to understand the differences in characteristics of tools. A neutral forum where scientists and adaptation

CLIMATE RISKS AND VULNERABILITY ASSESSMENT TOOLS IN SUPPORT OF POLICY PLANNING AND CLIMATE SMART AGRICULTURE
311
community can exchange information for advancing climate change risks and vulnerability assessment will be highly useful. There are opportunities for further strengthening collaboration between the academia and the development community in the work of climate risks, vulnerability and adaptation assessment.
REFERENCES Aerts, J.C.J.H., M. Kriek, and M. Schepel. 1999. STREAM, spatial tools for
river basins and environment and analysis of management options: set up and requirements, Physics and Chemistry of the Earth, Part B: Hydrology, Oceans and Atmosphere, 24, 591-595.
Bénichou, P., and O.A. Le Breton. 1987. AURELHY: Une méthode d’analyse utilisant le relief pour les besoins de l’hydrométéorologie. Journées Hydrologiques de l’ORSTOM à Montpellier, 2, 299–304.
FAO, IFAD, UNICEF, WFP and WHO. 2018. The State of Food Security and Nutrition in the World 2018. Building climate resilience for food security and nutrition. Rome, FAO.
Franquin, P. 1973. Analyse agroclimatique en régions tropicales. Méthode des intersections et période fréquentielle de végétation. Agronomie tropicale, 28, 665-682.
Frère, M. and G.F. Popov. 1986. Early Agrometeorological crop yield forecasting. FAO Plant Production and Protection, FAO, Paper No 73. , 150.
Government of Malawi. 2016. Malawi drought 2015-16 post-disaster needs assessment (PDNA).
Gutiérrez, J.M., D. San-Martín, A.S. Cofiño, S. Herrera, R. Manzanas, and M.D. Frías. 2012. User Guide of the ENSEMBLES Downscaling Portal. Version 3. Technical Note 2/2012, Santander Meteorology Group, Spain.
IPCC. 2014. Annex II Glossary. In: Climate Change 2014: Impacts, Adaptation, and Vulnerability. Part A: Global and Sectoral Aspects. Contribution of Working Group II to the Fifth Assessment Report of the Intergovernmental Panel on Climate Change [Field, C.B., V.R. Barros, D.J. Dokken, K.J. Mach, M.D. Mastrandrea, T.E. Bilir, M. Chatterjee, K.L. Ebi, Y.O. Estrada, R.C. Genova, B. Girma, E.S. Kissel, A.N. Levy, S. MacCracken, P.R. Mastrandrea, and L.L.White (eds.)]. Cambridge University Press, Cambridge, United Kingdom and New York, NY, USA, pp. 485-533.
Jones, P.G. and P.K. Thornton. 2009. Croppers to livestock keepers: livelihood transitions to 2050 in Africa due to climate change. Environmental Science & Policy, 12, 427-437.
Kates, R.W., W.R. Travis, and T.J. Wilbanks. 2012. Transformational

CLIMATE RISKS AND VULNERABILITY ASSESSMENT TOOLS IN SUPPORT OF POLICY PLANNING AND CLIMATE SMART AGRICULTURE
312
adaptation when incremental adaptation to climate change are insufficient. Proceedings of the National Academy of Sciences of the USA, 109, 7156-7161.
Lofgren, H., M. Thomas, and M. El-Said, 2002, A Standard Computable General Equilibrium (CGE) Model in GAMS, A Standard Computable General Equilibrium (CGE) Model in GAMS, International Food Policy Research Institute 5, International Food Policy Research Institute.
Porter, J.R., L. Xie, A.J. Challinor, K. Cochrane, S.M. Howden, M.M. Iqbal, D.B. Lobell, and M.I. Travasso. 2014. Food security and food production systems. In: Climate Change 2014: Impacts, Adaptation, and Vulnerability. Part A: Global and Sectoral Aspects. Contribution of Working Group II to the Fifth Assessment Report of the Intergovernmental Panel on Climate Change [Field, C.B., V.R. Barros, D.J. Dokken, K.J. Mach, M.D. Mastrandrea, T.E. Bilir, M. Chatterjee, K.L. Ebi, Y.O. Estrada, R.C. Genova, B. Girma, E.S. Kissel, A.N. Levy, S. MacCracken, P.R. Mastrandrea, and L.L.White (eds.)]. Cambridge University Press, Cambridge, United Kingdom and New York, NY, USA, pp. 485-533.
Rippke, U., J. Ramirez-Villegas, A. Jarvis, S. Vermeulen, L. Parker, F. Mer, B. Diekkruger, A.J. Challinor, and M. Howden. 2016. Timescales of transformational climate change adaptation in sub-Saharan African agriculture. Nature Climate Change 6. DOI:10.10387/NCLIMATE2947.
Scheller, R.M. and D.J. Mladenoff. 2004. A forest growth and biomass module for a landscape simulation model, LANDIS: Design, validation, and application, Ecological Modelling, 180, 211-229.
Steduto, P., et al. 2009. AquaCrop -The FAO crop model to simulate yield response to water: I. Concepts and underlying principles, Agronomy Journal, 101.3, 426-437.

1-KM GRID METEOROLOGICAL DATA SERVICE AND ITS USE TO REDUCE WEATHER AND CLIMATE RISKS IN FIELD CROP PRODUCTION
313
1-KM GRID METEOROLOGICAL DATA SERVICE AND ITS USE TO REDUCE WEATHER AND CLIMATE
RISKS IN FIELD CROP PRODUCTION
Hiroyuki Ohno and Kaori Sasaki
Institute for Agro-Environmental Sciences, National Agriculture
and Food Research Organization (NARO), Tsukuba, Japan
E-mail: [email protected]
ABSTRACT
Agriculture in Japan currently faces two major challenges: climate change, with effects on crop yield and quality, and a shrinking working population, as older farmers leave the industry leading to consolidation of farms. In an attempt to resolve these issues, we have developed a meteorological data service that provides daily meteorological data and covers the entire country in a 1-km grid. This dataset comprises 13 different meteorological elements, including daily mean air temperature, daily accumulated global solar radiation, daily mean humidity, and snow water equivalent. The dataset spans from 1980 (or 2008 for some elements) to one year after the day on which a user utilizes the dataset (hereinafter referred to as “today”). For all days before today, the dataset provides observed values. For today and for up to 26 days later, the dataset provides predicted values. From 27 days after today, the dataset provides climatological normal values, mean values for the past 30 years. The dataset is updated daily based on the latest weather forecast. The dataset has a unique distribution system that allows registered users to procure required data via an application program on demand. Combining accurate crop development predictions using this dataset with existing techniques and knowledge regarding crop responses to meteorological stress may reduce damage caused by stress as well as mitigate meteorological and climatic risks in farming by applying crop management techniques that anticipate weather changes and that take countermeasures into account. Keywords: Grid square, weather forecast, crop management, climate
change scenario, web-API

1-KM GRID METEOROLOGICAL DATA SERVICE AND ITS USE TO REDUCE WEATHER AND CLIMATE RISKS IN FIELD CROP PRODUCTION
314
INTRODUCTION
Climate change is impacting agriculture in Japan. The latest statistical data show that the mean air temperature is increasing by 1.19°C per 100 years and that the number of days with a daily minimum temperature of ≥25°C significantly increases at a rate of 17 days per 100 years (Japan Meteorological Agency 2017). Due to these high temperatures, paddy rice, which is a staple element of diet in Japan, is more likely to form a chalky grain. Chalky grain is an issue that is prevalent throughout the nation. In 2010, a year that experienced extremely high air temperatures, Niigata Prefecture, which is a well-known for producing paddy rice of excellent flavor, experienced a significant decrease in the proportion of rice classified as 1st class, with only 20.3% of the rice produced in the prefecture being graded 1st class (Ministry of Agriculture, Forestry and Fishery 2011). This decrease in rice quality greatly shocked all stakeholders. Similarly, fruit production was affected by an increasing number of weather-related problems, including poor skin color of apples and grapes, peel puffing of Satsuma mandarins, and fruit flesh disorders in Japanese pears and peaches. In addition, dead flower buds of Japanese pears and freezing injury to Japanese chestnuts due to reduced freezing tolerance have also been reported (Sugiura et al. 2012). Applying crop management, which minimizes damage to crops caused by high temperatures in real-time or in advance using weather forecasts is one of the most efficient measures to adapt agriculture to climate changes, as well as introducing heat tolerant cultivars and revising cultivation periods. Another issue that agriculture in Japan faces is the declining working population due to an increasing aging population, particularly in the agricultural sector (MAFF 2018) As farmers give up agriculture, most farmlands become consolidated; these consolidated farmlands are then operated by locally active farmers or farming operation entities, the so-called ninaite farmers. As most consolidated farmlands are small in size, many ninaite farmers cultivate in numerous small but scattered fields. To efficiently farm such fields, leveling of demand (machinery and workforce) are more important than introducing large machinery. To realize this leveling, utilizing meteorological data is critical as it allows farmers to accurately predict the growth of diverse crops. To face these challenges facing Japanese agriculture, namely climate change and a shrinking workforce, it is necessary to develop advanced and sophisticated crop management technologies that utilize meteorological data. For practical implementation by farmers, such management technologies must (1) employ timely meteorological data that spans the entire country, (2) provide long-term data so that farmers can understand which areas are
1-KM GRID METEOROLOGICAL DATA SERVICE AND ITS USE TO REDUCE WEATHER AND CLIMATE RISKS IN FIELD CROP PRODUCTION
315
suitable for cultivation of particular crops, (3) model the times of future harvests, and (4) incorporate weather forecasts that effectively anticipate abnormal weather conditions. Given this need, the National Agricultural Research Organization (NARO) has developed a new crop management-supporting technology that utilizes meteorological information in a sophisticated manner and a meteorological data service system that facilitates use of technology.
1-KM GRID METEOROLOGICAL DATA SERVICE NARO has been tackling the challenges facing Japanese agriculture using a multi-faceted approach. Firstly, technologies are being developed to handle problems such as reduced crop yields and poor crop quality due to high temperatures. Secondly, techniques are being established to combine different types of crop, varieties, and cultivation periods in a complex manner. As a part of such efforts, we have been developing a meteorological data system, called the Agro-Meteorological Grid Square Data (AMGSD) System, which can meet the high-specification demands from these technologies and techniques. AMGSD System can generate and deliver daily meteorological data, including weather forecast data (Ohno 2014). The AMGSD
AMGSD is a set of daily meteorological data spanning the period from January 1, 1980, to December 31 of the year after AMGSD is used. Hereinafter, the use day of AMGSD is called “today”. AMGSD covers all of Japan with a grid square size of 30 arc s of longitude × 45 arc s of latitude (about 1 km × 1 km). Data for the period from 1 January 1980 (or partial data for some elements from 1 January 2008) to the day before today is created based on meteorological observations conducted at approximately 1300 points. Data for the period from today to nine days in the future are created based on forecasted values, while data for the period from 10 days after today to up to 26 days after today are created based on long-term forecast guidance. For the period from 27 days after today and beyond, data are based on daily climatological normal values. AMGSD is updated daily to reflect the latest observed and predicted values (Ohno et al. 2016). In this way, AMGSD is a dynamic dataset that includes weather forecasts. Both the observed and forecast data published by the Japan Meteorological Agency (JMA) are used to update AMGSD. Table 1 shows the data resources used to generate AMGSD. Fig. 1 shows the procedures to create the data for AMGSD using the observed and predicted values provided by JMA. AMGSD is composed of 13 meteorological elements (Table 2). It

1-KM GRID METEOROLOGICAL DATA SERVICE AND ITS USE TO REDUCE WEATHER AND CLIMATE RISKS IN FIELD CROP PRODUCTION
316
includes not only data that are commonly used for crop management, such as air temperature, precipitation, and sunshine duration, but also humidity, solar radiation, atmospheric radiation, and snow water equivalent data. Atmospheric radiation data can be effectively used to predict frost damage and snow water equivalent data can be used as an indicator to predict snow damage to agricultural facilities in the winter. It also includes all meteorological elements that are necessary to calculate the heat budget of the land surface, allowing users to estimate the water temperature of paddy fields with the aero-dynamical method. AMGSD is a unique dataset because it provides long-term data (approximately 40 years) that includes weather forecasts and a variety of meteorological elements (13 elements) in a fine-grid size (1-km grid). Table 1. Japan Meteorological Agency (JMA) meteorological products used
to generate Agro–Meteorological Grid Square Data (AMGSD)
Name of Data Abbreviation Overview
Automated
Meteorological Data
Acquisition System
AMeDAS Land weather observation network
operated by JMA. Approximately
1,300 observational devices/facilities
are located throughout Japan.
Grid Point Value of
the Meso Scale
Model
MSM-GPV The MSM model covers the area
around Japan on an approximately
5-km grid and predicts up to 1.5 days
(39 h) in the future.
Grid Point Value of
JMA Global Spectral
Model (Japan area)
GSM-GPV The GSM model covers the globe on
an approximately 20-km grid and
predicts up to 11 days in the future.
The guidance for
1-month forecast
Guidance The guidance is based on the result of
the long-range forecast edition of
GSM, predicting the deviation from
the climatological normal value by an
area up to 4 weeks in the future.

1-KM GRID METEOROLOGICAL DATA SERVICE AND ITS USE TO REDUCE WEATHER AND CLIMATE RISKS IN FIELD CROP PRODUCTION
317
Fig. 1. Process to generate Agro–Meteorological Grid Square Data (AMGSD).

1-KM GRID METEOROLOGICAL DATA SERVICE AND ITS USE TO REDUCE WEATHER AND CLIMATE RISKS IN FIELD CROP PRODUCTION
318
Table 2. Meteorological elements included in Agro–Meteorological Grid Square
Data (AMGSD) and terms available for each element
Meteorological
parameters
Time domain of the data
Observation-based
values
Forecasting-based
values
Climatological
normal values
Mean air
temperature
1/1/1980–
*yesterday
*today–26 days in
the future
27 days in the
future–end of the
next year
Maximum air
temperature
1/1/1980–yesterday today–26 days in
the future
27 days in the
future–end of the
next year
Minimum air
temperature
1/1/1980–yesterday today–26 days in
the future
27 days in the
future –end of the
next year
Total
precipitation
1/1/1980–yesterday today–26 days in
the future
27 days in the
future–end of the
next year
Occurrence of
>1 mm
precipitation
1/1/1980–yesterday today–9 days
in the future
8 days in the
future–end of the
next year
Sunshine
duration
1/1/1980–yesterday not available 8 days in the
future–end of the
next year
Global solar
radiation
1/1/1980–yesterday not available today–end of the
next year
Atmospheric
radiation
1/1/2008–yesterday today–9 days
in the future
not available
Mean relative
humidity
1/1/2008–yesterday today–9 days
in the future
not available
Mean wind
speed
1/1/2008–yesterday today–9 days
in the future
not available
Snow depth 1/10/1980–
yesterday
today–9 days
in the future
not available
Deposited
snow water
equivalent
1/10/1980–
yesterday
today–9 days
in the future
not available
Newly fallen
snow water
equivalent
1/10/1980–
yesterday
today–9 days
in the future
not available
*“Today” corresponds to the day on which AMGSD is used, whereas “Yesterday” corresponds to the day before
“today”

1-KM GRID METEOROLOGICAL DATA SERVICE AND ITS USE TO REDUCE WEATHER AND CLIMATE RISKS IN FIELD CROP PRODUCTION
319
Data delivery service In most cases, meteorological data services provide their own websites, which users visit, and select and download the desired data via CSV or another format. In most cases, the data obtained from such servers are provided by month or year in separate files. If a user needs data for a different range (e.g., over three months), he or she must download a file multiple times to obtain the desired range. The geographical unit is similarly divided. Furthermore, data downloaded from such servers is already named. Users who process the obtained data must refer to the given file name in the intended application or program. Repeating such procedures is extremely inefficient because meteorological data are renewed daily and users who use meteorological data by converting them into agricultural data through defined procedures have to repeatedly perform the conversion processes. In contrast, our data service system delivers AMGSD to the user via a dedicated server. AMGSDS can respond to requests from application programs (e.g., spreadsheet software and programming languages) and provide the data needed on demand. Considering that the working population in agriculture is not always familiar with computer programming, we offer two support measures for users to obtain data from AMGSDS. One is the provision of a Microsoft Excel workbook, which is dedicated to obtaining data from AMGSDS. This Excel workbook incorporates a Visual Basic for Applications (VBA) program. When a user inputs the desired latitude, longitude, year, and meteorological elements and then clicks the Submit button, the VBA program communicates with AMGSDS and writes the requested data in the stipulated cells (Fig. 2). If a user adds any function that refers to cells with meteorological data, just clicking the Submit button of this Excel workbook provides meteorological data based on the latest predicted and processed data. Another support measure is the provision of a Python Library. Python is a powerful programming language, which is user-friendly for those who are not familiar with programming. We have developed a function that acquires the needed data by communicating with AMGSDS as well as a function that visualizes the calculation results. We have compiled these and other functions into a library, called a Python Library. This Library is provided for public users. When a user develops a program to process meteorological data using this Library, he or she can obtain the calculation results based on the latest meteorological prediction only by executing this program (Fig. 3).

1-KM GRID METEOROLOGICAL DATA SERVICE AND ITS USE TO REDUCE WEATHER AND CLIMATE RISKS IN FIELD CROP PRODUCTION
320
Fig. 2. Microsoft Excel workbook that facilitates obtaining data from Agro–
Meteorological Grid Square Data provided by the National Agricultural
Research Organization.

1-KM GRID METEOROLOGICAL DATA SERVICE AND ITS USE TO REDUCE WEATHER AND CLIMATE RISKS IN FIELD CROP PRODUCTION
321
Fig. 3. Distribution of the accumulated air temperature in the Hokkaido area
of Japan from June to August 2017 created using a Python program
(left). The Python program was used to create the distribution figure
(right). With the Library, only 11-line scripts (excluding comment
lines) complete the necessary calculation and visualization.

1-KM GRID METEOROLOGICAL DATA SERVICE AND ITS USE TO REDUCE WEATHER AND CLIMATE RISKS IN FIELD CROP PRODUCTION
322
In a real agricultural setting, data, including weather forecasts, should be kept up-to-date. However, research and development on how to utilize meteorological data, and evaluation of the impacts of the utilization of forecast data as well as its efficacy are important as well. The evaluation process requires that the forecast data from a previous time be reproduced. To meet such demands, as part of the daily update, we compress and archive AMGSD. For users who need to reproduce data previously obtained from the service, we send them the relevant archived files offline and a Python program to extract these files, which reproduces AMGSD on the users’ hard disks. As the data acquisition function provided by the Python Library can easily change the destination of the data source, users can execute programs developed for practical farming purposes with the reproduced data by changing the destination of the function from the data server to their local disks. The Climate Change Scenario Grid Square Data (CCSGSD) In addition to AMGSD, we have developed the CCSGSD, which is delivered by AMGSDS. CCSGSD is a set of daily meteorological data for the period from 1981 to 2005 (current climate) and from 2006 to 2055 (predicted future climate). Currently, CCSGSD consists of four datasets, which are created from four climate change evaluations which, in turn, are based on two models (MIROC-5 and MRI-CGCM3) and two scenarios (RCP2.6 and RCP8.5). Each dataset is composed of six meteorological elements, namely daily air temperature, daily maximum air temperature, minimum air temperature, precipitation, global solar radiation, and relative humidity.
USE OF DATA TO REDUCE WEATHER AND CLIMATE RISKS AMGSDS has facilitated the utilization of meteorological data, including diverse meteorological elements, at arbitrary locations and for arbitrary periods. Furthermore, AMGSDS has improved the accuracy of agricultural predictions based on meteorological information, because it contains weather forecast data. Effect of weather forecast on prediction of crop development Ear emergence in rice and wheat crops is an important indicator for determining the appropriate date to apply fertilizer or pesticides. Meteorological data are commonly used to predict ear emergence. Conventionally, the meteorological dataset for its purpose is prepared just connecting those of observed and climatological on the day of prediction.

1-KM GRID METEOROLOGICAL DATA SERVICE AND ITS USE TO REDUCE WEATHER AND CLIMATE RISKS IN FIELD CROP PRODUCTION
323
Comparing the predicted date of ear emergence obtained in this conventional way with that obtained from AMGSD can validate the impact of the weather forecasts on the prediction of crop development. Fig. 4 shows the results of the daily prediction of ear emergence (heading) date of wheat examined in the Tokachi region of Hokkaido Prefecture, using two different meteorological datasets between April 5 and June 1, 2015. Note that June 1 is the actual heading date. One meteorological dataset involves the conventionally combined meteorological data discussed above, while the other is AMGSD. Although both meteorological datasets provided the correct heading date in concert with a crop development model, the predicted day from AMGSD, which incorporates the weather forecast data, was closer to the actual heading date earlier than that from the conventional meteorological data. Fig. 4 shows that weather forecast data helped to accurately correct the prediction of heading date of wheat about two weeks earlier than did the conventional method.
Fig. 4. The results of the day-by-day prediction of date of ear emergence
(heading) of wheat using two meteorological datasets from April 5 (57
days to the heading date) to June 1 (the actual heading date) 2015
(Tokachi region, Hokkaido Prefecture).

1-KM GRID METEOROLOGICAL DATA SERVICE AND ITS USE TO REDUCE WEATHER AND CLIMATE RISKS IN FIELD CROP PRODUCTION
324
Reducing the occurrence of chalky rice resulting from high temperature When the mean air temperature is above 26°C for 20 days from heading, rice grains start to become opaque or white due to loosely packed starch granules. Such rice grains are called chalky rice. Chalky rice is easy to break and has a poorer flavor than non-chalky rice (Morita et al. 2016). With the recent global warming trends, chalky rice has becoming more prevalent and is a problem facing farmers across Japan. Increasing the amount of top dressing one week before heading can reduce the occurrence of chalky rice. However, the amount of additional fertilizer applied cannot be unconditionally increased because the proportion of protein in the rice grain increases if the air temperature does not remain high after fertilizer application, resulting in a poorer taste and/or crop lodging. Consequently, we have developed a way to utilize the weather forecasts to determine the amount of fertilizer to be added as follows: 1. Determine the date of fertilizer top dressing by predicting the heading
date, using meteorological data and a crop development model. 2. On the day prior to top dressing, predict the mean air temperature for 20
days after heading. 3. On the day prior to top dressing, observe the leaf color. 4. Calculate the appropriate amount of top dressing based on the air
temperature and leaf color. 5. Apply top dressing.
Fig. 5 shows these processes. This approach, which minimizes the occurrence of chalky rice grains due to high temperature, has been realized for the first time by AMGSDS because AMGSD incorporates the latest weather forecasts at cultivated fields.

1-KM GRID METEOROLOGICAL DATA SERVICE AND ITS USE TO REDUCE WEATHER AND CLIMATE RISKS IN FIELD CROP PRODUCTION
325
Fig. 5. Concept of the technique to predict and minimize the risk of chalky
grain occurrence by controlling the amount of fertilizer top dressing.
Support information to reduce weather and climate risks associated with crop management The examples discussed above indicate that combining agricultural knowledge or techniques accumulated to date with weather forecasts and crop models can be used to formulate novel crop management technologies. With the aim of reducing meteorological and climatic risks in agriculture, we are currently developing innovative technologies to provide information that supports farmers who cultivate rice, wheat, or soy based on crop management techniques similar to the example discussed above. We are also developing a website that validates the efficacy of such support information. The website will also contain information to support farmers’ crop management decision making (Table 3). In general, a prediction requires initial values. This is also held true for

1-KM GRID METEOROLOGICAL DATA SERVICE AND ITS USE TO REDUCE WEATHER AND CLIMATE RISKS IN FIELD CROP PRODUCTION
326
crop management using weather forecasts. In the case of crop management, the initial values include the types and varieties of crops to be cultivated, location of farmland, and date of planting. Thus, the users of crop management technologies that are based on weather forecasts must input or register values pertaining to subject crops into the relevant support system. Those who manage approximately ten cultivation obtaining support information via a dedicated website, which allows each farmer to identify their field locations with a mapping service and to select the type and variety of crop using drop-down lists or radio buttons, should be convenient. However, those who manage crops in several hundred different fields, such website-based support is not practical. This is because such organizations already tend to employ farm management software to manage fields and cultivations, and we think that utilizing such software to enter initial values for cultivating subject crops should be efficient and helpful in obtaining support information. Based on this idea, we conducted an experiment to provide information supporting crop management via Web-API in cooperation with a vendor that develops agricultural management solutions (Table 3).

1-KM GRID METEOROLOGICAL DATA SERVICE AND ITS USE TO REDUCE WEATHER AND CLIMATE RISKS IN FIELD CROP PRODUCTION
327
Table 3. List of information to support crop management items provided on our
website
Items a Development
Status
Rice
Prediction of crop phenology
Auto-tuning for phenology model
Prediction of optimal harvesting date
Prediction of spikelet sterility due to cold weather (for
cold regions)
Recommendation of weather-adaptive nitrogen top
dressing technique
Recommendation of basal dressing (for cold regions)
Recommendation of nitrogen fertilization
Recommendation of suitable cropping seasons
Rice false smut forecasting
Rice sheath blight forecasting
Rice blast forecasting
Wheat
Prediction of crop phenology
Prediction of optimal harvesting date (for temperate
regions)
Soybean
Prediction of crop phenology
Estimation of soil moisture content
Completed
Tentative
Completed
Completed
Completed
Tentative
Tentative
Completed
Completed
Completed
under
development
Completed
Completed
Completed
Completed
a “completed”: content already installed in the system; tentative: “tentative” content has been installed and will be improved; “under development”: content is under construction.
CONCLUSION Agriculture in Japan is facing two major challenges: climate change and shrinking working population. To help address these challenges, we developed AMGSDS. This system provides daily, on-demand meteorological values, including weather forecasts spanning the entire country, over a 1-km grid. By applying the data provided by AMGSDS to crop development prediction models, crop development can be predicted for up to two weeks earlier than that predicted by conventional prediction techniques. In addition, we developed a new approach for crop management that combines the knowledge regarding the responses of crops to meteorological stresses and techniques to ameliorate damage with accurate predictions using meteorological data. We have developed a way to predict the risks of reduced

1-KM GRID METEOROLOGICAL DATA SERVICE AND ITS USE TO REDUCE WEATHER AND CLIMATE RISKS IN FIELD CROP PRODUCTION
328
paddy rice quality due to high temperatures after heading using air temperature forecasts to determine the amount of fertilizer top dressing required to suppress the formation of chalky grains. To implement such supportive information for crop management, scalable techniques such as Web-API are promising.
REFERENCES Japan Meteorological Agency. 2018. Climate Change Monitoring Report
2017. The Japan Meteorological Agency, Tokyo, Japan. (in Japanese). Ministry of Agriculture, Forestry and Fishery. 2011. Inspection results of
Agricultural Product of Rice in 2010. The Ministry of Agriculture, Forestry and Fishery. http://www.maff.go.jp/j/seisan/syoryu/kensa/kome/ (in Japanese).
Ministry of Agriculture, Forestry and Fishery. 2018. The Survey of Movements in Agricultural Structure 2018. The Ministry of Agriculture, Forestry and Fishery. http://www.maff.go.jp/j/tokei/kouhyou/noukou/attach/pdf/index-4.pdf (in Japanese).
Morita, S., H. Wada, and Y. Matsue. 2016. Countermeasures for heat damage in rice grain quality under climate change. Plant Production Science, 19, 1-11.
Ohno, H. K, Sasaki, G. Ohara, and K. Nakazono. 2016. Development of grid square air temperature and precipitation data compiled from observed, forecasted, and climatic normal data. Climate in Biosphere, 16:71-79. (in Japanese with English abstract).
Ohno, H. 2014. User’s manual of the Agro-Meteorological Grid Square Data, NARO/ARC. Miscellaneous Publication of the NARO Agricultural Research Center, 9:1-77. (in Japanese).
Sugiura, T., H. Sumida, S. Yokoyama, and H. Ono. 2012. Overview of recent effects of global warming on agricultural production in Japan. Japan Agricultural Research Quarterly, 46:1, 7-13.

SEASONAL WEATHER PREDICTION-BASED DECISION-SUPPORT SYSTEMS FOR INCREASING RICE PRODUCTION IN RAINFED AREAS
329
SEASONAL WEATHER PREDICTION-BASED DECISION-SUPPORT SYSTEMS FOR INCREASING
RICE PRODUCTION IN RAINFED AREAS
Keiichi Hayashi1, Lizzida Llorca2, and Iris Bugayong2
1Japan International Research Center for Agricultural Sciences,
Tsukuba, Japan 2International Rice Research Institute, Los Baños, Philippines
E-mail: [email protected]
ABSTRACT
Rainfed rice areas contributes less to global rice supply than irrigated one due to its low productivity. However, it is considered as a great potential to the global food security due to its area. Rainfed-rice production relies entirely on rainfall for water supply to support rice growth, which requires substantial amount of water throughout the cropping period. However, rainfall patterns are uncertain considering start and end of the rainy season and total amount and seasonal distribution of rainfall, all of which are crucial factors determining rice productivity. Farmers cultivating rainfed rice usually apply their empirical knowledge to determine when to sow the rice crop, based on certain events/amounts of rainfall occurring at the beginning of the rainy season. However, predicting the sowing date in this manner does not consistently result in greater productivity. Study in Lao-People’s Democratic Republic (Lao PDR, Laos) and Indonesia showed that farmers cultivating rainfed rice did not aim to achieve the highest yield but to obtain stable subsistence-level production because of their insufficient capacity to anticipate forthcoming weather events. To make rainfed rice areas more productive in stable manner than before, it is imperative to improve the local capacity to cope with the uncertainties and make an appropriate decision for better practice and productivities; an element of weather forecasting could play a crucial role in improving the capacity of farmers cultivating rainfed rice to consistently achieve higher yields per unit land area. In this study, a weather–rice–nutrient integrated decision-support system (WeRise) was developed through a collaborative research project by the International Rice Research Institute (IRRI) and Japan International Research Center for Agricultural Sciences (JIRCAS) or IRRI-Japan project funded by the Ministry of Agriculture, Forestry and Fisheries of Japan.
SEASONAL WEATHER PREDICTION-BASED DECISION-SUPPORT SYSTEMS FOR INCREASING RICE PRODUCTION IN RAINFED AREAS
330
WeRise is driven by a seasonal weather prediction-based crop-growth model to optimize the practice of farmers cultivating rainfed rice in terms of sowing date, varietal selection, and fertilizer application, which entails greater efficiency in resource use for higher and more stable rice production in rainfed ecosystems.
Keywords: Unfavorable environment, Southeast Asia, drought, SINTEX-F, WeRise
INTRODUCTION
Rice is an important staple crop for approximately 3.5 billion people in the world but increasing demand from a burgeoning population implies that the production of milled rice should be increased by 120 million tons by 2035. Although globally rice is mainly produced in irrigated-rice ecosystems, enhancing rice production in rainfed areas is becoming crucial for global food security in the present and the future due to very limited availability of physical and economic resources in these areas, with the problems exacerbated by climate change and economic development in developing countries. Although the grain yield in rainfed-rice areas is less than half that in irrigated-rice areas, improvements to achieve greater yields are particularly important; however, it is difficult to consistently increase yield in rainfed-rice areas because of extreme and uncertain events such as drought and flood, driven by fluctuating water supply through current rainfall.
As a consequence, it is imperative to exploit weather forecasts to mitigate constraints in rainfed-rice production. In rainfed-rice farming, the crucial information is not only the total amount of rainfall but also temporal variation in rainfall distribution, including the start and end of the rainy season, so the application of seasonal weather forecasts is indispensable to provide relevant information to farmers cultivating rainfed rice. It is also important to optimize production using weather forecasting, so that the application of a crop-growth model is crucial to identify optimal timings within given phases of the forthcoming rainy season. Furthermore, the integration of the weather forecast into a crop-growth model enables farmers to select a suitable variety, avoid abiotic stress during critical crop stages, and improve the efficiency of resource use during rice production to help farmers cultivating rainfed rice to strategically produce rice. A weather forecast-based decision-support system is the key to transform rainfed-rice areas into more productive and stable rice-producing areas to supply the growing demand for rice in the world.

SEASONAL WEATHER PREDICTION-BASED DECISION-SUPPORT SYSTEMS FOR INCREASING RICE PRODUCTION IN RAINFED AREAS
331
CURRENT SITUATION IN RAINFED-RICE AREAS
The yield from rainfed-rice farming is lower than that of irrigated rice, and its contribution to the global rice supply is less than 20%. However, its production area is about 40% of the rice cultivation area in Asia and about 70% in Africa, meaning that there is potential to contribute significantly to the global food security should certain improvements be met. It is imperative to strengthen and accelerate research and technological development in rainfed-rice cultivation to achieve the necessary improvements.
In Southeast Asia, which is recognized as a center of rice production and consumption, a survey was conducted to characterize the current rice production in the rainfed cropping area and to identify problems/constraints. The water supply required for the rice growth in these areas depends entirely on rainfall, particularly at critical stages of crop development such as seedling, panicle initiation and flowering stages. According to the results of a field survey, it was found that the sowing date among farmers cultivating rainfed rice varied, with different sowing dates resulting in different grain yields (Fig. 1). For example, the sowing date selected by the majority of farmers in Lao PDR resulted in the lowest yield of all the sowing dates investigated, while the majority of farmers in Indonesia obtained similar grain yields to crops sown one month before their own sowing dates. These case studies indicate that farmers’ decision making with respect to sowing date was aiming not at achieving the highest yields but at obtaining at least subsistence-level production, despite the uncertainties which arise during crop growth and development. Furthermore, these findings indicate that farmers cultivating rainfed rice have no way of anticipating any weather events that occur after sowing and that this limitation hampers farmers cultivating rainfed rice from optimizing practices such as sowing and fertilizer application dates. To transform the rainfed-rice areas into more productive areas for rice cultivation, it is imperative to improve the local capacity to respond to weather variation during the cropping season, such as an application of weather forecasting to play a crucial role in improving the production capacity of farmers cultivating rainfed rice. Furthermore, the use of weather prediction is imperative to enable farmers to minimize production costs (labor, materials, machine rental, etc.) as well as to use appropriate technologies, such as improved rice varieties, to respond appropriately to risks in the forthcoming season.

SEASONAL WEATHER PREDICTION-BASED DECISION-SUPPORT SYSTEMS FOR INCREASING RICE PRODUCTION IN RAINFED AREAS
332
Fig 1. The effect of sowing period on grain yield for farmers cultivating rainfed
rice in (a) Central Java, Indonesia, and (b) Savannakhet, Lao PDR. Black
square with error bar denotes mean grain yield ± standard deviation,
whereas bar shows percentage of farmers who sown at corresponding
periods.
APPLICATION OF SEASONAL WEATHER PREDICTIONS
TO RAINFED-RICE FARMING
It is crucial for farmers cultivating rainfed rice to know the start and end of each rainy season, as well as the seasonal rainfall distribution, which is determined by the development of the Asian monsoon. Traditionally, rice farmers have used their empirical knowledge to anticipate the weather during the forthcoming season, a strategy which is outdated given the climate change context. Therefore, seasonal weather predictions can play a crucial role in improving the year-on-year stability of crop yield in rainfed rice. The agricultural application of seasonal weather predictions has been mainly studied in Europe, and in Africa for some upland crops such as maize, wheat, and millet, but there has been no study on rice, particularly rainfed rice (Hayashi et al. 2018). Therefore, the applicability of seasonal weather

SEASONAL WEATHER PREDICTION-BASED DECISION-SUPPORT SYSTEMS FOR INCREASING RICE PRODUCTION IN RAINFED AREAS
333
predictions was evaluated in Southeast Asia, where most of the countries of this region produce and consume substantial amounts of rice.
The Asian monsoon is the main trigger for initiating rainy season in Southeast Asia and is correlated with the El Niño Southern Oscillation (ENSO). The ability to predict the ENSO is crucial for rainfed areas and the Scale Interaction Experiment–Frontier Research Center for Global Change (SINTEX-F), a relatively high-resolution ocean–atmosphere-coupled general circulation model to simulate ENSO in the tropical Pacific, was used for this study (Luo et al. 2008). SINTEX-F is a model at a global scale and it cannot be directly used in a site-specific manner. The cumulative distribution function downscaling model (CDFDM) was employed in order for the SINTEX-F to be applied to rainfed-rice production. CDFDM is an inexpensive downscaling method to apply various daily variables, including daily mean of maximum, and minimum temperatures, precipitation, solar radiation, relative humidity, and wind speed (Iizumi et al. 2011), which are the determining parameters for rice growth. Outputs from CDFDM (CDFDMcor) were compared with predictions from SINTEX-F to evaluate the applicability of the seasonal weather predictions in Indonesia as an example. Results obtained showed that a discrepancy between observed historical weather data and SINTEX-F was corrected after application of CDFDM through the mean error that showed the closeness of CDFDMcor to observed weather data (Table 1). This indicates that using CDFDM can enable seasonal weather predictions to be used for site-specific rainfed-rice areas. In rainfed-rice areas, sowing date is also a crucial factor in determining crop productivity. According to a field survey, farmers wait for certain rainfall events to occur prior to starting sowing and in Central Java the event was cumulative rainfall amount of 139 mm, which took 108 days to occur. The CDFDMcor showed no significant difference between the observed number of days to reach the cumulative rainfall and the designated number of days for the cumulative rainfall amount, As a consequence, the applicability of CDFDM was considered to be adequate to support farmers cultivating rainfed rice to identify the optimum sowing date.
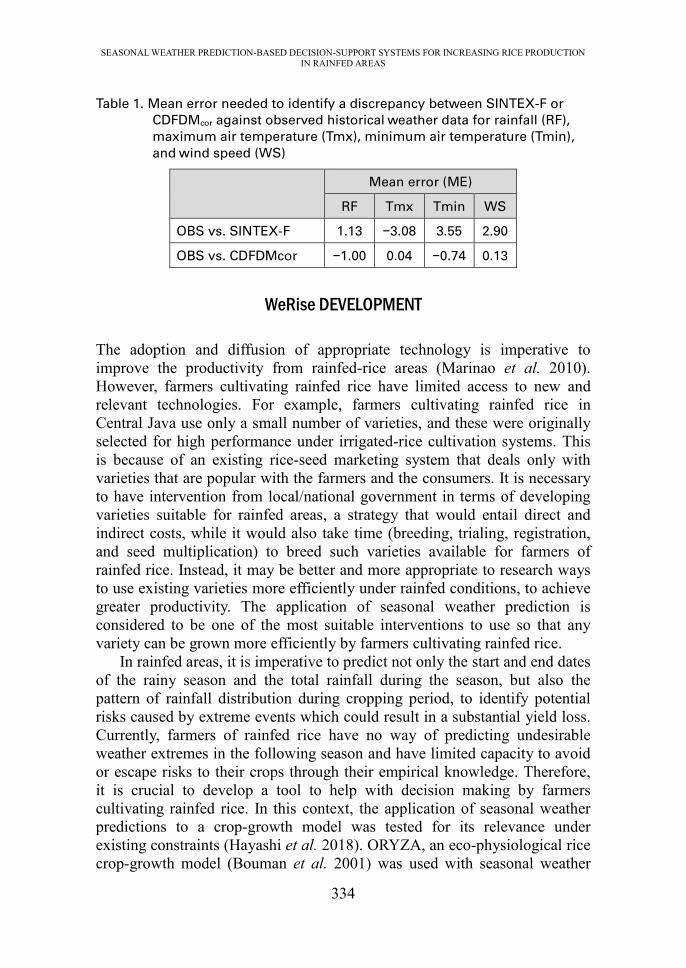
SEASONAL WEATHER PREDICTION-BASED DECISION-SUPPORT SYSTEMS FOR INCREASING RICE PRODUCTION IN RAINFED AREAS
334
Table 1. Mean error needed to identify a discrepancy between SINTEX-F or
CDFDMcor against observed historical weather data for rainfall (RF),
maximum air temperature (Tmx), minimum air temperature (Tmin),
and wind speed (WS)
Mean error (ME)
RF Tmx Tmin WS
OBS vs. SINTEX-F 1.13 −3.08 3.55 2.90
OBS vs. CDFDMcor −1.00 0.04 −0.74 0.13
WeRise DEVELOPMENT
The adoption and diffusion of appropriate technology is imperative to improve the productivity from rainfed-rice areas (Marinao et al. 2010). However, farmers cultivating rainfed rice have limited access to new and relevant technologies. For example, farmers cultivating rainfed rice in Central Java use only a small number of varieties, and these were originally selected for high performance under irrigated-rice cultivation systems. This is because of an existing rice-seed marketing system that deals only with varieties that are popular with the farmers and the consumers. It is necessary to have intervention from local/national government in terms of developing varieties suitable for rainfed areas, a strategy that would entail direct and indirect costs, while it would also take time (breeding, trialing, registration, and seed multiplication) to breed such varieties available for farmers of rainfed rice. Instead, it may be better and more appropriate to research ways to use existing varieties more efficiently under rainfed conditions, to achieve greater productivity. The application of seasonal weather prediction is considered to be one of the most suitable interventions to use so that any variety can be grown more efficiently by farmers cultivating rainfed rice.
In rainfed areas, it is imperative to predict not only the start and end dates of the rainy season and the total rainfall during the season, but also the pattern of rainfall distribution during cropping period, to identify potential risks caused by extreme events which could result in a substantial yield loss. Currently, farmers of rainfed rice have no way of predicting undesirable weather extremes in the following season and have limited capacity to avoid or escape risks to their crops through their empirical knowledge. Therefore, it is crucial to develop a tool to help with decision making by farmers cultivating rainfed rice. In this context, the application of seasonal weather predictions to a crop-growth model was tested for its relevance under existing constraints (Hayashi et al. 2018). ORYZA, an eco-physiological rice crop-growth model (Bouman et al. 2001) was used with seasonal weather

SEASONAL WEATHER PREDICTION-BASED DECISION-SUPPORT SYSTEMS FOR INCREASING RICE PRODUCTION IN RAINFED AREAS
335
forecasts to simulate grain yield according to crop growth in rainfed-rice production in Indonesia. The CDFDMcor was used as the weather inputs for ORYZA, and a grain-yield simulation was carried out as a function of sowing date to obtain predictions of grain yield and hence an optimum sowing date. The field test was conducted during two cropping seasons with two improved rice varieties in Central Java province in Indonesia to evaluate the accuracy of the predictions through this method.
The variety ‘Ciherang’ was released in 2000 for use in irrigated-rice areas and it is still one of the most popular varieties throughout Indonesia, although there are other, more recent varieties Available (Table 2). “Attainable grain yield” for improved varieties is known to be lower than “potential grain yield” (Table 2) as stresses, such as drought, occur during crop growth and development. Farmers cultivating rainfed rice aim to increase yield through adopting new technologies and knowledge. However, a survey showed that farmers mostly rely on empirical information and traditional knowledge to deal with uncertainties with respect to the local weather, which can therefore be considered to be one of the main yield constraints in rainfed-rice areas. Grain yield varies according to sowing date as shown in Fig 2, showing the yields of ‘IR64’ (from four sowing dates) and ‘Ciherang’ (nine sowing dates), both varieties popular in Indonesia. This shows that an optimum sowing date is crucial to achieve higher grain yields in rainfed-rice production. The optimum sowing date also enables farmers cultivating rainfed rice to avoid water stress in their crops during critical crop stages such as panicle initiation and flowering. ORYZA simulation of grain yield as a function of sowing date obtained a reasonably adequate model fit through normalized root mean square (RMSEn) of 13.4% for IR64 and 16.4% for Ciherang, and this showed that the model performance of ORYZA is adequate for simulating grain yield under conditions of rainfed-rice production.

SEASONAL WEATHER PREDICTION-BASED DECISION-SUPPORT SYSTEMS FOR INCREASING RICE PRODUCTION IN RAINFED AREAS
336
Table 2. Attainable and potential yields of several improved Indonesian
improved rice varieties (BB PADI, 2015)
Name of
variety
Year of
release
Days to
maturity
Attainable
grain yield (t
ha-1)
Potential
grain yield
(t ha-1)
Ciherang 2000 116–125 5–7 -
Mekonga 2004 116–125 - 6.0
Inpari 6 2008 118 6.8 8.6
Inpari 10 2009 112 4.8 7.0
Inpari 19 2011 104 6.7 9.5
Inpari 21 2012 120 6.4 8.2
Inpari 27 2012 125 5.7 7.6
Inpari 30 2012 111 7.2 9.6
Inpari 31 2013 119 6.0 8.5
Inpari 32 2013 120 6.3 8.4
Inpari 33 2013 107 6.6 9.8
Fig. 2. Grain-yield simulation using ORYZA at different sowing dates (modified
from Hayashi et al. 2018).

SEASONAL WEATHER PREDICTION-BASED DECISION-SUPPORT SYSTEMS FOR INCREASING RICE PRODUCTION IN RAINFED AREAS
337
Based on the results obtained, a field test was conducted to evaluate the predictability of grain yield on the basis of seasonal weather prediction-based ORYZA simulation in rainfed-rice areas. The results showed that farmers using weather predictions obtained grain yields significantly higher than did the farmers who did not use weather predictions (Fig. 3). During the test, there was a downpour that triggered farmers to start sowing earlier than the predicted sowing date, resulting in low yield due mainly to a drought spell which lasted for one month immediately after the downpour, stressing the young seedlings at an early stage. This resulted in poor rice growth and incurred substantial yield reductions. On the other hand, sowing date that was selected on the basis of ORYZA simulation resulted in higher yields, which were significantly higher than those achieved by farmers who lacked information from the ORYZA simulation. Some farmers without the support of the ORYZA simulation selected sowing dates that coincided with those from the ORYZA simulation, but their yields were also significantly lower than those of simulated one. This could be due to farmers’ practice of fertilizer application being carried out during the early crop stage, which could trigger nutrient deficiencies toward the reproductive stage when rice nutrient demand is greatest to produce more panicles and grains. These actual cases imply that farmers cultivating rainfed rice need to deal with multi risks for better grain yield, and an optimum timing for sowing and fertilizer application play crucial role for this purpose. Seasonal weather prediction-based ORYZA simulation is not only to help farmers cultivating rainfed rice determining an optimum sowing timing but also to apply fertilizer appropriately according to the crop growth stages and surface-water condition in the field. Rice plant can absorb nutrient through applied fertilizer if there is adequate surface water or a downpour is avoided after fertilizer application. Similar results were obtained for the two varieties over the two growing seasons, confirming the applicability of weather prediction to optimize rainfed-rice production. Accordingly, the weather–rice–nutrient integrated decision-support system (WeRise) has been proposed to achieve greater rice production in rainfed-rice areas.

SEASONAL WEATHER PREDICTION-BASED DECISION-SUPPORT SYSTEMS FOR INCREASING RICE PRODUCTION IN RAINFED AREAS
338
Fig. 3. On-farm testing of grain-yield predictions through seasonal weather
prediction-based ORYZA for (a) early rainy season and (b) late rainy
season (modified from Hayashi et al. 2018). * Farmers without (“w/o”)
WeRise who sowed earlier than farmers with (“w/”) WeRise, ** Farmers
without WeRise who sowed at almost the same date as farmers with
WeRise.
WeRise’S APPROACH AND TECHNOLOGY ADOPTION PATHWAY
WeRise is designed as a web application to facilitate end-users’ decision making (Hayashi and Llorca 2016). WeRise can accommodate a maximum of four varieties at the same time, and users can compare the grain yield as a function of sowing dates to choose better or more suitable varieties (Fig. 4). WeRise can also deliver information on the optimum timing for fertilizer application, i.e., the dates and the number of splits of fertilizer applications. WeRise is also language sensitive and has different modes of information delivery to the end-users. In addition to English as a default language, other languages such as Indonesian, Lao, and Filipino are also available to
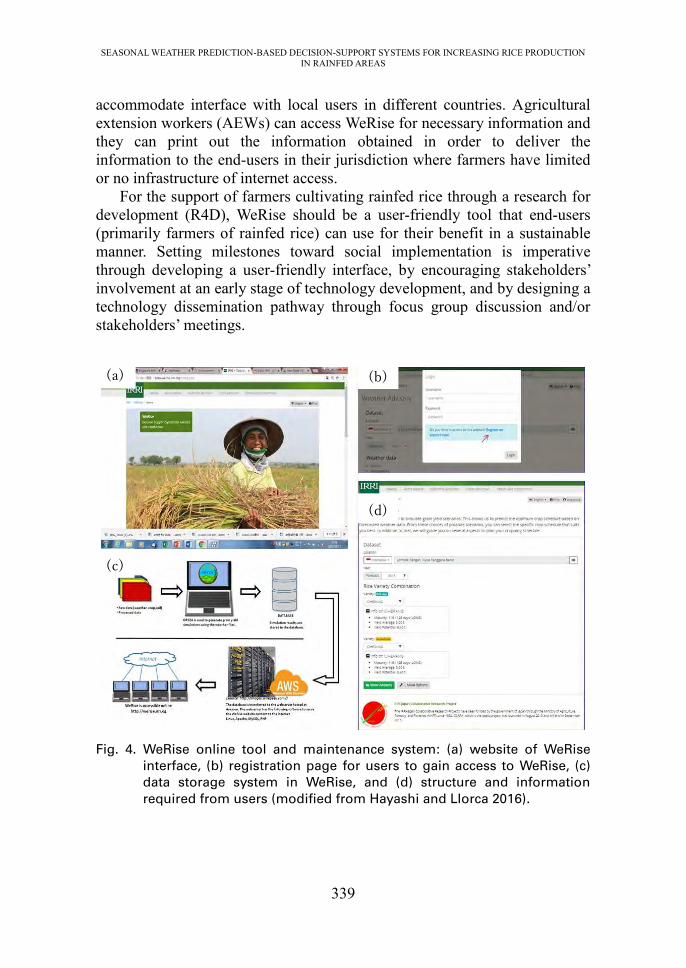
SEASONAL WEATHER PREDICTION-BASED DECISION-SUPPORT SYSTEMS FOR INCREASING RICE PRODUCTION IN RAINFED AREAS
339
accommodate interface with local users in different countries. Agricultural extension workers (AEWs) can access WeRise for necessary information and they can print out the information obtained in order to deliver the information to the end-users in their jurisdiction where farmers have limited or no infrastructure of internet access.
For the support of farmers cultivating rainfed rice through a research for development (R4D), WeRise should be a user-friendly tool that end-users (primarily farmers of rainfed rice) can use for their benefit in a sustainable manner. Setting milestones toward social implementation is imperative through developing a user-friendly interface, by encouraging stakeholders’ involvement at an early stage of technology development, and by designing a technology dissemination pathway through focus group discussion and/or stakeholders’ meetings.
Fig. 4. WeRise online tool and maintenance system: (a) website of WeRise
interface, (b) registration page for users to gain access to WeRise, (c)
data storage system in WeRise, and (d) structure and information
required from users (modified from Hayashi and Llorca 2016).
(a) (b)
(c)
(d)

SEASONAL WEATHER PREDICTION-BASED DECISION-SUPPORT SYSTEMS FOR INCREASING RICE PRODUCTION IN RAINFED AREAS
340
Key stakeholders, such as local researchers and AEWs, play crucial roles in technology adoption for WeRise. Furthermore, information, communication, and educational materials need to be prepared for capacity- building by local AEWs through “training of trainers.” On the other hand, utilizing an existing national system of technology dissemination is also strategically important for the research project in order to accelerate the process of technology adoption.
In addition to enhance existing capacity and utilizing local system for technology adoption, maintenance of the technology is also crucial for the sustainability of the technology. A low-cost data storage service is one of the keys for sustainable operation by designated stakeholders because it charges a minimal cost for data storage and accommodates access for a large number of end-users. Utilizing weather forecasts through the national meteorological agency in the target country would also assure sustainable operation of WeRise because regular updates could be carried out without incurring high costs.
CONCLUSION
Grain yield achieved through traditional farmers’ practices in rainfed areas remained low due to difficulties in anticipating weather patterns before and after sowing, with optimum sowing dates being identified as one of the major challenges facing growers of rainfed rice. The current study demonstrated the applicability of seasonal weather prediction in rainfed-rice production through integration with a crop-growth model to identify an appropriate sowing date, while WeRise was designed as a web application to facilitate end-users’ decision making. For the support of farmers cultivating rainfed rice through R4D, WeRise should be a user-friendly tool that farmers cultivating rainfed rice can use for their benefit in a sustainable manner. Working with local stakeholders is also crucial not only for R4D, but also for the widespread adoption of the technology, so that designing a technology transfer dissemination pathway in a collaborative manner with local stakeholders is imperative for moving toward a social implementation of WeRise in the target country and beyond.

SEASONAL WEATHER PREDICTION-BASED DECISION-SUPPORT SYSTEMS FOR INCREASING RICE PRODUCTION IN RAINFED AREAS
341
REFERENCES
BB PADI 2015. Deskripsi Varietas Unggul Baru Padi pp77. (In Indonesian). Boling, A.A., A. Hermawan, L. Komalawati, and K. Hayashi. 2016. An
assessment of small-scale rice farmers’ adaptability to climate change: Case study in Central Java, Indonesia. AJAEES 10 (3): 1-13.
Bouman, B.A.M., M.J. Kropff, T.P. Tuong, M.C.S. Wopereis, H.F.M. Ten Berge, and H.H. van Laar. 2001. ORYZA 2000: Modeling lowland rice. International Rice Research Institute, Manila, Philippines, 235pp.
Hayashi, K. and L. Llorca. 2016. The weather-rice-nutrient integrated decision support system (WeRise), JIRCAS working report 83.
Hayashi, K., L. Llorca, S. Rustini, P. Setyanto, and Z. Zaini. 2018. Reducing vulnerability of rainfed agriculture through seasonal climate predictions: A case study on the rainfed rice production in Southeast Asia. Agric. Syst. 162: 66-76.
Iizumi, T., M. Nishimori, K. Dairaku, S.A. Adachi, and M. Yokozawa. 2011. Evaluation and intercomparison of downscaled daily precipitation indices over Japan in present-day climate: strengths and weaknesses of dynamical and bias correction-type statistical downscaling methods. J. Geophys. Res. 116: D01111.
Luo, J.J., S. Masson, S.K. Behera, and T. Yamagata. 2008. Extended ENSO predictions using a fully coupled ocean–atmosphere model. J. Clim. 21: 84-93.
Mariano, M.J., R. Villano, and E. Fleming. 2010. Are irrigated farming ecosystems more productive than rainfed farming systems in rice production in the Philippines? Agric. Ecosys. Environ. 139: 603-610.

342

343
ANNEX List of MARCO events: symposia, workshops and seminars November 19-22, 2018 (Tsukuba, Japan)
NARO-MARCO international symposium on "Nitrogen cycling and its environmental impacts in East Asia"
September 27-28, 2018 (Tsukuba, Japan)
NARO-FFTC-MARCO symposium 2018 on "Climate smart agriculture for the small-scale farmers in the Asian and Pacific region"
January 26, 2018 (Tsukuba, Japan)
NARO-MARCO symposium 2018 on "MINCERnet: multi-site monitoring network to cope with the heat stresses of rice under the climate change"
February 28–March 1, 2017 (Tsukuba, Japan)
NARO-MARCO international symposium “Soil carbon sequestration: needs and prospects under the 4 per 1000 initiative”
November 24–26, 2015 (Tsukuba, Japan)
MARCO symposium 2015 satellite workshop, the kick-off meeting on “MINCERnet: multi- site monitoring network of canopy micrometeorology and heat stresses of rice under the climate change”
October 20–23, 2015 (Tsukuba, Japan)
MARCO symposium 2015 satellite workshop, “Adoption and adaptation of SWAT for Asian crop production systems and water resource issues”
August 26–28, 2015 (Tsukuba, Japan)
MARCO symposium 2015: “Next challenges of agro-environmental research in Monsoon Asia”
Workshop 1: Integration of adaptation measures against climate change for Asian rice-based agriculture
Workshop 2: Perspectives on sustainable agriculture in Monsoon Asia: biodiversity- friendly farming and landscape management

344
Workshop 3: Challenges of soil conservation for combating to soil degradation in Monsoon Asia
July 14–16, 2015 (Fukuoka, Japan)
MARCO symposium 2015 satellite workshop, “Remediation of heavy metals-contaminated soils: novel practical approach based on state-of-the-art science”, alongside the 13th International Conference on the Biogeochemistry of Trace Elements (ICOBTE)
November 18–21, 2014 (Tokyo, Japan)
TUAT-MARCO joint international workshop on rice paddy module development in SWAT 2014 - development of a tool for sustainable rice production in Asia and world
September 23–25, 2014 (Taipei, Taiwan)
MARCO-FFTC international seminar on management and remediation technologies of rural soils contaminated by heavy metals and radioactive materials
June 7, 2014 (Tsukuba, Japan)
MARCO international workshop 2014, andosols revisiting - genesis and classification of volcanic ash soil (andosols), and its utilization in Monsoon Asia
December 3–5, 2013 (Tsukuba, Japan)
MARCO-AgMIP workshop 2013 on uncertainty evaluation and improvement of growth and yield prediction models for rice: AgMIP rice team annual meeting 2013
October 16–17, 2013 (Tsukuba, Japan)
MARCO international workshop 2013 on evaluation and mitigation of environmental impacts in agricultural ecosystems for sustainable management
October 8–10, 2013 (Tsukuba, Japan)
MARCO-FFTC joint international workshop 2013 on benefits and risks of genetically modified food crops in Asia

345
October 29–30, 2012 (Tsukuba, Japan)
MARCO satellite symposium 2012, “Risk alleviation technologies for arsenic and cadmium contamination of foods in Monsoon Asia”
September 24–27, 2012 (Tsukuba, Japan)
MARCO symposium 2012: “Strengthening collaboration to meet agro-environmental challenges in Monsoon Asia”
Workshop 1: Agriculture and climate change in Monsoon Asia: adaptation, mitigation, and forecast
Workshop 2: Biosafety and issues facing the development of genetically modified crops in Monsoon Asia: current status and future prospects
Workshop 3: A new phase for the development and utilization of a soil information system in East Asia
Workshop 4: Possible ways to strengthen collaboration to meet agro-environmental challenges in Monsoon Asia
July 9–12, 2012 (Tsukuba, Japan)
World crop FACE workshop 2012 November 15–18, 2011 (Tsukuba, Japan)
MARCO workshop on technology development for mitigating greenhouse gas emissions from agriculture
September 27–30, 2011 (Taipei, Taiwan)
MARCO-FFTC international seminar on increased agricultural nitrogen circulation in Asia: technological challenge to mitigate agricultural N emissions
March 2–4, 2011 (Tsukuba, Japan)
International workshop on advanced use of satellite- and geo-information for agricultural and environmental intelligence
November 9–11, 2010 (Tsukuba, Japan)
International seminar on enhancement of functional biodiversity relevant to sustainable food production in ASPAC - association with MARCO -

346
September 28–29, 2010 (Bogor, Indonesia)
International workshop on evaluation and sustainable management of soil carbon sequestration in Asian countries
September 1–3, 2010 (Tsukuba, Japan)
MARCO/GRA joint workshop on paddy field management and greenhouse gases
October 5–7, 2009 (Tsukuba, Japan)
MARCO symposium 2009: “Challenges for agro-environmental research in Monsoon Asia”
Workshop 1: Development of phyto-technology for decreasing heavy metal in food
Workshop 2: Crop production under heat stress Workshop 3: Survey of plant natural resources and isolation of
allelochemicals in Monsoon Asia Workshop 4: Biodiversity and agro-ecosystem in rice paddy landscape
in Monsoon Asia Workshop 5: Perspectives of metagenomics in agricultural research
October 14–15, 2008 (Tsukuba, Japan)
MARCO workshop, “A new approach to soil information systems for natural resources management in Asian countries”
October 22–23, 2007 (Tsukuba, Japan)
NIAES international symposium 2007, “Invasive alien species in Monsoon Asia: status and control”
October 22, 2007 (Tsukuba, Japan)
ESAFS/JSSSPN/NIAES/JIRCAS/NARO-NARC/FFTC international symposium, “New challenges for agricultural science : harmonizing food production with the environment.”

347
December 12–14, 2006 (Tsukuba, Japan)
NIAES international symposium: “Evaluation and effective use of environmental resources for sustainable agriculture in Monsoon Asia: toward international research collaboration”
Workshop 1: Invasive alien plants in Asia, status and control Workshop 2: Monsoon Asia agricultural greenhouse gas emission
studies Workshop 3: Prediction of rice production variation in east and
southeast Asia under global warming
Workshop 4: Ecological risk assessment for the gene flow from the genetically modified crops
ISBN 978-4-908914-02-7