climate risk management through sustainable land management in
TRANSCRIPT

IFPRI Discussion Paper 01126
September 2011
Climate Risk Management through Sustainable Land Management in Sub-Saharan Africa
Ephraim Nkonya Frank Place John Pender
Majaliwa Mwanjololo Appollonia Okhimamhe
Edward Kato Susana Crespo
Jupiter Ndjeunga Sibiry Traore
Environment and Production Technology Division

INTERNATIONAL FOOD POLICY RESEARCH INSTITUTE
The International Food Policy Research Institute (IFPRI) was established in 1975. IFPRI is one of 15 agricultural research centers that receive principal funding from governments, private foundations, and international and regional organizations, most of which are members of the Consultative Group on International Agricultural Research (CGIAR).
PARTNERS AND CONTRIBUTORS IFPRI gratefully acknowledges the generous unrestricted funding from Australia, Canada, China, Denmark, Finland, France, Germany, India, Ireland, Italy, Japan, the Netherlands, Norway, the Philippines, South Africa, Sweden, Switzerland, the United Kingdom, the United States, and the World Bank.
AUTHORS Ephraim Nkonya, International Food Policy Research Institute Senior Research Fellow, Environment and Production Technology Division Edward Kato, International Food Policy Research Institute Research Analyst, Environment and Production Technology Division Susana Crespo, International Food Policy Research Institute Research Analyst, Environment and Production Technology Division Frank Place, World Agroforesty Center John Pender, Economic Research Services of the U.S. Department of Agriculture Majaliwa Mwanjololo, Makerere University of Environment & Natural Resource Management Appollonia Okhimamhe, Federal University of Technology, Nigeria Jupiter Ndjeunga, International Crops Research Institute for the Semi-Arid Tropics Sibiry Traore, International Crops Research Institute for the Semi-Arid Tropics
Notices 1. IFPRI Discussion Papers contain preliminary material and research results. They have been peer reviewed, but have not been subject to a formal external review via IFPRI’s Publications Review Committee. They are circulated in order to stimulate discussion and critical comment; any opinions expressed are those of the author(s) and do not necessarily reflect the policies or opinions of IFPRI. 2. The boundaries and names shown and the designations used on the map(s) herein do not imply official endorsement or acceptance by the International Food Policy Research Institute (IFPRI) or its partners and contributors.
Copyright 2011 International Food Policy Research Institute. All rights reserved. Sections of this material may be reproduced for personal and not-for-profit use without the express written permission of but with acknowledgment to IFPRI. To reproduce the material contained herein for profit or commercial use requires express written permission. To obtain permission, contact the Communications Division at [email protected].

iii
CONTENTS
Abstract vi
Acknowledgments vii
Abbreviations and Acronyms viii
1. Introduction 1
2. Study Objectives 2
3. Background on the Case Study Countries 8
4. Methodology 16
5. Results 22
6. Conclusions and Context-Specific Policy Recommendations 56
Appendix: Supplementary Tables 64
References 71

iv
List of Tables
2.1—Changes in rainfall from the period 1980–1990 to the period 2080–2090 (percent) 3
2.2—Irrigation development in the case study countries 4
3.1—Economic development and major policies of the case study countries 8
3.2—National level carbon stock in the selected countries and rate of deforestation 14
4.1—Land area and human population by agroclimatic zone in Sub-Saharan Africa and the sites selected matching each zone 17
4.2—Selected sites and household sample in each agroecological zone (AEZ) in each country 19
5.1—The five most common climate change adaptation strategies reported in East and West Africa (%) 30
5.2—Adoption rates of SLWM practices in selected countries 32
5.3—Reasons for not responding to climate change (%) 33
5.4—Determinants of response to climate change. 34
5.5—Comparison of simulated yields with farmer and experimental yields 41
5.6—Impact of SLWM on value of crops produced per hectare 43
5.7—Effect of SLWM on crop yield risks (deviation from conditional mean yield) 45
5.8—Impact of land management practices on soil carbon 47
5.9—Aboveground and belowground carbon stock changes across agroecological zones, Uganda, 1973–2009 52
5.10—Land use change in Kenya (Bondo and Bungoma districts), 1999–2008 52
A.1—Probit regressions on plot level adoption of various SLM practices in Kenya 64
A.2—Uganda drivers of land management practices (marginal effects) 66
A.3—Determinants of adoption of land management practices (marginal effects), Niger 68
A.4—Determinants of adoption of land management practices (Maximum likelihood probit), Niger state, Nigeria 69
v
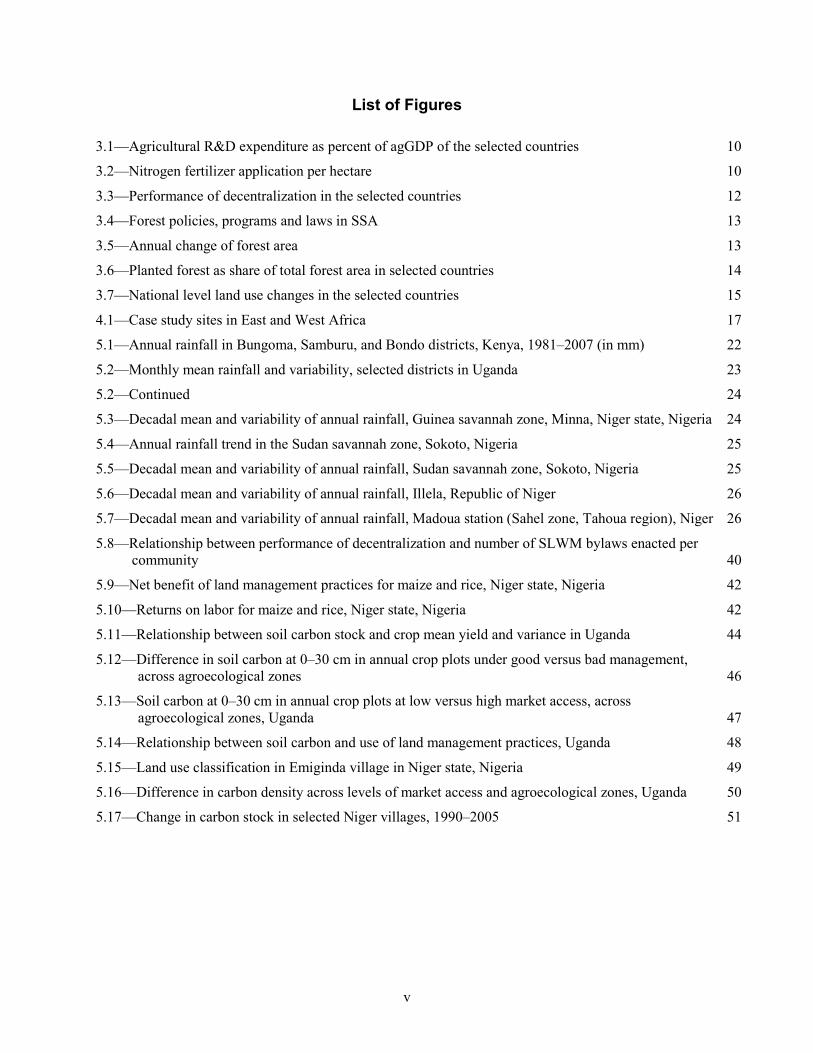
List of Figures
3.1—Agricultural R&D expenditure as percent of agGDP of the selected countries 10
3.2—Nitrogen fertilizer application per hectare 10
3.3—Performance of decentralization in the selected countries 12
3.4—Forest policies, programs and laws in SSA 13
3.5—Annual change of forest area 13
3.6—Planted forest as share of total forest area in selected countries 14
3.7—National level land use changes in the selected countries 15
4.1—Case study sites in East and West Africa 17
5.1—Annual rainfall in Bungoma, Samburu, and Bondo districts, Kenya, 1981–2007 (in mm) 22
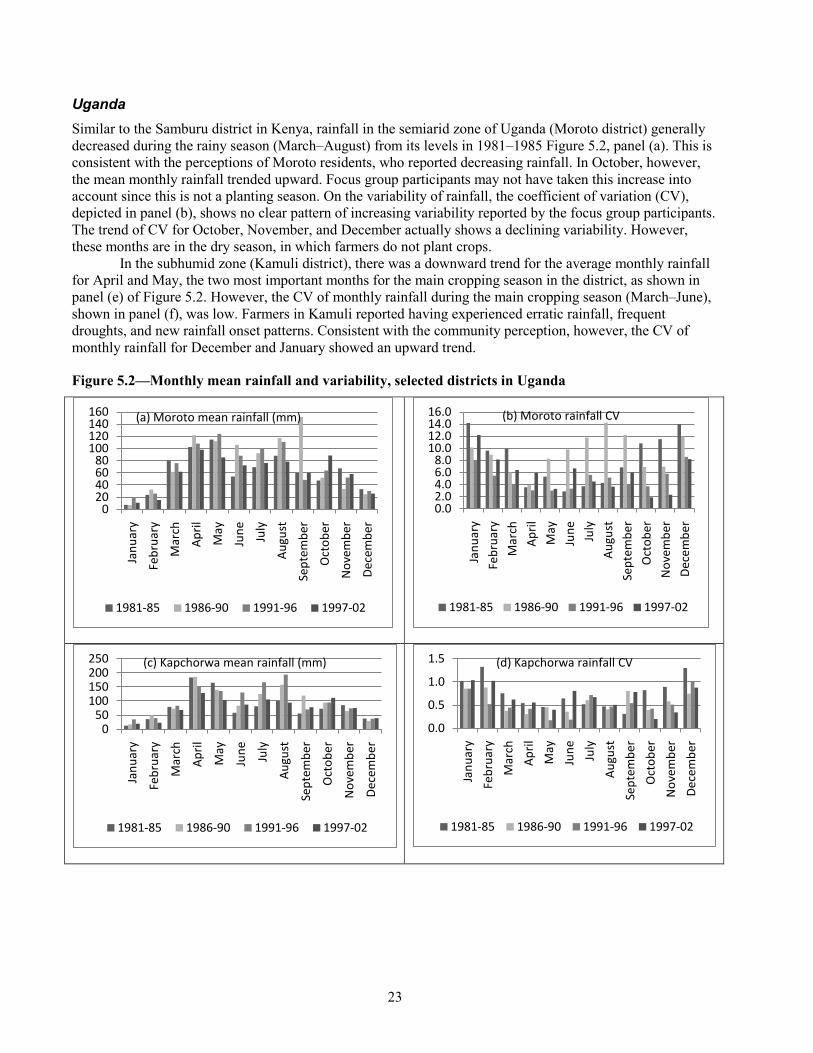
5.2—Monthly mean rainfall and variability, selected districts in Uganda 23
5.2—Continued 24
5.3—Decadal mean and variability of annual rainfall, Guinea savannah zone, Minna, Niger state, Nigeria 24
5.4—Annual rainfall trend in the Sudan savannah zone, Sokoto, Nigeria 25
5.5—Decadal mean and variability of annual rainfall, Sudan savannah zone, Sokoto, Nigeria 25
5.6—Decadal mean and variability of annual rainfall, Illela, Republic of Niger 26
5.7—Decadal mean and variability of annual rainfall, Madoua station (Sahel zone, Tahoua region), Niger 26
5.8—Relationship between performance of decentralization and number of SLWM bylaws enacted per community 40
5.9—Net benefit of land management practices for maize and rice, Niger state, Nigeria 42
5.10—Returns on labor for maize and rice, Niger state, Nigeria 42
5.11—Relationship between soil carbon stock and crop mean yield and variance in Uganda 44
5.12—Difference in soil carbon at 0–30 cm in annual crop plots under good versus bad management, across agroecological zones 46
5.13—Soil carbon at 0–30 cm in annual crop plots at low versus high market access, across agroecological zones, Uganda 47
5.14—Relationship between soil carbon and use of land management practices, Uganda 48
5.15—Land use classification in Emiginda village in Niger state, Nigeria 49
5.16—Difference in carbon density across levels of market access and agroecological zones, Uganda 50
5.17—Change in carbon stock in selected Niger villages, 1990–2005 51
vi
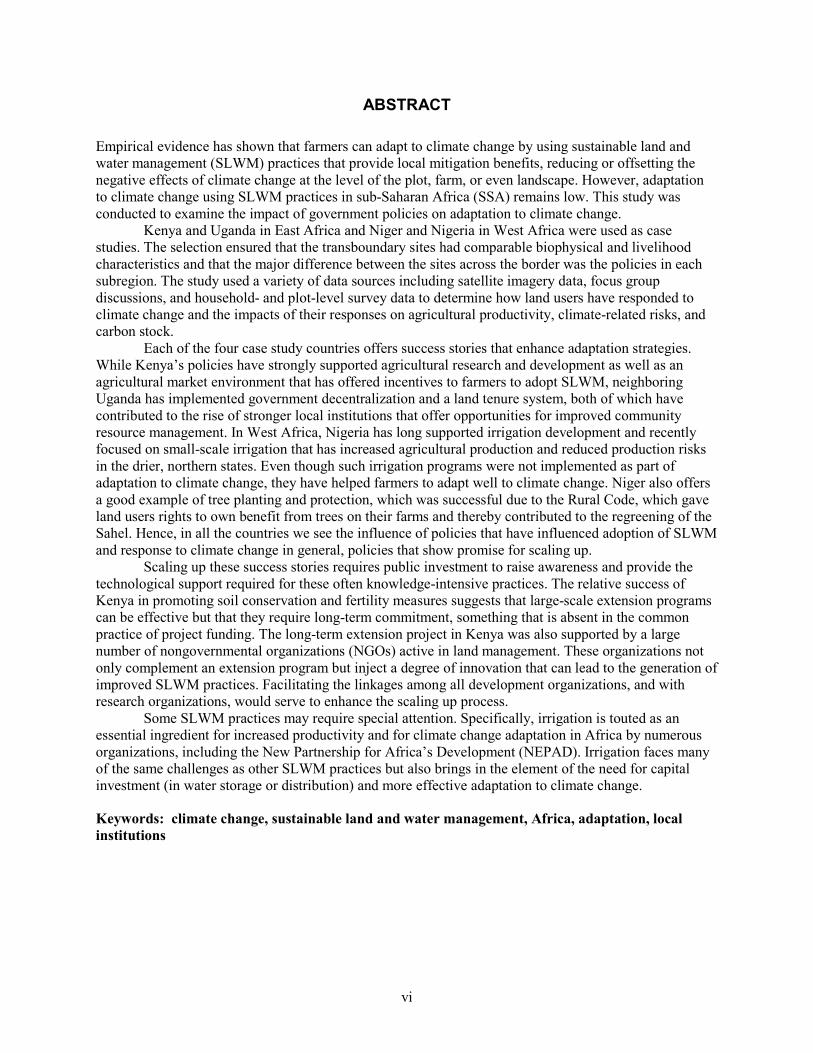
ABSTRACT
Empirical evidence has shown that farmers can adapt to climate change by using sustainable land and water management (SLWM) practices that provide local mitigation benefits, reducing or offsetting the negative effects of climate change at the level of the plot, farm, or even landscape. However, adaptation to climate change using SLWM practices in sub-Saharan Africa (SSA) remains low. This study was conducted to examine the impact of government policies on adaptation to climate change.
Kenya and Uganda in East Africa and Niger and Nigeria in West Africa were used as case studies. The selection ensured that the transboundary sites had comparable biophysical and livelihood characteristics and that the major difference between the sites across the border was the policies in each subregion. The study used a variety of data sources including satellite imagery data, focus group discussions, and household- and plot-level survey data to determine how land users have responded to climate change and the impacts of their responses on agricultural productivity, climate-related risks, and carbon stock.
Each of the four case study countries offers success stories that enhance adaptation strategies. While Kenya’s policies have strongly supported agricultural research and development as well as an agricultural market environment that has offered incentives to farmers to adopt SLWM, neighboring Uganda has implemented government decentralization and a land tenure system, both of which have contributed to the rise of stronger local institutions that offer opportunities for improved community resource management. In West Africa, Nigeria has long supported irrigation development and recently focused on small-scale irrigation that has increased agricultural production and reduced production risks in the drier, northern states. Even though such irrigation programs were not implemented as part of adaptation to climate change, they have helped farmers to adapt well to climate change. Niger also offers a good example of tree planting and protection, which was successful due to the Rural Code, which gave land users rights to own benefit from trees on their farms and thereby contributed to the regreening of the Sahel. Hence, in all the countries we see the influence of policies that have influenced adoption of SLWM and response to climate change in general, policies that show promise for scaling up.
Scaling up these success stories requires public investment to raise awareness and provide the technological support required for these often knowledge-intensive practices. The relative success of Kenya in promoting soil conservation and fertility measures suggests that large-scale extension programs can be effective but that they require long-term commitment, something that is absent in the common practice of project funding. The long-term extension project in Kenya was also supported by a large number of nongovernmental organizations (NGOs) active in land management. These organizations not only complement an extension program but inject a degree of innovation that can lead to the generation of improved SLWM practices. Facilitating the linkages among all development organizations, and with research organizations, would serve to enhance the scaling up process.
Some SLWM practices may require special attention. Specifically, irrigation is touted as an essential ingredient for increased productivity and for climate change adaptation in Africa by numerous organizations, including the New Partnership for Africa’s Development (NEPAD). Irrigation faces many of the same challenges as other SLWM practices but also brings in the element of the need for capital investment (in water storage or distribution) and more effective adaptation to climate change.
Keywords: climate change, sustainable land and water management, Africa, adaptation, local institutions

vii
ACKNOWLEDGMENTS
We are grateful to the World Bank for providing funding for this study. We are also grateful to the farmers and community leaders in Kenya, Niger, Nigeria and Uganda who provided data and information used in this study. We thank research assistants from all four countries (please see list in Appendix Table A.1) for playing a key role in data collection, cleaning and analysis. We also thank enumerators and Practical Sampling International (PSI) for providing household data collection in Nigeria. We are indebted to a number of colleagues from the World Bank and participants to various workshops who provided insightful comments to various versions of this paper. We are also grateful to Taoufiq Bennouna, Stephen Danyo and Florence who managed this study project from the World Bank. We thank the IFPRI communication team and support staff for providing editorial services and formatting services. The authors take responsibility for all errors and omissions of this report.
viii
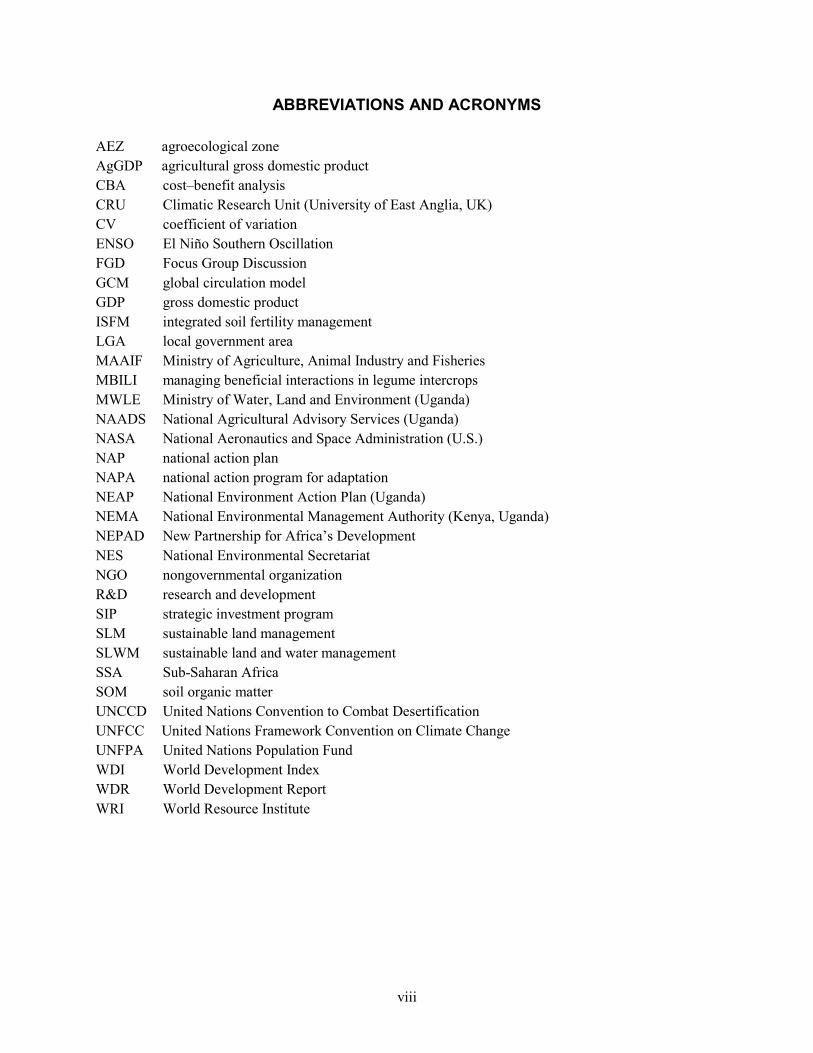
ABBREVIATIONS AND ACRONYMS
AEZ agroecological zone AgGDP agricultural gross domestic product CBA cost–benefit analysis CRU Climatic Research Unit (University of East Anglia, UK) CV coefficient of variation ENSO El Niño Southern Oscillation FGD Focus Group Discussion GCM global circulation model GDP gross domestic product ISFM integrated soil fertility management LGA local government area MAAIF Ministry of Agriculture, Animal Industry and Fisheries MBILI managing beneficial interactions in legume intercrops MWLE Ministry of Water, Land and Environment (Uganda) NAADS National Agricultural Advisory Services (Uganda) NASA National Aeronautics and Space Administration (U.S.) NAP national action plan NAPA national action program for adaptation NEAP National Environment Action Plan (Uganda) NEMA National Environmental Management Authority (Kenya, Uganda) NEPAD New Partnership for Africa’s Development NES National Environmental Secretariat NGO nongovernmental organization R&D research and development SIP strategic investment program SLM sustainable land management SLWM sustainable land and water management SSA Sub-Saharan Africa SOM soil organic matter UNCCD United Nations Convention to Combat Desertification UNFCC United Nations Framework Convention on Climate Change UNFPA United Nations Population Fund WDI World Development Index WDR World Development Report WRI World Resource Institute

1
1. INTRODUCTION
In the past decade, gross domestic product (GDP) in Sub-Saharan Africa (SSA) has grown at an average of 6 percent a year, reversing the trend of the preceding two decades (Badiane 2008). Agriculture, which accounts for 34 percent of the SSA GDP and employs 64 percent of the labor force in the region (World Bank 2008), contributed significantly to this growth. The growth rate of agricultural GDP (agGDP) per capita of the agricultural population in SSA was almost stagnant or negative in the 1970s and 1980s but trended upward in the past decade (World Bank 2008). These positive developments are strongly linked to rainfed agriculture, since only 4 percent of the cultivated area in SSA is irrigated (FAOSTAT 2007). Additionally, approximately 65 percent of the land area in Africa is in the drylands (Gnacadja 2010), with erratic rainfall that makes rainfed farming even more vulnerable (Conway and Waage 2010). Poverty in the SSA region is also high, with 42 percent of the population living on less than US$11 a day in 2004 (Chen and Ravallion 2007). This reduces the capacity of the rural poor, who heavily depend on rainfed agriculture, to cope with and adapt to short- and long-term climatic shocks. The dependence of poor farmers on rainfed agriculture makes SSA economies the most vulnerable in the world to climatic changes (Barnichon and Peiris 2008; Conway and Waage 2010).
There is significant evidence that both positive and negative impacts of climate change have affected SSA. Positive effects include increased rainfall in the Sahel (the zone south of the Sahara desert), which has contributed to the regreening of the region (Olsson, Eklundh, and Ardö 2005), and the potential for increasing precipitation in eastern Africa. The increasing vegetation is due to the increasing rainfall, which is a result of the monsoon winds in West Africa (Olsson, Eklundh, and Ardö 2005; UNFPA 2009) and land management practices, which have reduced land clearing (Olsson, Eklundh, and Ardö 2005) and promoted natural regeneration (Reij, Tappan, and Smale 2009). Global circulation models (GCMs) have predicted increases in temperature ranging from 0.7 degrees Celsius to 1.5 degrees Celsius by year 2020 (Christensen et al. 2007). Rainfall is predicted to increase by 7 percent in the Lake Victoria basin and to decrease in arid and semiarid areas (Christensen et al. 2007).The severity and frequency of droughts, heat waves, and floods in most SSA countries are also expected to increase (Christensen et al. 2007; Cline 2007), resulting in significant impacts on natural resources. These changes are not uniformly distributed in any given region due to the diverse agroecological zones. Such changes have greater impact in humid tropical areas like the Lake Victoria basin. The net effect of the increase in rainfall in the humid areas is uncertain, given that higher temperatures lead to higher evaporation, faster decomposition of organic matter, and altered physiological characteristics of some plant species. Additionally, most of the additional rainfall will fall in the Indian Ocean (Funk et al. 2008). In contrast, predictions of GCMs give mixed results in the Sudano-Sahelian climate of West Africa. Some models predict a wetter climate and some predict a drier climate, but in general all models show more rainfall variability with increasing temperatures.
An important policy question is what can be done to enhance poor farmers’ ability to adapt to and mitigate climate change. Empirical evidence has shown that farmers can adapt to climate change by using sustainable land and water management (SLWM) practices that also provide local mitigation benefits, reducing or offsetting the negative effects of climate change at the level of the plot, farm, or even landscape.
Farmers have taken steps to adapt to climatic changes and variability. The most common adaptation strategies in SSA are changing the types of crop and migrating to other areas. Empirical evidence has shown that SLWM practices enhance adaptation to climate change (Smith et al. 2008; Cooper et al. 2009; Cooper and Coe 2011). However, there is limited evidence that farmers have used SLWM as an adaptation strategy. A study in Ethiopia found that 31 percent of farmers adopted SLWM practices to address perceived changes in rainfall and only 4 percent adopted water harvesting technologies (Yesuf et al. 2008). Benhin (2006) and Kabubo-Mariara and Karanja (2006) also found that farmers in South Africa and Kenya were using irrigation as an adaptation strategy. The low adoption of SLWM practices calls for action to design policies and strategies for increasing their adoption in order to take full advantage of their potential to adapt to climate change.
1 All dollar amounts are in U.S. dollars.

2
2. STUDY OBJECTIVES
The overall objective of this study is to generate practical, context-specific recommendations of sustainable land and water management (SLWM) approaches and practices that are suited to improve food security and economic prospects while reducing climate-related risks and greenhouse gas emissions.
The case studies are expected to answer the following questions: • What types, modalities, and conditions of SLWM investments are the most relevant in
terms of adaptation to current variability and future climate change? • What context-specific actions can improve the contribution of SLWM investments to
adaptation and mitigation, considering improved information, institutions, and policy, program and regulatory instruments?
• What are the best synergies between water and land resource management to generate mitigation and adaptation benefits?
The case studies were expected to contribute to a greater effort of TerrAfrica to identify potential SLWM practices for upscaling as well as the conditions under which they are most likely to be successful. These could then be promoted through the TerrAfrica knowledge management vehicle and through relevant country strategic investment programs (SIPs) and other SLWM projects and programs. Results of this study will inform policymakers in SSA countries and their development partners as they design policies and strategies for enhancing adaptation to climate change.
In mid-2009, the research team held further discussions with TerrAfrica to explore whether the team could make progress into another challenging area: how to develop cost-effective methods for measuring carbon sequestration and storage in soils and in vegetation, which is one of the key indicators for TerrAfrica. So the case study also aimed to address the following additional questions:
• What are the carbon stock patterns in the sites and how have they changed over time as a result of land use change?
• Is there a relationship between carbon stocks and SLWM practices within the agricultural land use classification?
• Is it possible to predict soil carbon using adoption of SLWM as a proxy? • Is it possible to extrapolate carbon stock measures across wider landscapes in order to make
assessments of change over time, and how can that best be done? The study covers four countries, Kenya and Uganda in East Africa, and Niger and Nigeria in West
Africa. Due to budget and time constraints, the carbon sequestration case studies were implemented in Kenya and Uganda only. In each country, case study sites were selected to represent areas of high climate variability and different major agroecological zones (AEZs), farming systems, and vulnerability to climate change. The West African Sudano-Sahelian region and East Africa are priority regions for studying climate change and SLWM linkages because they are characterized by high levels of current climate variability and severe levels of land degradation. The risks of climate change differ between these regions. East Africa is strongly influenced by the El Niño Southern Oscillation (ENSO), and most GCMs predict that the climate in this region will become wetter, with increased risks of erosion and flooding (Table 2.1).
3
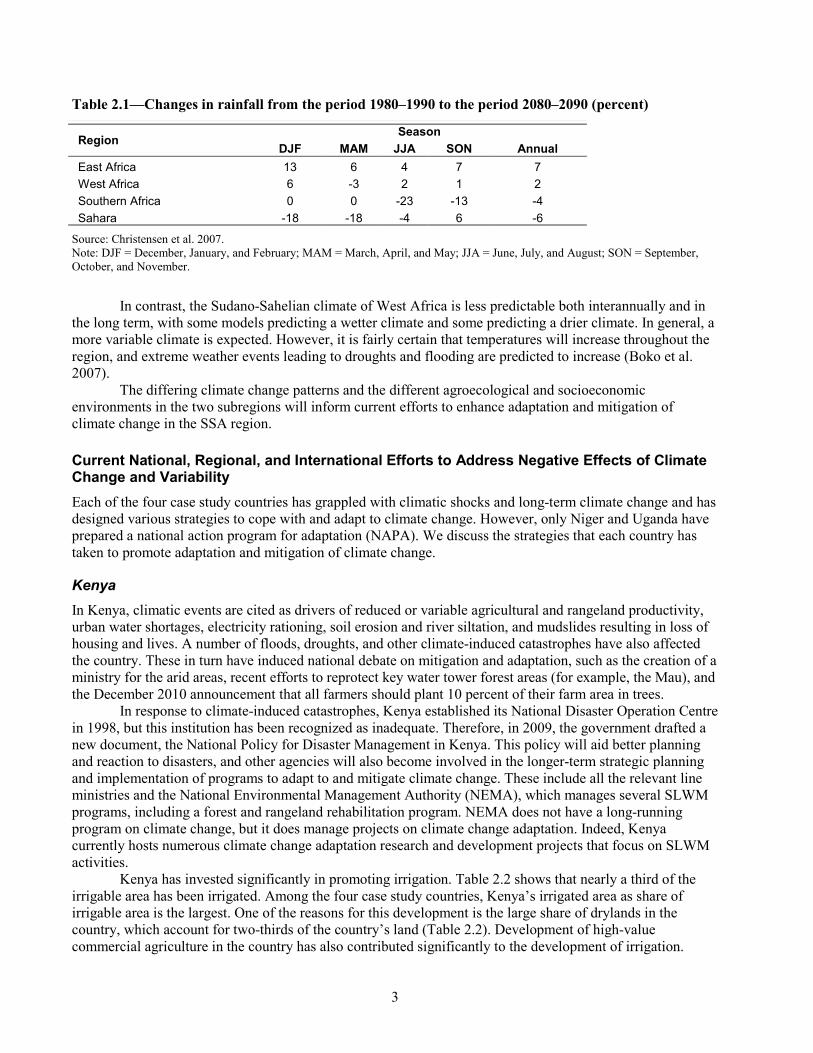
Table 2.1—Changes in rainfall from the period 1980–1990 to the period 2080–2090 (percent)
Region Season
DJF MAM JJA SON Annual East Africa 13 6 4 7 7 West Africa 6 -3 2 1 2 Southern Africa 0 0 -23 -13 -4 Sahara -18 -18 -4 6 -6
Source: Christensen et al. 2007. Note: DJF = December, January, and February; MAM = March, April, and May; JJA = June, July, and August; SON = September, October, and November.
In contrast, the Sudano-Sahelian climate of West Africa is less predictable both interannually and in the long term, with some models predicting a wetter climate and some predicting a drier climate. In general, a more variable climate is expected. However, it is fairly certain that temperatures will increase throughout the region, and extreme weather events leading to droughts and flooding are predicted to increase (Boko et al. 2007).
The differing climate change patterns and the different agroecological and socioeconomic environments in the two subregions will inform current efforts to enhance adaptation and mitigation of climate change in the SSA region.
Current National, Regional, and International Efforts to Address Negative Effects of Climate Change and Variability Each of the four case study countries has grappled with climatic shocks and long-term climate change and has designed various strategies to cope with and adapt to climate change. However, only Niger and Uganda have prepared a national action program for adaptation (NAPA). We discuss the strategies that each country has taken to promote adaptation and mitigation of climate change.
Kenya In Kenya, climatic events are cited as drivers of reduced or variable agricultural and rangeland productivity, urban water shortages, electricity rationing, soil erosion and river siltation, and mudslides resulting in loss of housing and lives. A number of floods, droughts, and other climate-induced catastrophes have also affected the country. These in turn have induced national debate on mitigation and adaptation, such as the creation of a ministry for the arid areas, recent efforts to reprotect key water tower forest areas (for example, the Mau), and the December 2010 announcement that all farmers should plant 10 percent of their farm area in trees.
In response to climate-induced catastrophes, Kenya established its National Disaster Operation Centre in 1998, but this institution has been recognized as inadequate. Therefore, in 2009, the government drafted a new document, the National Policy for Disaster Management in Kenya. This policy will aid better planning and reaction to disasters, and other agencies will also become involved in the longer-term strategic planning and implementation of programs to adapt to and mitigate climate change. These include all the relevant line ministries and the National Environmental Management Authority (NEMA), which manages several SLWM programs, including a forest and rangeland rehabilitation program. NEMA does not have a long-running program on climate change, but it does manage projects on climate change adaptation. Indeed, Kenya currently hosts numerous climate change adaptation research and development projects that focus on SLWM activities.
Kenya has invested significantly in promoting irrigation. Table 2.2 shows that nearly a third of the irrigable area has been irrigated. Among the four case study countries, Kenya’s irrigated area as share of irrigable area is the largest. One of the reasons for this development is the large share of drylands in the country, which account for two-thirds of the country’s land (Table 2.2). Development of high-value commercial agriculture in the country has also contributed significantly to the development of irrigation.

4
Table 2.2—Irrigation development in the case study countries
Country
Irrigated area (000 ha)1
Irrigated area as % of irrigable land1
Value of irrigated output as % of total output2
Drylands as % of land area3
Kenya 103.203 29 9.5 68 Uganda 9.150 10 0.5 16 Niger 73.663 27 - 24 Nigeria 293.117 13 4.4 53
Sources: 1 FAO 2007; 2 FAO 2003; 3 WRI 2003. Notes: Drylands include arid, semiarid, and dry subhumid areas (areas with aridity index of 0.05 to 0.65). Drylands exclude deserts (hyperarid areas with aridity index of less than 0.05).
Kenya has long promoted important SLWM practices. A soil conservation program implemented through the extension system ran for about 20 years up through the 1990s and was deemed to be highly successful in terms of reach and adoption (Thompson and Pretty 1996). Compared with neighboring countries, Kenya’s use of manure and mineral fertilizer is high. This is due to a number of factors, including widespread production and marketing of high-value crops, high adoption of intensive dairy farming and resulting manure availability (SDP 2006), significant extension efforts in fertilizer use, and efforts to improve efficiency in fertilizer value chains (Jayne et al. 2003). Similarly, tree planting campaigns on farms have been prolific in Kenya, perhaps best exemplified by the Green Belt Movement led by Nobel laureate Wangari Maathai. The government has facilitated efforts of its own extension staff and of many NGOs in terms of accessing tree germplasm and disseminating information. These successes are not uniform, however, and SLWM practices are found to be more advanced in the areas with higher ecological and market potential, such as in central Kenya (Place et al. 2006).
Perhaps one of the weaknesses in Kenya emanates from its centralized form of government. Due to the size and complexity of the central government, planning tends to be done in a highly sectoral manner. Moreover, the current structure of nearly 40 ministries in Kenya places further strains on integration of programs. The management of natural resources such as lands, water, and vegetation is a key area that suffers from this structure of government planning. Agricultural objectives sometimes come into conflict with environmental objectives in terms of land use. There is conflicting advice on using irrigation from stream water and setting aside land near streams; on protecting indigenous trees and planting of high-value exotic trees; and on protecting forested areas and finding land for the landless. There are good examples of integrated resource management at landscape levels, but those are often through specific projects that have sufficient funding to create innovative governance mechanisms at local levels.
The Thematic Working Group on Land Management was formed in 2009 under the joint leadership of the ministries of agriculture and environment and began the process of identifying organizations involved in land management activities and creating a platform for information sharing and collaboration. This was to be a first step in trying to overcome the lack of cooperation and partnership across ministries and their stakeholders.
Kenya also ratified the United Nations Convention to Combat Desertification (UNCCD) in 1997 and prepared its national action plan (NAP) in 2002, in which the country planned to design policies and institutions for coordinating and supporting community participation in natural resource management and provision of information on control of desertification (NES 2002). The NAP also identified actions required to increase vegetation cover, productivity of the agricultural and pastoral sectors, and protection of wildlife, 70 percent of which is located in the drylands (NES 2002).
Uganda Like neighboring Kenya, Uganda has experienced increasing climatic catastrophes that have led to widespread losses. A number of studies show that climate change will have a net negative impact on the majority of farmers, most of whom depend on rainfed agriculture and are poor and hence have limited ability

5
to cope with climatic variability and other shocks (Oxfam 2008; Hepworth and Goulden 2008; Kabassa 2008; MWLE 2007). A study conducted by the Ministry of Water, Land and Environment (MWLE) showed that the frequency of droughts has increased from an average of one per decade to about seven in the last decade. Even though these results have been questioned (for example, by Hepworth and Goulden 2008), they reveal that rainfall variability has increased, consistent with GCM predictions for eastern Africa (Christensen et al. 2007).
The Uganda government has prepared its NAPA, which spells out the strategies for enhancing adaptation to and mitigation of the negative effects of climate change and variability (MWLE 2007). The NAPA designed eight intervention strategies worth about $39.8 million, including some related to SLWM.2 The country is also a signatory of the United Nations Framework Convention on Climate Change (UNFCC) and the UNCCD, both of which aim to coordinate international efforts to address climate change and the related problem of desertification. However, policies and strategies for NAPA implementation are still weak and underdeveloped (ROU 2007), and this study provides information to aid that process.
Despite the abundance of wetlands, the Nile River, and other water resources, only 10 percent of irrigable area in Uganda is irrigated and the value of irrigated production as share of the total value of crop production is only 0.5 percent, the lowest among the four study countries (see Table 2.2). This shows the limited investment in irrigation by the government and by farmers. The limited development of irrigation reduces Uganda’s ability to adapt to climate change, especially in the drier areas in the north. Water harvesting and irrigation are among the NAPA strategies to enhance adaptation (ROU 2007). The country has also developed water harvesting programs along the cattle corridor area. A total of 425 microdams have been constructed in the cattle corridor, but these have been poorly constructed and managed so that their effectiveness is limited (Bashar et al. 2003).
NAPA and other government policies and strategies have also promoted SLWM practices aimed at addressing climate change as well as increasing agricultural productivity and conservation of natural resources. The Ugandan NAP aims to develop SLWM practices aimed at rehabilitating degraded lands and preventing degradation, increasing availability of water resources, and integrating natural resource management (MAAIF 1999). The country also has enacted a number of policies and programs aimed at increasing agricultural productivity. However, the major weakness is the poor alignment of policies with investment. A recent study showed that the government contributes only 29 percent of the public expenditure on SLWM, which raises questions about sustainability (World Bank 2008). As in Kenya, poor coordination among ministries and departments dealing with SLWM is also evident in Uganda (World Bank 2008).
Niger Responding to its arid climate, limited vegetation and water resources, and severe land degradation, Niger designed a NAPA in 2006, which identified 14 adaptation action strategies with the broad objectives of food security, sustainable resource management, and poverty reduction. The 14 strategic activities are achieved through the following broad activities: (1) pasture and rangeland improvement; (2) increasing livestock productivity by improving local livestock breeds; (3) development and protection of water resources for domestic use, irrigation, and livestock; (4) promotion of SLWM practices that enhance adaptation to climate change; (5) promoting peri-urban agriculture and nonfarm activities; (6) building the capacity and organizational skills of rural community development groups; (7) preventing and fighting against climate-related pests and diseases; and (8) dissemination of climate information.
As is the case in other countries, however, the total budget set for Niger’s NAPA is small and its implementation is short-term (two to three years). Investment in the NAPA has also been largely funded by donors, with limited contribution by the government. This reveals the weak political will of the government to put the NAPA into the sustainable and long-term operation required for effectiveness. Hence, its effectiveness has been limited even though it has spurred country-level policy awareness of climate change and the need to
2 The strategies are (1) community tree planting, (2) land degradation management, (3) strengthening meteorological stations, (4) community water sanitation, (5) irrigation, (6) climate change and development planning, (7) drought adaptation, and (8) indigenous knowledge.
6
design policies and strategies to enhance adaptation and mitigation. As mentioned earlier, tree planting and farmer-managed natural regeneration is one of the success stories that have attracted attention. As part of implementation of the NAPA, the government started promoting sustainable pasture management, water harvesting, tree planting, developing livestock markets, and other strategies. A large area of degraded land has been rehabilitated through the presidential program on land rehabilitation and several donor-funded projects. According to Adam et al. (2006), at least 250,000 hectares of land have been rehabilitated using tree planting and SWC measures, while more than 3 million hectares have been reforested through farmer-managed natural regeneration since the mid-1980s (Reij, Tappan, and Smale 2009). The area of unexplained regreening in Niger discussed earlier is centered in the area where one such project, Projet Intégré Keita, was implemented. For example, Mortimore et al. (2001) found that despite (or perhaps because of) decreasing availability of natural woodland in Maradi, tree densities on farms were increasing as a result of a widespread practice of farmer protection of valuable natural on-farm trees.
The success of regreening the Sahel in Niger could be explained by two major changes:
• Institutional changes have shifted more ownership and authority for management of natural resources to the local level. The government has embarked on strategies to promote vegetative technologies, which are supported by policy changes to replace the unwritten right of axe by giving ownership rights to those who plant trees (Abdoulaye and Abase 2005). Likewise, the 2004 forestry law also grants ownership rights to those who plant woodlots or protect forest resources on their private land. The government also decentralized management of natural resources through the 2003 Rural Development Strategy (RDS). RDS gives the local governments the responsibility of managing natural resources. These institutional changes have contributed to the regeneration of vegetation in Niger.
• Farmers have changed their behavior in response to both the institutional changes and the severe land degradation that followed the prolonged drought in the 1970s and 1980s, which increased the value of trees and other natural resources and prompted farmers to protect and own them. About 8 percent of the country is protected and the country has one of the largest game parks in West
Africa (FAO 2007). Niger also has considerable irrigation. Table 2.2 shows that 27 percent of irrigable area is irrigated, the second largest share among the case study countries. The necessity of irrigation in Niger is dictated by its large share of land area in the Sahara desert (77 percent) and drylands (24 percent) (see Table 2.2).
Change in greenness in Northern Nigeria – with comparable or better climatic environment than southern Niger – was poorer, reflecting the heavy influence of policies on SLWM practices. Despite these success stories, however, land degradation in Niger remains a major problem. Between 1990 and 2005 Niger lost nearly 26 percent of its forest and woodland habitat (Butler 2006).
Nigeria Like Kenya, Nigeria has not yet formulated policies to coordinate adaptation to climate change. However, the country significantly invested in irrigation long before climate change became a major issue. Food security policies, which Nigeria has been implementing for more than four decades, are one of the key drivers of investment in irrigation. This demonstrates that even though Nigeria has not prepared a NAPA, its existing policies and strategies address the common adaptation strategies identified by the 41 countries that have already prepared their NAPAs—water resource development and food security (Mutunga and Hardee 2009).
Irrigation investments in Nigeria were done as part of the country’s efforts to address the drought problem in the northern part of the country. A total of 11 river basin rural irrigation authorities were formed in the 1970s to develop irrigation programs in the country and a total of 162 dams were constructed (Olubode-Awosola et al. 2005; FAO 2005). About 70 percent of the irrigated area is situated largely in floodplains (fadama areas) with no irrigation infrastructure (see Table 2.2). However, the government has started investing in small-scale irrigation in these floodplains. Recent major projects promoting small irrigation include the Fadama II and III projects. The projects support development of irrigation infrastructure and
7
construction of tube wells to lift water from shallow aquifers. Support of small-scale irrigation has helped to increase development of irrigation in Nigeria. The country is among the six African countries where irrigated area grew by at least three percent annually from 2000 to 2003 (Svendsen, Ewing, and Msangi 2009).3
Summary of Policies and Strategies for Adaptation Different policies and adaptation programs have been set up in all four case study countries and have shown considerable impacts. The strong research and development program and open market policies in Kenya have offered strong incentives to farmers to invest in improved production technologies, including organic and inorganic soil fertility management practices and irrigation. Even though such efforts were not implemented as part of adaptation to climate change, they have enhanced farmers’ adaptation to climate change. Similarly, Nigeria invested in development and promotion of irrigation long before climate change became a major problem. Both Niger and Uganda have prepared NAPAs, a step that has created awareness of climate change and of the need for designing policies and strategies for adaptation and mitigation. Uganda is among the few African countries with an elaborate decentralization structure and a land tenure policy that provides full ownership of land, including land under customary tenure. Similarly, Niger has enacted the Rural Code, which integrates customary institutions and recognizes customary land tenure. The country has also implemented an exemplary tree planting and protection program, which has contributed to regreening of the Sahel.
Despite these significant achievements in each country, major weaknesses exist. The major weaknesses of the NAPAs in Niger and Uganda and NAPs in all four countries are their short-term project orientation, which puts their sustainability into question. Both types of programs (i.e., NAPAs and NAPs) remain largely donor funded with limited political commitment to finance their activities during and beyond the project period (Pearce 2006; Mutunga and Hardee 2009). Additionally, both programs are poorly integrated into the ministries and departments responsible for effective and efficient implementation. For example, despite the fact that both NAPs and NAPAs recognize the importance of local institutions and civil societies in managing natural resources, the role of these institutions and organizations in implementing both programs is sketchy and abstract (Pearce 2006; Mutunga and Hardee 2009).
In all four countries, different ministries that affect land and water resources formulate policies and regulations with poor coordination. For example, it is only in Nigeria that livestock, agriculture, and water resources are overseen by one ministry. In the other three countries, each is under a different ministry, posing a daunting challenge to coordinate implementation of climate change adaptation. Some statutes and regulations are conflicting. For example, in Niger the Rural Code gives pastoralists community-level ownership of water resources in a defined area. Other pastoral communities outside the area of jurisdiction require a permit to access the water. On the other hand, the Water Code states that water is a common resource available to anyone (Cotula 2006). Such conflicts pose a challenge that needs to be addressed as the country strives to improve local government and decentralization. One of TerrAfrica’s objectives is to facilitate coordination of different ministries and departments to implement SLWM and related natural resource management.
3 The countries are Central African Republic, Kenya, Mauritius, Nigeria, Senegal, and Zambia.

8
3. BACKGROUND ON THE CASE STUDY COUNTRIES
The four selected countries have policies and economic development that will help to explain their influence on adaptation to climate change. To prepare the discussion on adaptation to climate change, we discuss the economic development of the selected countries, their major policies with direct impact on adaptation to climate change and biophysical characteristics. It is from this analysis that we will be able to better understand the impact of the economic development and policies on adaptation to climate change.
Economic Growth In East Africa, both Kenya’s and Uganda’s economies have been growing fast, about 4 percent per year in Kenya and 7 percent per year in Uganda from 1990 to 2007 (Table 3.1). In West Africa, Nigeria’s growth rate was also about 7 percent during the same period while growth rate in Niger, on the other hand, has been low and in some years negative. This is largely due to political instability and droughts that affected economic growth of the country.
The policies and political history of Kenya and Uganda also present an interesting comparison. While Kenya has enjoyed a relatively stable political environment and a more open economy that have allowed significant development of the private sector, Uganda is emerging from political crises but has been implementing ambitious policy reforms that have led to fast economic growth. Except Niger, all countries have improved tremendously communication infrastructure. For example, more than 80% of the population in Kenya, Uganda and Nigeria are covered with mobile phone network but road network remain a major problem, especially in Niger (Table 3.1).
Table 3.1—Economic development and major policies of the case study countries
Kenya Uganda Niger Nigeria Population (million)1 35 32 14 147 Per capita income (2008 US$)2 838 454 391 1401
GDP (US$ billion)1
1990 8.6 4.3 2.5 28.5
2000 12.7 6.2 1.8 46
2007 24.2 11.8 4.2 165.5
GDP growth (%)
1990 4.2 6.5 -1.3 8.2
2000 0.6 5.6 -1.4 5.4
2007 7.0 7.9 3.2 5.9
Average growth 3.93 6.67 0.17 6.50 Agriculture value-added as % of GDP4 26 24 38 33
Contribution of livestock to GDP (%)4 11 8 15 5
Contribution of forestry to GDP (2006) (%)4 1.7 4.0 3.3 1.4
Agricultural budget as % of total government expenditure5 4.8 5.4 15.1 7.0
Agriculture expenditure as % of agricultural GDP5 5.8 7.6 8.0 4.8
% below the international poverty line (US$1.25 per capita/day)4 19.7 51.5 65.9 64.4
Road density (km of road/km2 of land)4 11 - 21 1
Population covered by mobile phone network (percent)4 83 100 45 83
Sources: 1 WDI 2009; 2 IMF 2010; 3 World Bank 2008; 3Blench, Chapman, and Slaymaker 2003; 4UNDP 2010; 5Fan et al. 2009.
9
In all four countries, agriculture accounts for 24 percent or more of the GDP. The sector accounts for 38 percent of the Nigerian GDP, the largest share among the four case study countries. The livestock sector – which is part of the agricultural sector – is important in each country as well. The sector is especially important in the dry areas in each country. The sector contributes 15 percent of the Nigerian GDP—the largest contribution among the four case study countries. The livestock sector in Niger is largely pastoral with low productivity due to the low rainfall levels, poor rangeland management, and poor livestock breeds. The prevalence of arid and semiarid areas makes the livestock sector more suited to the agroclimatic environment of the country.4 The country recognizes the importance of the livestock sector and gives it significant attention in the NAPA. The livestock sector in Nigeria accounts for the smallest share of GDP (5 percent) among the four countries even though demand for livestock products is increasing rapidly with increasing urbanization and income (Ogunyika and Marsh 2006). The most climatically harsh and economically poor areas are located in northern states, where livestock is the major sector. This suggests that improvement of the livestock sector will reduce poverty significantly.
Livestock in Kenya accounts for 11 percent of the GDP and is the major livelihood for rural communities in the semiarid north and the Maasai communities in southern Kenya. There are nearly two million smallholder dairy farmers in Kenya (SDP 2006). A study in western Kenya showed that livestock was the third most important pathway out of poverty, after crops and nonfarm activities, and that about 42 percent of all households that escaped from poverty from 1980 to 2004 diversified into livestock (Kristjanson et al. 2004). Livestock in Uganda is concentrated along the cattle corridor, which runs from northeast to the southwest and accounts for 55 percent of the cattle population in Uganda (NEPAD and FAO 2004). Livestock accounts for 8 percent of the GDP but has a potential to contribute much more, given the increasing demand and the low productivity.
Agricultural Expenditure on Research and Development (agR&D) Agriculture is a major sector in all four countries, contributing at least 24 percent of the GDP (Table 3.1). This means, expenditure in the agricultural sector is likely to have favorable impact on economic growth and adaption of SLWM and adaptation to climate change. Niger spent the largest share of government budget on agriculture (Table 3.1). It is the only country among the four, whose agricultural expenditure as percent of the total government expenditure exceeded the Maputo Declaration target of 10%. However, Niger’s agR&D expenditure as share of agricultural gross domestic product (agGDP) was the smallest among the case study countries and smallest among sub-Saharan African countries (Beintema and Stads 2011). Kenya has strongly supported agR&D. Figure 3.1 shows that Kenya had the largest agR&D expenditure as share of agGDP. AgR&D plays a key role in adoption of SLWM since it generates improved SLWM practices. As it will be seen in the results sections, there was a strong correlation between adoption of SLWM and agR&D investment.
4 The Sahara desert covers 77 percent of the country, and the Sahel region covers 12 percent of the country (NECSD 2006). The
Sahara is the hyperarid region above the arid sahelian region.

10
Figure 3.1—Agricultural R&D expenditure as percent of agGDP of the selected countries
. Source: Computed from Beintema and Stads 2011.
Fertilizer Policies Nigeria spends about 42 percent of its federal agricultural budget to support fertilizer subsidy (Mogues et al 2008). As a result, application rate of Nitrogen is the second highest—after Kenya (Figure 3.2) Kenya, has the highest nitrogen application rate among the case study countries (Figure 3.2) largely due to its strong input market (Ariga, Jayne, and Nyoro 2006) and policies which have favored investment in agriculture (Ariga, Jayne, and Nyoro 2006; Jayne et al. 2003). Fertilizer is mainly used for cereal production. Maize alone accounts for 26 percent of fertilizer used while sorghum and millet together account for 17 percent of fertilizer used in SSA (FAO 2006).
Figure 3.2—Nitrogen fertilizer application per hectare
. Source: FAOSTAT data.
00.20.40.60.8
11.21.41.6
2004 2005 2006 2007 2008 Average
Ag R
&D
expe
nditu
re a
s % o
f ag
GDP
Kenya Uganda Niger Nigeria
0
2
4
6
8
10
12
14
Niger Uganda Nigeria Kenya Average SSA
Nitr
ogen
/ha
11
Both Uganda and Niger have low application rates of fertilizer (Figure 3.2). One of the reasons for such low adoption rate is the high fertilizer prices in both countries since both are interlocked. Niger’s dry agroclimatic conditions also make fertilizer use riskier and less of a priority compared to moisture and/or land management practices which could address moisture stress.
Decentralization Policies Local institutions play a key role in helping communities to adopt SLWM and to adapt to climate change. The propensity to enact new byelaws in a community is higher in countries with highly decentralized governments than in countries with centralized government systems (Bardhan 2002). This is expected given that decentralization gives mandate for local communities to enact bylaws.
In the discussion below, we review the decentralization policies in the selected countries. Decentralization in Kenya has largely taken the form of deconcentration: delegating of administrative powers by the central government to actors and institutions at lower levels, namely provincial, district (county), division, location, and sublocation administrators (Field-Juma 1996; Ribot 2001). The Kenyan government has recognized this weakness and is currently making concerted efforts to revise the constitution and give the local governments more power to govern and manage local areas. The decentralization policy reforms are likely to have far-reaching implications on natural resource management, such as enacting of SLWM regulations.
Key institutional changes reported during the community focus groups were related to the use of resources, such as water, trees, riverine areas, fish, and rangelands. Several focus groups mentioned new restrictions on the cutting of trees. Indeed, Kenya did implement a logging ban, which was to pertain to designated forests and woodlands. However, there was much confusion about the coverage of this regulation among community members and some forest officers misapplied the rule to include trees grown on farms. In late 2009, the government clarified its intention to regulate cutting of trees in natural habitats and not on farms by proclaiming that all farmers should grow trees on at least 10 percent of their farm area.
Uganda’s decentralization, which started in 1993, devolves most political, legislative, and executive powers to local governments. The Local Government Act of 1997 gives local governments the power to enact bylaws that are consistent with national statutes and policies. Both the National Environment Action Plan (NEAP) and the National Environmental Management Authority (NEMA) have taken advantage of decentralization and the development of local institutions to manage local natural resources and the environment. District and local environmental committees have been formed to enact and enforce environmental and natural resources ordinances and bylaws (Lind and Cappon 2001). A study by Nkonya, Pender, and Kato (2008) showed higher compliance with regulations enacted by local governments than with those enacted at higher administrative levels.
Niger is divided into eight regions, under which there are 36 departments and 265 municipalities (Diarra and Monimart 2006). The part of decentralization that significantly affects SLWM is the Rural Code(Principe d’Orientational du Code Rural Ordinance), passed in 1993. The Rural Code has been one of the policies that enhanced the regreening of the Sahel, as discussed earlier. The Rural Code seeks to provide tenure security and participatory land management of land owned under customary land tenure systems. The Rural Code integrates customary land tenure into the formal law by recognizing private land rights acquired through the customary law or written contracts, and it gives customary leaders the role of resolving land conflicts and enacting natural resource management (NRM) (Toulmin and Quan 2000; Lavigne and Delville 2000). The National Committee of the Rural Code was set up with the mandate to set NRM regulations. One of the major weaknesses of the Rural Code is its requirement that those who own land must put it to productive use; otherwise use rights may be transferred to another person. This requirement has discouraged farmers from practicing long-term fallowing, which could be interpreted as nonuse and result in loss of land rights.
According to Ndegwa and Levy (2004), Nigeria is the third most administratively decentralized country in SSA (after South Africa and Uganda). But as shown below, Nigeria’s overall decentralization index is the sixth largest in SSA. The federal Government of Nigeria Decree No. 23 of 1991 section 4; 221
12
provided executive powers to each local government area (LGA) to enact bylaws and edicts applicable to its area of jurisdiction. However, such laws should be consistent with state and federal laws and statutes. This latter provision is common to all local governments in SSA. However, they weaken the autonomy of local governments to enact and enforce some bylaws and regulations they deem important (Adeyemo 2005).
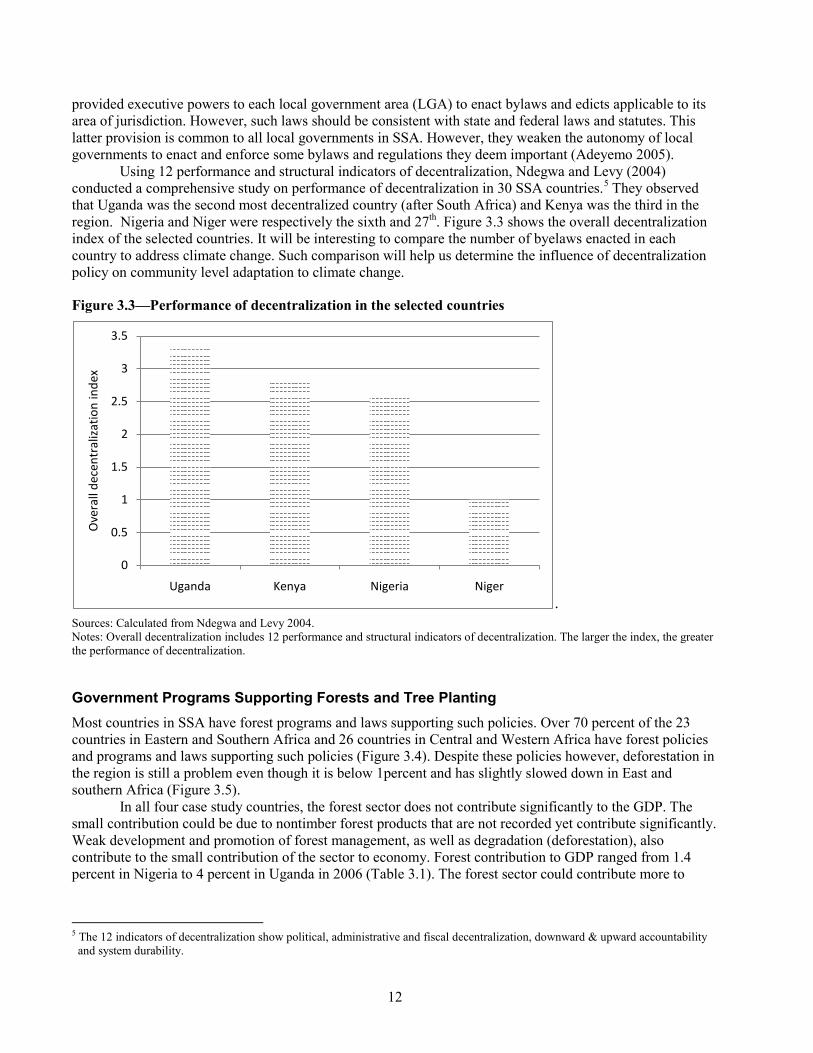
Using 12 performance and structural indicators of decentralization, Ndegwa and Levy (2004) conducted a comprehensive study on performance of decentralization in 30 SSA countries.5 They observed that Uganda was the second most decentralized country (after South Africa) and Kenya was the third in the region. Nigeria and Niger were respectively the sixth and 27th. Figure 3.3 shows the overall decentralization index of the selected countries. It will be interesting to compare the number of byelaws enacted in each country to address climate change. Such comparison will help us determine the influence of decentralization policy on community level adaptation to climate change.
Figure 3.3—Performance of decentralization in the selected countries
. Sources: Calculated from Ndegwa and Levy 2004. Notes: Overall decentralization includes 12 performance and structural indicators of decentralization. The larger the index, the greater the performance of decentralization.
Government Programs Supporting Forests and Tree Planting Most countries in SSA have forest programs and laws supporting such policies. Over 70 percent of the 23 countries in Eastern and Southern Africa and 26 countries in Central and Western Africa have forest policies and programs and laws supporting such policies (Figure 3.4). Despite these policies however, deforestation in the region is still a problem even though it is below 1percent and has slightly slowed down in East and southern Africa (Figure 3.5).
In all four case study countries, the forest sector does not contribute significantly to the GDP. The small contribution could be due to nontimber forest products that are not recorded yet contribute significantly. Weak development and promotion of forest management, as well as degradation (deforestation), also contribute to the small contribution of the sector to economy. Forest contribution to GDP ranged from 1.4 percent in Nigeria to 4 percent in Uganda in 2006 (Table 3.1). The forest sector could contribute more to
5 The 12 indicators of decentralization show political, administrative and fiscal decentralization, downward & upward accountability
and system durability.
0
0.5
1
1.5
2
2.5
3
3.5
Uganda Kenya Nigeria Niger
Ove
rall
dece
ntra
lizat
ion
inde
x

13
poverty and adaptation to climate change by implementing effective policies and institutions for forest development and management and considerable resources are provided to implement them.
All four case study countries have forest policies, programs and laws. Niger is one of the countries which have demonstrated remarkable progress in tree protection and planting. The country passed a forest policy which gave landholders the tenure rights to trees that they planted or protected (Yatich et al. 2008; World Bank 2009). These changes contributed to the sense of ownership and economic incentives that the communities needed in order to participate in protecting the forests. Sales of forest products also helped farmers cope with the country’s risky agricultural production. This has led to significant recovery of the Sahelian regions where they were implemented. A study by Hermann, Anyamba and Tucker (2005) on the regreenig of the Sahel showed more greenness in communities where tree protection and planting projects operated. Such level of greenness in these communities could be explained by change in rainfall (Hermann, Anyamba and Tucker 2005). As a result of this, Figure 3.6 shows that Niger has the largest planted forest as share of total forest area, despite being in the driest zone where survival of tree seedlings is low.
Figure 3.4—Forest policies, programs and laws in SSA
. Source: FAO 2010.
Figure 3.5—Annual change of forest area
. Source: FAO 2010.
0
20
40
60
80
100
120
National forest policy National forest program
Forest law
% o
f cou
ntrie
s with
dat
a
Eastern & Southern Africa Western & Central Africa SSA
-1.0
-0.8
-0.6
-0.4
-0.2
0.0
Eastern & Southern Africa Western & Central Africa
Annu
al ch
ange
(%)
% change (1990-00) % Change (2000-10)

14
Figure 3.6—Planted forest as share of total forest area in selected countries
Source: FAO 2010.
Land Use Changes in the Case Study Countries Globally, land use change has been contributing a large share of greenhouse gas emissions. It is estimated that deforestation and other forms of land use changes contributed 17 percent of global carbon emissions in 2004 (World Bank 2009). The carbon stock endowment differs significantly across the selected countries. Uganda has the highest carbon density (about 20 tons per hectare) and the highest per capita carbon stocks (about 15,000 tons per capita), while Niger has the lowest density and per capita carbon stock (Table 3.2). The deforestation rate in the selected countries ranges from 0.3 percent in Kenya to as high as about 3 percent in both Niger and Nigeria.
Table 3.2—National level carbon stock in the selected countries and rate of deforestation
Kenya Uganda Niger Nigeria Carbon stock (million tons) 425.2 479.8 63.3 1,171.8 Carbon density (tons/ha) 7.30 19.89 0.53 12.88 Carbon stock per capita (thousand tons) 12.06 14.97 4.00 7.00 Contribution of carbon stock to total carbon in Africa (%) 1.0 1.1 0.5 2.7 Deforestation rate per year1 0.3 2.0 2.8 2.9
Source: Calculated from Baccini et al. (2008); 1 Lebedys 2008. Note: Deforestation rates do not include tree cover on farms, which has been noted above to have increased dramatically in Niger.
The main contributor to forest loss in all countries has been expansion of cropland (World Bank 2009). As shown in Figure 3.7, in all four countries forest area has been declining while crop area has been increasing. The change is especially large in Nigeria, where cropland increased by about 21 percent while forest area decreased by almost the same percentage.
0 2 4 6 8 10 12 14
Niger
Kenya
Nigeria
Uganda
% of total forest area

15
Figure 3.7—National level land use changes in the selected countries
Source: FAO 2007.
16
4. METHODOLOGY
This section discusses the site selection, data collection, and analytical methods.
Site Selection Selection of the four case study countries was done to represent SSA regions’ experience and common patterns of climate change. We selected countries sharing boundaries to capture the impact of policies on farmers’ response to climate change. Within the countries, we also matched transboundary sites based on agroclimatic conditions. The selection ensured that the transboundary sites had comparable biophysical and livelihood characteristics and that the major difference between the sites across the border from each other was the policies in the respective countries. Steps used in site selection are described below:
1. Using monthly rainfall data from the Climate Research Unit (CRU) of the University of East Anglia, UK (1981 to 2001) and from the U.S. National Aeronautics and Space Administration (NASA, 2002 to 2007) for the four countries, we computed the mean and standard error of annual rainfall, year trend, and year squared trend coefficients for each pixel (0.5 degree pixel for CRU data and 1 degree pixel for NASA). The regression models also had month dummy variables and a dummy for the period from 2002 to 2007, to account for any shift due to using a different data source for this period. T-tests of the coefficients revealed a linear trend since the coefficients for the quadratic coefficients were not significant. Hence the subsequent steps used only the linear trend model.
2. Using the nearest-neighbor matching procedure (Abadie and Imbens 2007; Abadie, et al. 2004), we selected matching pixels in Niger and Nigeria (West Africa) and in Kenya and Uganda (East Africa) that were from areas having common support in terms of mean annual rainfall were selected based on the mean and standard error of annual rainfall, the rainfall trend coefficient, and the standard error of the coefficient. In some cases one pixel from one country was the best match for more than one pixel from the other country. The matches with the minimum percentage difference in these statistics between the matching pixels were kept. In West Africa, a maximum cutoff point of 10 percent difference was set to ensure that only matches that are close were included in the matched sample. In East Africa, the matching pairs were fewer and therefore the cutoff point was 20 percent.
3. In the case of East Africa, elevation was also included in the matching characteristics to take into account the large differences in terrain.
4. To determine the impact of access to markets and technical support on farmers’ responses to climate change, the matching pairs were further grouped according to market access and presence of SLWM projects.
The selected pixels were overlaid on boundaries of administrative units (districts in Kenya and Uganda, communes in Niger, local government areas [LGAs] in Nigeria), and the pixel that best represented the administrative division was selected. In East Africa, three different agroecological zones (AEZ) were selected. The first was the semiarid zone, where pastoral communities predominate. This zone represents 18 percent of the land area in SSA (see Table 4.1). The matching sites selected were in Samburu district in Kenya and Moroto district in Uganda. In both districts, rainfall and population density are low and the major livelihood is transhumance, although crop production is an emerging livelihood undertaken as a diversification strategy to adapt to climate change. Figure 4.1 shows the selected sites in both regions. The matching sites are also shown.

17
Table 4.1—Land area and human population by agroclimatic zone in Sub-Saharan Africa and the sites selected matching each zone
Zone Area (000 km²)
% of SSA area
% of rural population in SSA
Rural population density (persons/km²)
Sites selected to represent the zone
Arid 8,327 37.3 5.3 1.7 - Semiarid 4,050 18.1 27.0 14.8 Moroto (Uganda); Illela
(Sokoto, Nigeria); Niger; Samburu (Kenya)
Humid 4,137 18.5 28.0 15.0 - Subhumid 4,858 21.7 20.3 9.4 Kamuli (Uganda); Bondo
(Kenya) Highlands 990 4.4 19.4 44.2 Kapchorwa (Uganda);
Bungoma (Kenya) 22,362 100.0 100.0 10.7
Source: Adapted from Jahnke 1982.
Figure 4.1—Case study sites in East and West Africa

18
Figure 4.1—Continued
Source: Authors.
The second AEZ in East Africa was the subhumid zone, receiving rainfall greater than 800 millimeters per year. In Kenya, Bondo district in Nyanza province, bordering Lake Victoria, was chosen. The district is affected heavily by malaria, a disease that has been affected by climate change. The sites matching Bondo in Uganda are located in Kamuli district. The subhumid zone represents about one-fifth of the SSA land area.
The third East African AEZ was the highlands, which accounts for 4.4 percent of the SSA land area. Though small in area, the highlands are important in East Africa in terms of population and agricultural production; in addition, land management in the highlands has important effects on the lowlands. Sites selected in Kenya were located in the Bungoma district in Kenya and the Kapchorwa district in Uganda. In each of the three zones, two villages with high access to markets—one with an SLWM project and another without an SLWM project—were selected. Similarly, two villages with low market access were selected, one with and one without an SLWM project.
A similar approach was used to select case study villages in West Africa. Eight villages were selected in Tahoua region and four matching villages were selected in Sokoto state in Nigeria. An additional four villages were selected from Niger state in Nigeria. To exploit synergies between this study and another on cost–benefit analysis (CBA) of SLWM practices in Nigeria, all eight villages from Nigeria were located in or around the SLWM–CBA study sites that covered larger areas in Sokoto and Niger states.
Data Collection Methods
This study used five major sources of data, each achieving a specific purpose. Detailed discussion of data collection methods is given in the individual country reports. Here we give only a brief description of the data collected and, where necessary, the country in which the data were collected:

19
1. Satellite and secondary data were used to determine changes in land use and cover, and the carbon density of the different types of land use and cover. These data were used to analyze changes in carbon stock at the landscape scale and the contributing influences of different livelihoods and management practices. These data were used in all sites, but for the sites in East Africa additional carbon data were collected from communities and households to determine the carbon density and stock of different use types.
2. Community resource mapping was used to determine biophysical changes and for ground truthing and updating the satellite imagery data.
3. Focus group discussion (FGD) was used to obtain community perceptions on biophysical and socioeconomic changes, the timeline of their occurrence, their drivers and impacts, and community responses to these changes. Information gathered from FGD s was also used to design the questionnaire for the household survey.
4. Household-level data were collected and analyzed to understand the determinants of adaptation to climate change and the impacts of SLWM practices on agricultural productivity. Table 4.2 reports the number of households and communities that participated in the study in each site.
5. Crop simulation models were done in the Nigerian sites that coincided with the SLWM–CBA study, which analyzed returns on SLWM practices.
Table 4.2—Selected sites and household sample in each agroecological zone (AEZ) in each country
Households Kenya1 Uganda Niger2 Nigeria Total
Subhumid 62 69 - - 131 Highlands 60 66 - - 126 Semiarid 63 245 120 428 Total 122 198 245 120 685 Communities 16 16 8 8 48 High market access, with SLWM project 3 3 2 2 10 High market access, no SLWM project 3 3 2 - 8 Low market access, SLWM project 3 3 2 - 8 Low market access, no SLWM project 3 3 2 2 10
Source: Authors’ calculations. Notes: 1 Household surveys in Samburu district were planned but could not be undertaken due to insecurity in the area in late 2009. 2
Four communities and 60 households from Sokoto state (Sudan savannah zone). SLWM indicates presence of a sustainable land and water management project in the community.
Focus Group Discussions Qualitative analysis of drivers and responses, including technological and institutional responses, as well as the impact of the responses were done using focus group discussion and key informants. The focus group discussions were held with members of the general public, but with an emphasis on agriculturalists in all communities selected. About 12 to 15 community members were invited to participate in each group discussion. Participants were selected based on their age, gender, primary activity, knowledge of the community, and knowledge of major changes. Participants were required to be old enough to have good knowledge of major changes that had occurred in the village in the past 30 years. To ensure that women were well represented in the discussion, an equal mix of gender was required. A guideline was used to discuss the following major topics: timeline of major recent events and livelihoods changes, resource management practices and changes, reasons for changes and perceptions of drivers, responses to drivers, institutional responses, and impacts of responses.
20
When discussing drivers of change, care was taken not to lead the group toward specific responses. We were especially concerned that if we mentioned the true emphasis of the project (perceptions of and responses to climate change), this would have biased the community’s responses and given more importance to the issue as compared to other possible drivers. Aspects specific to climate change were probed and pursued after more general questions about changes or drivers were asked.
Household Surveys A common household and plot survey instrument was designed by the team for implementation in all countries. Some adjustments were made to adapt the instrument to suit the needs and circumstances in each country. The household survey captured data on household capital endowment; shocks to the household; climate change perceptions and responses; land holdings, tenure, and management; plot production, inputs, and outputs; livestock assets and production; access to rural services; expenditures on food; and nonfarm income. In Kenya and Uganda, plot-level soil samples were taken from each of the major land use types. To capture farmers’ knowledge of and ability to assess carbon stock, farmers were asked to identify plots that were well or poorly managed, and then soil samples were taken from each of these two categories and compared.
Analytical Methods The qualitative information and data collected from the focus group discussions were compiled and summarized in tabular and graphical format to capture commonality and divergence of responses across different sites.
The household surveys provided for much more quantitative analysis related to the key questions. Descriptive analysis was made on household perceptions of climate shocks and longer-term changes, the effects of the shocks and changes, responses implemented to address those shocks and changes, the impacts of those responses, identification of additional desired adaptation measures, and the constraints in implementing them. Descriptive analysis was also conducted on household capital endowments and the prevalence of household land and water management practices.
A second set of analyses involved econometric methods, including the following: 1. Responses to climate shocks and change (drought, longer-term change) = f (social capital,
human capital, physical capital, access to services, meso-level factors same…) Both models were estimated at the household level. At the plot level, the following models were estimated:
2. Adoption of SLWM = f (social capital, human capital, physical capital, access to services, meso-level factors, land tenure, other plot-level characteristics…). Meso-factors include fixed factors such as agroecological zones, access to roads, and administrative divisions (i.e. district, province, region and state).
3. Relationship between different SLWM practices and plot productivity, risk of production, and soil carbon. Land management practices such as application of manure and organic inputs directly contribute to soil carbon. But since we are using cross-sectional data, we cannot fully capture the impact of SLWM on soil carbon. Likewise the impact of soil carbon on crop productivity cannot be determined using cross-sectional data since soil carbon stock is determined fixed soil characteristics and the historical land management practices. Hence the analysis soil carbon, SLWM and crop productivity will only examine their associations—rather than impact or causality. Specifically, we estimate drivers or associations of crop productivity, yield variance and carbon stock with a number of covariates. We discuss each of the three outcomes below: a. Plot productivity was measured by using the gross value of output per area as well as the
net value per area (subtracting purchased inputs). Value was used because many plots had more than one commodity (for example, maize and beans) and there needed to be some basis for aggregation.
21
b. The risk of production was estimated using the mean-variance method of Just and Pope (1979) to deal with cross-sectional data. In order to estimate the effect of a particular SLWM practice on risk, we divided the sample into those with and those without the SLWM practice. The mean productivity for the subsample was calculated and then for each plot observation a deviation about the mean or variance measure could be calculated. The hypothesis tested was that the SLWM practices would help to reduce the variance of production among those who had adopted the practices.
c. Relationship between specific SLWM practices on carbon stock. This was done to determine the association of specific land management practices and carbon stock. This analysis was not done for all plots since soil samples were taken only from selected plots—well-managed and poorly managed plots for each major land use type.
22
5. RESULTS
Climate Change and Variability in the Case Study Countries We assessed climate change using rainfall data obtained from stations near the case study sites. Although these data may not reflect the actual rainfall where the case study villages were located, the trends were expected to be very similar. The data also covered different time periods. The time period covered depended on data availability. We discuss each country separately and focus only on data from stations near the case study sites.
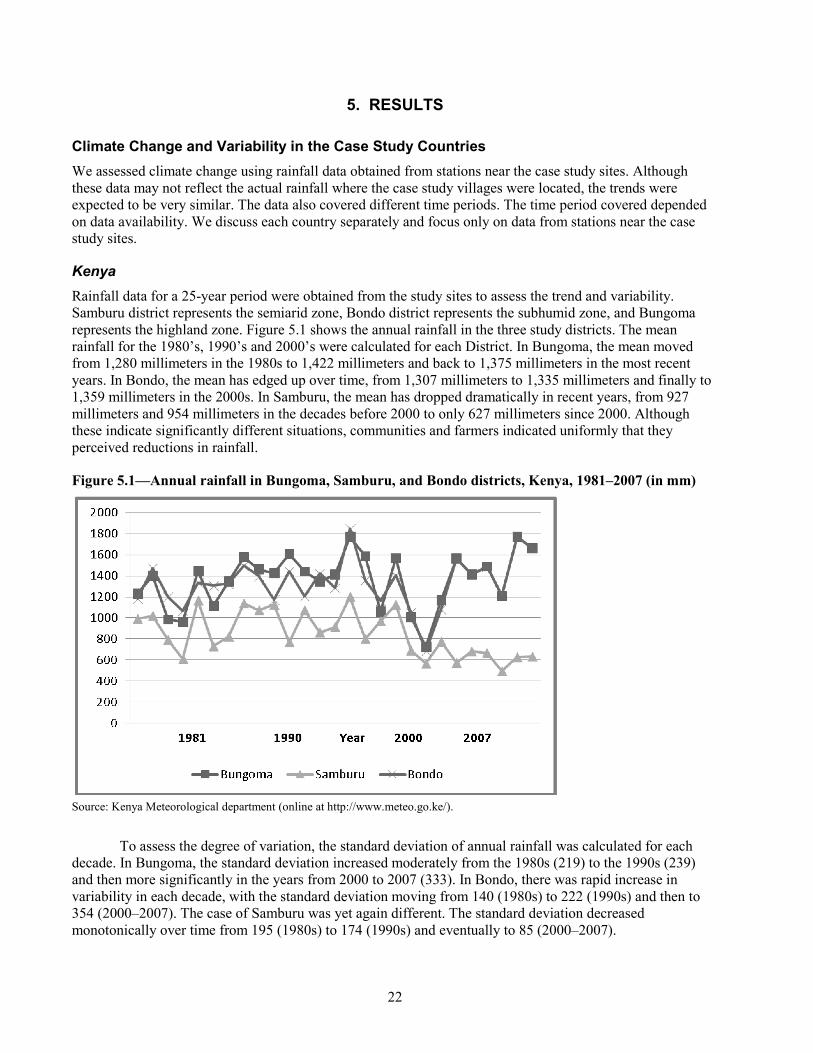
Kenya Rainfall data for a 25-year period were obtained from the study sites to assess the trend and variability. Samburu district represents the semiarid zone, Bondo district represents the subhumid zone, and Bungoma represents the highland zone. Figure 5.1 shows the annual rainfall in the three study districts. The mean rainfall for the 1980’s, 1990’s and 2000’s were calculated for each District. In Bungoma, the mean moved from 1,280 millimeters in the 1980s to 1,422 millimeters and back to 1,375 millimeters in the most recent years. In Bondo, the mean has edged up over time, from 1,307 millimeters to 1,335 millimeters and finally to 1,359 millimeters in the 2000s. In Samburu, the mean has dropped dramatically in recent years, from 927 millimeters and 954 millimeters in the decades before 2000 to only 627 millimeters since 2000. Although these indicate significantly different situations, communities and farmers indicated uniformly that they perceived reductions in rainfall.
Figure 5.1—Annual rainfall in Bungoma, Samburu, and Bondo districts, Kenya, 1981–2007 (in mm)
Source: Kenya Meteorological department (online at http://www.meteo.go.ke/).
To assess the degree of variation, the standard deviation of annual rainfall was calculated for each decade. In Bungoma, the standard deviation increased moderately from the 1980s (219) to the 1990s (239) and then more significantly in the years from 2000 to 2007 (333). In Bondo, there was rapid increase in variability in each decade, with the standard deviation moving from 140 (1980s) to 222 (1990s) and then to 354 (2000–2007). The case of Samburu was yet again different. The standard deviation decreased monotonically over time from 195 (1980s) to 174 (1990s) and eventually to 85 (2000–2007).
23
Uganda Similar to the Samburu district in Kenya, rainfall in the semiarid zone of Uganda (Moroto district) generally decreased during the rainy season (March–August) from its levels in 1981–1985 Figure 5.2, panel (a). This is consistent with the perceptions of Moroto residents, who reported decreasing rainfall. In October, however, the mean monthly rainfall trended upward. Focus group participants may not have taken this increase into account since this is not a planting season. On the variability of rainfall, the coefficient of variation (CV), depicted in panel (b), shows no clear pattern of increasing variability reported by the focus group participants. The trend of CV for October, November, and December actually shows a declining variability. However, these months are in the dry season, in which farmers do not plant crops.
In the subhumid zone (Kamuli district), there was a downward trend for the average monthly rainfall for April and May, the two most important months for the main cropping season in the district, as shown in panel (e) of Figure 5.2. However, the CV of monthly rainfall during the main cropping season (March–June), shown in panel (f), was low. Farmers in Kamuli reported having experienced erratic rainfall, frequent droughts, and new rainfall onset patterns. Consistent with the community perception, however, the CV of monthly rainfall for December and January showed an upward trend.
Figure 5.2—Monthly mean rainfall and variability, selected districts in Uganda
020406080
100120140160
Janu
ary
Febr
uary
Mar
ch
April
May
June July
Augu
st
Sept
embe
r
Oct
ober
Nov
embe
r
Dece
mbe
r
(a) Moroto mean rainfall (mm)
1981-85 1986-90 1991-96 1997-02
0.02.04.06.08.0
10.012.014.016.0
Janu
ary
Febr
uary
Mar
chAp
rilM
ayJu
ne July
Augu
stSe
ptem
ber
Oct
ober
Nov
embe
rDe
cem
ber
(b) Moroto rainfall CV
1981-85 1986-90 1991-96 1997-02
050
100150200250
Janu
ary
Febr
uary
Mar
ch
April
May
June July
Augu
st
Sept
embe
r
Oct
ober
Nov
embe
r
Dece
mbe
r
(c) Kapchorwa mean rainfall (mm)
1981-85 1986-90 1991-96 1997-02
0.0
0.5
1.0
1.5
Janu
ary
Febr
uary
Mar
chAp
rilM
ayJu
ne July
Augu
stSe
ptem
ber
Oct
ober
Nov
embe
rDe
cem
ber
(d) Kapchorwa rainfall CV
1981-85 1986-90 1991-96 1997-02
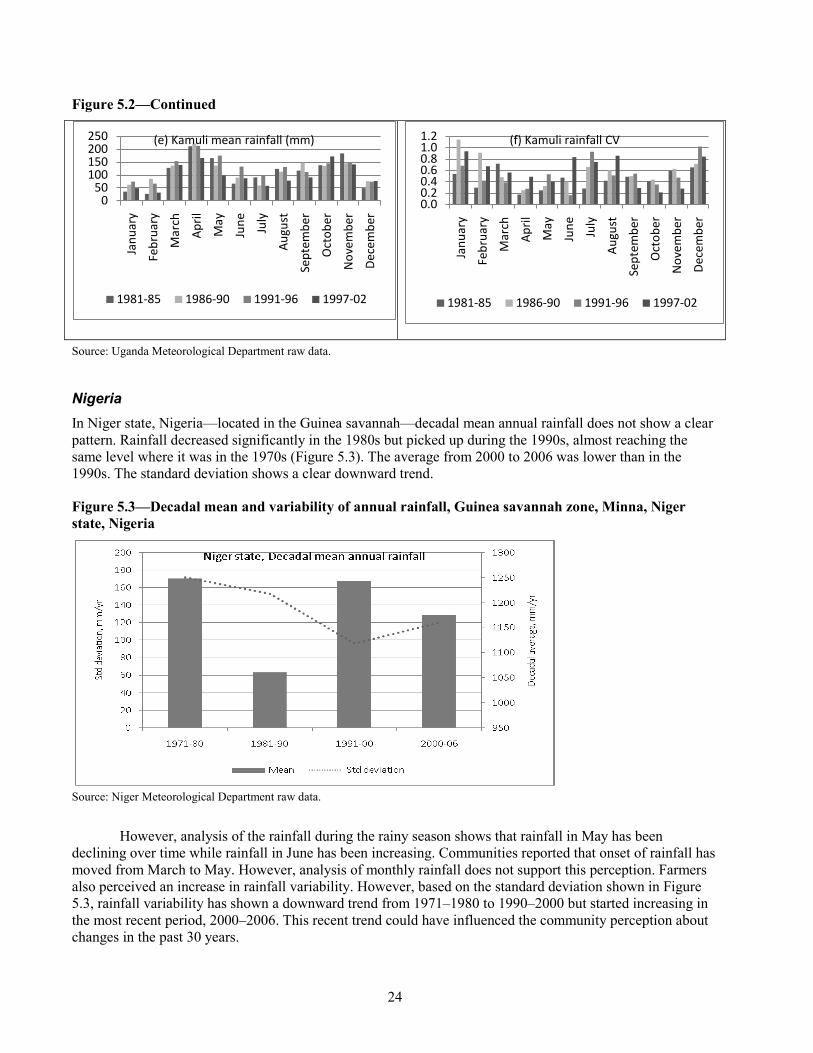
24
Figure 5.2—Continued
Source: Uganda Meteorological Department raw data.
Nigeria In Niger state, Nigeria—located in the Guinea savannah—decadal mean annual rainfall does not show a clear pattern. Rainfall decreased significantly in the 1980s but picked up during the 1990s, almost reaching the same level where it was in the 1970s (Figure 5.3). The average from 2000 to 2006 was lower than in the 1990s. The standard deviation shows a clear downward trend.
Figure 5.3—Decadal mean and variability of annual rainfall, Guinea savannah zone, Minna, Niger state, Nigeria
Source: Niger Meteorological Department raw data.
However, analysis of the rainfall during the rainy season shows that rainfall in May has been declining over time while rainfall in June has been increasing. Communities reported that onset of rainfall has moved from March to May. However, analysis of monthly rainfall does not support this perception. Farmers also perceived an increase in rainfall variability. However, based on the standard deviation shown in Figure 5.3, rainfall variability has shown a downward trend from 1971–1980 to 1990–2000 but started increasing in the most recent period, 2000–2006. This recent trend could have influenced the community perception about changes in the past 30 years.
050
100150200250
Janu
ary
Febr
uary
Mar
ch
April
May
June July
Augu
st
Sept
embe
r
Oct
ober
Nov
embe
r
Dece
mbe
r
(e) Kamuli mean rainfall (mm)
1981-85 1986-90 1991-96 1997-02
0.00.20.40.60.81.01.2
Janu
ary
Febr
uary
Mar
ch
April
May
June July
Augu
st
Sept
embe
r
Oct
ober
Nov
embe
r
Dece
mbe
r
(f) Kamuli rainfall CV
1981-85 1986-90 1991-96 1997-02

25
In Sokoto state, which lies in the Sudan savannah zone, the quantity of annual rainfall has increased since 1989 (Figure 5.4); the decadal comparison of 1985–1995 versus 1996–2005 shown in Figure 5.5 is particularly striking, and the standard deviation of rainfall was lower in 1996–2005 than in 1985–1995. The Illela site, located in southern Republic of Niger but with comparable agroclimatic conditions to those in Sokoto, shows a downward rainfall trend with an increasing variability (Figure 5.6). Even though the period analyzed is short, there is a pattern showing declining rainfall trend and increasing variability in the drier northern Sokoto. The Illela rainfall station is much closer to the selected villages in Sokoto and its downward precipitation trend and increasing variability (Figure 5.6) are both consistent with the perception of communities on climate change.
Figure 5.4—Annual rainfall trend in the Sudan savannah zone, Sokoto, Nigeria
. Source: Nigeria Meteorological Department raw data.
Figure 5.5—Decadal mean and variability of annual rainfall, Sudan savannah zone, Sokoto, Nigeria
Source: Nigeria Meteorological Department raw data.
0
100
200
300
400
500
600
700
800
900
1986
1987
1988
1989
1990
1991
1992
1993
1994
1995
1996
1997
1998
1999
2000
2001
2002
2003
2004
2005
Annu
al ra
infa
ll, m
m/y
ear

26
Figure 5.6—Decadal mean and variability of annual rainfall, Illela, Republic of Niger
. Source: Niger Meteorological Department raw data.
Niger Rainfall trends from 1936 to 2000 at Madoua station in the Sahel zone, which covers only 1 percent of Niger’s surface area (NECSD 2006) are represented in Figure 5.7. This area receives an average of 350 to 550 millimeters of rainfall per year (Figure 5.7). The decadal mean annual rainfall showed a steep decline from the period 1936–1945 to the period 1976–1985, during which there were two prolonged droughts in Niger (1968–1973 and 1977–1985), which caused significant crop failure and livestock decimation. For example, more than 50 percent of livestock died during the 1977–1985 drought (NECSD 2006). Rainfall has been increasing ever since but has not yet reached the level where it was in 1936–1945.
Figure 5.7—Decadal mean and variability of annual rainfall, Madoua station (Sahel zone, Tahoua region), Niger
. Source: Niger Meteorological Department raw data.
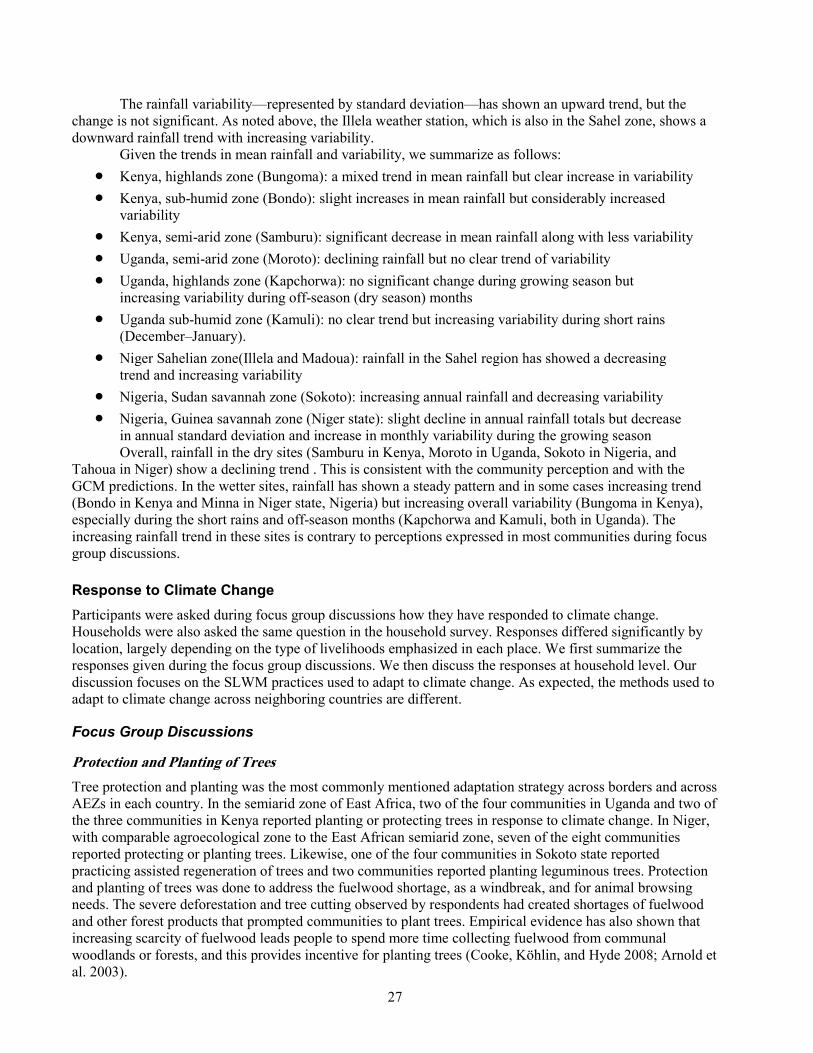
27
The rainfall variability—represented by standard deviation—has shown an upward trend, but the change is not significant. As noted above, the Illela weather station, which is also in the Sahel zone, shows a downward rainfall trend with increasing variability.
Given the trends in mean rainfall and variability, we summarize as follows: • Kenya, highlands zone (Bungoma): a mixed trend in mean rainfall but clear increase in variability • Kenya, sub-humid zone (Bondo): slight increases in mean rainfall but considerably increased
variability • Kenya, semi-arid zone (Samburu): significant decrease in mean rainfall along with less variability • Uganda, semi-arid zone (Moroto): declining rainfall but no clear trend of variability • Uganda, highlands zone (Kapchorwa): no significant change during growing season but
increasing variability during off-season (dry season) months • Uganda sub-humid zone (Kamuli): no clear trend but increasing variability during short rains
(December–January). • Niger Sahelian zone(Illela and Madoua): rainfall in the Sahel region has showed a decreasing
trend and increasing variability • Nigeria, Sudan savannah zone (Sokoto): increasing annual rainfall and decreasing variability • Nigeria, Guinea savannah zone (Niger state): slight decline in annual rainfall totals but decrease
in annual standard deviation and increase in monthly variability during the growing season Overall, rainfall in the dry sites (Samburu in Kenya, Moroto in Uganda, Sokoto in Nigeria, and
Tahoua in Niger) show a declining trend . This is consistent with the community perception and with the GCM predictions. In the wetter sites, rainfall has shown a steady pattern and in some cases increasing trend (Bondo in Kenya and Minna in Niger state, Nigeria) but increasing overall variability (Bungoma in Kenya), especially during the short rains and off-season months (Kapchorwa and Kamuli, both in Uganda). The increasing rainfall trend in these sites is contrary to perceptions expressed in most communities during focus group discussions.
Response to Climate Change Participants were asked during focus group discussions how they have responded to climate change. Households were also asked the same question in the household survey. Responses differed significantly by location, largely depending on the type of livelihoods emphasized in each place. We first summarize the responses given during the focus group discussions. We then discuss the responses at household level. Our discussion focuses on the SLWM practices used to adapt to climate change. As expected, the methods used to adapt to climate change across neighboring countries are different.
Focus Group Discussions
Protection and Planting of Trees Tree protection and planting was the most commonly mentioned adaptation strategy across borders and across AEZs in each country. In the semiarid zone of East Africa, two of the four communities in Uganda and two of the three communities in Kenya reported planting or protecting trees in response to climate change. In Niger, with comparable agroecological zone to the East African semiarid zone, seven of the eight communities reported protecting or planting trees. Likewise, one of the four communities in Sokoto state reported practicing assisted regeneration of trees and two communities reported planting leguminous trees. Protection and planting of trees was done to address the fuelwood shortage, as a windbreak, and for animal browsing needs. The severe deforestation and tree cutting observed by respondents had created shortages of fuelwood and other forest products that prompted communities to plant trees. Empirical evidence has also shown that increasing scarcity of fuelwood leads people to spend more time collecting fuelwood from communal woodlands or forests, and this provides incentive for planting trees (Cooke, Köhlin, and Hyde 2008; Arnold et al. 2003).
28
Livestock and Rangeland Management In the semiarid zones, controlled grazing was reported in all four communities in Uganda and in five of the eight communities in Niger. Pastoral communities in the semiarid zone in Kenya did not report controlled grazing but reported moving livestock to other areas in response to prolonged drought. However, in the highlands (Bungoma district), communities reported disappearance of free-range grazing. Controlled grazing among pastoral communities is contrary to the notion that rangelands used by transhumant communities are open-access commons with no management or improvement (Hoffman 2004). Participants explained that controlled grazing has been prompted by the decreasing pasture, which is due to climatic changes. Communities also reported that decreasing pasture was also due to increasing human and livestock population. Similarly, pastoral communities in Uganda reported controlled access to water resources, which is a result of drying rivers and other water sources. In Niger, seven of the eight villages had established livestock corridors to reduce conflicts between farmers and herders. In Sokoto state, three of the four communities reported harvesting and storing crop residues. Crop residues are used during the dry season and are harvested to save them from livestock from neighbors. This practice will likely deplete more soil carbon due to crop residue harvesting. Animal droppings during grazing of crop residue do fully replenish the nutrient depletion or application of animal manure, whose rate of application is limited due to its bulkiness (Harris 2002).
Irrigation and Water Harvesting Of interest is the lack of irrigation as an adaptation strategy among farmers in the semiarid zones. It was only in Nigeria that two of the four communities in Niger state and one of the four communities in Sokoto state reported using irrigation as an adaptation to climate change. One community in the subhumid district in Kenya also reported using irrigation in response to drought, though on a modest scale. No community in Uganda or Niger reported having used irrigation as an adaptation strategy.
Four of the eight communities in Niger had increased use of zai pits, half-moon-shaped water basins, to trap rainwater. One of the four communities in the semiarid zone in Uganda also reported introducing restricted access to water. Like the case of controlled grazing, restricted access to water resources is a new trend among the pastoral communities and has been prompted by the dwindling water resources. Three of the four communities in the highlands and two of the four communities in the subhumid zones of Uganda also reported an increase in water management.
Early-Maturing Varieties Improved crop varieties provide one of the key technologies for addressing climate change—especially in areas where rainfall is expected to be more erratic or to decrease (Lobell et al. 2008). Planting early-maturing varieties was mentioned in two of the three communities in the subhumid zone of Kenya, in three of the four communities in Niger state in Nigeria, but in none in Niger. In Uganda, one community in the highlands zone and two communities in the subhumid zone reported using early-maturing varieties to address climate change. Surprisingly, no community in the semiarid zone (Moroto district) reported having used improved crop varieties as an adaptation strategy. This could be a reflection of the high production risks and the poor crop extension services in Moroto district, where 12,750 people are served by one public extension agent, compared to about 9,600 people in the humid zone around Lake Victoria (raw data). The lack of adoption of improved crop varieties could also be due to the limited input market access in Moroto (Uganda) and in Niger.
Mulching Mulching has been identified as one of the important SLWM practices for adaptation to climate change. For example, a study in semiarid areas in Kenya showed that mulching could increase the length of the growing season from 110 to 113 days (Cooper et al. 2009). Eight of the 12 communities in Uganda reported mulching as an adaptation strategy. In Kenya, communities in the highlands also reported using more mulch than before. Two of the 4 communities in Sokoto state (Nigeria) also reported mulching, but no communities in Niger and Niger state in Nigeria reported mulching.

29
Fertilizer and Manure Application Two of the three communities in the subhumid zone in Kenya, two of the four communities in both semiarid and subhumid zones in Uganda, and three of the four communities in the highlands zone in Uganda had increased their use of manure. Likewise, four of the eight communities in Niger and two of the four communities in Niger and Sokoto states (Nigeria) had increased their use of manure or fertilizer. Use of fertilizer had increased particularly in both states in Nigeria. Sokoto is among the three states that provide the largest fertilizer state-level subsidy (50 percent) and use of fertilizer in the state is therefore high. As was the case in Niger state, participants stated that one of the reasons for the increased use of fertilizer was to enhance crop production in the face of climate change.
Horticultural Crops One of the most striking revelations of the focus group discussions was the tendency of communities to start using horticultural crops as an adaptation to climate change. One of the three communities in the highlands of Kenya (Bungoma district) reported having switched to horticultural crops. Three of the eight communities in Niger also reported an increase in horticultural crop production. Likewise, three of four communities in Sokoto state also reported increasing production of onions. No community in Uganda reported having switched to horticultural crops. The switch to horticultural crops in Kenya, Sokoto state, and Niger was also driven by new market opportunities and decreasing farm size, and took place in communities with access to irrigation. In all countries, communities explained that switching to horticultural crops—which requires irrigation—is a response to climate change. Due to water scarcity, irrigating small plots on which high-value crops are grown is a rational choice.
Livelihood Diversification and New Crops Contrary to Jones and Thornton (2009), who predicted that climate change would induce a shift from crop production to livestock production in the drylands, one of the three and two of the four pastoral communities in the semiarid areas of Kenya and Uganda respectively reported diversifying their livelihoods by planting crops. Major reasons given for planting crops was the decreasing livestock population due to prolonged drought and cattle rustling in Uganda. However, household-level results showed that all households interviewed reported having experienced 100 percent crop failure due to severe drought. This underscores the riskiness of crop production in the semiarid areas, of which farmers are fully aware. Asked the methods used to adapt to erratic rainfall in the dry environment, three of the four communities in the semiarid region of Uganda reported using mulching. It is ironic that only Uganda reported mulching as an adaptation strategy.
New crops were reported in all countries among predominantly crop farmers. Five of the eight communities in Niger had introduced new crops while all four communities in both Niger and Sokoto states (Nigeria) reported having introduced new crops. No community in Kenya or Uganda reported new crops apart from the horticultural crops mentioned above. However, as will be seen below, some households in Kenya reported growing new crops.
Changing of Planting Date Changing planting date was a common strategy among communities that reported a change in the onset of rainfall in West Africa. None of the communities in Kenya or Uganda reported having changed their planting dates. However, as will be seen below, some households reported having changed their planting dates. All communities in Sokoto state, three of the four in Niger state, and five of the eight communities in Niger reported having changed their planting dates in response to perception of changing onset of rainfall. As discussed earlier, some of the community perceptions are not supported by actual rainfall data, revealing the need for advisory services to help farmers make informed decisions on planting date.
In summary, there have been adaptations within existing activities as well as the adoption of new activities in almost all locations. Pastoral communities in East and West Africa have increased controlled grazing and in some cases controlled access to water, both of which had not previously been common in the transhumant livelihoods. Protection and planting of trees has become a particularly common practice across

30
all countries and AEZs. Of concern is the limited use of irrigation as an adaptation strategy in the dry areas of Kenya, Uganda, and Niger. This is a major problem that increases risks of crop production in dry areas. New varieties and agronomic practices are being used, particularly in Kenya and Nigeria. Horticultural crops have been introduced among communities with access to irrigation.
Overall, the community-level discussions revealed a variety of adaptation strategies, which show the capacity of communities to adapt to climate change, albeit within a host of constraints that limit the level of adaptation.
Household Survey Results Farmers reported a large number of adaptation practices, but some of these were reported by only a small number of respondents. Table 5.1 summarizes the five most commonly reported adaptations by country (West Africa) or AEZ (East Africa). Changing crop varieties and changing crop type were the most common adaptation strategies across all countries and AEZs. In Kenya, farmers shifted away from maize and into other crops such as cassava, millet, beans, and vegetables. In Nigeria, the new crops were wheat, hungry rice (fundi), garden eggs (Solanum melongena), tomatoes, groundnuts, maize, cashew nuts, and soybeans. In Niger, farmers reported switching from cotton and fruit trees to vegetables, sweet potatoes, cassava, beans, and onions. Some of these crop types are more drought-tolerant than the crop replaced, while others—notably vegetables—require more water and irrigation, contrary to the expectation that farmers would move toward more drought-tolerant crops. In all cases, however, farmers switching to vegetables had some form of irrigation. The trend is a reflection of the impact of market access and the tendency to move to high-value crops as a strategy to intensify and maximize returns on the increasingly scarce water and land resources.
Table 5.1—The five most common climate change adaptation strategies reported in East and West Africa (%)
AEZ/Country No
change Change
crop variety
Change crop type
Change planting
dates SLWM
practices1 Change field
location
Kenya Highlands (Bungoma) 24.2 35.5 32.3 27.4 8.3 Subhumid (Bondo) 19.3 35.1 28.1 19.3 19.4 Uganda Subhumid (Kamuli) 17.5 7.0 22.8 5.3 17.6 10.5 Highlands (Kapchorwa) 49.8 18.6 18.6 0 11.9 0 Semiarid (Moroto) 65.0 11.7 10.0 0 6.7 1.7 Nigeria 71.0 8.1 54.0 35.1 - 2.7 Niger 2.4 47 20 4.1 17.0 2.5
Source: Household survey data. Note: 1 Includes soil and water conservation structures, water harvesting, tree planting, manure application, and fertilizer use.
Change of planting date was the third most common adaptation strategy, adopted to address the perception of late onset of rainfall. However, the largest share of households reporting change in planting date were from subhumid areas and highlands in Kenya and Nigeria, not from the semiarid areas of Uganda and Niger, where rainfall variability has increased. Farmers in semiarid regions may feel that planting dates are less flexible due to the limited length of the growing period.
Of major interest is the adaptation to climate change using land management practices. In Kenya, only one household undertook field-level conservation practices, two households started harvesting water in the highlands, and two others changed fertilizer application regimes. In the subhumid zone, a relatively larger share of households (19 percent) reported having made soil and water management adaptations and developing a water harvesting scheme, or planting trees. In neighboring Uganda, the adoption rate of SLWM was highest in the subhumid area (18 percent) and lowest in the semiarid zone (7 percent).

31
About 17 percent of households in Niger reported having used SLWM practices to adapt to climate change and none in Nigeria. As was the case in the semiarid zone of Uganda, however, farmers in Nigeria also reported using SLWM to address short-term climatic shocks. Many farmers in Nigeria and in the other countries also reported having already adopted a range of SLWM management practices required for adaptation to climate change before climate change became a major problem. This will be shown below.
Which Land Management Practices Are Climate Change–Smart and Which Ones Were Adopted? Integrated land and water management practices have been shown to be essential to effective adaptation to climate change in dry areas (Pandey, Gupta, and Anderson 2003; Bationo and Buerkert 2001). Among land management practices, those that increase soil carbon also enhance moisture-holding capacity, improve biological activity, and provide other benefits (Lal 2004), thereby reducing climate-induced production risks. For example, a study in semiarid areas in Kenya showed that mulching could increase the length of the growing period from 110 to 113 days (Cooper et al. 2009). Empirical evidence has also shown synergistic relationships among SLWM practices. Holding all else constant, a household that uses more than one SLWM is likely to have better adaptation than a household using only one SLWM practice. For example, Bationo and Buerkert (2001) observed that water and nutrient management increased water use efficiency and yield response to fertilizer when land and water management were combined. In a long-term soil fertility experiment in Kenya, Nandwa and Bekunda (1998) observed that plots receiving crop residues, fertilizer, and manure registered higher maize yield many years after the start of the experiment than did plots receiving the recommended or higher fertilizer doses. Other studies have also shown similar results (Tittonell et al. 2008; Vanlauwe and Giller 2006).
Adoption of early maturing or drought resistant crop varieties also enhances adaptation to climate change (Lobell et al. 2008). New efforts to develop high temperature–tolerant crop varieties are currently underway (Lobell et al 2008). Likewise, crop varieties that resist climate-induced pests and diseases will also enhance adaptation to climate change. Agronomic management practices such as changing the time of planting to reflect the new climatic patterns and other improved technologies will generally enhance adaptation to climate change.
Hence the climate change–smart land management practices for crop production are those that integrate land and water, enhance soil carbon, and use varieties adapted in the dry areas to address climatic changes. Additionally, a combination of organic and inorganic soil fertility management practices enhances adaptation to climate change and increases crop productivity.
Climate change–smart livestock management practices are related to the land management practices for crops. Livestock breeds for the dry areas should tolerate the expected higher temperatures and reduced water availability. Pasture and rangeland management fall into the category of crop management practices and what has been discussed above also applies to pasture and rangeland management. Grazing regimes should ensure enhanced productivity of livestock. For example, rotational grazing has been shown to increase cattle live weight by up to 63 percent (Walton 1981).
The land management practices adopted in response to climate change in our study sites show limited integrated land and water management (Table 5.1 and Table 5.2). Of the top five SLWM practices used to adapt to climate change, only a small share of farmers reported having used SLWM, including some water management practices. These results are consistent with Yesuf, et al. (2008), Benhin (2006), and Kabubo-Mariara and Karanja (2006), who found limited use of SLWM practices as adaptation strategies. Water management is particularly lacking in Uganda and Niger. A good example of the effect of the partial adaptation to climate change is the case of semiarid zone of Uganda. Farmers reported having started using mulching and manure but did not use irrigation. Consequently, they experienced 100 percent crop failure two years in a row (2007/08 and 2008/09). Contrary to this farmers in Nigeria reported increased use of irrigation, improved varieties, and fertilizer. Communities in Nigeria reported that crop yields have doubled from their level in 1980, largely due to adoption of both land and water management practices. However, results in Table 5.2 does not show high adoption rate since it reports adoption rate in the past 30 years only.

32
Table 5.2—Adoption rates of SLWM practices in selected countries
Variable Kenya Uganda Niger Nigeria % adoption of households
Irrigation 3.4 1.8 4.4 2.5 Alley cropping 13.3 15.5 Fertilizer and organic soil fertility (integrated soil fertility management, ISFM) 33.00 2.0 0.0 7.5 Animal manure 67.95 11.9 1.0 12.1 Fertilizer 36.35 6.1 0.1 45.3 Bench terraces 11.6 3.0 0.6 Composting 28.8 1.0 6.8 Crop rotation 39.1 43.0 0.4 59.3 Deep tilling 2.45 30.8 2.2 Vegetative strips 15.6 12.6 1.2 1.9 Fanya chini1 11.5 6.5 17.7 Fanya juu1 9.95 2.4 0.1 Green manure application 10.55 1.0 4.0 Improved fallow 4.9 1.9 0.6 5.9 Crop residue incorporation 34.4 31.8 0.1 Mulching 35.2 22.2 6.4 0.9 Trash lines 4.05 8.6 Tree planting 37.6 19.6 Zero tillage 0.8 4.7 Zai pits 0.85 0.4 Rotational grazing 7.45 1.8 0.4 0.6 Restricted grazing 7.4 1.8 0.4 0.6 Resting of grazing land 4.95 2.6 2.5 0.0 Weeding of pastures 14.9 0.6 0.0 0.6 Infiltration ditch 3.25 3.9 0.0 0.0 Water harvesting 17.15 0.5 0.4 0.6
Source: Household survey data. Note: 1 Fanya juu = terrace made by throwing soil uphill. Fanya chini is a terrace formed by throwing soil downhill
Even without regard to the reason for adoption, there is still limited use of integrated soil fertility management (ISFM) practices (Table 5.2). Only in Kenya did about a third of farmers report having adopted fertilizer in combination with organic soil fertility management practices (including manure, mulch, crop residues, and tree planting) and other organic land management practices. For the rest of the countries, adoption of fertilizer in combination with organic soil fertility management practice was either very low or zero. This suggests the need to promote integrated land management practices that can effectively enhance adaptation.
Vulnerability and Reasons for Not Responding to Climate Change
In addition to stating what adaptations they have made, farmers were asked to state their reasons for lack of response or lack of additional desired response. The major reason given for not responding to climate change or not more effectively responding was lack of money (Table 5.3). In all countries, lack of money was the major reason cited for failing to take adaptive strategies to climate change or not responding more effectively. For example, money may be required to buy improved seeds or acquire new farming location, both of which are among the five topmost adaptation strategies reported in Table 5.1. However, SLWM practices, changing planting dates may not require money to implement if farmers use only family labor. This confirms the vulnerability of the poor and the high cost of some of the adaptation strategies used by farmers.

33
Table 5.3—Reasons for not responding to climate change (%)
Reason Kenya1 Uganda1 Niger1 Nigeria1 All countries No money 100 42 53.5 44.6 60.0 No inputs 46 12.2 21.3 6.9 21.6 No information on appropriate adaptations 22 33 2.1 15.0 18.0 No access to credit 14 3.5 17.5 26.7 15.4 No access to land 13 8.3 2.1 6.9 7.6 Shortage of labor 23 3.5 3.7 - - No water 58 - - - - Source: Household survey data. Note: 1 Includes households that reported having used an adaptation strategy but desiring to use other methods and unable to do so.
Lack of access to inputs was the second most frequently stated reason for not adapting to climate change. This suggests greater vulnerability for farmers in remote areas where access to agricultural inputs such as early-maturing crop varieties is lower. Lack of information on appropriate adaptation strategies was the third most common reason for failing to adapt to climate change. This is to be expected given the level of uncertainty in predicted and perceived climate change and the lack of a coordinated and operational strategy on climate change adaptation in agriculture. This also underlines the failure of agricultural extension services to provide advice on adaptation to climate change, a problem that is common in SSA, where agricultural advisory services are still focused on crop production.
Other reasons for failing to adapt to climate change included lack of access to credit, land shortage, and labor shortage. But lack of credit is a constraint to adaptation, which required purchased inputs or hired labor. Below we show the results of a multivariate approach to analyzing the variables influencing response to climate change. We analyzed the determinants of adaptation to long-term change in precipitation, variability of rainfall, and change in temperature. We also analyzed the drivers of adaptation to any of these three types of long-term climate change. For brevity, we combine all three types of climate change in our reporting of results.
Drivers of Response to Climate Change Table 5.4 shows that female-headed households in Niger were less likely to respond to climate change than male-headed households.6 The results underscore the vulnerability of female-headed households: Even though they are aware of the climatic changes, they are unable to respond to short-term shocks. In Kenya, Uganda, and Nigeria, however, the gender of the head of household did not have a significant impact. Primary and secondary education did not have a significant impact on adaptation to climate change in all countries. In Nigeria, however, having postsecondary education had a negative influence on the likelihood of responding to climate change. This could be due to the lower degree of dependence on agriculture for households whose head has postsecondary education. Contrary to this, having post-secondary education in Uganda increased the probability to adapt to climate change. The contradicting results from the two countries demonstrate the context specificity of adaptation to climate change. The level of income earned from nonfarm activities by household heads with postsecondary education is not fully reflected by the categorical variable of nonfarm activities used in the model. In all countries, having nonfarm activities reduced the likelihood of responding to climate change. The result on nonfarm income suggests that households with significant nonfarm livelihoods may prefer to respond to additional agricultural risks of climate change by emphasizing responses in nonagricultural areas.
6 Female-headed households in Uganda were also less likely, but the results were not significant at p = 0.10.

34
Table 5.4—Determinants of response to climate change.
Source: Household survey data. Notes: *, **, and *** indicate significance at p = 0.10, p = 0.05, and p = 0.01, respectively. Fixed effects coefficients for each country (districts in Kenya and Uganda, villages in Niger state and Niger) are not reported.
In Kenya, a response to climate change was more likely among households who had been farming for long durations. This is sensible given that experienced farmers may be both more aware of climate change and its impacts and more knowledgeable about how to respond, based on their long experience.
Distance to market in all countries was positively related to response to climate change, suggesting that those in remote areas are more likely to respond to climate change than those living closer to markets. These results are plausible, suggesting that households more remote from markets have fewer nonagricultural options and therefore may take more action in agriculture. This is consistent with the negative association of nonfarm activities with response to climate change discussed above.
Contrary to expectations, access to climate information was negatively associated with response to climate change in Nigeria. However, the major type of climate information farmers received was current weather information, which may not be helpful in deciding on the response to long-term climate change.
Access to agricultural extension services did not have a significant impact on adaptation to climate change. This is a reflection of the weak capacity extension services have to offer advisory services related to climate change. Advice on climate is currently not embedded in the agricultural advisory services and takes place in isolation from the agricultural extension messages (Vogel and O’Brien 2006). This suggests a need to integrate climate change messages into the existing extension services.
Variable Kenya Uganda Niger Nigeria Marginal effects of probit model
Household capital endowment Human capital Ln(household size) - -0.149 -0.125 0.574 Female household head 0.590 -0.098 -0.078* 0.209 Ln(male household members) -0.061 0.146 -0.044 -0.402 Ln(female household members) -0.037 0.22 0.067 -0.123 Education of household head (cf no formal education) Primary 0.479 0.033 0.344 -0.05 Secondary 0.776 -0.033 -0.012 0.081 Postsecondary - 0.431*** - -0.424*** Years of farming 0.039** - - Nonfarm (cf crops) -0.719** -0.175* -0.044 -0.420*** Livestock 0.528*** Physical capital Ln(farm area, ha) 0.024 0.088** 0.009 0.129 Ln(value of farm equipment) - 0.013 0.049*** -0.109** Ln(value of livestock) - -0.005 -0.006 0.01 Irrigation - 0.247** -0.068* -0.278* Access to rural services Ln(distance to agricultural market, km) 0.182* 0.156*** 0.054*** 0.145* Climate information - -0.056 -0.157*** -0.378*** Extension 0.435 -0.008 0.021 0.043 SLWM project -0.100 0.086 0.266* Borrowed from bank or microfinance inst. 0.052 -0.168 -0.001 0.077 Borrowed from nonformal sources 0.132** -0.032 0.183 Belong to savings and credit group 0.499 Belong to marketing group -0.053 Number of observations 109 325 244 58

35
Contrary to expectations and to results implied in the descriptive statistics showing that lack of money was the major reason for failing to adapt to climate change, physical capital endowment—land area and livestock assets—did not have a significant effect on adaptation to climate change. The weak impact of the physical assets could be due to the small sample. As expected, access to irrigation in Uganda increased the likelihood of responding to climate change. Contrary to focus group discussion results, however, farmers with access to irrigation were less likely to adapt to climate change in Niger and Nigeria. This could be due to the way we asked the question. Our question asked farmers if they had observed climate change and if they have taken adaptation strategies in the past 30 years. This could have missed farmers who started practicing irrigation more than 30 years ago hence needing no further adaptation in that area.
What Drives Adoption of SLWM Practices? Above, we analyzed the drivers of response to climate change regardless of the type of response. Below, we discuss the determinants of adoption of SLWM practices, which as discussed above, enhance adaptation to climate change. To better understand where farmers use a given land management practice, we first examine the influence of plot-level characteristics on adoption of SLWM. We then focus our discussion on policy-relevant drivers (see Appendix Tables A.2 – A.6).
Plot Characteristics Plot characteristics were the most important factor influencing use of land management practices in all countries. Fertilizer was likely to be applied on plots with no soil erosion in Kenya but on plots with moderate or severe erosion in Uganda. Fertilizer is used mainly in the eastern highlands (Kapchorwa) in Uganda, where soil erosion is severe. We controlled for district in the model, but this may not have captured the entire influence of the area on farmer decisions. Results in Kenya suggest that farmers are aware of the potential for fertilizer to be lost if applied on erodible plots. Farmers in Uganda are also more likely to apply fertilizer on plots with moderate or poor soil fertility than on fertile soils. This is contrary to Kaizzi (2002) who found that farmers in Uganda are more likely to apply fertilizer on more fertile plots than on poor soils. The results suggest an attempt to rehabilitate degraded plots using fertilizer. Additionally, farmers in Uganda were more likely to apply manure on sandy soils than on brown or red soils and to plant trees (agroforestry) on clay or red soil plots. This suggests manure and trees are used for rehabilitation of plots with poor soils.
In Nigeria, fertilizer was more likely to be applied on plots with gray soils than on plots with sandy soils. Farmers in Nigeria are more likely to use a combination of fertilizer and manure on brown and red soils and fertilizer and compost on gray and black soils than on sandy soils. But farmers in Nigeria are more likely to use manure on sandy soils than on gray, red, black and clay soils. Likewise, farmers in Nigeria are more likely to use manure on plots they perceive to have poor soil fertility than on plots they perceive to be fertile. These results are consistent with those of Kaizzi (2002) and Yanggen et al. (1998), who observed that fertilizer is less likely to be used on poor soils due to its high cost combined with poor expected returns. This suggests that organic soil fertility management practices in Nigeria are more likely to be used on plots with poor soil fertility and fertilizer is more likely to be used on soils with high fertility. In Niger, where fertilizer use is low, mulch is likely to be used on plots with finer soil texture, and irrigation is likelier to be done on clay soils than on sandy soils. A third of plots in Niger had sandy soil texture and another third had clay texture. This suggests irrigation was targeted toward plots with finer texture to avoid percolation that loses water and to ensure maximum returns on scarce water resources. Use of organic soil fertility management on plots with fine soil texture in Niger suggests that farmers maximize returns on such investments by using them on more fertile plots. In Kenya, crop rotations were more likely to be used on smaller plots, more fertile plots, and plots with no erosion. This seems sensible, since it is difficult to forgo production of maize, a staple food planted on larger plots, and since a greater range of crops is likely to be accommodated on the more productive plots. Crop residue management in Kenya appeared to be more common on different plots than the ones where crops were rotated—those that were larger (suggesting the maize plots) and those of slightly less fertility. No other SLWM investments were likely on these lower-fertility plots, which suggests that farmers see crop residue incorporation as a low-level, minimal investment on the poorer plots. They do not appear to

36
view more significant investment on these plots as beneficial. These results are consistent with those observed in Nigeria.
Soil conservation structures in Kenya were more common on more fertile soils but on more eroded (sloping) lands. This again appears to be a perfectly rational strategy to protect the more fragile but productive lands. Similarly, water harvesting was found to be less likely on plots of low soil fertility, which is expected since those plots are the least likely to repay investments in water harvesting.
Unlike those in Uganda, farmers in Kenya were more likely to plant trees and use crop residues on black soils than on sandy soils. Likewise, plots with brown soils were more likely to receive crop residues than those with sandy soils. This is contrary to results regarding soil fertility status and use of organic soil fertility management practices in Uganda and Nigeria, where farmers were more likely to use manure and compost on sandy soils than on clay and other soil colors. Similarly, farmers in Nigeria were more likely to use manure on plots with poor fertility and compost on moderately poor plots, while those in Niger were more likely to use mulching on plots with poor soil fertility than on very fertile plots. This is likely an attempt to rehabilitate poor soils using mulch.
In summary, plots with sandy soils or poor soil fertility were more likely to receive either organic land management practices only or nothing. More fertile plots or those with finer soil texture were more likely to receive fertilizer in countries where fertilizer application level is high (Kenya and Nigeria). These results are consistent with those of other studies and suggest that farmers with poor plots are less likely to make SLWM adaptations to climate change.
Physical Capital Physical capital endowment generally had a favorable influence on adoption of SLWM practices. Greater value of farm equipment significantly increased the probability of adopting fertilizer but reduced the probability of using compost and irrigation in Nigeria and fanya juu terracing and irrigation in Niger. In Uganda, value of farm equipment had a negative effect on the likelihood of using crop rotation and crop residues. In Uganda, livestock increased the likelihood of using manure, mulch, and tree planting. Likewise, in Nigeria, livestock endowment showed a significant positive impact on adoption of fertilizer, irrigation, compost, manure, improved fallow, and a combination of fertilizer and manure or compost. However, livestock value did not have a significant impact on use of most land management practices in Niger. These favorable results of livestock in Nigeria and Uganda underscore the positive crop–livestock interaction observed in other studies and the potential for SLWM for households with both crop and livestock production. Defoer et al. (2000) and Ryan and Spencer (2001) also showed that farmers with both livestock and crops are able to enhance soil fertility more sustainably than those growing crops or keeping livestock only.
Farm area is positively associated with mulch and deep tillage in Uganda. Similarly, irrigation in Niger and Nigeria, and manure and compost in Nigeria are associated with larger farm size, suggesting that these practices are less useful for households with small farms. Consistent with Lamb (2003), mulching and incorporation of crop residue in Uganda and crop rotation and incorporation of crop residue in Kenya were negatively associated with farm size. Contrary to expectation, farm size was negatively associated with improved fallow in Nigeria, even though this was expected to be positively associated with fallowing due to land resource endowment affords farmers the ability to practice any type of fallowing. The negative association of improved fallow to farm size could be due to its higher labor intensity under improved fallow, an aspect, which is not required in the traditional fallow.
Overall, the results suggest that having livestock enhances adoption of both organic and inorganic fertilizer. This suggests the need to promote mixed production of crops and livestock due to their synergistic relationship. Our results also show irrigation is more available to larger farmers, which implies a high vulnerability of small farmers to climate change.

37
Land Tenure Plots held under customary tenure were more likely to receive mulch, crop residues, and crop rotation in Uganda than plots held under freehold tenure.7 Likewise, plots under customary tenure were more likely to receive fertilizer and manure than those held under leasehold tenure in Nigeria. Plots under customary land tenure in Niger were more likely to be irrigated than plots under leasehold. The results are consistent with other studies in SSA (Toulmin and Quan 2000; Platteau 1996; and Deininger 2003) and depict a high security perception that farmers attach to plots held under customary tenure. However, in Niger, fanya juu was more likely to be practiced on plots held under leasehold than those held under customary tenure. Crop rotation in Nigeria was more likely to be practiced on plots held under leasehold than on those held under customary land tenure. Use of manure and crop residues was more likely on plots held under leasehold than those held under customary tenure in Uganda. Land tenure did not have significant influence on use of other land management practices in the case study countries. The mixed set of associations of land tenure with different land management practices suggests that farmers holding land under customary tenure perceive themselves as having the security to invest at least as much as or more than those holding land under leasehold or freehold (in Uganda) with official certificates.
Human Capital Endowment Female-headed households in Kenya were more likely than male-headed households to use fertilizer, conservation practices, and composting, while those in Uganda were more likely than male-headed households to use manure, mulch, deep tillage, and tree planting. Likewise, female-headed households in Nigeria were more likely to apply manure and practice crop rotation while those in Niger were more likely to use mulching than male-headed households. With the exception of fertilizer in Kenya, the results show that female-headed households were more likely to use organic soil fertility management practices than male-headed households. The results in Kenya are contrary to other studies in SSA, which have shown that female-headed households are less likely to use fertilizer than male-headed households (for example, Doss and Morris 2001; Nkonya, Pender, and Kato 2008). The organic soil fertility management practices of female-headed households could be due to their failure to buy fertilizer. However, results in Niger show that female-headed households were less likely to use fanya juu and irrigation, suggesting their limited access to water, which is essential to adaptation to climate change.
In Kenya, a greater number of females in the household increased the likelihood of investing in mulching, crop residues, and composting but was negatively associated with conservation structures, tree planting, and water harvesting. Males in Kenyan households were associated with greater probability of investing in mineral fertilizer and tree planting and lower probability of investing in crop residues. Taken together, the opposing results on men and women in the household suggest that there may be diverging gender interests in tree planting and crop residue incorporation, with men favoring tree planting and women favoring crop residue incorporation. In Uganda, however, the effects of female and male household members tended to move in the same direction. Greater numbers of both were positively associated with mulching but negatively associated with deep tillage and tree planting. The positive association of family labor with mulching is logical given that mulching is labor intensive if mulch has to be cut and transported to plots, as is the case for bananas and coffee in the subhumid AEZ. However, the negative association with deep tillage is surprising since this is also a labor-intensive practice. The number of male household members is positively associated with irrigation in Nigeria but negatively associated with irrigation in Niger. Similarly, the number of female household members is positively associated with manure in Nigeria.
Overall, these results confirm the high labor intensity of SLWM practices and the weak labor market that makes family labor essential to adoption of labor-intensive land management practices. The low adoption of labor-intensive SLWM practices also reflects the tendency of households to opt for using their own labor
7 Note that all lands in Bondo and Bungoma, Kenya, were formerly registered and thus the distinction between customary and
formal tenure is not relevant. Similarly, there were only a couple of rented plots in the sample, so almost all plots were acquired by inheritance or purchase.

38
instead of spending cash to hire farm equipment or laborers to make long-term investments in their land. The results also show that more labor-intensive practices are likely to be adopted by families that have more labor available. Results also show diverging interests or responsibilities among household members, with women more likely to participate in mulching while men are responsible for tree planting and tend plots that receive fertilizer.
The impact of education on adoption of SLWM practices differed across the four countries. In Kenya, more educated household heads were found to be more likely to have adopted mulching, crop residue management, fertilizer, and conservation structures. Similarly, postsecondary education in Uganda was associated with higher likelihood of using crop rotation, mulching, crop residue, and tree planting, while secondary education was associated with fertilizer use and deep tillage. Consistent with other studies (for example, Scherr and Hazell 1994), the household head’s level of education generally has negative or no significant association with land management practices in Niger and Nigeria. This is due to the high opportunity cost of highly educated labor, which makes it more costly to adopt labor-intensive land management practices. It is only crop rotation in Nigeria and fanya chini contouring in Niger that are positively associated with primary education and secondary education respectively.
Overall, the level of education has mixed impact on adoption of SLWM practices: It appears that in East Africa more educated farmers tend to use fertilizer, and in all countries they tend not to adopt labor-intensive practices such as manuring.
Nonfarm income reduced the probability of incorporating crop residues in Kenya; using crop rotation, fertilizer, and incorporation of crop residues in Uganda; using manure in Nigeria; and mulching and practicing fanya chini in Niger. However, nonfarm activities increased the likelihood of using fertilizer and manure and of planting trees in Kenya. The results show complementarity and trade-offs that farmers have to take when they engage in nonfarm activities. Nonfarm activities certainly help farmers to adapt to climate change since they diversify livelihoods and reduce dependence on agriculture, which is heavily influenced by climatic shocks and long-term climate change.
Membership in marketing and savings groups in Kenya was associated with adoption of many land management practices. In Uganda, however, membership in marketing groups was negatively associated with most of the land management practices while membership in production groups was positively associated with use of fertilizer and mulching. Similarly, membership in production groups was associated with fertilizer use in Nigeria and with mulching in Niger. Membership in marketing groups was negatively associated with using fertilizer and manure in Nigeria.
The generally negative or weak impact of marketing groups on adoption of land management practices in all countries could be due to the groups’ focus on marketing rather than production. Similarly, the overall positive impact of membership in production groups on adoption of SLWM practices shows their expected positive influence on adoption of SLWM.
Membership in credit and savings associations increased the probability of adopting mulching, crop residue management, manuring, and soil conservation in Kenya. In Uganda and Nigeria, membership in credit and savings groups increased the probability of using manure. Similarly, membership in credit and savings groups was positively associated with mulching and tree planting in Uganda. It is possible that access to credit increases liquidity and helps farmers to hire labor or farm equipment for transportation of manure. As observed in other studies (for example, Pender et al. 2004), membership in savings and credit groups was negatively associated with fertilizer use in Kenya and Uganda, suggesting that money borrowed is used for consumption purposes or nonfarm activities with higher returns.
Collective action through group membership has often been found to provide farmers with greater access to information, whether through extension, NGOs, projects, or other farmers. This appears to be the case given the range of SLWM practices that have been catalyzed by group participation. The results also underscore the potential synergies of different groups and the importance of encouraging different groups to provide different services required by farmers. In cases where we observe negative association of production group membership with adoption of a given SLWM practice, the reason could be the focus of the production group. For example, the negative association of membership in production groups with irrigation in Nigeria could be due to membership in groups that promote nonirrigated crops (such as cassava). In addition to group
39
orientation, the weak or negative impact of some of the groups could be due to their weaknesses in providing support of SLWM practices. This suggests the need to enhance their capacity through rural development programs that use farmer groups, such as community-driven development. These groups should promote advisory services on land management practices. For example, the demand-driven agricultural extension services offered by the Fadama II project in Nigeria and by the National Agricultural Advisory Services (NAADS) in Uganda offered limited advisory services on SLWM practices (Nkonya et. al. 2010; Benin et al. 2009).
Access to Rural Services Proximity to markets increased the probability of adopting mineral fertilizer, mulching, and tree planting in Kenya; irrigation and crop rotation in Nigeria; and mulching in Niger. The significantly greater likelihood of using fertilizer for farmers closer to agricultural markets is consistent with expectation and reflects high transaction costs for farmers away from the markets. The results in Nigeria also suggest that irrigation is less accessible in remote areas. Farmers in remote areas were more likely to use composting and soil conservation in Kenya, fanya chini in Niger, and manure in Nigeria than those in areas closer to agricultural markets. These results suggest that farmers in remote areas are more likely to use organic soil fertility management practices than those in areas closer to markets.
Access to extension services increased the probability of adopting fertilizer, irrigation, and crop rotation in Nigeria; irrigation in Niger; and tree planting in Uganda. However, access to extension services reduced the probability of adopting manure in Nigeria; mineral fertilizer in Kenya; crop rotation in Uganda; and alley cropping, mulching, and fanya chini in Niger. These results suggest that extension services do not give organic soil fertility management practices a priority in their advisory services, as observed by Nkonya et al. (2010) and Banful, Nkonya, and Oboh (2009) in Nigeria, and Benin et al. (2009) in Uganda. As expected, presence of SLWM projects in a village increased the probability of adopting fertilizer, manure, and compost in Nigeria; alley cropping in Niger; and mineral fertilizer in Uganda.
The different influence of the traditional agricultural extension services and the SLWM projects shows their potential complementarity, also observed by Nkonya et al. (2004) in Uganda. In this case, the traditional extension agents had a significant impact on adoption of fertilizer and irrigation while SLWM projects had significant impact on adoption of organic soil fertility management practices. The results underscore the importance of multiple providers of extension services that have complementarity in provision of different types of technologies. Current efforts to diversify extension services through Fadama III in Nigeria and NAADS in Uganda provide the opportunity to involve NGOs and other service providers who will address the weaknesses of the traditional agricultural extension services. There is also need to increase the capacity of agricultural extension services to promote SLWM practices.
Government Level Policies The four case study countries each offer success stories of policies that enhance adaptation strategies and underscore the impact of policies on adoption of SLWM. The econometric analysis have already shown some factors which are policies and strategies used to implement policies (e.g. rural services), we review some key policies and discuss their potential influence to adoption of SLWM and adaptation to climate change.
Agricultural Research and Development (ag R&D) Kenyan farmers reported the highest adoption rate of integrated soil fertility management (ISFM), manure, water harvesting, and many other organic input practices (Table 5.2), all of which are important for adaptation to climate change. Kenya is also among the few African countries with a large number of international organizations and NGOs supporting agricultural research and extension services. This is consistent with expectation based on the high expenditure on agR&D of Kenya (Figure 3.1).
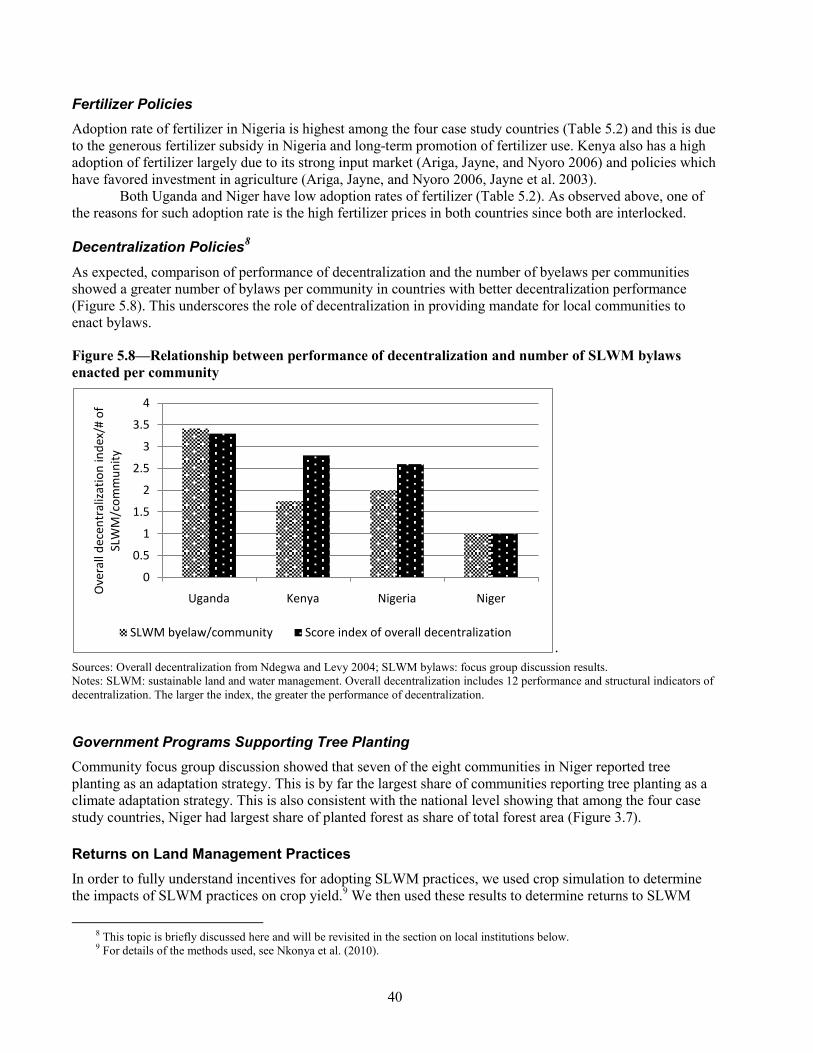
40
Fertilizer Policies Adoption rate of fertilizer in Nigeria is highest among the four case study countries (Table 5.2) and this is due to the generous fertilizer subsidy in Nigeria and long-term promotion of fertilizer use. Kenya also has a high adoption of fertilizer largely due to its strong input market (Ariga, Jayne, and Nyoro 2006) and policies which have favored investment in agriculture (Ariga, Jayne, and Nyoro 2006, Jayne et al. 2003).
Both Uganda and Niger have low adoption rates of fertilizer (Table 5.2). As observed above, one of the reasons for such adoption rate is the high fertilizer prices in both countries since both are interlocked.
Decentralization Policies8 As expected, comparison of performance of decentralization and the number of byelaws per communities showed a greater number of bylaws per community in countries with better decentralization performance (Figure 5.8). This underscores the role of decentralization in providing mandate for local communities to enact bylaws.
Figure 5.8—Relationship between performance of decentralization and number of SLWM bylaws enacted per community
. Sources: Overall decentralization from Ndegwa and Levy 2004; SLWM bylaws: focus group discussion results. Notes: SLWM: sustainable land and water management. Overall decentralization includes 12 performance and structural indicators of decentralization. The larger the index, the greater the performance of decentralization.
Government Programs Supporting Tree Planting Community focus group discussion showed that seven of the eight communities in Niger reported tree planting as an adaptation strategy. This is by far the largest share of communities reporting tree planting as a climate adaptation strategy. This is also consistent with the national level showing that among the four case study countries, Niger had largest share of planted forest as share of total forest area (Figure 3.7).
Returns on Land Management Practices In order to fully understand incentives for adopting SLWM practices, we used crop simulation to determine the impacts of SLWM practices on crop yield.9 We then used these results to determine returns to SLWM
8 This topic is briefly discussed here and will be revisited in the section on local institutions below. 9 For details of the methods used, see Nkonya et al. (2010).
0
0.5
1
1.5
2
2.5
3
3.5
4
Uganda Kenya Nigeria NigerOve
rall
dece
ntra
lizat
ion
inde
x/#
of
SLW
M/c
omm
unity
SLWM byelaw/community Score index of overall decentralization

41
investments. We use results from Nigeria only where crop simulation was done in a cost–benefit analysis of SLWM study (Nkonya et al. 2010). We analyzed the yield response to a combination of the following land management practices: fertilizer, manure, and crop residue. We used a baseline treatment to determine the change in yield when a farmer switches from the baseline land management practice to another practice. The baseline land management practice was no application of any form of organic or inorganic fertilizer but leaving 100 percent of crop residues in the field. In this study, we discuss results for maize and rice. We use the following crops in the analysis; rice, maize, cowpea, cassava, and millet, all of which are important crops in the study countries. Crop simulation was calibrated using experimental data and local biophysical and climatic conditions. However, results from the simulation should be interpreted with caution since – as shown in Table 5.5, the simulated results tend to be greater than the experimental results for most common improved varieties but lower than the new rice for Africa (NERICA). The simulated yield for maize and rice yield (for the 40kgN/ha, 1.67 tons/ha manure and 50 percent crop residue treatment) was respectively 63 percent and 44 percent greater than the corresponding experimental yield (Table 5.5). But the yield potential of the lowland NERICA rice variety is 6-7tons/ha (AfricaRice 2010), which is above the simulated yield for 40kgN/ha, 1.67 tons/ha manure and 50 percent crop residue treatment.
Table 5.5—Comparison of simulated yields with farmer and experimental yields
Crop Actual farmers' yield (tons/ha)
Simulated yield1
Simulated yield2
Experimental yield (tons/ha)
Possible percent increase3
Maize 0.85 4.30 3.26 2.00 135 Rice 1.30 10.24 4.33 3.00 130
Source: ILO JASPA1981. Notes: 1 With 80 kg N/ha, 5 tons/ha manure, 100% crop residue for maize and rice. 2 With 40 kg N/ha, 1.67 tons/ha manure, and 50% crop residues for maize and rice. 3 Farmers’ yields as compared to potential (experimental) yields.
We give, as an example, the maize and rice results, which reflect a clear pattern of the returns on land management practices.10 Figure 5.9 shows that a combination of crop residues, manure, and mineral fertilizer has the highest net benefit for rice and maize. Additionally, the average returns on a day’s labor for all practices were greater than NGN 300, which is the rural daily wage rate in Nigeria (Figure 5.10). This suggests that the land management practices included in the simulation are competitive in the rural labor market. The benefit–cost ratio was highest for land management practices that combined manure, crop residues, and mineral fertilizer. This is consistent with other socioeconomic studies that have shown that integrated soil fertility management (ISFM) practices—which are land management practices that strategically integrate organic and inorganic approaches to soil fertility (Vanlauwe and Giller 2006; Tittonell et al. 2008)—are more profitable than practices using either fertilizer alone or organic soil fertility management practice alone (for example, Doraiswamy et al. 2007; Tschakert 2004; Sauer and Tchale 2006; Mekuria and Waddington 2001).
10 See Nkonya et al (2010) for details of the cost–benefit analysis of other crops.

42
Figure 5.9—Net benefit of land management practices for maize and rice, Niger state, Nigeria
. Source: Nkonya et al. 2010.
Figure 5.10—Returns on labor for maize and rice, Niger state, Nigeria
. Source: Source: Nkonya et al. 2010.
As was shown in Table 5.2, however, the adoption rate of ISFM practices is low in Nigeria, Uganda, and Niger, and relatively high only in Kenya. Only 7.5 percent of plots sampled in Nigeria and 2 percent of plots in Uganda received both fertilizer and manure or compost. No plot sampled in Niger received such a combination. The adoption rate of ISFM was highest in Kenya, where a third of the plots received both treatments. The constraints leading to the low adoption of ISFM—despite its high returns—include lack of livestock (which both produces and transports manure), high labor intensity, poverty, and low capacity of extension services to promote ISFM (Benin et al. 2009; Banful, Nkonya, and Oboh 2009).
As was shown in Table 5.2, however, the adoption rate of ISFM practices is low in Nigeria, Uganda, and Niger, and relatively high only in Kenya. Only 7.5 percent of plots sampled in Nigeria and 2 percent of plots in Uganda received both fertilizer and manure or compost. No plot sampled in Niger received such a combination. The adoption rate of ISFM was highest in Kenya, where a third of the plots received both treatments. The constraints leading to the low adoption of ISFM—despite its high returns—include lack of livestock (which both produces and transports manure), high labor intensity, poverty, and low capacity of extension services to promote ISFM (Benin et al. 2009; Banful, Nkonya, and Oboh 2009).
0
50
100
150
200
250
All z
ero
100%
resid
ue
Man
ure
1.67
tons
/ha,
re
sidue
50%
40kg
N/h
a, m
anur
e 1.
67 to
ns/h
a, 5
0%
resid
ue
Fert
ilize
r 80
kgN
/ha,
no
man
ure,
resid
ue
100%
80kg
N/h
a, m
anur
e 5
tons
/ha,
resid
ue 1
00%
Net
ben
efit
(000
NGN
/ha/
year
)
Rice
Maize
02468
1012
All z
ero
100%
resid
ue
Man
ure
1.67
tons
/ha,
re
sidue
50%
40kg
N/h
a, m
anur
e 1.
67
tons
/ha,
50%
resid
ue
Fert
ilize
r 80
kgN
/ha,
no
man
ure,
resid
ue 1
00%
80kg
N/h
a, m
anur
e 5
tons
/ha,
resid
ue 1
00%
Retu
rns t
o la
bor (
000
NGN
/day
)
Rice
Maize
Rural wage rate
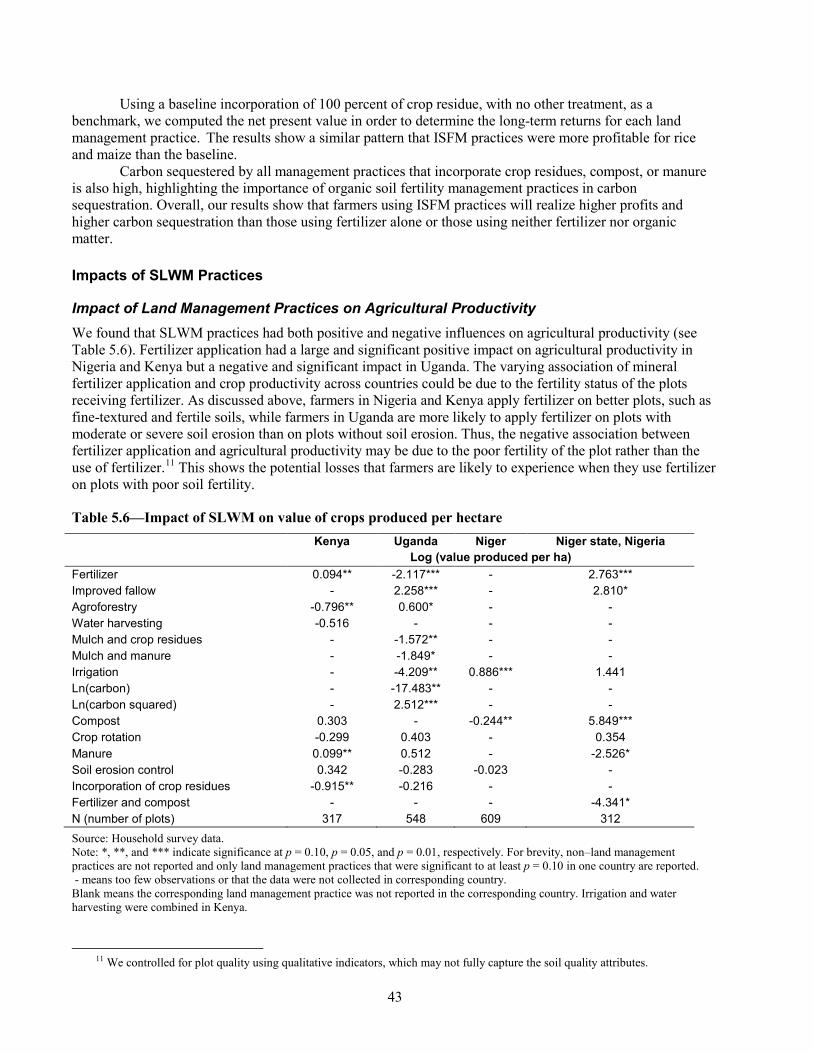
43
Using a baseline incorporation of 100 percent of crop residue, with no other treatment, as a benchmark, we computed the net present value in order to determine the long-term returns for each land management practice. The results show a similar pattern that ISFM practices were more profitable for rice and maize than the baseline.
Carbon sequestered by all management practices that incorporate crop residues, compost, or manure is also high, highlighting the importance of organic soil fertility management practices in carbon sequestration. Overall, our results show that farmers using ISFM practices will realize higher profits and higher carbon sequestration than those using fertilizer alone or those using neither fertilizer nor organic matter.
Impacts of SLWM Practices
Impact of Land Management Practices on Agricultural Productivity We found that SLWM practices had both positive and negative influences on agricultural productivity (see Table 5.6). Fertilizer application had a large and significant positive impact on agricultural productivity in Nigeria and Kenya but a negative and significant impact in Uganda. The varying association of mineral fertilizer application and crop productivity across countries could be due to the fertility status of the plots receiving fertilizer. As discussed above, farmers in Nigeria and Kenya apply fertilizer on better plots, such as fine-textured and fertile soils, while farmers in Uganda are more likely to apply fertilizer on plots with moderate or severe soil erosion than on plots without soil erosion. Thus, the negative association between fertilizer application and agricultural productivity may be due to the poor fertility of the plot rather than the use of fertilizer.11 This shows the potential losses that farmers are likely to experience when they use fertilizer on plots with poor soil fertility.
Table 5.6—Impact of SLWM on value of crops produced per hectare Kenya Uganda Niger Niger state, Nigeria Log (value produced per ha)
Fertilizer 0.094** -2.117*** - 2.763*** Improved fallow - 2.258*** - 2.810* Agroforestry -0.796** 0.600* - - Water harvesting -0.516 - - - Mulch and crop residues - -1.572** - - Mulch and manure - -1.849* - - Irrigation - -4.209** 0.886*** 1.441 Ln(carbon) - -17.483** - - Ln(carbon squared) - 2.512*** - - Compost 0.303 - -0.244** 5.849*** Crop rotation -0.299 0.403 - 0.354 Manure 0.099** 0.512 - -2.526* Soil erosion control 0.342 -0.283 -0.023 - Incorporation of crop residues -0.915** -0.216 - - Fertilizer and compost - - - -4.341* N (number of plots) 317 548 609 312 Source: Household survey data. Note: *, **, and *** indicate significance at p = 0.10, p = 0.05, and p = 0.01, respectively. For brevity, non–land management practices are not reported and only land management practices that were significant to at least p = 0.10 in one country are reported. - means too few observations or that the data were not collected in corresponding country. Blank means the corresponding land management practice was not reported in the corresponding country. Irrigation and water harvesting were combined in Kenya.
11 We controlled for plot quality using qualitative indicators, which may not fully capture the soil quality attributes.

44
Irrigation had a large and positive influence on crop productivity in Niger. This is expected and confirms the importance of land and water management practices in enhancing productivity in dry areas. Improved fallow had a positive influence on agricultural productivity in Uganda and Nigeria. Likewise, the following SLWM practices had a positive influence on agricultural productivity: with the corresponding country in brackets – agroforestry (Uganda), and compost (Nigeria). Past studies in East and southern Africa have also shown the favorable impact of agroforestry on crop productivity (Sanchez et al. 1997). Improved fallow, which includes planting leguminous and other tree species and shrubs, thereby shortening the soil fertility restoration time (Amadalo et al. 2003), also underscores the importance of trees in low-input farming systems. The other land management practices either did not have significant impact or had negative impact on agricultural productivity. The negative association of some organic soil fertility management practices with agricultural productivity could be due to the tendency to use them to rehabilitate degraded plots or plots with sandy soils (as noted in the SLWM adoption section above). Higher C/N ratio can also bind nitrogen and lead to lower yield (Palm 1995; Palm et al 1997).12
In the case of Uganda, we examined the influence of soil carbon stock on crop productivity. We found a U-shaped relationship between crop productivity and carbon stock (Figure 5.11). These results are consistent with those of Marenya and Barrett (2009), who found a similar relationship in Kenya. The results suggest that carbon stock has a threshold that has to be attained before it increases crop yield. This also helps explain some of the negative association of crop productivity with organic soil fertility management practices observed in Uganda and other countries. It is possible that the quantities of carbon stored in the soil when using such practices have not yet reached the threshold required to increase crop productivity. The results suggest that SLWM practices that sequester a large quantity of soil carbon will simultaneously increase crop productivity and contribute to climate change mitigation. As will be seen below, greater carbon stock also helps reduce climate change–related production risks.
Figure 5.11—Relationship between soil carbon stock and crop mean yield and variance in Uganda
Source: Household survey data and lab analysis results of soil samples.
12 For example, Organic input could increase and polyphenol. Lignin content and lignin content above150 g/kg of soil slows N
release considerably. Polyphenol contents above 30 to 40 g/kg of soil could lead to net immobilization of N (Palm, 1995).

45
Impact of Land Management Practices on Mitigation of Climate-Related Production Risks We estimated the effect of land management practices on production risks using cross-sectional data. Overall, SLWM practices reduced climate-related risks that lead to yield variability. Of the 16 coefficients that were significant across all four countries, only 3 were positive, indicating that they increase yield variance and therefore production risks (Table 5.7). The rest (13 coefficients) were negative, suggesting that they reduce yield variance. The results are consistent with biophysical studies, which have shown that organic soil fertility management practices increase moisture storage capacity, which in turn addresses yield variability due to drought and other climate-related changes (Bationo et al. 2007; Bationo and Buerkert 2001).
Table 5.7—Effect of SLWM on crop yield risks (deviation from conditional mean yield)
Variable Kenya Uganda Niger Nigeria Log(variance of value of crop productivity/ha)
Mulch and manure - -2.39 - - Mulch and crop residues - -3.385*** - - Fertilizer and manure - - 1.74 Fertilizer and compost - - 37.85** Alley cropping - -0.132*** - Improved mulching -0.015 3.597*** -0.078 - Improved crop rotation 0.444 -0.901* - -8.41** Improved crop residue 0.714** -1.167** - - Compost 0.432 0.048 -33.45*** Inorganic fertilizer -0.738** -0.313 - 0.89 Improved fallow - -2.168* - 14.95 Farm manure 0.473** 0.449 - -2.1 Water harvesting -0.264 - - Irrigation - 0.394 -0.011 -32.23*** Tree planting -0.097 0.076 - - Fanya chini/soil conservation 0.083 -4.024*** -0.043 - Deep tillage - 0.109 - - Fallow strips - 0.392 - - Trash lines - 1.443** - - Soil carbon - 4.174 - - Soil carbon squared - -0.569* - - N (number of plots) 317 548 609 312
Source: Household survey data. Notes: *, **, and *** indicate significance at p = 0.10, p = 0.05, and p = 0.01, respectively. We controlled for other variables but report only land management practices. Results of other variables included in the model are available upon request from the authors. However, variables used are reported in Table A1 (Kenya), (Uganda), Table A.3 (Niger) and Table A.4 (Nigeria). Means no data collected or small number of observations in the corresponding country.
The study in Uganda also included soil carbon in the model, which shows an inverted U-shaped relationship with crop productivity. The yield variance response to soil carbon is an inverted U-shape, suggesting that after attaining a certain threshold, soil carbon reduces yield variability. The results suggest that carbon stock increases yield and also reduces yield variability above a minimum threshold level, as shown in Figure 5.11.
Below we further analyze the determinants of carbon stock in order to gain a deeper understanding of the drivers of higher soil carbon. We use the data from Uganda, which are currently available.
Land Management Practices and Their Influence on Soil Carbon: The Case of Uganda Soils samples were collected from different land use or cover and different land management practices from the selected households. Four broad land use classes were identified: perennials (bananas, coffee, and orchards), annual crops (beans, sorghum, maize, millet, vegetables, and so on), grasslands, and bushlands or woodlands. To determine the capacity of farmers to assess the carbon stock and fertility of plots, farmers were

46
asked to indicate their best-managed and worst-managed plots and to provide a basis for their perception. Composite soil samples were collected from each land use and land management type at soil depths of 0–15 centimeters and 15–30 centimeters. The soil samples were analyzed in a lab to determine soil carbon under each land use type and level of management (good and poor management).
Farmers perceived soil organic matter (SOM) and fertility generally by soil color, texture, and vegetation. Farmers perceived SOM as the main provider of plant nutrients and the main source of its ability to conserve water. The major strategies farmers in the semiarid zone in northeastern Uganda reported using to maintain or augment SOM levels were manure application, mulching with crop residues, slashing weeds without burning, composting, and shifting cultivation (natural fallow). As shown in Figure 5.12, farmers were able to predict well plots with higher SOM. The difference in soil carbon between well-managed and poorly managed plots was greatest (44 percent) in the semiarid zone, where impacts of land management have the greatest impact due to the low carbon stock. In the subhumid zones and in the volcanic soils in the highlands, fertility attributes other than SOM contribute to higher fertility and reduce farmers’ ability to determine SOM.
Figure 5.12—Difference in soil carbon at 0–30 cm in annual crop plots under good versus bad management, across agroecological zones
Source: Lab results based on soil sample survey taken from plots of farmers participating in household survey.
We also compared the carbon stock across market access (Figure 5.13). As expected and as will be seen below, carbon density in the annual crops in areas with low market access was higher than the equivalent density in the communities with high market access in the sub-humid and highland zones. However, in the semiarid areas with low population density, the converse is the case, suggesting that areas closer to markets provide incentives for communities to invest in SLWM practices or that they are located in more fertile areas. Before discussing the community-level carbon stock and land use change, we examine the influence of different land management practices on soil carbon. We also control for other variables that affect soil carbon, but we report and focus on only the land management practices. We also report only land management practices that affected soil carbon significantly.

47
Figure 5.13—Soil carbon at 0–30 cm in annual crop plots at low versus high market access, across agroecological zones, Uganda
. Source: Household survey data.
The Association between Land Management and Soil Carbon Table 5.8 shows that agroforestry, irrigation, and mineral fertilizer had a significant association with soil carbon. As expected, agroforestry increased soil carbon by 15 percent and mineral fertilizer by 22 percent. Likewise, irrigation increased soil carbon by 35 percent. The impact of the increase is significant at least at p = 0.05. These results are consistent with others that have shown that agroforestry and fertilizer use increases soil carbon (Vlek, Rodriguez-Kuhl, and Sommer 2004; Sanchez et al. 1997). The impact of irrigation on soil carbon could be due to its effect on plant growth. This is especially critical in the dry areas, where moisture is limited. The share of plots irrigated in each zone in Uganda was 2 percent in the semiarid zone, 13 percent in the highlands, and 6 percent in the subhumid zone respectively.
Table 5.8—Impact of land management practices on soil carbon Land management practice Robust regression coefficients Mulch and manure -0.260* Mulch and crop residues -0.188* Agroforestry 0.148*** Irrigation 0.345*** Mineral fertilizer 0.218** Sample size (# of plots) 325
Source: Household survey data. Notes: For brevity, nonsignificant coefficients and non–land management practice coefficients are not reported. For other variables included in the model, see Appendix Table A.3). *, **, and *** indicate significance at p = 0.10, p = 0.05, and p = 0.01, respectively. Results on double log robust regression model.
We did a nonparametric regression to determine the relationship between use of organic soil fertility management practices and soil carbon. Consistent with the work of Cole et al. (1993), who showed a linear and positive relationship between addition of organic matter and soil carbon, our results show a positive relationship between the carbon level and the rate of use of manure, tree planting, irrigation, and fertilizer (Figure 5.14). This highlights the carbon sequestration potential of all of these practices. The results also show the rate of carbon storage with different land management practices. As shown in the multivariate regression analysis, tree planting and irrigation build soil carbon monotonically and at a faster rate right from the beginning. The carbon sequestration from fertilizer application is weak at the beginning, but the rate of
-30
-20
-10
0
10
20
30
40
Subhumid Semiarid Highlands Average
% d
iffer
ence
in so
il ca
rbon
(low
ve
rsus
hig
h m
arke
t acc
ess)

48
soil carbon increases at a higher rate with higher fertilizer rates. The results suggest the importance of organic soil management practices in building carbon stock. This is especially the case for smallholder farmers, who apply small doses of fertilizer. The results further highlight the importance of integrated soil fertility management (ISFM); that is, small farmers applying small doses of fertilizer should not depend on fertilizer to increase carbon stock.
Figure 5.14—Relationship between soil carbon and use of land management practices, Uganda
Source: Household survey data and lab analysis results from soil samples taken from participating households.
A combination of mulch with manure or compost has a negative association with carbon stock. However, the association is only significant at p = 0.10. The negative association is due to the tendency to use mulch on plots with poor soil fertility and with sandy texture, not due to the use of land management practices. Overall, the results show that agroforestry, fertilizer application, irrigation, or other types of land management practices are essential to increasing soil carbon.
Carbon Density across Land Use Types, Land Use Change and Its Impacts on Carbon Sequestration We analyzed land use changes in Nigeria using case studies in Niger and Sokoto states in the Guinea savannah and Sudan savannah AEZs. The results were extrapolated to areas with comparable land use and market access in each zone. The Guinea savannah and Sudan savannah AEZs, which match the land use types and market access of the selected villages, respectively cover 26 percent and 50 percent of Nigeria’s land area. The results show that, at the expense of forest and shrublands, agricultural area in the Guinea savannah zone increased by 40 percent from 1990 to 2000 and by 24 percent from 2001 to 2005. Forest area in the areas with high market access decreased by 26 percent in both periods (1990–2000 and 2000–2005) but increased by 14 percent in the areas with low market access during the same period. However, area under shrublands with low market access decreased significantly due to expansion of agricultural area. Satellite imagery data
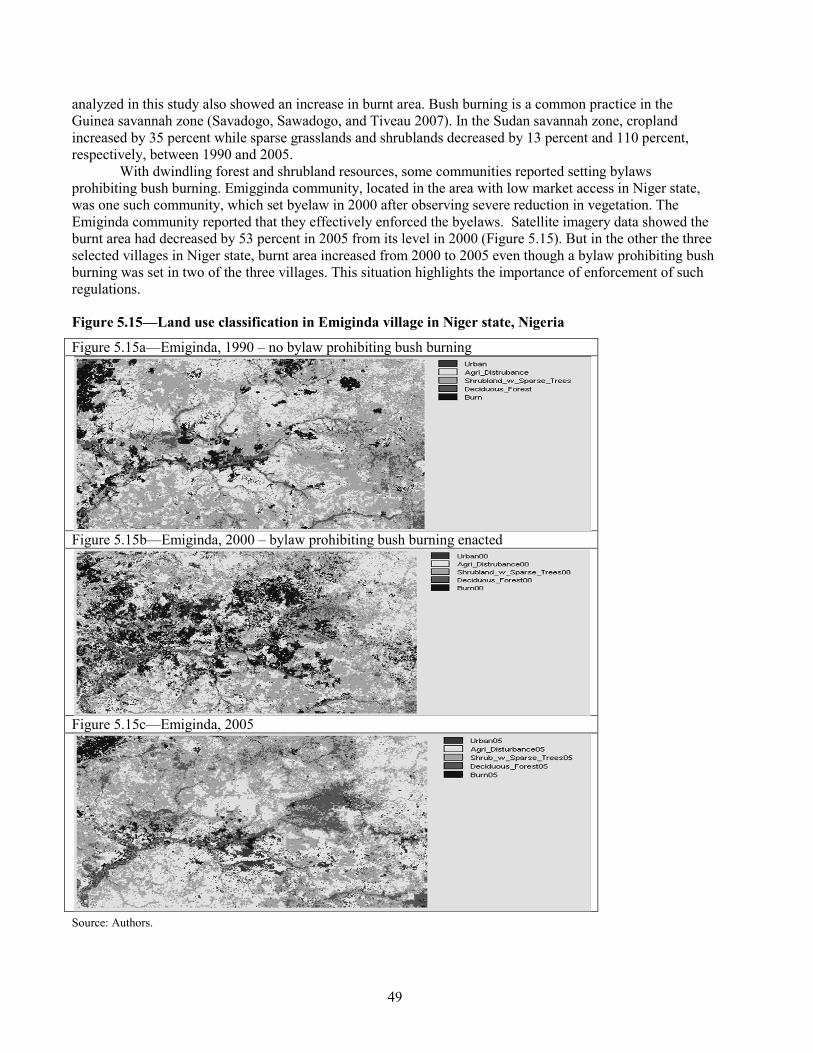
49
analyzed in this study also showed an increase in burnt area. Bush burning is a common practice in the Guinea savannah zone (Savadogo, Sawadogo, and Tiveau 2007). In the Sudan savannah zone, cropland increased by 35 percent while sparse grasslands and shrublands decreased by 13 percent and 110 percent, respectively, between 1990 and 2005.
With dwindling forest and shrubland resources, some communities reported setting bylaws prohibiting bush burning. Emigginda community, located in the area with low market access in Niger state, was one such community, which set byelaw in 2000 after observing severe reduction in vegetation. The Emiginda community reported that they effectively enforced the byelaws. Satellite imagery data showed the burnt area had decreased by 53 percent in 2005 from its level in 2000 (Figure 5.15). But in the other the three selected villages in Niger state, burnt area increased from 2000 to 2005 even though a bylaw prohibiting bush burning was set in two of the three villages. This situation highlights the importance of enforcement of such regulations.
Figure 5.15—Land use classification in Emiginda village in Niger state, Nigeria
Figure 5.15a—Emiginda, 1990 – no bylaw prohibiting bush burning
Figure 5.15b—Emiginda, 2000 – bylaw prohibiting bush burning enacted
Figure 5.15c—Emiginda, 2005
Source: Authors.
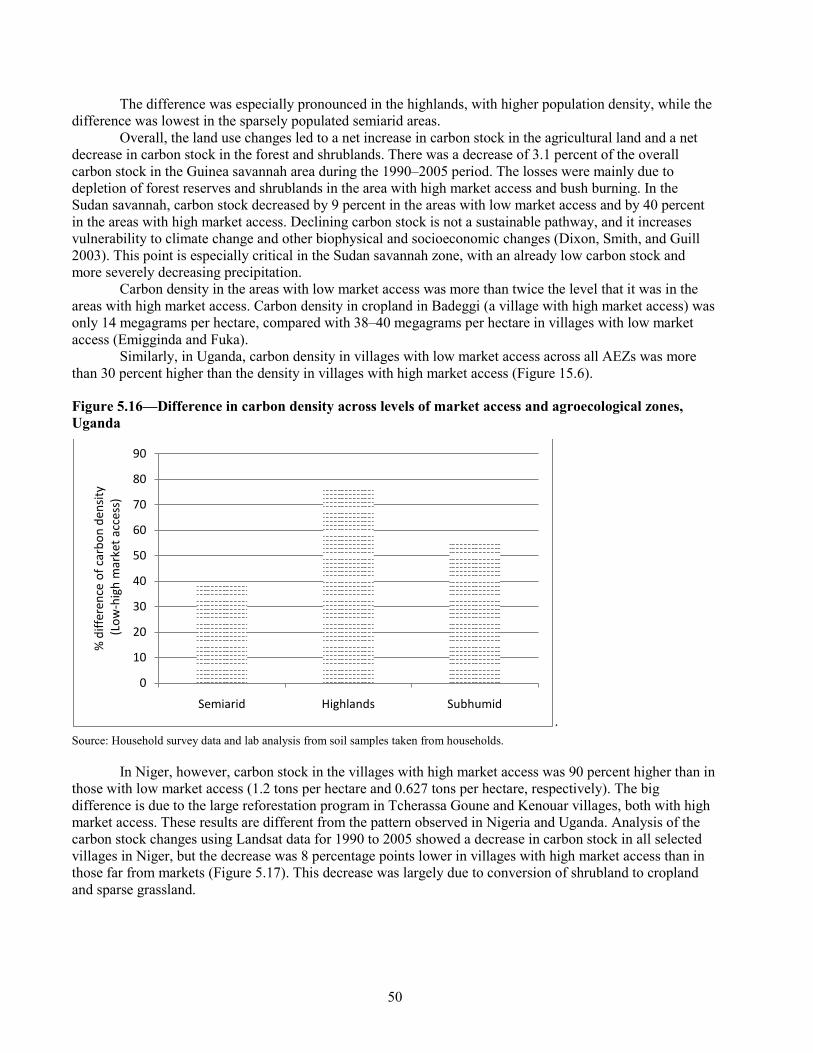
50
The difference was especially pronounced in the highlands, with higher population density, while the difference was lowest in the sparsely populated semiarid areas.
Overall, the land use changes led to a net increase in carbon stock in the agricultural land and a net decrease in carbon stock in the forest and shrublands. There was a decrease of 3.1 percent of the overall carbon stock in the Guinea savannah area during the 1990–2005 period. The losses were mainly due to depletion of forest reserves and shrublands in the area with high market access and bush burning. In the Sudan savannah, carbon stock decreased by 9 percent in the areas with low market access and by 40 percent in the areas with high market access. Declining carbon stock is not a sustainable pathway, and it increases vulnerability to climate change and other biophysical and socioeconomic changes (Dixon, Smith, and Guill 2003). This point is especially critical in the Sudan savannah zone, with an already low carbon stock and more severely decreasing precipitation.
Carbon density in the areas with low market access was more than twice the level that it was in the areas with high market access. Carbon density in cropland in Badeggi (a village with high market access) was only 14 megagrams per hectare, compared with 38–40 megagrams per hectare in villages with low market access (Emigginda and Fuka).
Similarly, in Uganda, carbon density in villages with low market access across all AEZs was more than 30 percent higher than the density in villages with high market access (Figure 15.6).
Figure 5.16—Difference in carbon density across levels of market access and agroecological zones, Uganda
. Source: Household survey data and lab analysis from soil samples taken from households.
In Niger, however, carbon stock in the villages with high market access was 90 percent higher than in those with low market access (1.2 tons per hectare and 0.627 tons per hectare, respectively). The big difference is due to the large reforestation program in Tcherassa Goune and Kenouar villages, both with high market access. These results are different from the pattern observed in Nigeria and Uganda. Analysis of the carbon stock changes using Landsat data for 1990 to 2005 showed a decrease in carbon stock in all selected villages in Niger, but the decrease was 8 percentage points lower in villages with high market access than in those far from markets (Figure 5.17). This decrease was largely due to conversion of shrubland to cropland and sparse grassland.
0
10
20
30
40
50
60
70
80
90
Semiarid Highlands Subhumid
% d
iffer
ence
of c
arbo
n de
nsity
(Low
-hig
h m
arke
t acc
ess)
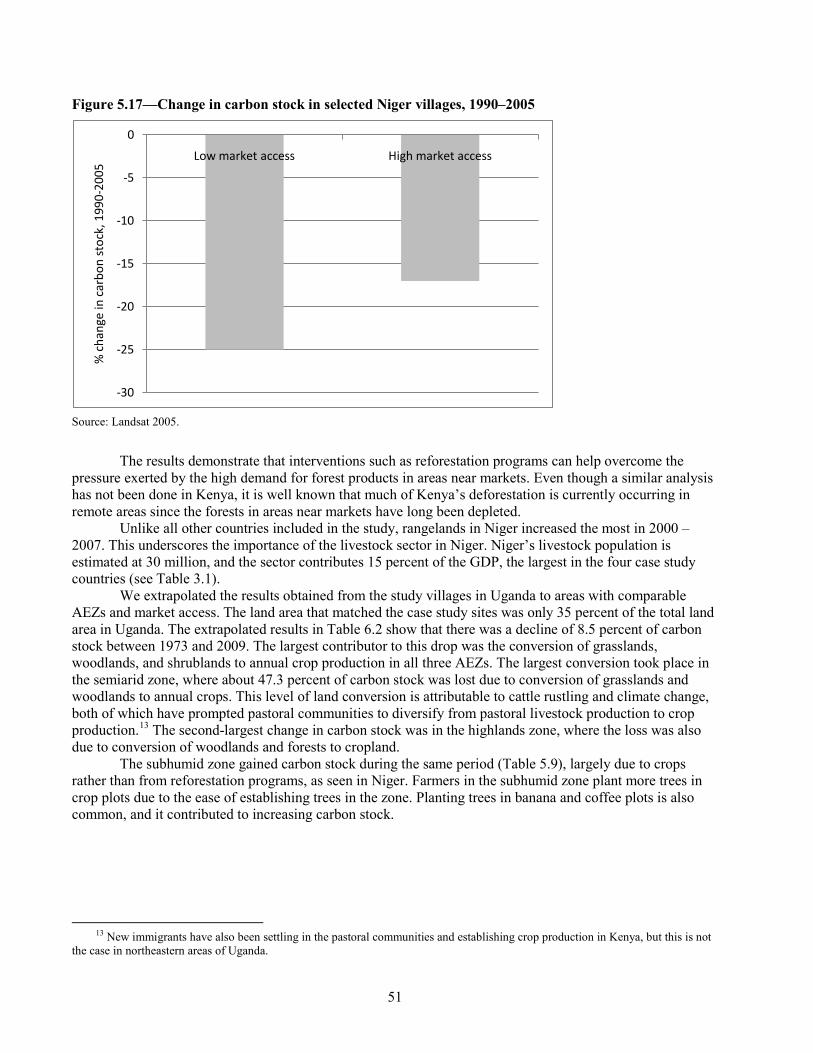
51
Figure 5.17—Change in carbon stock in selected Niger villages, 1990–2005
. Source: Landsat 2005.
The results demonstrate that interventions such as reforestation programs can help overcome the pressure exerted by the high demand for forest products in areas near markets. Even though a similar analysis has not been done in Kenya, it is well known that much of Kenya’s deforestation is currently occurring in remote areas since the forests in areas near markets have long been depleted.
Unlike all other countries included in the study, rangelands in Niger increased the most in 2000 – 2007. This underscores the importance of the livestock sector in Niger. Niger’s livestock population is estimated at 30 million, and the sector contributes 15 percent of the GDP, the largest in the four case study countries (see Table 3.1).
We extrapolated the results obtained from the study villages in Uganda to areas with comparable AEZs and market access. The land area that matched the case study sites was only 35 percent of the total land area in Uganda. The extrapolated results in Table 6.2 show that there was a decline of 8.5 percent of carbon stock between 1973 and 2009. The largest contributor to this drop was the conversion of grasslands, woodlands, and shrublands to annual crop production in all three AEZs. The largest conversion took place in the semiarid zone, where about 47.3 percent of carbon stock was lost due to conversion of grasslands and woodlands to annual crops. This level of land conversion is attributable to cattle rustling and climate change, both of which have prompted pastoral communities to diversify from pastoral livestock production to crop production.13 The second-largest change in carbon stock was in the highlands zone, where the loss was also due to conversion of woodlands and forests to cropland.
The subhumid zone gained carbon stock during the same period (Table 5.9), largely due to crops rather than from reforestation programs, as seen in Niger. Farmers in the subhumid zone plant more trees in crop plots due to the ease of establishing trees in the zone. Planting trees in banana and coffee plots is also common, and it contributed to increasing carbon stock.
13 New immigrants have also been settling in the pastoral communities and establishing crop production in Kenya, but this is not
the case in northeastern areas of Uganda.
-30
-25
-20
-15
-10
-5
0
Low market access High market access
% c
hang
e in
car
bon
stoc
k, 1
990-
2005

52
Table 5.9—Aboveground and belowground carbon stock changes across agroecological zones, Uganda, 1973–2009
Semiarid Highlands Subhumid Total Total aboveground and belowground carbon stock (million tons)
Carbon stock, 1973 175.137 21.944 172.444 369.525
Carbon stock, 2009 92.378 17.126 228.501 338.005
Change as % of initial carbon -47.256 -21.962 32.508 -8.531 Source: Computed from Landsat 2005.
Notes: The corresponding agroclimatic zones to which results of each agroecological zone were extrapolated are as follows: Unimodal moderate rainfall: semiarid zone; unimodal high rainfall: highlands zone; and bimodal moderate rainfall: subhumid zone. For details of agroclimatic zones, see Ruecker et al. (2003).
Table 5.10 shows land use and land use change in Bondo and Bungoma districts in Kenya between 1999 and 2008. In Bondo, agriculture, shrubland, and grassland were the dominant land uses over the entire period, totaling nearly 90 percent of land area. In terms of land use change, smallholder agriculture land use increased a whopping 235 square kilometers or 100% of its size in, mainly at the expense of shrubland. In Bungoma, smallholder agriculture was the most dominant land use by far in the 1990s, comprising just over 50 percent of land area. Woodlands were the second most dominant land use, but their size greatly diminished over the period. The decreases in woodlands, grasslands, and other land uses furnished cropland for smallholder agriculture, which saw its land area increase by nearly 500 square kilometers over the period. In both districts, the expansion of cultivated area does not represent new clearing of natural habitats but rather an intensification of cultivation on what are almost exclusively private lands. In much of Kenya, there is mixed land use on farms, including crops, trees, and grasses. Remote sensing interpretation reclassifies the same land when there is a change in emphasis of the different components.
Table 5.10—Land use change in Kenya (Bondo and Bungoma districts), 1999–2008
Land use Bondo Bungoma
Km2 in 1999
1999–2008 change in km2
% change 1999-2008
Km2 in 1999
1999–2008 change in km2
% change 1999-2008
Forest 3.7 -0.3 -8.1 0.0 0.0
Woodlands 9.1 1.0 11.0 554.6 -322.4 -58.1 Shrublands 434 -203.8 -47.0 4.8 -2.4 -50.0 Agriculture (smallholder) 233.2 235.4 100.9 1194.2 497.9 41.7
Agriculture (plantation) 0.0 3.9
39.7 2.8 7.1
Grasslands 213 -14.1 -6.6 231.2 -175.5 -75.9
Swamps 69.8 -24.6 -35.2 4.5 -2.2 -48.9
Urban 1.6 3.8 237.5 12.1 9.9 81.8 Water 10.9 -1 -9.2 4.4 -0.1 -2.3
Source: Computed from Landsat 1984, 1999, 2008.
In summary, we usually find higher carbon density in remote areas than in areas with high market access. This shows the potential these areas hold for carbon sequestration. Results from Niger, where carbon density in high market access areas was higher than the case in low market access areas, demonstrate that reforestation programs can overcome the pressure exerted by high market access. The results demonstrate that
53
in a semi-arid environment in which trees are scarce and valuable, interventions such as reforestation programs can overcome the pressure exerted by the high demand for forest products in high market access areas. In other countries, such as Kenya, however, the rate of forest loss in the past 30 years is lower in the high market access area than in the low market access since forests in the high market access areas were cleared more than 30 years ago.
In all countries, there has been expansion of cropland, replacing forests, grasslands, and other land use types with higher carbon density. The impacts of the changes on carbon stock have been significant. For Nigeria and Uganda where impacts of the changes was estimated and extrapolated to comparable areas in each country, the overall impact of land use changes contributed to reduction of carbon stock. In Nigeria, the carbon stock in the Guinea savannah zone—which matched the case study villages in Niger state—decreased by 3.5 percent from 1990 to 2005. Likewise, the carbon stock in the semiarid, highlands, and subhumid zones that matched the selected villages in Uganda decreased by 8.5 percent from 1973 to 2009. As stated earlier, the largest loss of carbon stock in Uganda occurred in the semiarid zone, an aspect showing the vulnerability of drier areas. The second-largest change in carbon stock was in the highlands zone, where the loss was due to conversion of woodlands and forests to cropland.
Institutional Responses to Climate Change: Opportunities and Challenges In focus group discussions, communities were asked to discuss the institutional responses to changes. Many changes were reported in the discussion, but the facilitators directed the focus to climate change once it was mentioned. If it was not mentioned, facilitators prodded the participants to report their institutional responses to climate change. Results of this discussion gave insight into the types of responses that have occurred and which ones may be feasible in other sites.
Across all four countries, regulations have been introduced by the central government, local governments, and customary institutions. These regulations have also been introduced as a response to climate change and deforestation, and in conjunction with environmental and agricultural programs aimed at protecting and rehabilitating natural resources. The central government’s climate change–related regulations are not strong and have not been effective at the community level, since only Niger and Uganda have designed NAPAs and their implementation has been weak due to the small budgets allocated and the short-term nature of the proposed activities. The regulations set by local governments have been more focused on climate change, and according to the focus group discussions, the local governments have played a leading role in enacting regulations in response to climate change and other major changes in the past 30 years.
The major regulations introduced in the past 30 years have been related to tree cutting, prohibition of bush burning, access to water, and controlled grazing in semiarid zones. Below we discuss the regulations that have been enacted in response to climate change and other major changes. We discuss these regulations in each country and then synthesize the common features and distinctive characteristics in each country. We discuss the findings from the focus group discussion in the following sections.
Kenya
Regulation of water use was mentioned by focus groups in the highlands district of Bungoma. However, this regulation has not yet been enforced in rural areas. In the semiarid district of Samburu, there were both a government restriction on animal movement in one location (to reduce the spread of disease) and local bylaws on rotational grazing in another (to regenerate degraded grazing areas). In the subhumid district of Bondo, regulations on fishing in Lake Victoria appear to have emerged from a concern with overexploitation and desire to regenerate resource stocks.

54
Uganda Communities were asked to state the steps they have taken to collectively enhance adaptation to climate change. Bylaws requiring community members not to cut trees had been enacted by local governments in all but 1 of the 12 villages included in this study. Interestingly, in 3 villages even the customary institutions had enacted regulations prohibiting tree cutting. An additional 3 villages reported enactment of customary regulations prohibiting cutting of trees in holy areas. Payment of water user fees had been imposed in 3 of the 4 communities in the semiarid zone. As in Kenya, controlled grazing had been enacted by 2 of the 4 communities in the semiarid zone. The enactment of controlled grazing and access to water resources in the pastoral communities in the semiarid zone is interesting and sets a trend that overcomes challenges that past efforts to enforce controlled grazing among pastoral communities have failed to achieve (Mwangi and Ostrom 2009; Nori, Taylor, and Sensi 2008). The changing climate and consequent reduced water availability and pasture degradation are forcing communities to take these adaptive measures.
Analysis of the potential impact of SLWM projects on local governments’ capacity to enact bylaws showed that villages with SLWM projects enacted more bylaws than those without. This shows the importance of projects and programs that enhance the capacity of village institutions to enact SLWM bylaws. However, as seen in Nigeria, presence of SLWM is necessary but sufficient condition for ensuring compliance (Figure 6.1).
Consistent with expectations, comparison of the number of SLWM byelaw enacted in each community and the score of the overall index of decentralization shows a strong relationship (Figure 5.8). This further demonstrates the strong influence of national level policies on adaptation to climate change.
Niger Focus group participants were asked to state the steps their villages have taken to collectively enhance adaptation to climate change. There were few local adaptation strategies initiated at the local level by local actors. The major regulation was establishment of livestock corridors. This was set to reduce conflicts between sedentary farmers and pastoralists, which have been increasing due to dwindling pasture and water resources. In all eight villages, local government bylaws exist that require community members not to cut trees or require authorization of forestry agents to cut trees in community forests or woodlots. As seen above, the Rural Code and other institutional reforms contributed to the regreening of the Sahel in Niger. Compliance with and enforcement of regulations is difficult, but there is evidence that the institutional structure that gives the local communities the right to own trees has enhanced tree planting and farmer-managed natural regeneration and thereby contributed to the regreening of the Sahel in Niger (Reij, Tappan, and Smale 2009).
Nigeria The most common climate change–related regulations enacted in Niger state prohibited bush burning and required protection and planting of trees. Three of the four villages enacted a regulation prohibiting bush burning due to the previously rampant bush burning in Niger state and its consequent impact on pasture and biomass in general. As discussed above, the ban contributed to reduction of the burnt area and underscores the importance of local institutions in enhancing adaptation to and mitigation of climate change.
Customary institutions have also enacted some regulations in response to the recent changes. The customary regulations were largely related to harmonious living, sharing of resources, and tree planting. Given that the local government bylaws varied from one community to the next, these findings demonstrate the synergistic characteristics of the different local institutions in enhancing adaptation to climate change. For example, conflicts over natural resources are likely to increase due to climate change (Barnett and Adger 2007), and customary institutions seem to have taken steps to address this problem.
One community reported no new laws enacted by the local government or by customary institutions because it claimed to have no legal rights to enact such laws. However, as discussed above, local governments have the mandate to enact bylaws that are consistent with state and federal statutes. The absence of local
55
bylaws and regulations could be due to weakness of local government and ignorance of the community about its rights to enact bylaws. This underscores the weakness of local institutions, which is a common problem in SSA (Smoke 2003).
In summary, we find that communities have been taking collective action to address resource changes precipitated by climate change and other biophysical and socioeconomic changes. These initiatives provide an opportunity for the NAPA to take advantage of community awareness of climate change; they also demonstrate the need to collectively and individually take action to address land and water resources. For example, we find that pastoral communities have voluntarily started enacting regulations on controlled grazing, something that was not effective when central governments attempted to restrict mobility of transhumant communities (Mwangi and Ostrom 2009). The major impediment to these actions is the weak capacity of local institutions to enact and enforce these regulations. As seen in the household survey data analysis, knowledge about climate change and the appropriate action required to address it is also weak.

56
6. CONCLUSIONS AND CONTEXT-SPECIFIC POLICY RECOMMENDATIONS
Using selected sites in Kenya, Uganda, Niger, and Nigeria as case studies, this study used secondary data to analyze the long-term trend and variability of rainfall in the different agroecological zones (AEZs) of the selected countries. The study also collected and analyzed data and information from focus group discussions, satellite imagery, and household surveys to determine how rural communities have perceived and responded to climate change and how such responses have affected agricultural productivity and carbon stock. Selection of transboundary study sites with comparable climate change patterns and livelihoods helped to illuminate the influence of country-level policies on response to climate change.
Climate Change Is More Evident in the Semiarid Zones Rainfall in the dry sites (Samburu in Kenya, Moroto in Uganda, Sokoto in Nigeria, and Tahoua in Niger) showed a mainly declining trend with increasing variability. This is consistent with community perceptions and with the global circulation model predictions. In the wetter sites, rainfall has shown a steady pattern and in some cases an increasing trend (for example, in Bondo in Kenya and Minna in Niger state, Nigeria) but increasing overall variability (such as in Bungoma in Kenya), especially during the short rains and off-season (dry season) months (for instance, in Kapchorwa and Kamuli, both in Uganda). The increasing or stable precipitation in the wetter sites is contrary to perceptions expressed in most communities during focus group discussions.
What Drives Response to Climate Change? Household survey results indicated that the major factors that drive response to climate change include gender of household head, level of education, access to rural services, and household capital endowment. Households that heavily depend on agriculture are more likely to respond to climate change than those that have alternative livelihoods, such as nonfarm activities, or that have higher education or are closer to markets, where there are alternative livelihood options. However, a limited household capital endowment and access to rural services lead to nonresponse or to limited effectiveness of responses to climate change. For example, we found that in all countries, communities reported lack of money as the leading cause for nonresponse to climate change or for responses that do not fully address climate change effects. Lack of money could inhibit farmers buying improved varieties suited for the new climatic pattern or hiring labor to adopt SLWM. We also found that in Niger, female-headed households, those with limited household capital endowment, or those with no access to informal credit sources were less likely to respond to climate change. The results confirm the vulnerability of poor households and those with limited access to rural services.
Other factors that limited response to climate change included lack of access to inputs—such as early-maturing varieties—and lack of knowledge of the effective methods for responding to climate change. Additionally, we found that agricultural extension services did not have significant influence on farmers’ response to climate change, implying that they have limited capacity to provide advice on climate change. The traditional agricultural extension services and demand-driven extension services in Nigeria and Uganda still focus on increasing agricultural production, with little effort to advise farmers on climate change. Knowledge about climate change adaptation and mitigation technologies for different AEZs is also still evolving and has not yet been disseminated to advisory service providers. There is a need, therefore, to enhance the capacity of the agricultural extension services to provide advice on climate change, including how to effectively respond to its negative effects and take advantage of its positive impacts.

57
Which Land and Water Management Practices Could Effectively Address Climate Change Risks and What Can Be Done to Increase Their Adoption? This study identified a number of land and water management practices that communities and households have been using. Many have been adopted for productive reasons and not necessarily as a response to climate change, but some were undertaken specifically to effectively address climate change–related risks. The household-level data showed that the major strategies that farmers have been using to adapt to climate change are controlled grazing, water management, new crop varieties, change of planting dates, and to a limited extent, sustainable land and water management (SLWM) practices. These strategies have been shown in other studies (for example, Cooper et al. 2011; Bationo abd Buckert 2001; Lal 2004) to be effective, especially when used in combination.
However, a number of constraints exist that limit adoption of SLWM practices, and for many of them, adoption rates remain low. Adoption patterns of different SLWM practices varied considerably across household- and plot-level variables. For example, some types of SLWM were strongly related to included explanatory variables while others were not. In other cases, certain explanatory variables affected some SLWM practices positively and others negatively. These results show that
1. farmers do understand the different requirements and impacts of the various SLWM technologies,
2. some SLWM practices (e.g. mulching, tree planting) are attractive for almost all household and plot circumstances,
3. it is easier to understand adoption patterns of specific SLWM practices than combinations, and finally
4. implications from our analyses must be looked at in context—there are few generalizations that hold across all sites and all SLWM practices.
Controlled Grazing and Management of Water for Livestock in the Pastoral Communities Is Imperative Focus group discussion results showed that pastoral communities in East and West Africa have increased controlled grazing and in some cases controlled access to water (for example Moroto in Uganda and several communities in Niger), both of which have not previously been common in the transhumant livelihoods. To ensure effective controlled grazing and access to water, pastoral communities in the semiarid zones of the selected countries have enacted regulations. This has been done in response to the decreasing pasture and water resources, which have contributed to loss of livestock. Past top-down efforts by central governments to restrict mobility of transhumant communities were not effective (Mwangi and Ostrom 2009), but these community-based institutions offer more optimistic possibilities for effective grazing land and water management in the pastoral communities. In addition to overgrazing, conversion of rangeland to croplands is causing much of the depletion of carbon stocks in semi-arid areas, which increases vulnerability to climate change. Strategies are required to minimize such conversion by enhancing the current trend of controlled grazing in order to make the pastoral livelihoods more sustainable under the new climatic pattern.
Tree Planting and Protection Is a Win–Win–Win Strategy: It Increases Crop Productivity, Reduces Climate-Related Production Risks, and Sequesters Carbon Protection and planting of trees was the most frequently mentioned adaptation strategy in Kenya, Uganda, and Niger and across all AEZs. In addition to the multiple uses of trees that help reduce vulnerability, household-level data from Uganda showed that planting trees on crop plots increases soil carbon by 15 percent. It also possible that farmers plant trees on plots with higher soil carbon, which hold more moisture and therefore are where trees are more likely to survive. The household results also showed that soil carbon simultaneously increases crop productivity and reduces climate-related production risks after attaining a certain threshold. The results show the potential of trees to increase agricultural productivity and reduce climate-related

58
production risks and sequester carbon. Our empirical results also show that trees are planted in plots with soil erosion in Kenya and Uganda and on sandy soils in Uganda. This suggests two additional roles that trees play: prevention of soil erosion and rehabilitation of eroded soils. Of course, not all trees are the same, and in Kenya, where many of the planted trees were timber trees (for example, in woodlots), there is then a trade-off of tree production with crop production. There can also be a tradeoff of tree production with crop production because of competition for water and light as well as competition for land. In dry areas, competition for water may be a serious constraint to planting trees in crop areas, though more so in densely populated areas (like the northern Ethiopian highlands) and not so much of a concern in Niger and northern Kenya and Uganda.
Tree planting faces a number of problems, especially in the dry areas, where they are most required. Female-headed households in Kenya were less likely to plant trees, as were households with small farms. These results demonstrate two problems: competition for space with crops (which is also more severe for female-headed households) and the fact that women across Africa do not yet enjoy the same rights as men to plant and manage a variety of trees. One of the solutions for addressing these problems is promoting leguminous trees and shrubs that can provide multiple benefits, including enrichment of the soil and feed for livestock. Several different systems have been developed that not only reduce competition between trees and crops but also increase crop production (see Sileshi et al. 2008). Moreover, trees and shrubs grown mainly for soil enrichment and fodder have found wide uptake by women because these are seen more as inputs than as trees by community institutions.
We also found that access to extension services in Uganda was critical in enhancing tree planting. Unfortunately, advisory services on agroforestry and forestry are weak in SSA. Agroforestry planting materials also remain a challenge that will require targeted efforts to develop community-driven or private nurseries and to ensure that farmers directly benefit from planting trees. Current reforestation efforts such as the Great Green Wall and the Green Belt Movement, both aimed at stopping the southward spread of the Sahara desert in West Africa, could be designed to ensure that communities directly benefit from the trees they plant. Bylaws reported in most communities covered in this study only require that communities plant trees and protect standing trees. The bylaws or other strategies say little about direct benefits. A good example of a successful tree management campaign that provided incentives was Niger’s farmer-managed natural regeneration (FMNR) tree planting and protection. FMNR was implemented following the prolonged droughts in the 1970s and 1980s (Reij, Tappan, and Smale 2009). The Rural Code and other institutional reforms allowed communities to own and benefit from trees by harvesting fuelwood, fodder, and nontimber tree products (Reij, Tappan, and Smale 2009). Such efforts have been successful in Niger thanks to a strong collaboration of government and civil society that provided significant technical support and conducive policies that both promote tree planting and ensure that those planting or protecting trees also benefit directly. The success story in Niger shows the impacts of policies on adoption of SLWM practices and to adaptation to climate change. While satellite images show regeneration in the Sahel zone of Niger that cannot be explained by increased rainfall alone, the Sahel zone in northern Nigeria, with comparable rainfall conditions, shows a lower rate of regeneration.
Integrated Land and Water Management Practices Are Climate Change–Smart and More Profitable, but Their Uptake Is Low There was limited use of irrigation and water harvesting practices as adaptation strategies in the dry areas of Kenya, Uganda, and Niger and in the areas of Nigeria with low market access. For example, no community mentioned irrigation as an adaptation strategy in Uganda. As a result of this weakness, communities in the semiarid zone reported crop failure for two consecutive years even though they had adopted a number of land management practices, including mulching, tree planting, and the like. It appears what was lacking in the adaptation strategy was irrigation, rainwater harvesting, and other water management practices, which could have helped to offset rainfall variability, prolonged droughts, and related climatic shocks. In Nigeria, however, communities have adopted small-scale irrigation in the floodplains, early-maturing varieties, and fertilizer. As a result of these practices, farmers reported an increase of 100 percent in the yield of their

59
irrigated crops compared with non-irrigated crop yields in 1980. This shows that it is possible for smallholder farmers to effectively adapt to climate change when they use both land and water management practices.
Even in communities where irrigation and water management practices are common, our study shows that female-headed households and those with small farms in Niger and Nigeria are less likely to use irrigation. Additionally, farmers in remote areas in Nigeria are less likely to use irrigation than those near markets. This suggests that the poor, those in remote areas, and those in dry areas are less likely to effectively respond to climate change due to their limited access to irrigation. The results point to the need to target programs supporting irrigation and water management toward women, the poor, and those in remote areas. Current efforts such as Fadama II and III in Nigeria, which promote small-scale irrigation, have been targeting women and the poor. However, there is no targeting of communities in remote areas. Our study has shown that communities in remote areas in subhumid and highland areas have higher carbon density, suggesting that they are providing greater ecological services than communities in high market access areas – hence the need to explore opportunities to reward them. However, we find that in Niger, carbon stocks in communities with higher market access were greater than the stock in communities with low market access. This result demonstrate the potential impact of tree planting programs, which were more pronounced in communities with higher market access. The results are also consistent with global level results which have shown a positive association between population density and greenness (Bai et al 2008).
Land management practices that combine crop residues, manure, and fertilizer have higher benefit–cost ratio, are estimated to generate greater returns on labor, and store more carbon stock than any of the three practices used alone on maize and rice. However, despite their high returns and competitiveness in the labor market, adoption rates of fertilizer in combination with any organic soil fertility management practice are low in Uganda, Niger, and Nigeria. About a third of farmers in Kenya, only eight percent, two percent, and none of the sampled farmers in Nigeria, Uganda, and Niger, respectively, used one of the organic soil fertility management practices in combination with fertilizer. This is due to a number of constraints that limit adoption of these methods, including low endowment of livestock and other forms of capital , gender of household head,and lack of access to market and agricultural extension services . The capacity of agricultural extension services in all countries to advise on organic soil fertility management is low. This weakness could be addressed by using pluralistic agricultural extension services, including providers with capacity to offer advisory services on organic soil fertility management. For example, we observed that in Nigerian villages with an SLWM project, farmers were more likely to use a combination of fertilizer and organic soil fertility management.
Ownership of livestock also increased the likelihood of adopting many of the organic soil fertility management practices, underscoring the role that livestock play in nutrient recycling through production of manure and transportation of bulky inputs. Hence, efforts to promote production of mixed crop–livestock systems can help to achieve affordable and sustainable land management practices. This is especially crucial for rehabilitation of degraded soils or sandy soils. Focus group discussion results also showed that livestock production has been increasing as part of adaptation to climate change and in response to emerging demand for livestock products. To enhance this trend, efforts are required to increase livestock productivity. The contribution of livestock to the agricultural GDP in the four case study countries ranges from 5 percent (in Nigeria) to 15 percent (in Niger) even though grassland in all countries occupies a larger share of the land area than cropland. The low productivity of livestock in SSA—despite the increasing demand for livestock products and their role in achieving sustainable land management practices and food security—requires concerted efforts to give the sector more attention as countries design policies and strategies for adaptation to and mitigation of climate change. This is especially important given that the livestock sector offers a resilient option for adapting to climate change in the semiarid zones of all four countries, and because conversion of rangeland to cropland (which may be hastened by inadequate response to climate change) is a major factor contributing to depletion of the carbon stock in semi-arid areas.
In the case of poor farmers with few or no livestock, other methods of restoring and enhancing soil fertility could include promotion of agroforestry practices. Planting leguminous trees has been shown to enhance soil fertility and increase crop yields significantly in East and southern Africa (Sileshi et al. 2008; ).

60
Unfortunately, adoption of agroforestry practices is limited in Nigeria and needs to be enhanced in all countries. Strategies for enhancing adoption of agroforestry have been discussed above.
Female-headed households were more likely to use organic soil fertility management practices but were less likely to use fertilizer and irrigation than male-headed households in most of the sites. This highlights the limited financial capital that constrains female-headed households to obtain fertilizer and to have access to irrigation. The results further show the vulnerability of women and the constraints they face in achieving climate change–smart land and water management practices.
Improved Crop Varieties, Animal Breeds, and Agronomic Management Practices Are Required to Address Climate Change Use of new crop varieties was one of the most common adaptation strategies reported by communities and households. Efforts to develop crop varieties and animal breeds that can adapt to the changing biophysical environment are required. For example, the breeding programs for maize in Kenya supported by extension services and high market demand led to an 87 percent adoption rate of improved varieties (Smale and Jayne 2008) and high returns on research investments. Agronomic practices such as changing the time of planting were also reported as adaptation strategies. Research is required to ensure that the current perception of change in the onset of rainfall reported by almost all communities is validated and integrated into the development of cropping calendars for all crops. Advisory services on climate change discussed above should use such results to advise farmers on time of planting and other practices for adaptation to climate change.
Linkages between SLWM and Climate Change The information received from focus groups and households shows that while there is a high level of awareness of climate change and a reasonable awareness and adoption of SLWM, the actual use of SLWM for climate change adaptation and mitigation is so far very limited. In response to climate change, households were much more likely to make shifts in cropping choices or planting dates than to adopt SLWM. On the other hand, many households are using SLWM practices that were adopted for other reasons, the main one being to enhance agricultural productivity. Reinforcing the connection between SLWM and climate change would be an obvious and needed step to enhance the adoption of practices whose importance only increases under the threat of climate change. However, severe shocks such as severe drought may lead to crop loss – as reported by communities in northeastern Uganda and Niger. This means SLWM are important but they may not address such shocks. As demonstrated by the pastoral communities in the case study countries, diversification of livelihoods is an important strategy for adaptation to climate change and to climatic shocks. Irrigation could also overcome such serious climatic shocks, if water is available.
The Role of Strong Local Institutions and Farmer Groups As seen above, communities have been taking collective action to address resource changes precipitated by climate change and other biophysical and socioeconomic changes. These initiatives provide an opportunity for the NAPAs to take advantage of local communities’ awareness of climate change and their interest in taking collective and individual actions to address the land and water resources affected most by climate change and other changes. Communities realize the weaknesses in the local institutions to enact and enforce compliance with natural resource management rules. For example, when asked about the strategies communities plan to take to adapt to climate more effectively, the most frequently reported strategy in Uganda was enhancement of enactment and compliance with bylaws and customary institutions, which was reported by 50 percent of the 12 communities that participated in this study. As pointed out in the adaptation literature, community-level actions are required to enhance collective adaptation (Aalst, Cannon, and Burton 2008; Ayers and Forsyth 2009; Huq and Reid 2007). Increasing the capacity of local communities to collectively manage rangelands and water resources will require involvement of civil society organizations with a focus on natural resource management. These organizations have been shown to increase the capacity of local institutions to enact bylaws (Berkes 2004; Nkonya, Pender, and Kato 2008; Lind and Cappon 2001).

61
In Niger and Uganda, which have prepared their National Action Program for Adaptation (NAPA), increasing the capacity of local communities to adapt to climate change is not a strong component. Even though NAPAs in both countries mention the need to strengthen the capacity of local institutions to enhance adaptation to climate change, there is little resource allocation in this area in both Niger and Uganda. This is one of the policy weaknesses that require significant attention in policy formulation and resource allocation.
In Kenya, current efforts to strengthen local governments should pay particular attention to community-level natural resource management. The robust presence of civil society organizations in Kenya provides ample opportunity to strengthen local communities to better manage natural resources. The decentralization structure in Uganda and Nigeria provides significant empowerment of local governments to enact bylaws and regulations for natural resource management, but the capacity remains low, a problem that is prevalent in most countries in SSA. The capacity of local governments to manage natural resources is especially low in these two countries. Even though Niger provides one of the shining examples of local community tree planting and protection programs in SSA, its decentralization structure is one of the weakest in SSA (Ndegwa and Levy 2004). Additionally, some statutes for natural resource management are formed across sectors and eventually give conflicting rules that create implementation challenges. For example, while the Water Code in Niger stipulates that water is a public resource accessible to anyone, the Rural Code stipulates that water in a given pastoral community belongs to the community and pastoralists from other communities do not have access. This situation calls for coordination of different government ministries and departments and other programs that support development and management of natural resources and the environment. Legislative changes are also required to address conflicting statutes.
Collective action through group membership has often been found to provide farmers greater access to information, whether through extension, NGOs, projects, or other farmers. This appears to be the case with SLWM, given the range of SLWM practices that have been catalyzed by group participation. We found membership in production groups to have a favorable impact on adoption of a number of SLWM practices while membership in marketing groups had a mixed effect, depending on the country. The results highlight the focus of the different groups and the need to foster different groups in order to provide a variety of services that farmers need in their economic activities. The results also highlight the weaknesses of the groups in providing support for adapting to climate change.
Mitigation of Climate Change and Land Use Changes As seen above, organic soil fertility management practices greatly increase soil carbon, thus contributing to carbon sequestration. Results from Uganda show that farmers had significant knowledge of land management practices that increase carbon. The farmers were also able to qualitatively assess the plots with higher and lower carbon stock. Plots that farmers assessed to be under good management practices had 23 percent more soil carbon than those judged to be poorly managed. Due to the natural difference of soil carbon across AEZs, however, the difference in soil carbon between well-managed and poorly managed plots differed significantly across zones, with those in semiarid zones showing the greatest difference (43 percent) and those in the subhumid zone showing the smallest difference (4 percent). This could be due to the naturally higher soil carbon in the subhumid zones, on which improved land management could contribute only a limited impact. These results suggest that it is possible for farmers and communities to agree with carbon buyers and verifiers upon the types of SLWM investments that would qualify for carbon sequestration and for carbon finance. Further, communities would also be in a position to assist in monitoring and evaluation of carbon stock that could be used to estimate carbon sequestration inexpensively. As seen above, many organic soil fertility management practices significantly increase soil carbon and could be used to determine payments in the carbon market. For example, tree planting and manure application greatly increase soil carbon. With appropriate verification methods, it should be possible to design monitoring and evaluation approaches that can be inexpensively applied to assess trends in carbon sequestration in agricultural landscapes.
Assessment of land use changes and their effect on carbon stock showed that there has been significant increase in cropland and a corresponding reduction of forest, bushlands, and woodlands in all countries. Such changes have led to a reduction in soil carbon stock ranging from as low as 3 percent in the
62
Guinea savannah zone in Nigeria to as high as 47 percent in the semiarid zone of Uganda. Carbon losses were higher in the drier areas than in the humid areas, suggesting that vulnerability to climate change (and other stresses such as population growth) increases even faster in the drier areas than in the more humid zones. This result also challenges the newly developing conventional wisdom that land degradation is more of a problem in humid areas of Africa than in dry areas (Bai et al 2008) and vindicate UNCCD’s focus in the drylands. The results demonstrate that it is the type of land degradation which determines the severity of land degradation. Though our study is based on few selected sites while Bai et al (2008) is based on the entire region, these results suggest the need to address the land degradation in drylands more seriously using approaches which have worked in Niger. This in turn suggests the need to design more effective methods to address the rapid carbon loss in the drier areas and the consequent desertification. Such efforts could build on NAPA activities in each country to address the weak coordination and involvement of local governments and civil societies, and to design long-term programmatic efforts to scale up land management practices.
With the exception of Niger, carbon stock losses were greater in areas with high market access than in those with low market access. These results suggest that areas with poor access to markets provide an opportunity for carbon sequestration in more humid areas. However, development of roads and other social amenities is necessary in remote areas with significant human population since such social services are important for economic and social development. In order to address the unsustainable land conversion in areas with high market access, there is a need to strengthen the capacity of the local communities to enact and enforce tree cutting and bush burning regulations, as discussed above. Community-level enactment and enforcement of regulations have shown favorable results for some of the communities that participated in this study. For example, prohibition of bush burning in Emigginda village in Nigeria led to a 53 percent reduction of the burnt area by 2005 from its level in 2000.
The reforestation program in Niger that was found to slow the decrease in carbon stock to a greater degree in areas near markets than in more remote areas. This finding demonstrates that it is possible to reduce and even reverse the faster decline of forest resources in the high market areas if reforestation programs are supported by conducive policy and institutions that provide incentives for planting and protecting trees and involve civil societies. This highlights the importance of context in determining the impacts of factors like market access. In a dryland context, access to markets can promote investments in planting and protecting trees, where few trees exist. In a more humid context, there may be lots of natural trees, and market access may promote deforestation for higher value activities like crop production.
What Can We Learn from Each of the Case Study Countries? The four country case studies offer success stories about adaptation strategies. While Kenya’s policies have strongly supported agricultural research and development and an agricultural market environment that offers incentives to farmers to adopt SLWM, neighboring Uganda has implemented government decentralization and a land tenure system that have been factors leading to stronger local institutions that offer opportunities for improved community resource management. In West Africa, Nigeria has long supported irrigation development and recently focused on small-scale irrigation that has increased agricultural production and reduced production risks in the drier northern states. Even though such irrigation schemes were not implemented as part of adaptation to climate change, they have enhanced farmers’ adaptation to climate change. Niger also offers a good example of tree planting and protection, which was successful due to the Rural Code that gave land users rights to own benefit from trees on their farms. This success contributed to the regreening of the Sahel. Hence, in all the countries we see the influence of the policies and how each policy implemented has influenced adoption of SLWM and response to climate change in general. This shows that there have been policies and programs in each country that can be scaled up.

63
Conditions for Scaling Up SLWM for Climate Change Adaptation and Mitigation Given the rather low rates of adoption of critical SLWM practices in all countries, it is obvious that the practices are not spreading at a quick pace. Thus, there is a need for public investment to create awareness and provide technological support for these often knowledge-intensive practices. There is also need to learn what works where in land and water management and to promote practices that are suited to the context, and not to try to promote one size fits all approaches. The relative success of Kenya in promoting soil conservation and fertility measures suggests that large-scale extension programs can be effective but that they require long-term commitment, something that is absent in the common practice of project funding. The long-term extension project in Kenya was supported by a large number of NGOs active in land management. These organizations not only complement an extension program but inject a degree of innovation that can lead to the generation of improved SLWM practices. Push-pull, MBILI (managing beneficial interactions in legume intercrops), fertilizer microdosing and packaging, biomass transfer, and manure management are all examples of recent innovations used in Kenya for crop and soil management. Facilitating the linkages among all development organizations, and with research organizations, would serve to enhance the scaling up process. Some SLWM practices may require special attention. We have highlighted the lack of use of irrigation in all the countries. Irrigation is touted as an essential ingredient for increased productivity and for climate change adaptation in Africa by numerous organizations, including NEPAD. Irrigation faces many of the same challenges as other SLWM practices but also brings in the element of the need for capital investment (in water storage or distribution). Efforts to increase credit for irrigation investment are of high priority. The payoffs of irrigation would be large, especially in semi-arid areas with good soils. Not only would irrigation enhance productivity and reduce yield variation on its own, but experiences in other regions show that it induces further investment by farmers, whether in high-value crops, in improved seed, in fertilizer, or in other SLWM practices. A good example is the community-driven development program in the lowland plains (fadama) in Nigeria, which promoted small-scale irrigation and other rural development activities. The Fadama II project had a large impact on household income and agricultural productivity in the pilot states and has been scaled up to all states in Nigeria. Unfortunately, there are no good examples of large-scale scaling up efforts in Kenya, Uganda, and Niger. Yet the Nigerian focus on promoting small-scale irrigation serves as a good example of a successful program that could help address climate change risks and ensure food security to rural communities, especially the communities in the semiarid areas, where the impact of climate change is most severe. However, irrigation may not be appropriate in areas which are too dry. Under such circumstances, other methods should be considered.
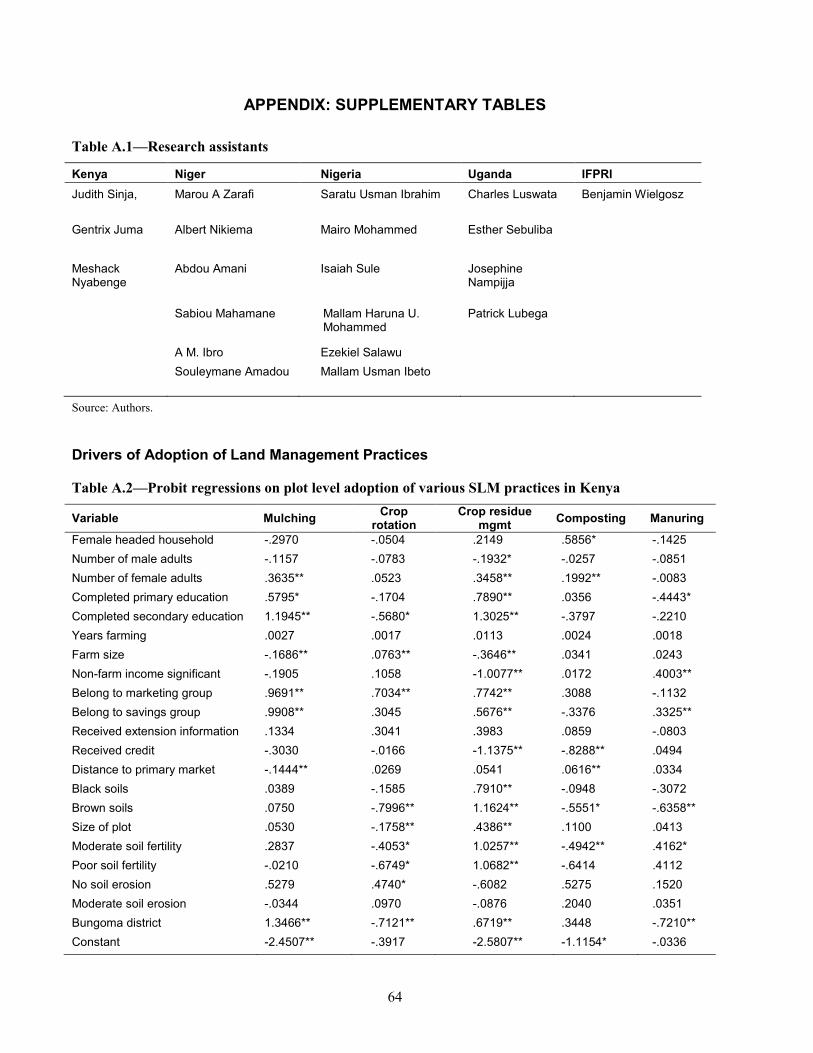
64
APPENDIX: SUPPLEMENTARY TABLES
Table A.1—Research assistants
Kenya Niger Nigeria Uganda IFPRI Judith Sinja, Marou A Zarafi
Saratu Usman Ibrahim Charles Luswata Benjamin Wielgosz
Gentrix Juma Albert Nikiema
Mairo Mohammed Esther Sebuliba
Meshack Nyabenge
Abdou Amani
Isaiah Sule Josephine Nampijja
Sabiou Mahamane Mallam Haruna U. Mohammed
Patrick Lubega
A M. Ibro Ezekiel Salawu Souleymane Amadou
Mallam Usman Ibeto
Source: Authors.
Drivers of Adoption of Land Management Practices
Table A.2—Probit regressions on plot level adoption of various SLM practices in Kenya
Variable Mulching Crop rotation
Crop residue mgmt Composting Manuring
Female headed household -.2970 -.0504 .2149 .5856* -.1425 Number of male adults -.1157 -.0783 -.1932* -.0257 -.0851 Number of female adults .3635** .0523 .3458** .1992** -.0083 Completed primary education .5795* -.1704 .7890** .0356 -.4443* Completed secondary education 1.1945** -.5680* 1.3025** -.3797 -.2210 Years farming .0027 .0017 .0113 .0024 .0018 Farm size -.1686** .0763** -.3646** .0341 .0243 Non-farm income significant -.1905 .1058 -1.0077** .0172 .4003** Belong to marketing group .9691** .7034** .7742** .3088 -.1132 Belong to savings group .9908** .3045 .5676** -.3376 .3325** Received extension information .1334 .3041 .3983 .0859 -.0803 Received credit -.3030 -.0166 -1.1375** -.8288** .0494 Distance to primary market -.1444** .0269 .0541 .0616** .0334 Black soils .0389 -.1585 .7910** -.0948 -.3072 Brown soils .0750 -.7996** 1.1624** -.5551* -.6358** Size of plot .0530 -.1758** .4386** .1100 .0413 Moderate soil fertility .2837 -.4053* 1.0257** -.4942** .4162* Poor soil fertility -.0210 -.6749* 1.0682** -.6414 .4112 No soil erosion .5279 .4740* -.6082 .5275 .1520 Moderate soil erosion -.0344 .0970 -.0876 .2040 .0351 Bungoma district 1.3466** -.7121** .6719** .3448 -.7210** Constant -2.4507** -.3917 -2.5807** -1.1154* -.0336

65
Table A.2—Continued
Variable Mulching Crop rotation
Crop residue mgmt Composting Manuring
Number of observations 317 317 317 317 317 Pseudo r-square .27 .19 .35 .25 .11 Female headed household 1.3551** .8160** -2.0121** .0181 .1954 Number of male adults .6363** -.1219 .5550** .2176 .1554 Number of female adults -.3067 -.2320** -.2860** -.4137** -.0347 Completed primary education 1.2177* .8774** -.5072* -.2246 .4011 Completed secondary education 1.4564** .1907 -.2117 -1.4179** .2567 Years farming -.0266* .0115 -.0039 -.0469** -.0191 Farm size -.0283 -.0463 -.0777** -.0140 .0699** Nonfarm income significant .6246* -.0996 1.3031** .3718 -.1842 Belong to marketing group -.6063* .6149** .6817** .4222 .6398** Belong to savings group -1.2936** .7626** .3666 -.0974 .4404 Received extension information -.7660** .1108 -.1201 .6573 .4171 Received credit -1.2863** -.4103* .5599** -1.2266** .3152 Distance to primary market -.1988** .0963** -.2056** .0683 -.0469 Black soils -.2798 -.3212 .6184** -.4189 .0419 Brown soils .4574 -.4106 -.0381 n/a .0653 Size of plot .2368* .0138 .0900 .0527 -.0910 Moderate soil fertility -.4772 -.7662** .2262 -.2294 .3267 Poor soil fertility .3755 -1.3452** .3157 -1.6111** .0469 No soil erosion 1.0442* -.9414** -.7218** .1103 -.2683 Moderate soil erosion .8201 -.7886** .0075 .3665 -.0753 Bungoma district n/a .4123 -.6960** -.3067 .7443** Constant -.1828 .1698 -1.2018** .6101 -3.1819** Number of observations 186 330 317 248 330 Pseudo r-square .34 .31 .35 .30 .26
Source: Authors.

66
Table A.3—Uganda drivers of land management practices (marginal effects)
Variable Manure Crop rotation Fertilizer Mulch Residue Irrigation Terrace Trashline Tree
planting Fanya chini
Plot characteristics
Soil color/texture (cf sandy soils)
- Brown -0.105*** -0.249*** -0.461 0.032 -0.03 0.001 -0.020*** -0.054*** 0.059 -0.003
- Gray -0.144*** -0.271*** -3.76 0.058 0.043 -0.023 0 -0.057*** 0.018 -0.070***
- Red 0.064 -0.172* -2.72 0.093 -0.015 -0.062*** 0.184*** -0.095*** -0.211*** -0.068***
- Black -0.03 -0.076* -0.173 0.02 -0.04 0.024 0 -0.003 0.004 -0.004
- Clay -0.057 -0.045 -4.774 -0.163*** -0.055 -0.011 0.065*** 0.101** -0.178*** -0.070***
Soil fertility (cf fertile) - Moderate -0.025 0.143*** 0.986* -0.098*** -0.062* -0.013 -0.017*** 0.141*** -0.049* -0.026*
- Poor -0.062** 0.142** 2.193** -0.203*** -0.093** 0.02 -0.033*** 0.107** -0.121*** -0.068***
Soil erosion (cf no soil erosion) - Mild -0.051** 0.075** 1.231** 0.094** -0.002 -0.021** -0.003*** 0.025 0.044 0.014
- Severe -0.021 -0.095* 1.140* 0.041 -0.078 -0.051*** 0.076*** 0.014 -0.008 0.013
Household asset endowment Ln(value of farm equipment, UGX) -0.002 -0.013*** 0.053 -0.004 -0.016*** 0.005** 0.000 -0.008*** 0.001 -0.004
Ln(value of livestock, UGX) 0.014*** 0.004 -0.180** 0.006** 0.005 0.005*** 0.000 0.004* 0.006* 0.007**
Ln(plot area, acre) -0.008 0.033 -0.003 -0.006 0.018 0.020** -0.001 0.004 0.037* 0.008
Ln(farm area, acre) -0.007 -0.078*** -0.237 0.041* -0.045** -0.052*** 0.000 -0.016 -0.041* -0.019
Land tenure (cf customary) - Leasehold 0.302*** -0.017 -3.913 0.173* 0.195*** 0.282*** 0.000*** 0.100* 0.299*** -0.068***
- Freehold -0.026 -0.181*** 0.264 -0.170*** -0.254*** 0.02 -0.017*** 0.042 0.008 -0.02
Household human capital endowment - Ln(household size) -0.014 0.093 -0.675 -0.223*** 0.126* -0.075** 0.001 -0.132*** 0.155** -0.047
- Female headed household 0.089** -0.153*** -7.757 0.140*** -0.06 0.057** -0.037*** -0.011 0.089* -0.015 - Ln(number of male household members) 0.041 -0.056 0.709 0.084* -0.065 -0.005 -0.001 0.062* -0.217*** -0.018 - Ln(number of female household members) 0.001 0.056 0.012 0.223*** -0.148* 0.076** 0.000 0.134*** -0.138* 0.041
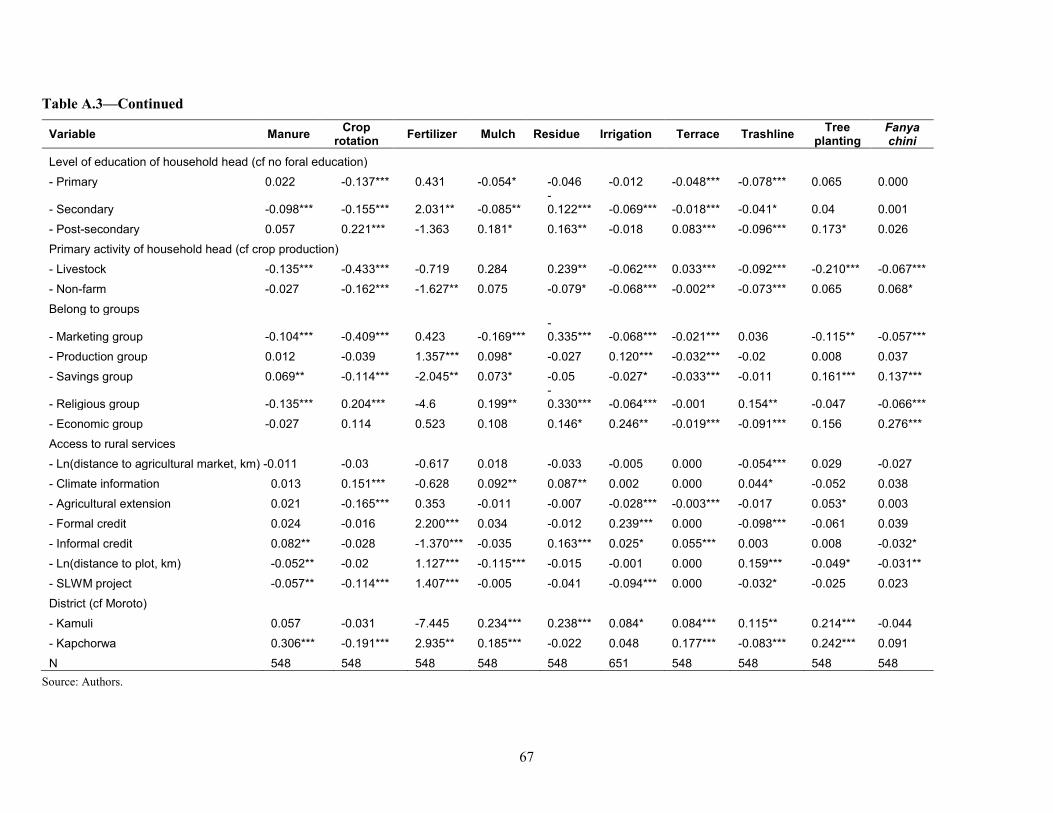
67
Table A.3—Continued
Variable Manure Crop rotation Fertilizer Mulch Residue Irrigation Terrace Trashline Tree
planting Fanya chini
Level of education of household head (cf no foral education) - Primary 0.022 -0.137*** 0.431 -0.054* -0.046 -0.012 -0.048*** -0.078*** 0.065 0.000
- Secondary -0.098*** -0.155*** 2.031** -0.085** -0.122*** -0.069*** -0.018*** -0.041* 0.04 0.001
- Post-secondary 0.057 0.221*** -1.363 0.181* 0.163** -0.018 0.083*** -0.096*** 0.173* 0.026
Primary activity of household head (cf crop production) - Livestock -0.135*** -0.433*** -0.719 0.284 0.239** -0.062*** 0.033*** -0.092*** -0.210*** -0.067***
- Non-farm -0.027 -0.162*** -1.627** 0.075 -0.079* -0.068*** -0.002** -0.073*** 0.065 0.068*
Belong to groups
- Marketing group -0.104*** -0.409*** 0.423 -0.169*** -0.335*** -0.068*** -0.021*** 0.036 -0.115** -0.057***
- Production group 0.012 -0.039 1.357*** 0.098* -0.027 0.120*** -0.032*** -0.02 0.008 0.037
- Savings group 0.069** -0.114*** -2.045** 0.073* -0.05 -0.027* -0.033*** -0.011 0.161*** 0.137***
- Religious group -0.135*** 0.204*** -4.6 0.199** -0.330*** -0.064*** -0.001 0.154** -0.047 -0.066***
- Economic group -0.027 0.114 0.523 0.108 0.146* 0.246** -0.019*** -0.091*** 0.156 0.276***
Access to rural services - Ln(distance to agricultural market, km) -0.011 -0.03 -0.617 0.018 -0.033 -0.005 0.000 -0.054*** 0.029 -0.027
- Climate information 0.013 0.151*** -0.628 0.092** 0.087** 0.002 0.000 0.044* -0.052 0.038
- Agricultural extension 0.021 -0.165*** 0.353 -0.011 -0.007 -0.028*** -0.003*** -0.017 0.053* 0.003
- Formal credit 0.024 -0.016 2.200*** 0.034 -0.012 0.239*** 0.000 -0.098*** -0.061 0.039
- Informal credit 0.082** -0.028 -1.370*** -0.035 0.163*** 0.025* 0.055*** 0.003 0.008 -0.032*
- Ln(distance to plot, km) -0.052** -0.02 1.127*** -0.115*** -0.015 -0.001 0.000 0.159*** -0.049* -0.031**
- SLWM project -0.057** -0.114*** 1.407*** -0.005 -0.041 -0.094*** 0.000 -0.032* -0.025 0.023
District (cf Moroto) - Kamuli 0.057 -0.031 -7.445 0.234*** 0.238*** 0.084* 0.084*** 0.115** 0.214*** -0.044
- Kapchorwa 0.306*** -0.191*** 2.935** 0.185*** -0.022 0.048 0.177*** -0.083*** 0.242*** 0.091
N 548 548 548 548 548 651 548 548 548 548 Source: Authors.

68
Table A.4—Determinants of adoption of land management practices (marginal effects), Niger
Variable Alley cropping Compost Mulch Fanya
chini Irrigation
Color and texture of soil (cf sandy soils) - Brown -0.073** 0.139*** 0.062* -0.090*** -0.034*** - Gray -0.065* 0.132** 0.196*** -0.103*** -0.034*** - Red 0.022 0.042 -0.006 -0.075* -0.034*** - Black 0.085* 0.057* -0.018 0.009 -0.011 - Clay -0.039* 0.008 0.061** -0.061*** 0.052*** Soil fertility (cf highly fertile) - Moderate -0.026 -0.048*** 0.011 0.073** -0.01 - Poor 0.027 -0.043* 0.090*** 0.017 -0.034*** Status of soil erosion (cf no soil erosion) - Mild 0.035 0.011 0.013 -0.098*** -0.002 - Severe -0.063 -0.013 0.02 0.023 0.082* Household physical capital endowment Ln(value of equipment FCFA) -0.007 0.013** 0.000 -0.014*** -0.005* Ln(value of livestock FCFA) 0.004 -0.003 -0.002* 0.001 0.001 Ln(plot area, ha) 0.060*** 0.018* 0.009 0.029* -0.01 Ln(farm area, ha) -0.038** 0.015 -0.021 0.011 0.026*** Land tenure (cf customary) - Leasehold 0.018 0.060** -0.005 0.123*** -0.013* Human capital
Ln(household size) -0.085 0.133** -0.098** -0.038 -0.011 Female headed household 0.036 -0.116*** 0.170** -0.181*** 0.067 Ln(number of male household members) 0.021 -0.181*** 0.110** 0.028 -0.049* Ln(number of female household members) 0.086* -0.069 0.063** -0.011 -0.006 Level of education of household head (cf no formal education) - Primary -0.146*** -0.132*** -0.059*** -0.176*** 0.044 - Secondary 0.072** -0.074*** -0.097*** 0.059** 0.012 Non-farm -0.047 0.213*** -0.060*** -0.072** 0.062* Membership to economic and other groups - Production 0.09 -0.130*** 0.278*** 0.007 -0.013 - Religious 0.014 -0.072*** -0.054*** -0.135*** -0.012 Access to rural services Ln(distance to ag markets, km) 0.004 0.001 -0.047*** 0.032** -0.001 Access to climate information 0.042 -0.143*** 0.003 0.015 0.018 Access to extension services -0.058** 0.037 -0.075*** -0.089*** 0.031* Access to formal credit -0.031 0.013 0.067*** 0.014 0.000 Access to non-formal credit -0.017 -0.041** -0.004 -0.077*** -0.017** Ln(distance to plot, km) -0.058*** 0.034*** 0.002 -0.001 -0.023*** Presence of SLWM project 0.099* -0.088*** -0.02 -0.216*** -0.413*** High market access 0.007 0.150*** -0.175*** 0.192** 0.468*** N 609 609 609 609 834 Source: Authors. Note: For brevity, village fixed effects are not reported.

69
Table A.5—Determinants of adoption of land management practices (Maximum likelihood probit), Niger state, Nigeria
Fertilizer Irrigation Manure Compost Crop rotation
Improved fallow
Fertilizer and manure
Fertilizer and compost
Soil color/type (cf sandy) Brown 0.124 0.329 -0.070** -23.323 -0.218** 12.013*** 2.883* -21.065 Gray 0.396*** -5.575 -0.113*** 10.876*** 0.078 0.717 -3.112 -0.045 Red 0.135 -5.931 -0.04 -11.232 0.005 7.107 3.242** -7.92 Black 0.13 -8.66 -0.096*** -3.218*** -0.154 6.357*** 2.179 0.06 Clay 0.103 3.008 -0.083*** 0.032 -0.342*** 19.644 5.382*** -2.377 Soil fertility (cf very fertile)
Moderate fertility -0.015 -13.758 0.053 4.034*** -0.023 1.251 1.234** 3.646*** Poor fertility -0.091 -12.97 0.253*** -0.087 -0.176* 1.984 7.952 -1.253 Severity of soil erosion (cf no erosion)
Mild 0.031 2.73 0.033 -3.949*** 0.058 0.387 1.952** -3.746 Severe 0.019 58.61 -0.113*** -23.515 -0.225 8.95 -4.759 -9.363 Physical capital
Ln(value of equipment, Naira) 0.130*** -0.584*** -0.038 -9.696*** 0.009 -1.756*** 10.191 2.493 Ln(livestock, Naira) 0.017** 0.396*** 0.011** 4.687*** -0.013* 0.055 10.566*** 4.078*** Ln(plot area, ha) 0.074 -7.823*** 0.017 7.554*** -0.118** 0.723 2.289** 7.877 Kn(farm area, ha) 0.016 6.838*** 0.195*** 9.397*** 0.046 -3.743*** 31.66 11.804 Land tenure (cf customary)
Leasehold -0.240*** -3.041 -0.131*** -6.217*** 0.374*** 1.045 -1.394 -5.577 Human capital
Female household head 0.089 -16.945 0.129** 16.486 0.165** 8.547*** 57.332 -13.546 Ln(male household members) 0.187 10.523*** -0.058 122.623*** -0.022 7.035*** -7.104 40.468 Ln(female household members) -0.218** -11.717 0.053 80.721*** 0.055 7.708 58.087 41.578 Level of education of household head (cf no formal education)
Primary school -0.086 9.22 -0.006 -2.116 0.311*** 3.2 -65.398 -26.129 Secondary school 0.11 -0.577 -0.049 59.531 -0.081 -7.414 30.588 23.844 Post-secondary school 0.089 18.968 -0.112*** 22.697 -0.558*** -6.469 -0.996 8.631 Primary activity of household head (cf crops)
No-farm activities 0.109 6.511 -0.113*** 26.413 -0.119 20.464 -33.873 30.234 Social capital (membership to groups/organizations)
Marketing -0.445*** 9.238 -0.119*** -34.954*** 0.413*** 12.884 35.982 -23.458 Production 0.197*** -2.988*** -0.079** 48.563 -0.077 -16.684 -3.329 26.856 Savings and credit 0.008 -13.242 0.212*** -59.802 0.086 -12.67*** 53.141 -49.376 Other economic groups -0.022 -6.859 0.02 -46.46 0.006 -35.196 17.928 -27.052 Religion -0.301*** -12.499 -0.066** 24.072*** -0.032 12.888*** -153.46*** -15.236 Source: Authors.

70
Table A.6—Determinants of adoption of land management practices (Maximum likelihood probit), Niger state, Nigeria
Fertilizer Irrigation Manure Compost Crop rotation
Improved fallow
Fertilizer and manure
Fertilizer and compost
Access to rural services Ln(distance to market, km) 0.011 -1.027** 0.133** 7.161*** -0.096** 2.614*** 25.84 13.519
Access to climate information 0.295** -18.616 -0.131*** -56.92 0.333*** 11.469 25.194 -21.518 Had contact with extension agent 0.171** 8.166*** -0.197*** -5.647*** 0.118* 9.925 -14.175 -4.147 SLWM project 0.219*** -7.961*** 0.155*** 9.591*** -0.192** 9.33 70.187 30.324 Borrowed from Bank/MFI -0.092 -6.409 -0.125*** 8.043*** 0.150** 20.687 -13.402 19.03 Borrowed from an informal source 0.054 -0.788 -0.158*** 14.927 -0.071 8.419 -73.635 -20.621 Ln(distance, home to plot, km) 0.038 5.734*** -0.025 -6.321*** 0.005 0.217 0.645 -7.621 Constant
-23.723
91.686
9.238 -250.742 -65.496
N 312 312 312 312 312 312 312 312 Source: Authors.

71
REFERENCES
Aalst, M. A., T. Cannon, and I. Burton. 2008. Community Level Adaptation to Climate Change: The Potential Role of Participatory Community Risk Assessment. Global Environmental Change 18:165–179.
Abadie, A., and G. Imbens. 2007. Bias Corrected Matching Estimators for Average Treatment Effects. Harvard University Department of Economics working paper. Cambridge, Massachusetts, U.S.A.
Abadie, A., D. Drukker, J. Leber Herr, and G. Imbens. 2004. Implementing Matching Estimators for Average Treatment Effects in Stata. Stata Journal 4(3): 290-311.
Abdoulaye, T. and T. Abasse, 2005 Assessment of Joint Forest Management in Niger, Nigeria and Ghana Executive final report, AFORNET GRANT No. December 5, 2003, Niamey, Niger.
Adam, T., C. Reij, T. Abdoulaye, M. Larwanou, and G. Tappan. 2006. Impacts des Investissements Dans la Gestion des Resources Naturalles (GRN) au Niger: Rapport de Synthese. Centre Régional d’Enseignement Specialise en Agriculture (CRESA), Niamey, Niger.
Ademayo D.O. 2005. Local Government Autonomy in Nigeria: A Historical Perspective. Journal of Social Sciences 10(2):77-87.
AfricaRice. 2010. AfricaRice Achievement. www.africarice.org/warda/achieve.asp.
Ariga, J., T. S. Jayne, and J. Nyoro. 2006. Factors Driving the Growth in Fertilizer Consumption in Kenya, 1990–2005: Sustaining the Momentum in Kenya and Lessons for Broader Replicability in Sub-Saharan Africa. Tegemeo Institute of Agricultural Policy and Development Working Paper 24/2006.
Amadalo, B., B. Jama, A. Niang, Q. Noordin, M. Nyasimi, F. Place, S. Franzel, et al. 2003. Improved Fallows for Western Kenya: An Extension Guideline. Nairobi, Kenya: World Agroforestry Center.
Arnold, M., K. Köhlin, R. Persson, and G. Shepherd. 2003. Fuelwood Revisited: What Has Changed in the Last Decade? Occasional Paper 39. Jakarta, Indonesia: Center for International Forestry Research.
Ayers, J., and T. Forsyth. 2009. Community-Based Adaptation to Climate Change: Responding to Poverty and Vulnerability. Environment 51 (4): 22–31.
Baccini, A., N. Laporte, S. Goetz, M. Sun, and H. Dong. 2008. A First Map of Tropical Africa’s Above-Ground Biomass Derived from Satellite Imagery. Environmental Research Letters 3 (4). doi:10.1088/1748-9326/3/4/045011.
Badiane, O. 2008. Sustaining and Accelerating Africa’s Agricultural Growth Recovery in the Context of Changing Global Food Prices. IFPRI Policy Brief 9. Washington, DC: International Food Policy Research Institute (IFPRI).
Bai, Z. G., D. L. Dent, L. Olsson, and M. E. Schaepman. 2008. Global Assessment of Land Degradation and Improvement. 1. Identification by Remote Sensing. GLADA Report 5 (November). Wageningen, The Netherlands.
Banful, B., E. Nkonya, and V. Oboh. 2009. Constraints to Fertilizer Use in Nigeria: Perspectives and Insights from the Agricultural Extension Service. Nigeria Strategy Program Policy Brief #6. Abuja, Nigeria: International Food Policy Research Institute (IFPRI)..
Barnett, J., and W. Adger. 2007. Climate Change, Human Security and Violent Conflict. Political Geography 26 (6): 639–655.
Barnichon, R., and S. Peiris. 2008. Sources of Inflation in Sub-Saharan Africa. Journal of African Economies 17 (1): 729–746.
Bashar, K., M. Kizaa, B. Chane, and Y. Seleshi. 2003. Assessment of Existing Micro Dams in Ethiopia, Sudan and Uganda. Cairo, Egypt: Nile Basin Capacity Building Network for River Engineering. www.nbcbn.com/Project_Documents/prposals/phase%20I/River%20Structure/g1.pdf.
Bationo, A., and A. Buerkert. 2001. Soil Organic Carbon Management for Sustainable Land Use in Sudano-Sahelian West Africa. Nutrient Cycling in Agroecosystems 61:131–142.

72
Bationo, A., B. Waswa, J. Kihara, and J. Kimetu, eds. 2007. Advances in Integrated Soil Fertility Management in Sub-Saharan Africa: Challenges and Opportunities. Dordrecht, Netherlands: Springer.
Beintema, N., and G. Stads. 2011. African Agricultural R&D in the New Millennium. Progress for Some, Challenges for Many. IFPRI Food Policy Report.
Benhin, J. 2006. Climate Change and South African Agriculture: Impacts and Adaptation Options. CEEPA Discussion Paper No. 21. Pretoria, South Africa: Centre for Environmental Economics and Policy in Africa (CEEPA), University of Pretoria.
Benin, S., E. Nkonya, G. Okecho, J. Randriamamonjy, E. Kato, G. Lubade, M. Kyotalimye, et al. 2009. Impacts of and Returns to Public Investment in Agricultural Extension: The Case of the National Agricultural Advisory Services (NAADS) Program of Uganda. Mimeo, International Food Policy Research Institute, Washington, DC.
Berkes, F. 2004. Rethinking Community-Based Conservation. Conservation Biology 18 (3): 621–630.
Blench, R., R. Chapman, and T. Slaymaker. 2003. A Study on the Role of Livestock in Poverty Reduction Strategy Papers. PPLPI Working Paper No.1. Rome: Pro-Poor Livestock Policy Initiative (PPLPI), FAO.
Boko, M., I. Niang, A. Nyong, C. Vogel, A. Githeko, M. Medany, B. Osman-Elasha, et al. 2007. “Africa.” In Climate Change 2007: Impacts, Adaptation and Vulnerability. Contribution of Working Group II to the Fourth Assessment Report of the Intergovernmental Panel on Climate Change, edited by M. L. Parry, O. F. Canziani, J. P. Palutikof, P. J. van der Linden, and C. E. Hanson, 433–467. Cambridge, UK: Cambridge University Press.
Butler R. 2006. Nigeria Has Worst Deforestation Rate, FAO Revises Figures. Online at http://news.mongabay.com/2005/1117-forests.html
Chen, S., and M. Ravallion. 2007. Absolute Poverty Measures for the Developing World, 1981–2004. Background Paper. Washington, DC: World Bank.
Christensen, J. H., B. Hewitson, A. Busuioc, A. Chen, X. Gao, I. Held, R. Jones, et al. 2007. “Regional Climate Projections.” In Climate Change 2007: The Physical Science Basis. Contribution of Working Group I to the Fourth Assessment Report of the Intergovernmental Panel on Climate Change, edited by S. Solomon, D. Qin, M. Manning, Z. Chen, M. Marquis, K. B. Averyt, M. Tignor, et al., 847–940. Cambridge, UK: Cambridge University Press.
Cline, W. 2007. Country-Level Climate Projections. Global Warming and Agriculture: Impact Estimates by Country. Washington, DC: Peterson Institute.
Cole, C. V., K. Flach, J. Lee, D. Sauerbeck, and B. Stewart. 1993. Agricultural Sources and Sinks of Carbon. Water Air and Soil Pollution 70:111–122.
Conway, G., and J. Waage. 2010. Science and Innovation for Development. London: UK Collaborative on Development Sciences.
Cooke, P., G. Köhlin, and W. Hyde. 2008. Fuelwood, Forests and Community Management: Evidence from Household Studies. Environment and Development Economics 13:103–135.
Cooper, P. J. M, K. P. C. Rao, P. Singh, J. Dimes, P.S. Traore, K. Rao, P. Dixit, and S.J. Twomlow. 2009. Farming with Current and Future Climate Risk: Advancing a ‘Hypothesis of Hope’ for Rainfed Agriculture in the Semi-arid Tropics. Journal of SAT Agricultural Research 7: 1–19.
Cooper P.J.M. and R. Coe. 2011. Assessing and Addressing Climate-induced Risk in Sub-Saharan Rainfed Agriculture Foreword to a Special Issue of Experimental Agriculture. Experimental Agriculture, 47(2): 179–184
Cotula, L. 2006. Land and Water Rights in the Sahel: Tenure Challenges of Improving Access to Water for Agriculture. IIED Issue Paper 139. London: International Institute for Environment and Development (IIED).
Climate Research Unit (CRU). Climate Change Raw Data,1981 to 2001. East Anglia.
Defoer, T., A. Budelman, C. Toulmin, and S. Carter. 2000. “Building Common Knowledge: Participatory Learning and Action Research.” In Managing Soil Fertility in the Tropics. A Resource Guide for Participatory Learning and Action Research, edited by T. Defoer and A. Budelman. Amsterdam: Royal Tropical Institute.
73
Deininger, K. 2003. Land Policies for Growth and Poverty Reduction. World Bank Policy Research Report. Washington, DC: World Bank; Oxford, UK: Oxford University Press.
Diarra, M., and M. Monimart. 2006. Landless Women, Hopeless Women? Gender, Land and Decentralisation in Niger. IIED Issue Paper#143. London: International Institute for Environment and Development (IIED).
Dixon, R., J. Smith, and S. Guill. 2003. Life on the Edge: Vulnerability and Adaptation of African Ecosystems to Global Climate Change. Mitigation and Adaptation Strategies for Global Change 8 (2): 93–113.
Doraiswamy P.,G. McCarty, E. Hunt, R. Yost, M. Doumbia, A. Franzluebbers. 2007. Modeling Soil Carbon Sequestration in Agricultural Lands of Mali Agriculture Systems 94(1):63-74.
Doss C. and M. Morris. 2001. Designing Agricultural Technology for African Women Farmers: Lessons from 25 Years of Experience. World Development 29(12): 2075-2092.
Fan S., B. Omilola and M. Lambert. 2009. Public Spending for Agriculture in Africa: Trends and Composition. Regional Strategic Analysis and Knowledge Support System (ReSAKSS). ReSAKSS Working Paper No. 28
FAO (Food and Agriculture Organization of the United Nations). 2003. World Agriculture: Towards 2015/2030—An FAO Perspective. Edited by J. Bruinsma. London: Earthscan; Rome: FAO.
FAO. 2006. Fertilizer use by crop. FAO Fertilizer and Plant Nutrition Bulletin 17.124.
________. 2005. Nigeria. www.fao.org/nr/water/aquastat/countries/nigeria/index.stm.
________. 2007. AQUASTAT. Accessed March 21, 2011. www.fao.org/nr/water/aquastat/data/query/index.html.
________. 2007. FAOSTAT. Accessed March 21, 2011. http://faostat.fao.org/.
________. 2010. Global Forest Resource Assessment 2010. Forest paper #163. Page 378.
Field-Juma, A. 1996. “Governance and Sustainable Development.” In In Land We Trust: Environment, Private Property and Constitutional Change, edited by C. Juma and J. Ojwang, 9–38. Nairobi, Kenya: Initiatives Publishers.
Funk, C., M. Dettinger, J. Michaelsen, J. Verdin, M. Brown, M. Barlow, and A. Hoell. 2008. Warming of the Indian Ocean Threatens Eastern and Southern African Food Security but Could Be Mitigated by Agricultural Development. Proceedings of the National Academy of Sciences 105 (3): 11081–11086.
Gnacadja, L. 2010. New Sustainable Drylands Initiative and Partnership between COMESA and the MDG Centre. Paper presented at ICRAF forum, Nairobi, Kenya, January 13.
Harris F. 2002. Management of Manure in Farming Systems in Semi-Arid West Africa. Experimental Agriculture, 38:131-148.
Hepworth, N., and M. Goulden. 2008. Climate Change in Uganda: Understanding the Implications and Appraising the Response. Edinburgh, Scotland: LTS International.
Hoffman, I. 2004. Access to Land and Water in the Zamfara Reserve: A Case Study for the Management of Common Property Resources in Pastoral Areas of West Africa. Human Ecology 32 (1): 177–105.
Huq, S., and H. Reid. 2007. Community Based Adaptation: A Vital Approach to the Threat Climate Change Poses to the Poor. IIED Briefing Paper 17005. London: International Institute for Environment and Development (IIED).
ILO JASPA, 1981. First Things First Meeting the Basic Needs People of Nigeria, ILO, Geneva.
IMF (International Monetary Fund). 2010. World Economic Outlook data. Online at http://www.imf.org/external/data.htm.
Jahnke, H. E. 1982. Livestock Production Systems and Livestock Development in Tropical Africa. Kiel, Germany: Kieler Wissenschaftsverlag Vauk.
Jayne, T., J. Govereh, M. Wanzala, and M. Demeke. 2003. Fertilizer Market Development: A Comparative Analysis of Ethiopia, Kenya and Zambia. Food Policy 28:293–316.
Jones, P., and P. Thornton. 2009. Croppers to Livestock Keepers: Livelihood Transitions to 2050 in Africa Due to Climate Change Environmental Science & Policy 12:427–437.

74
Just, R. E., and R. D. Pope. 1979. Production Function Estimation and Related Risk Considerations. American Journal of Agricultural Economics 61:276–284.
Kabassa, J. 2008. Weather, Climate and Climate Change in National Development Sub-sector Paper. Consultancy report submitted to the Ministry of Water, Land and Environment, Kampala, Uganda.
Kabubo-Mariara, J., and F. Karanja. 2006. The Economic Impact of Climate Change on Kenyan Crop Agriculture: A Ricardian Approach. CEEPA Discussion Paper No. 12. Pretoria, South Africa: Centre for Environmental Economics and Policy in Africa (CEEPA), University of Pretoria.
Kaizzi, C. K. 2002. The Potential Benefit of Green Manures and Inorganic Fertilizers in Cereal Production on Contrasting Soils in Eastern Uganda. PhD Thesis, Center for Development Research (ZEF), University of Bonn, Germany.
Kristjanson, P., A. Krishna, M. Radeny, and W. Nindo. 2004. Pathways Out of Poverty in Western Kenya and the Role of Livestock. PPLPI Working Paper No.14. Rome: Pro-Poor Livestock Policy Initiative (PPLPI), Food and Agriculture Organization of the United Nations (FAO).
Lal, R. 2004. Soil Carbon Sequestration to Mitigate Climate Change. Geoderma 123 (1–2): 1–22.
Lamb, R. L. 2003. Inverse Productivity: Land Quality, Labor Markets, and Measurement Error. Journal of Development Economics 71 (1): 71–95.
Landsat. 1984,1999, 2005, 2008. Landsat data, 1984, 1999,1990–2005, 2008. Online, http://landsat.gsfc.nasa.gov/data/
Lavigne Delville, P. 2000. “Harmonising Formal Law and Customary Land Rights in French-Speaking West Africa.” In Evolving Land Rights, Policy and Tenure in Africa, edited by J. Toulmin and J. Quan, 97–121. London: Department for International Development; London: International Institute for Environment and Development; Greenwich, UK: Natural Resources Institute.
Lebedys, A. 2008. Contribution of the Forestry Sector to National Economies, 1990–2006. Forest Finance Working Paper FSFM/ACC/08. Rome: Food and Agriculture Organization of the United Nations.
Lind, J., and J. Cappon. 2001. Realities or Rhetoric? Revisiting the Decentralization of Natural Resource Management in Uganda and Zambia. Nairobi, Kenya: Acts Press.
Lobell, D., M. Burke, C. Tebaldi, M. Mastrandrea, W. Falcon, and R. Naylor. 2008. Prioritizing Climate Change Adaptation Needs for Food Security in 2030. Science 319 (5863): 607–610.
MAAIF (Ministry of Agriculture, Animal Industries and Fisheries). 1999. Framework for the National Action Programme to Combat Desertification and Drought in Uganda: The Way Forward in Implementing the United Nations Convention to Combat Desertification. Entebbe, Uganda: MAAIF. www.unccd.int/actionprogrammes/africa/national/2000/uganda-eng.pdf.
Marenya, P., and C. Barrett. 2009. State-Conditional Fertilizer Yield Response on Western Kenyan Farms. American Journal of Agricultural Economics 91 (4): 991–1006.
Mekuria M., S. Waddington. 2002. Initiatives to Encourage Farmer Adoption of Soil Fertility Technologies for Maize-based Cropping Systems in Southern Africa. In: Barrett, C., F. Place, and A. Abdillahi (eds). Natural Resource Management in African Agriculture: Understanding and Improving Current Practices, Wallingford: CAB International.
Mortimore, M., M. Tiffen, Y. Boubacar, and J. Nelson. 2001. Synthesis of Long-Term Change in Maradi Department, Niger, 1960–2000. Drylands Research Working Paper No. 39e. Crewkerne, U.K.: Drylands Research.
MWLE (Ministry of Water and Environment). 2007. National Adaptation Programme of Actions, Department of Meteorology, Government of Uganda. MWLE, Kampala Uganda.
Mutunga, C., and K. Hardee. 2009. “Population and Reproductive Health in National Adaptation Programmes of Action (NAPAs) for Climate Change.” In Population Dynamics and Climate Change, edited by J. M. Guzman, G. Martine, G. McGranahan, D. Schensul, and C. Tacoli, 176–191. New York: United Nations Population Fund; London: International Institute for Environment and Development.
75
Mwangi, E., and E. Ostrom. 2009. Top-Down Solutions: Looking Up from East Africa’s Rangelands. Environment: Science and Policy for Sustainable Development 51 (1): 34–45.
Nandwa, S. M., and M. A. Bekunda. 1998. Research on Nutrient Flows and Balances in East and Southern Africa: State of the Art. Agriculture, Ecosystems and Environment 71:5–18.
National Aeronautics and Space Administration (NASA) Climate Data, 2002 to 2007.
NEPAD (New Partnership for African Development) and FAO (Food and Agriculture Organization). 2004. Bankable investment project profile. Livestock Development Project. Kampala Uganda.
Ndegwa, S., and B. Levy. 2004. “The Politics of Decentralization in Africa: A Comparative Analysis.” In Building State Capacity in Africa: New Approaches, Emerging Lessons, edited by B. Levy and S. Kpundel, 283–322. Washington, DC: World Bank Institute.
NECSD (National Environmental Council for Sustainable Development). 2006. National Adaptation Programme of Action. Niamey, Niger: NECSD.
NEPAD and FAO. 2010. Uganda Strategic Investment Framework for Sustainable Land Management 2010 – 2020. Unpublished.
NES (National Environmental Secretariat). 2002. National Action Programme: A Framework for Combating Desertification in Kenya in the Context of the United Nations Convention to Combat Desertification. Nairobi, Kenya: NES. www.unccd.int/actionprogrammes/africa/national/2002/kenya-eng.pdf.
Nkonya, E., J. Pender, and E. Kato. 2008.Who Knows, Who Cares? The Determinants of Enactment, Awareness, and Compliance with Community Natural Resource Management Regulations in Uganda. Environment and Development Economics 13 (1): 79–101.
Nkonya, E., J. Pender, P. Jagger, D. Sserunkuuma, C. Kaizzi, H. Ssali. 2004. Strategies for Sustainable Land Management and Poverty Reduction in Uganda. International Food Policy Research Institute (IFPRI) Research Report #133. Washington D.C.
Nkonya, E., F. Bisong, J. Koo, H. Xie, E. Kato, C. Izaurralde, P. S. Traore, et al. 2010. SLM Advisory Services: Key Institutional, Financing, and Economic Elements for Scaling Up Sustainable Land Management in Nigeria. Mimeo, International Food Policy Research Institute (IFPRI), Washington, DC.
Nori, M., M. Taylor, and A. Sensi. 2008. Browsing on Fences: Pastoral Land Rights, Livelihoods and Adaptation to Climate Change. IIED Issue Paper #148. London: International Institute for Environment and Development (IIED).
Ogunyika, E., and T. Marsh. 2006. Nigerian Demand for Meat. Journal of International Food & Agribusiness Marketing 18 (1): 125–149.
Olsson, L., L. Eklundh, and J. Ardö. 2005. A Recent Greening of the Sahel: Trends, Patterns and Potential Causes. Journal of Arid Environments 63 (3): 556–566.
Olubode-Awosola, O.O., E.O. Idowu and H.D. Van Schalkwyk. 2005. Irrigation Projects Reform Case Studies: An Assessment of Projects' Performance. Proceedings, River Simposium. www.riversymposium.com/2006/index.php?element=34.
Oxfam. 2008. Turning Up the Heat: Climate Change and Poverty in Uganda. Oxford, UK: Oxfam GB. www.oxfam.org.uk/resources/policy/climate_change/downloads/ugandan_climate_change.pdf.
Palm, C.A. 1995. Contribution of Agroforestry Trees to Nutrient Requirements of Intercropped Plants. Agroforestry Systems 30:105-124.
Palm C., R.J. Myers and S. M. Nandwa. 1997. Combined Use of Organic and Inorganic Nutrient Sources for Soil Fertility Maintenance and Replenishment. In Buresh R.J., P.A. Sanchez, and F. Calhoun (eds). Replenishing Soil Fertility in Africa. Proceedings of an international symposium of the 88th Annual Meetings of the American Society of Agronomy and the Soil Science Society of America, Indianapolis, Indiana, 6 November 1996: 193-218.

76
Pandey, D., A. Gupta, and D. Anderson. 2003. Rainwater Harvesting as an Adaptation to Climate Change. Current Science 85 (1): 46–59.
Pearce, R. 2006. “Decentralization and Sustainable Resource Management in West Africa: A Line of Action for Revisiting National Action Programmes.” In Governing Global Desertification: Linking Environmental Degradation, Poverty and Participation, edited by P. Johnson, K. Mayrand, and M. Paquin, 147–162. Farnham, Surrey, UK: Ashgate.
Pender, J., E. Nkonya, P. Jagger, D. Sserunkuuma, and H. Ssali. 2004. Strategies to Increase Agricultural Productivity and Reduce Land Degradation: Evidence from Uganda. Agricultural Economics 31(2/3): 181-195.
Place, F., J. Njuki, F. Murithi, and F. Mugo. 2006. “Agricultural Enterprise and Land Management in the Highlands of Kenya.” In Strategies for Sustainable Land Management in the East African Highlands, edited by J. Pender, F. Place, and S. J. Ehui, 190–216. Washington, DC: International Food Policy Research Institute (IFPRI).
Platteau, J. P. 1996. The Evolutionary Theory of Land Rights as Applied to Sub-Saharan Africa: A Critical Assessment. Development and Change 27:29–86.
Reij, C., G. Tappan, and M. Smale. 2009. “Re-Greening the Sahel: Farmer-Led Innovation in Burkina Faso and Niger.” In Millions Fed, edited by D. Spielman and R. Pandya-Lorch, 53–58. Washington, DC: International Food Policy Research Institute.
Ribot, J. 2001. Local Actors, Powers and Accountability in African Decentralizations: A Review of Issues. Geneva: United Nations Research Institute for Social Development.
Ruecker, G., S. J. Park, H. Ssali, and J. Pender. 2003. Strategic Targeting of Development Policies to a Complex Region: A GIS-Based Stratification Applied to Uganda. ZEF Discussion Papers on Development Policy, No. 69. Bonn, Germany: Center for Development Research (ZEF), University of Bonn.
Ryan, J.G.; Spencer, D.C. 2001. Future Challenges and Opportunities for Agricultural R&D in the Semi-arid Tropics. International Crops Research Institute for the Semi-Arid Tropics . Andhra Pradesh, India, 79.
Sanchez, P. A., K. D. Sheperd, M. J. Soule, F. M. Place, R. J. Buresh, A.-M. N. Izac, A. V. Mokwunye, et al. 1997. “Soil Fertility Replenishment in Africa: An Investment in Natural Resource Capital.” In Replenishing Soil Fertility in Africa, edited by R. J. Buresh, A. Sanchez, and F. Calhoun, 1–46. Madison, WI, US: American Society of Agronomy and Soil Science Society of America.
Sauer, J., and H. Tchale. 2006. Alternative Soil Fertility Management Options in Malawi: An Economic Analysis. Paper presented at the International Association of Agricultural Economists conference, Gold Coast, Australia, August 12–18.
Savadogo, P., L. Sawadogo, and D. Tiveau. 2007. Effects of Grazing Intensity and Prescribed Fire on Soil Physical and Hydrological Properties and Pasture Yield in the Savanna Woodlands of Burkina Faso. Agriculture, Ecosystems and Environment 118 (1–4): 80–92.
Scherr, S., and P. Hazell. 1994. Sustainable Agricultural Development Strategies in Fragile Lands. Environment and Production Technology Division Discussion Paper No. 1. International Food Policy Research Institute, Washington, D.C.
SDP (Smallholder Dairy Project). 2006. The Uncertainty of Cattle Numbers in Kenya. SDP Policy Brief 10. Nairobi, Kenya: International Livestock Research Institute.
Sileshi, G., F. K. Akinnifesi, O. C. Ajayi, and F. Place. 2008. Meta-analysis of Maize Yield Response to Woody and Herbaceous Legumes in the Sub-Saharan Africa. Plant Soil 307:1–19.
Smale, M., and T. Jayne. 2008. “Breeding an ‘Amaizing’ Crop Improved Maize in Kenya, Malawi, Zambia, and Zimbabwe.” In Millions Fed. Proven Successes in Agricultural Development, edited by D. Spielman and R. Pandya-Lorch. Washington, DC: International Food Policy Research Institute.
Smith P., D. Martino, Z. Cai, D. Gwary, H. Janzen, P. Kumar, B. McCarl, S. Ogle, F. O'Mara, C. Rice, B. Scholes, O. Sirotenko, M. Howden, T. McAllister, G. Pan, V. Romanenkov, U. Schneider, S. Towprayoon, M. Wattenbach and J. Smith. 2008. Greenhouse Gas Mitigation in Agriculture, Philosophical Transactions of the Royal Society, B 2008 363:789-813.

77
Smoke, P. 2003. Decentralisation in Africa: Goals, Dimensions, Myths and Challenges. Public Administration and Development 23 (1): 7–16.
Svendsen, M., M. Ewing, and S. Msangi. 2009. Measuring Irrigation Performance in Africa. IFPRI Discussion Paper 00894. Washington, DC: International Food Policy Research Institute .
Thompson J. and J. N. Pretty. 1996. Sustainability Indicators and Soil Conservation. A Participatory Impact Study and Self-evaluation of the Catchment Approach of the Ministry of Agriculture, Kenya. Journal of Soil and Water Conservation 51(4):265-273.
Tittonell, P., M. Corbeels, M. van Wijk, B. Vanlauwe, and K. Giller. 2008. Combining Organic and Mineral Fertilizers for Integrated Soil Fertility Management in Smallholder Farming Systems of Kenya: Explorations using the Crop–Soil Model FIELD. Agronomy Journal 100 (5): 1511–1526.
Toulmin, C., and J. Quan. 2000. “Registering Customary Rights.” In Evolving Land Rights, Policy and Tenure in Africa, edited by J. Toulmin and J. Quan, 207–228. London: Department for International Development; London: International Institute for Environment and Development; Greenwich, UK: Natural Resources Institute.
Tschakert, P. 2004. The Costs of Soil Carbon Sequestration: An Economic Analysis for Small-Scale Farming Systems in Senegal. Agricultural Systems 81:227–253.
UNDP (United Nations Development Program). 2010. Human Development Report 2010. The Real Wealth of Nations: Pathways to Human Development. Palgrave Macmillan, London; New York. 238pp.
UNFPA (United Nations Population Fund). 2009. The State of World Population 2009. Facing a Changing World: Women, Population and Climate. New York: UNFPA.
Vanlauwe, B., and K. E. Giller. 2006. Popular Myths around Soil Fertility Management in Sub-Saharan Africa. Agriculture, Ecosystem and Environment 116:34–46.
Vlek, P., G. Rodriguez-Kuhl, and R. Sommer. 2004. Energy Use and CO2 Production in Tropical Agriculture and Means and Strategies for Reduction or Mitigation. Environment, Development and Sustainability 6:213–233.
Vogel, C., and K. O’Brien. 2006. Who Can Eat Information? Examining the Effectiveness of Seasonal Climate Forecasts and Regional Climate-Risk Management Strategies. Climate Research 33:111–122.
Walton P., R. Martinez and A. Bailey. 1981. A Comparison of Continuous and Rotational Grazing Journal of Range Management, 34(1): 19-21.
World Bank. 2008. World Development Report 2008: Agriculture for Development. Washington, DC: World Bank.
________. 2009. World Development Report 2010: Development and Climate Change. Washington, DC: World Bank.
WDI (World Development Indicators). 2009. World Development Indicators. Online at: http://data.worldbank.org/data-catalog/world-development-indicators
WRI (World Resource Institute). 2003. Forests, Grasslands and Drylands. http://earthtrends.wri.org/select_action.php?theme=9
Yanggen, D., V. Kelly, T. Reardon, and A. Naseem. 1998. Incentives for Fertilizer Use in Sub-Saharan Africa: A Review of Empirical Evidence on Fertilizer Response and Profitability. International Development Working Papers 70. East Lansing, MI, US: Department of Agricultural Economics, Michigan State University.
Yesuf, M., S. Di Falco, T. Deressa, C. Ringler, and G. Kohlin. 2008. The Impact of Climate Change and Adaptation on Food Production in Low-Income Countries: Evidence from the Nile Basin, Ethiopia. IFPRI Discussion Paper 828. Washington, DC: International Food Policy Research Institute (IFPRI).

RECENT IFPRI DISCUSSION PAPERS
For earlier discussion papers, please go to http://www.ifpri.org/publications/results/taxonomy%3A468. All discussion papers can be downloaded free of charge.
1125. Evaluation of value-added agricultural advisory services: Case study of agriclinics in Southern India. Claire J. Glendenning, Kwadwo Asenso-Okyere, and Suresh C. Babu, 2011.
1124. Making Agriculture Pro-Nutrition: Opportunities in Tanzania. Olivier Ecker, Athur Mabiso, Adam Kennedy, and Xinshen Diao, 2011.
1123. Measuring the impacts of global trade reform with optimal aggregators of distortions. David Laborde, Will Martin, and Dominique van der Mensbrugghe, 2011.
1122. Managing future oil revenue in Uganda for agricultural development and poverty reduction: A CGE analysis of challenges and options. Manfred Wiebelt, Karl Pauw, John Mary Matovu, Evarist Twimukye, and Todd Benson, 2011.
1121. Impacts of an early education intervention on students’ learning achievement: Evidence from the Philippines. Futoshi Yamauchi and Yanyan Liu, 2011.
1120. Supply and demand for cereals in Nepal, 2010–2030. Sanjay K. Prasad, Hemant Pullabhotla, and A. Ganesh-Kumar, 2011.
1119. Which trade integration scheme can best help Sub-Saharan Africa develop and export more processed agricultural goods?. Mathilde Douillet, 2011.
1118. Women cotton farmers—Their perceptions and experiences with transgenic varieties: A case study for Colombia. Patricia Zambrano, Jorge H. Maldonado, Sandra L. Mendoza, Lorena Ruiz, Luz Amparo Fonseca, and Iván Cardona, 2011.
1117. Can water allocation in the Yellow River basin be improved?: Insights from a multi-agent system model. Ximing Cai, Yi-Chen E. Yang, Jianshi Zhao, and Claudia Ringler, 2011.
1116. Using the regression discontinuity design with implicit partitions: The impacts of Comunidades Solidarias Rurales on schooling in El Salvador. Alan de Brauw and Daniel Gilligan, 2011.
1115. The quiet revolution in India’s food supply chains. Thomas Reardon and Bart Minten, 2011.
1114. A review of input and output policies for cereals production in Nepal. Hemant Pullabhotla, Ganga Shreedhar, A. Ganesh-Kumar, and Ashok Gulati, 2011.
1113. Do shocks affect men’s and women’s assets differently?: A review of literature and new evidence from Bangladesh and Uganda. Agnes R. Quisumbing, Neha Kumar, and Julia A. Behrman, 2011.
1112. Overcoming successive bottlenecks: The evolution of a potato cluster in China. Xiaobo Zhang and Dinghuan Hu, 2011.
1111. The impact of land titling on labor allocation: Evidence from rural Peru. Eduardo Nakasone, 2011.
1110. A multiregion general equilibrium analysis of fiscal consolidation in South Africa. Margaret Chitiga, Ismael Fofana, and Ramos Mabugu, 2011.
1109. How far do shocks move across borders?:Examining volatility transmission in major agricultural futures markets. Manuel A. Hernandez, Raul Ibarra, and Danilo R. Trupkin, 2011.
1108. Prenatal seasonality, child growth, and schooling investments: Evidence from rural Indonesia. Futoshi Yamauchi, 2011.
1107. Collective Reputation, Social Norms, and Participation. Alexander Saak, 2011.
1106. Food security without food transfers?: A CGE analysis for Ethiopia of the different food security impacts of fertilizer subsidies and locally sourced food transfers. A. Stefano Caria, Seneshaw Tamru, and Gera Bizuneh, 2011.
1105. How do programs work to improve child nutrition?: Program impact pathways of three nongovernmental organization intervention projects in the Peruvian highlands. Sunny S. Kim, Jean-Pierre Habicht, Purnima Menon, and Rebecca J. Stoltzfus, 2011.
1104. Do marketing margins change with food scares?: Examining the effects of food recalls and disease outbreaks in the US red meat industry. Manuel Hernandez, Sergio Colin-Castillo, and Oral Capps Jr., 2011.
1103. The seed and agricultural biotechnology industries in India: An analysis of industry structure, competition, and policy options. David J. Spielman, Deepthi Kolady, Anthony Cavalieri, and N. Chandrasekhara Rao, 2011.
INTERNATIONAL FOOD POLICY RESEARCH INSTITUTE
www.ifpri.org
IFPRI HEADQUARTERS
2033 K Street, NW Washington, DC 20006-1002 USA Tel.: +1-202-862-5600 Fax: +1-202-467-4439 Email: [email protected]