climate risk management - irdhorizon.documentation.ird.fr/exl-doc/pleins_textes/divers17-06/... ·...
TRANSCRIPT

Climate Risk Management 8 (2015) 28–46
Contents lists available at ScienceDirect
Climate Risk Management
journal homepage: www.elsevier .com/ locate /crm
Ethnographic context and spatial coherence of climateindicators for farming communities – A multi-regionalcomparative assessment
http://dx.doi.org/10.1016/j.crm.2015.03.0012212-0963/� 2015 The Authors. Published by Elsevier B.V.This is an open access article under the CC BY license (http://creativecommons.org/licenses/by/4.0/).
⇑ Corresponding author at: CEREGE, Europôle Méditerranéen de l’Arbois, BP80, 13545 Aix en Provence, France.E-mail address: [email protected] (V. Moron).
Vincent Moron a,b,⇑, Joseph Boyard-Micheau c, Pierre Camberlin c, Valeria Hernandez d,Christian Leclerc e, Caroline Mwongera e, Nathalie Philippon c, Florencia Fossa Riglos g,Benjamin Sultan f
a Aix-Marseille University, CEREGE UM 34 CNRS, Aix en Provence, Franceb IRI, Columbia University, Palisades, USAc CRC, Biogéosciences, Université de Bourgogne, Dijon, Franced UMR 245 Centre d’études en sciences sociales sur les mondes africains, américains et asiatiques, University Paris Diderot/Institut de Recherche pourle Développement, Paris, Francee CIRAD, UMR AGAP, Montpellier, Francef Sorbonne Universités (UPMC, Univ Paris 06)-CNRS-IRD-MNHN, LOCEAN/IPSL, 4 place Jussieu, F-75005 Paris, Franceg Universidad Nacional de San Martin (UNSAM), Bueno Aires, Argentina
a r t i c l e i n f o a b s t r a c t
Article history:Available online 25 March 2015
Keywords:Seasonal predictionTropical rainfallRegional scaleCrop systemsVulnerabilityEthnoclimatology
Accurate seasonal predictions of rainfall may reduce climatic risks that farmers are usuallyfaced with across the tropical and subtropical zones. However, although regional-scale sea-sonal amounts have regularly been forecasted since 1997/98, the practical use of these sea-sonal predictions is still limited by myriad factors. This paper synthesizes the main resultsof a multi-disciplinary ethnographic and climatic project (PICREVAT). Its main objectivewas to seek the climatic information – beyond the seasonal amounts – critical for crops,both as an actual constraint to crop yields and as identified by the current and past prac-tices and perceptions of farmers. A second goal was to confront the relevance and signifi-cance of this climatic information with its spatial coherence, which gives an upper boundof its potential predictability. The ethnographic and climatic analyses were carried out onthree very different fields: North Cameroon (mixed food crops associated with a cash crop– cotton – integrated into a national program); Eastern slopes of Mt Kenya (mixed foodcrops, with a recent development of maize at the expense of sorghum and pearl millet);and Central Argentina (mixed crops and livestock recently converting to monoculture oftransgenic soybean, referred to as soybeanization).
The ethnographic surveys, as well as yield–climate functions, emphasized the role playedby various intra-seasonal characteristics of the rainy seasons beyond the seasonal rainfallamounts, in both actual yields and people’s representations and/or crop managementstrategies. For instance, the onset of the rainy season in East Africa and North Cameroon,the season duration in the driest district of the eastern slopes of Mount Kenya, or rainsat the core (August) and at the end of the rainy season in North Cameroon have been high-lighted. The dynamics of farming systems (i.e. soybeanization in Central Argentina, increas-ing popularity of maize in East Africa, recent decline of cotton in North Cameroon) werealso emphasized as active drivers; these slow changes could increase climatic vulnerability(i.e. soybean is far more sensitive to rainfall variations than wheat, maize is less drought-

V. Moron et al. / Climate Risk Management 8 (2015) 28–46 29
resistant than sorghum or millet), at least for the least flexible actors (such as the non-capi-talized farmers in Central Argentina). The cross between ethnographic surveys and climaticanalyses enabled us to identify climate variables that are both useful to farmers andpotentially predictable. These variables do not appear to be common across the surveyedfields. The best example is the rainy season onset date whose variations, depending onregions, crop species and farming practices may either have a major/minor role incrop performance and/or crop management, or may have a high/low potentialpredictability.� 2015 The Authors. Published by Elsevier B.V. This is an open access article under the CC
BY license (http://creativecommons.org/licenses/by/4.0/).
Introduction
All societies are somehow vulnerable to climate, but the exposure to climate hazards is expected to be larger for tropicaland subtropical countries, where a large fraction of gross national product and food supply is provided by rain-fed agricul-ture (Cutter, 1996; Reilly and Schimmelpfennig, 1999; Salinger et al., 2005; Sivakumar et al., 2005; Fussel and Klein, 2006). Inthese countries, climatic vulnerability (Turner et al., 2003; Adger, 2006; Gallopin, 2006) is mostly related to rainfall varia-tions and is often very high in semi-arid areas, where low-income populations strongly depend on very scarce and variablewater resources (Camberlin, 2010). In that context, seasonal rainfall forecasts (Goddard et al., 2001, 2003; Barnston et al.,2010) are a potential tool for farmers to reduce risks and to optimize gains (Glantz, 1977; Dilley, 2000; Luseno et al.,2003; Meinke and Stone, 2005; Hansen et al., 2006, 2009; Challinor, 2009; Sultan et al., 2010a,b; Roudier et al., 2011,2014), even though several issues (e.g. scales and timing of forecasts, translation of expert forecasts into decision-makingprocesses at the farm scale, etc.) currently limit the usefulness of even near-perfect seasonal forecasts (Lamb, 1981;Blench, 1999; Broad and Agrawala, 2000; Singh et al., 2009).
Current seasonal rainfall forecasts focus on the regional (i.e. at least several stations and/or a few grid-points covering anarea usually larger than 105 sq km) and seasonal scales (interannual anomalies averaged over 3 consecutive months,Goddard et al., 2001, 2003; Barnston et al., 2010). These spatio-temporal scales filter out some of the unpredictable noiserelated to internal atmospheric dynamics and small-scale processes, and enhance the potentially predictable signal relatedto the forcing of boundary surfaces, including sea surface temperatures (SST). By definition, a temporal sum, as seasonalamount, integrates all rainy events across a season and is thus the most comprehensive variable from the statistical pointof view. Its spatial coherence at the interannual time scale gives an empirical upper bound of potential predictability, ifwe assume that any slow boundary forcing may induce a quasi-constant homogeneous signal at regional-scale (Moronet al., 2006, 2007). Nevertheless, the highest rainfall, close to the mean annual peak, is not necessarily spatially coherentand may reduce the potential predictability of seasonal amounts.
A regional-scale seasonal amount anomaly is not necessarily the ‘‘optimal’’ variable from the farmer’s point of view. Therainy season onset date prediction is usually considered by farmers to be more relevant than that of the seasonal amountanomaly (Ingram et al., 2002). Any given intra-seasonal characteristic (ISC) is, by definition, included in the seasonal amountas a specific component of the rainy season (for the onset, the temporal phase of its starting stage), but it may not necessarilyconvey its predictable part (Moron et al., 2009a,b; Marteau et al., 2009). Additionally, the usefulness of any ISC of the rainyseason may not be the same for smallholders and commercial farmers. It may also differ between those engaged in a multi-cropping system and those who have adopted a (monocultural?) system, or between those cultivating a well-adapted anddrought-tolerant crop such as sorghum, and those cultivating a less adapted and highly sensitive crop such as maize, butwhich provides an higher net gain in optimal climate conditions. Considering all these contexts, we cannot deny that themost relevant and useful climate variable for farmers does not maximize the signal-to-noise ratio from the climatic pointof view and vice versa.
In this paper we synthesize the main results of a multidisciplinary framework, the PICREVAT project (January 2009–June2013), combining statistical analyses of interannual and intra-annual variability of rainfall and of crop-rainfall relationships(papers by Boyard-Micheau et al., 2013; Moron et al., 2013; Camberlin et al., 2014; Philippon et al., 2015a,b; Hernández et al.,2015) with ethnographic surveys (papers by Leclerc et al., 2013, 2014; Mwongera et al., 2014; Hernández et al., 2015). All theagro-climatic and ethnographic analyses were carried out on three contrasted fields: (1) North Cameroon in the Sudano-Sahelian belt, mixing cotton with subsistence crops (mainly sorghum and maize); (2) Kenya and North Tanzania(Camberlin et al., 2009, 2014; Philippon et al., 2015a,b) with a focus on eastern slopes of Mt Kenya, where small-scale sub-sistence farming is based on mixed cropping systems but maize has gradually surpassed traditional (and less drought-vul-nerable) crops like sorghum and pearl millet (Leclerc et al., 2013, 2014; Mwongera et al., 2014); and (3) central Pampa inArgentina, where the farming system has recently shifted from mixed crops and livestock to dominant transgenic soybeancropping system (Magrin et al., 2005; Pengue, 2005, 2006; Caviglia and Andrade, 2010; Hernandez et al., 2015). A major goalof PICREVAT was to analyze the critical climatic information for crops, both as a constraint on yields through a classical pro-duction-function approach linking observed yields and climate variations (Mendelsohn et al., 1994), and as explicitly iden-tified by local farmers and stakeholders, either through their farming practices or their perception/memory of any adverse

30 V. Moron et al. / Climate Risk Management 8 (2015) 28–46
climate events detrimental to farming. To that aim we explored several of the following issues: (1) the perceived and actualrole of various ISCs on crops, as well as their spatial coherence and relationship to local- and regional-scale seasonalamounts; (2) the social and cultural contexts of farming systems; and (3) the temporal dynamics of farming systems whichare not necessarily induced by climate variations, but potentially modify their vulnerability.
We first present the material and methods used in the different fields (Material and method). Then we describe the farm-ing systems of the three comparative study sites (The context of farming), and present some of the climate information iden-tified as relevant and significant for farming activities (Relevance and significance of climatic parameters for crops andfarmers). The spatial coherence of ISCs and subseasonal rainfall are detailed in ‘Spatial coherence of rainfall at seasonaland intraseasonal time scales’. A discussion (Discussion and concluding remarks) closes the paper.
Material and method
Daily rainfall data
In Kenya and North Tanzania, we selected 36 rain gauges having at most 25% missing entries from 1961 to 2001 (Fig. 1a).Overall there are 5.9 % of entries missing with 21 stations having fewer than 365 missing days. The mean annual cycle(Fig. 1b) shows two maxima associated with the March–May Long rains (LR) and the October–December Short rains (SR).There are rather large spatial variations in mean rainfall with drier areas in the northeast and some lowland areas in thesouth, while rainfall is higher along the Indian Ocean coast and over the highlands of Western and Central Kenya. The bimo-dal annual cycle tends to vanish westward with noticeable rainfall during boreal summer.
In North Cameroon, we selected 33 rain gauges having a maximum of 15% missing entries from 1970 to 2001. 10.7% of theentries are missing in this subset. The spatial sampling rate (Fig. 1c) is the highest of the three networks. Rain gauges arelocated in the cotton production area in North Cameroon, which lies within the Sudano-Sahelian area with a single rainyseason in boreal summer from June to September (Fig. 1d). Cotton is typically grown between the 600 and 1200 mm isohyetsthat correspond to the limits of the land suitable for rain-fed cotton (SWAC/OECD, 2005).
In central Argentina, we focused on two rural districts of the La Plata basin in Central Argentinean Pampas where agri-culture dominates the local-scale economy (Magrin et al., 2005): Junín in the northwestern part of Buenos Aires Province,and San Justo in the north-central region of Santa Fe province. These districts are �400 km far apart and share a similar tem-perate humid to sub-humid climate with a long wet season centered on austral warm summer and a shorter and drier seasoncentered on austral cool winter. Daily rainfall values were obtained for 21 stations (Fig. 1e) from the National MeteorologicalService (NMS) and the National Institute of Agricultural Technology (INTA). There are less than 3% of entries missing from1970 to 2010. The mean annual cycle is flatter than for tropical areas of East Africa and North Cameroon; mean annual rain-fall ranges from 700 mm (in the West) to 1250 mm (in the North-East), which fall rather regularly from October to March.The dry cool season, from May to September, is far from being absolutely dry (Fig. 1f). Even if interannual temperature varia-tions somewhat impact crop yields in this region we focused on rainfall here since previous studies showed that rainfall vari-ability has a greater impact on yields (Podesta et al., 1999, 2002; Messina et al., 1999; Hernandez et al., 2015).
The statistical methods used for rainfall data analysis are detailed in a Supplementary information section.
Ethnological fieldworks
In Kenya, the ethnographic analysis focused on small communities on the eastern slopes of Mount Kenya (methodologicaldetails in Leclerc et al., 2013, 2014; Mwongera et al., 2014). Despite the small size of the area, the interannual variability ofthe seasonal rainfall amounts and ISCs are quite representative of a larger area covering most of Kenya and NorthernTanzania (Boyard-Micheau et al., 2013; Camberlin et al., 2014). Three ethno-linguistic groups, namely the Muthambi,Mwimbi, and Tharaka were investigated. The Muthambi occupy the high altitude, the Mwimbi the high and mid altitudes,whereas the Tharaka are predominantly located at the low altitude with fewer people at the mid altitude. The climate impacton crops on the Eastern slopes of Mt Kenya was assessed with a retrospective survey of seed losses independently reportedby 208 farmers from 1961 to 2006, with a total of 13 cultivated crop species and 53 varieties (see details in Leclerc et al.,2013, 2014).
In North Cameroon, we focused on the cotton company ‘‘SODECOTON’’, a semi-public integrated structure that organizesthe cotton production and is the only agent to buy seed cotton from producers. The cotton administration consists of nineregions grouped into 38 administrative units and of cotton farmers divided into producers’ groups roughly corresponding tothe village level (Sadou et al., 2007; Gergely, 2009). There were about 2000 active producers’ groups in 2011, which repre-sented an average of about 55 groups per administrative unit.
In Central Argentina, both qualitative (ethnographic method) and quantitative methods (land use and tenancy survey, cli-mate vulnerabilities survey, agriculture household survey) have been applied between January 2009 and September 2010(methodological details in Hernandez et al., 2015), for a total of 79 interviews. Three different types of producers weredefined from the ethnographic fieldworks: agribusiness actors, capitalized farmers and non-capitalized farmers. In Junín,these three profiles account for 32%, 46%, and 21% of the surveyed producers, respectively, and in San Justo 50%, 12%, and38%, respectively. These percentages broadly reflect what is observed at the district’s level.

Fig. 1. Location of rain gauges for the three networks with the mean daily rainfall as dotted lines and the spatial average as bold full line.
V. Moron et al. / Climate Risk Management 8 (2015) 28–46 31
The context of farming
Kenya: a multi-cropping farming context
On the Eastern slopes of Mt Kenya, the main crops (i.e. sorghum and maize) are present in over 94% of the farms. Beansand cowpeas are also common while sunflower, finger millet, soybean, tobacco, cassava, and black beans are grown in fewer
32 V. Moron et al. / Climate Risk Management 8 (2015) 28–46
than 5% of the farms (Leclerc et al., 2014; Mwongera et al., 2014). The average number of crop species per farm is 6.23 (stan-dard deviation = 1.67), with a minimum of two and a maximum of 10 crops. Out of a total of 13 crops, only tobacco and sun-flower are grown as cash crops, contrasting with the Cameroon study case. Each farmer grows on average slightly more thanone variety per crop, the overall richness being 1.19 varieties per crop and per farmer.
Cameroon: a cash crop farming context
Cotton in Northern Cameroon is a major cash crop and represents the main source of income (Folefack and Enam, 2011). Itis grown by smallholders with an average of about 0.6 hectares per farmer dedicated to cotton production (Gergely, 2009),representing about 150,000 hectares in 2010. Farmers often associate cotton with subsistence crops, such as millet, sorghum,and maize, which benefit from the fertilizers, materials, and livestock financed by cotton income (SWAC/OCDE, 2005).SODECOTON, like its Malian, Senegalese, and Chadian counterparts, is still a national monopoly. Inputs (seeds, fertilizer,etc.) are provided on credit by SODECOTON before sowing (from May 20, depending on the latitude) and reimbursed at har-vest from the purchase of the cotton seeds to the farmers. SODECOTON then gins and sells the cotton fibers on internationalmarkets. In 2005, at the peak of production 346,661 farmers cultivated 231,993 ha while the number of farmers and the cot-ton growing area dropped by 40% between 2005 and 2010. Farmers abandoned cotton production after a drastic reduction oftheir margins, mostly due to an increase in fertilizer prices but also to weather-related risks. Moreover, farmers unable toreimburse their debt at harvest were not allowed to renew their credit during the next year (Folefack and Enam, 2011).Lastly, the sector also faces other challenges, such as the isolation of the North of the country and a decline in soil fertilitydue to increasing land pressure.
Argentina: a commercial and large-scale farming context
Soybean accounts currently for 75–80% of the total production (and more than 85% of the cropped area) of the four maincrops (wheat, soybean, maize, and sunflower) in the Junín and San Justo districts (Hernandez et al., 2015). Three differenttypes of producers were defined from the ethnographic fieldwork: agribusiness actors, capitalized farmers and non-capital-ized farmers. Agribusiness actors cultivate a large area (usually >1000 ha), owned or rented and possibly spread over severaldifferent regions and countries (i.e. Brazil, Paraguay, Uruguay, and Bolivia). These actors are directly related to the interna-tional market (mainly for soybean) and organize their production through a business network allowing them to controlmany factors (i.e. land renting/occupation, third-party labor, professional and expert boards), to negotiate prices at eachstage of the productive chain (with agro-chemical suppliers, exporters, etc.), and also to improve raw production (e.g., soy-bean oil and flour etc.), generating strategic agreements with other commercial, financial, and technological companies(biotechnology, informatics, agriculture machinery). Capitalized farmers cultivate areas around 500–800 ha and may alsorent lands to increase their production scale, but they tend to remain within the district; i.e. their rented lands are generallynear an inherited nucleus of lands. Their capitalization is mostly based on agriculture machinery, which is used on their ownlands and also for agricultural services contracts to ensure a higher profitability. Their production is directed toward bothinternational and national markets. Lastly, non-capitalized farmers organize their production exclusively on their own lands,since the current increase of the rental price of land excludes them from real estate market. Most of their farms are smallerthan 200 ha. They may or may not hire third-party services (agriculture machinery is usually too expensive to purchase, sothey manage old or refurbished machineries) and their production is directed mostly to self-subsistence and local markets(local and regional fairs). Neither capitalized nor non-capitalized farmers have the capacity to really negotiate various inputs,supplies, and third-party services. Their fixed costs are thus higher (and usually much more) than those of agribusiness(Hernández et al., 2015).
Relevance and significance of climatic parameters for crops and farmers
In this section we synthesize the analyses carried out on (1) the relevance of climatic parameters for crop yields and (2)the significance of climatic parameters for farmers, including their farming strategies for coping with adverse climaticevents. Note that we have not systematically applied generic methods to the three different terrains. The relevance was esti-mated using classical production-function approaches linking crop yields and various components of the rainy seasons, butalso through ethnographic surveys of farmers and stakeholders about climatic factors having an impact on crops and yields.In East Africa and Central Argentina, analysing current and past farming practices helps reveal the most critical climaticvariables.
Eastern slopes of Mt Kenya
The climate impact on crops on the Eastern slopes of Mt Kenya was first assessed with a retrospective survey of seedlosses independently reported by farmers from 1961 to 2006 (see details in Leclerc et al., 2014). Rainfall variations werea posteriori analyzed (Leclerc et al., 2013, 2014 ; Camberlin et al., 2014) so that causes mentioned by farmers for each yearlyloss could be associated with specific climatic events, considering with an open mind not only seasonal amounts but also

V. Moron et al. / Climate Risk Management 8 (2015) 28–46 33
intra-seasonal characteristics such as onset, withdrawal, and mean length of dry spells (defined in Supplementary informa-tion). The main adverse climate events – mostly drought – as they were experienced and recalled by Meru farmers, fit ratherwell with what can be inferred from observed rainfall data (Leclerc et al., 2013). In particular, during the LR, seed lossesrecalled by farmers coincided with six major drought years, including the 1984 drought, which is considered the worst overthe last century in Kenya (Nyamwange, 1995; Ogallo and Ambenje, 2005), and was associated with anomalously rare wetdays and a shorter rainy season than usual.
The climate impact on crops was also assessed by considering statistics of maize production by districts of the easternslopes of Mt Kenya for the years 1997–2006, and collected from the Famine Early Warning Systems Network (FEWSNET), Kenya office. They show that for the LR in the drier, lowland district of Tharaka, the duration of the rainy season playsa major role for the crop, with yields strongly controlled by the interannual variations of the withdrawal date of the rains andtotal production mainly controlled by that of the onset date (Fig. 2). In wetter districts, the correlation between rainfall andmaize yields is weaker (not shown).
In Eastern Africa, the onset date of the rainy season is usually considered as the climatic information most awaited byfarmers (Recha et al., 2008; Rao et al., 2011; Orlove et al., 2010; Speranza et al., 2008). We evaluated the significance of onsetfor farmers through a 2-year survey along the eastern slopes of Mt Kenya. Mwongera et al. (2014) randomly sampled farmersat three altitudes (750, 950, and 1100 m), recording sowing dates of all major crops during two SR seasons (2009 and 2010)and two LR seasons (2010 and 2011, Table 1). Observed daily rainfall is unavailable for these seasons and locations. We usedproxy rainfall estimates from the second version of the RFE dataset on a 0.1� grid (Novella and Thiaw, 2013) to determine theLR onset date (defined in Supplementary information), after having verified that it is well correlated with available observedrainfall data (correlation of 0.64 with onset dates at Weru station over a 14-year period). Table 1 shows that there is a mis-match between the onset and farmers’ sowing dates. Despite the fact that the 2010 and 2011 LR are very contrasted (veryearly vs very late onset, respectively), the sowings were made �one month after (or before) the local-scale onset in 2010(2011), with a difference of less than 5 days between the two years, except at low altitude (Table 1). The mismatch is smallerfor both SR seasons even if they are less contrasted from the climatic point of view. It is possible that RFE estimates smooth
11Mar 31Mar 20Apr 9May 29May+2
+1
0
−1
−1
0
+1
+2
norm
alis
ed u
nits
nor
mal
ised
uni
ts
(a) Rainfall anomalies in years with low/high maize yield
RAINY SEASON ENDRAINY SEASON ONSET
RAIN DAYS FREQUENCY
RAIN INTENSITY
average intensity
average rain days freq.
aver
age
ons
et d
ate
aver
age
end
dat
e
LOW YdHIGH Yd
11Mar 31Mar 20Apr 9May 29May+2
+1
0
−1
−1
0
+1
+2
norm
alis
ed u
nits
nor
mal
ised
uni
ts
(b) Rainfall anomalies in years with low/high maize production
RAINY SEASON ENDRAINY SEASON ONSET
RAIN DAYS FREQUENCY
RAIN INTENSITY
average intensity
average rain days freq.
aver
age
ons
et d
ate
aver
age
end
dat
e
LOW Prod.HIGH Prod.
Fig. 2. Rainfall anomalies associated with variations of maize yield, (a) and maize production, (b) in Tharaka district, Kenya, for the Long Rains seasons1997–2006. Dashed blue lines correspond to the average of the 4 years having the highest yield/production. Solid red lines correspond to the average of the4 years having the lowest yield/production. The rainfall anomalies of four variables, based on data from Tunyai station, Tharaka district, are shown alongfour different axes. The long-term averages of these variables are displayed as thin black dotted lines. Wider boxes in the horizontal direction for years withgood crop years denote the influence of the rainy season duration. (For interpretation of the references to color in this figure legend, the reader is referred tothe web version of this article.)

Table 1Mean sowing dates with their standard deviations for the 4 seasons in 2009–2011 along the eastern slopes of Mount Kenya at high (1150 m asl), mid (950 m)and low (750 m) altitudes. The onset date is computed based on RFEv2 daily rainfall data for three grid-points located at 0.3�S and 37.7�E,37.8�E and 37.9�E forthe high, mid and low altitudes respectively.
Sample size Sowing mean date Sowing standard deviation Onset date of the rains
LR 2010 (high) 131 March 12 ±9.8 days Feb 12LR 2010 (mid) 200 March 10 ±9.2 days Feb 12LR 2010 (low) 48 March 7 ±6.3 days Feb 12LR 2011 (high) 191 March 12 ±4.5 days Apr 13LR 2011 (mid) 136 March 5 ±9.4 days Apr 22LR 2011 (low) 73 March 17 ±22 days Apr 22SR 2009 (high) 257 Oct 18 ±7 days Oct 10SR 2009 (mid) 335 Oct 16 ±7 days Oct 10SR 2009 (low) 134 Oct 7 ±14.6 days Oct 10SR 2010 (high) 196 Oct 18 ±7.4 days Oct 22SR 2010 (mid) 245 Oct 14 ±11.1 days Oct 22SR 2010 (low) 69 Oct 10 ±9.5 days Oct 22
34 V. Moron et al. / Climate Risk Management 8 (2015) 28–46
out the real spatial variations of rainfall, while our analysis samples only two years. However, the absence of any systematicrelationship between onset and sowing dates as well as the large spatial variations in sowings raises at least the question ofthe onset date’s relevance in farmer’s crop calendar in this area.
North Cameroon
Cotton largely depends on rainfall availability. The role of climate variability in cotton yields in Western and CentralAfrica has been documented by Albergel et al. (1985), Kangah (2004), Blanc et al. (2008), and Sultan et al. (2010a) using sta-tistical analyses applied to both weather and yield data. Blanc et al. (2008) pointed out the impact of precipitation dis-tribution and timing during the cotton-growing season on yield plot observations in Mali. The onset and duration of therainy season were recently found to be the major drivers of interannual and spatial variability of yields in NorthCameroon (Sultan et al., 2010a). The authors illustrated that the driest locations in northernmost Cameroon are not onlythe least productive in terms of mean yield but also the most sensitive to climate fluctuations. In the northern part of thecotton production belt, a potential decrease of the mean annual rainfall in the context of climate change would largelydecrease the mean productivity and increase the risk of crop failure (Sultan et al., 2010a,b).
From the interviews carried on, it appears that SODECOTON employees perceive climate variability as an important riskfor cotton production and express a strong need to receive climate forecasts. More particularly, interviews revealed that theirmain concern regards the intra-seasonal variability of rainfall. The perceived importance of the rainy season onset corrobo-rates results from statistical analyses (Sultan et al., 2010a). Indeed, an early (late) onset of the rainy season is associated withhigher (lower) yields and a forecast of the onset of the rainy season one month in advance would allow them to adjust theirplanting strategies. For example they might increase (decrease) cropped areas and apply more (less) fertilizer in case of fore-cast for an early (late) rainy season onset. The interviews also pointed to climate risks that were not yet revealed by scientificanalysis, such as the importance of heavy rains in August (core of the rainy season) which have an impact on fruit-bearingorgans and may increase weeds and insect pressure. Farmers mentioned that forecasts of such heavy rains in August wouldhelp them improve their weed control and optimize their stock of pesticides and herbicides. Lastly, SODECOTON employeesalso mentioned the risk of heavy rains at the end of the rainy season that affects cotton flocks. Among the adaptation options,interviews revealed that forecasts of these heavy rains would lead to early sowing if the forecasts were issued before thebeginning of the growing season or to early harvests if the forecasts were issued few days in advance only.
Central Argentina
Ethnographic field surveys showed that Junín’s farmers emphasize drought and flood as adverse climatic events whilethose of San Justo tend to balance the overall effect of climate with other socio-economic factors (see details inHernandez et al., 2015). This contrasted sensitivity is somehow verified by a quantitative assessment of the relationshipsbetween observed annual rainfall amounts and yields (of wheat, sunflower, maize, and soybean), which, at least in Junín,already reveal some non-linearities (Hernandez et al., 2015). The main climatic risk for soybean and maize is the usuallynon-linear negative effect of long-lasting dry spells, especially near or after the normal sowing dates, while very wet days(i.e. wet days receiving more than the 90% percentile of daily rainfall excluding dry days) appear to be beneficial, especiallyfrom the middle to the end of the cropping cycle. These relationships are strongest for soybean and, to a lesser extent, maize.They are rather weak for wheat, and overall reversed for sunflower, which is the sole crop for which too much rainfallappears to be adverse in mean. The adverse effect of too much rainfall on soybean and maize is less phase-locked and morediluted across the crop cycle and is thus difficult to emphasize in mean (Hernandez et al., 2015).
Agribusiness producers are able to mitigate the effects of floods and drought through geographical (Akponiké et al., 2011)and crop diversification strategies, and to impose its priorities (sowing, harvesting, etc.) to other actors. The availability of

V. Moron et al. / Climate Risk Management 8 (2015) 28–46 35
machinery and large equipment gives them more flexibility to tackle any adverse climate events, even those that are barelypredictable, and to benefit from any seasonal forecast, even at regional scale. Capitalized farmers share some strategies withagribusiness farmers to mitigate flood and drought damages such as productive diversification, private channeling, and wetgrain storage (i.e. plastic bags), but they are less flexible than agribusiness actors due to the fact that they are forced to pro-vide agricultural services to agribusiness actors. In case of adverse climate events, their main strategy is to save on agricul-tural services and sub-contracting, endangering their own harvests. Non-capitalized farmers are the least flexible, and arethus more exposed to any climatic adverse events. In case of prolonged drought near the onset of wet season, their only pas-sive option is to postpone sowing until it rains enough to have a sufficient amount of water stored in the upper soils. Theyhave no access to specialized private counseling so they turn to the traditional strategy of diversifying risks by combiningagriculture on one hand and dairy production and/or livestock breeding on the other hand.
Synthesis
Our main goal in ‘Relevance and significance of climatic parameters for crops and farmers’ was to confront two comple-mentary approaches of the relevance of rainfall parameters for yields, namely (1) a statistical analysis of the relationshipbetween rainy seasons components and crop yields and productions and (2) an identification of the relevant climate infor-mation for coping with climate variability by considering the farmers’ perception, knowledge, and practices. Despite the dif-ferences between the fieldwork and the methods applied to identify the relevant climate information, several commonresults emerge detailed hereafter.
The onset seems to be a pertinent ISC from the farmers’ point of view since it affects the crop calendar, fixing sowing datesand enabling adaptation options such as the selection of varieties having the best-suited crop cycle length. Onset date varia-tions do affect crop production (e.g., cotton in Cameroon and maize in Kenya) but the 2-year survey along the eastern slopesof Mt Kenya suggests that farmers’ sowing dates actually seem to be unrelated to the local-scale onset date. It is impossibleto conclude if this mismatch is due to the small sampling of years (even if onset dates in the 2010 and 2011 LR seasonsappear to be very contrasted) and/or to the farmers’ perception that the onset is too chaotic and largely unpredictableand thus not considered apart from its mean climatological phase.
The farmers’ interest and/or crop sensitivity are not restricted to the rainy season onset. For example, rainfall near theseasonal peak (i.e. in August) and at the end of the season are perceived as potentially detrimental to cotton yields inNorth Cameroon. The statistical analysis of the relationship between ISC and yields in the Tharaka district in Kenya also sug-gests that the LR duration, which depends on onset and end dates of the rainy season, may also be a relevant ISC, at least forthe driest districts on the eastern slopes of Mt Kenya.
Spatial coherence of rainfall at seasonal and intraseasonal time scales
The above section has pointed to relevant climatic variables, i.e. those whose variability is both perceived and estimatedas detrimental to crops by farmers and through statistical analyses relating climate and yield time-series. This section pro-poses a systematic analysis of the potential predictability of several rainy seasons descriptors (ICSs) in our three study sites.Note that we use the term ‘‘potential’’ since the ISCs predictability is only estimated through their spatial coherence; noattempt is being made to relate their variability to any predictor field (e.g. sea surface temperatures).
Spatial coherence of seasonal amounts at interannual time scale
Our first hypothesis is that spatial coherence of the interannual anomalies gives an empirical upper bound of potentialpredictability (Moron et al., 2006, 2007). We started our analysis with the seasonal amount, which is by definition the mostcomprehensive characteristic of the rainy season at the local scale, since the temporal aggregation considers all rainy eventsacross the whole season.
The simplest way to estimate the regional-scale signal is to consider the spatial average of standardized anomalies (Katzand Glantz, 1986; Moron et al., 2006). A refined solution is to consider the reconstructed variations from the leadingEmpirical Orthogonal Functions (EOF, see Supplementary information). Parallel Analysis (PA, Franklin et al., 1995) givesan estimate of the threshold between the ‘‘signal’’ (any covariant variations among the stations) and the ‘‘noise’’ (indepen-dent variations among the stations) through the comparison of the observed eigenspectrum with one computed fromindependent white noise time series.
In all of our three networks, except for LR in Kenya/North Tanzania, only the first eigenvalue of the seasonal amounts isfound to be statistically significant using PA. The second eigenvalue is also above the noise level for LR in Kenya/NorthTanzania (Fig. 3). We can assume that the first (or two in the case of LR in Kenya/North Tanzania) leading EOF convey(s)the (regional-scale) spatially-covariant interannual signal, which is assumed to be, at least partially, potentially predictable.In the following, this signal is simply computed as the spatial average of the reconstructed time series using only the leadingEOF – singular value – PC triplet (together with the second one, for the LR in East-Africa), explaining respectively 50% (LR inKenya and North Tanzania), 64% (SR in Kenya and North Tanzania), 36% (North Cameroon), and 41% (Central Argentina) ofthe interannual variations of local seasonal amounts.

Fig. 3. Loadings (i.e. correlations between principal component and original data) of the significant eigenvectors (of seasonal amounts) according to parallelanalysis (Franklin et al., 1995), that is the comparison between the observed eigenspectrum with the one computed with independent white noise timeseries having the same size as the observed data. The random eigenspectrum is computed 100 times. The eigenvalues above the 99% noise level areconsidered to convey spatially-covariant signals across the network while the eigenvalues below the 99% noise level do not show anything thanindependent variations amongst the stations.
36 V. Moron et al. / Climate Risk Management 8 (2015) 28–46

V. Moron et al. / Climate Risk Management 8 (2015) 28–46 37
Relationships between local-scale/regional-scale seasonal amount and intraseasonal characteristics
The next step is to analyze the relationships between local-scale and regional-scale (estimated from the first (or two forLR in Kenya) leading EOF) seasonal amounts (S) on one hand and the whole set of ISCs (Fig. 4). The aim is to picture which ISCmost contributes to the seasonal amount predictability. Practically, these ISCs cover the temporal phase (onset, withdrawal)and duration of the rainy season, as well as frequency and duration of dry spells (i.e. consecutive days receiving less than1 mm) and wet spells (i.e. consecutive days receiving at least 1 mm). The mean daily rainfall intensity, referred to hereaftersimply as intensity, is also computed as an ISC. In fact, all of these properties are included in S and they can be analyticallyinferred from daily sequences of rainfall (Fig. 4). We will analyze the amount of covariance between any local-scale (sub-script ‘‘LOC’’) ISC and local and regional-scale (subscript ‘‘REG’’) S, assuming that SREG (i.e. spatial average of SLOC variationsreconstructed by the first EOF, except for LR where the two leading EOFs are used) conveys, at the first guess, the potentiallypredictable signal. The contribution of each local-scale ISC to the interannual variability of SLOC and SREG, and their potentialpredictability, is analyzed through stepwise regression.
Fig. 5 shows the simplest decomposition of either SLOC or SREG into frequency (FLOC) and intensity (ILOC) of rain days (com-puted on fixed seasons). By definition (Fig. 4), FLOC and ILOC together explain the whole variance of SLOC (see black dotsalways = 1 on the left column of Fig. 5). FLOC is the first variable entering the stepwise model for the driest network (theSR, and then the LR, in Kenya and North Tanzania). ILOC is the first contributor for the two other networks. When SREG isthe explained variable, FLOC appears to be the first contributor to the four networks, consistent with other observations acrossthe tropical zone (Moron et al., 2006, 2007), suggesting that the interannual variability of SREG is mostly conveyed by system-atic variations of number of wet days at the local scale (i.e. an anomalously wet season at regional-scale tends to be mostlyassociated with more frequent wet days at local-scale rather than higher daily mean intensity of rainfall).
Fig. 4. Analytical decomposition of seasonal amount into intra-seasonal characteristics (ISC) at local-scale. The italicized equations associate any ‘‘child’’ ISCto its ‘‘parent’’ (for example, Length of the season (L) = End date (E)�Onset date (O) + 1). The equations in bold orange associate the ‘‘dependent’’ ISCs, that isan ISC conditional on two other ISCs, its ‘‘parent’’ and another ISC at the same level (for example, Daily mean intensity of rainfall (I) = Seasonal amount (S)/seasonal Frequency of wet days (F). These dependent ISCs could be computed only at the end of the rainy season from other ISCs and could not be directlymeasured. (For interpretation of the references to color in this figure legend, the reader is referred to the web version of this article.)

Fig. 5. (bars) relative frequency of rain-gauges where either seasonal frequency of wet days (F) or mean intensity of rainfall (I) contribute significantly (atthe 95 % level of significance) to the interannual variability of local-scale (left column) and regional-scale (right column) seasonal amounts (S) according to astepwise regression. The order (first rank in red and second rank in orange) is the one to which the variable enters the stepwise regression. (black dots) totalrelative frequency of rain-gauges where either F or I contributes significantly to the interannual variations of S according to the stepwise regression. Allseasons are fixed (i.e. FMAMJ and SONDJ for Kenya/North Tanzania, AMJJASO for North Cameroon and SONDJFMAM for Central Argentina). (Forinterpretation of the references to color in this figure legend, the reader is referred to the web version of this article.)
38 V. Moron et al. / Climate Risk Management 8 (2015) 28–46
A more complete decomposition of SREG and SLOC involves ILOC and four other ISCs related to FLOC (Fig. 6): NDLOC (frequencyof dry spells), DLOC (mean length of dry spells), NWLOC (frequency of wet spells), and WLOC (mean length of wet spells). Thecontribution of ILOC is always dominant in SLOC. The second most important contributor is WLOC while the three other ISCs areless important (Fig. 6). In other words, it suggests that the most important contribution of FLOC in SLOC is conveyed throughthe mean length of wet spells (i.e. an anomalously local-scale wet season is primarily associated with anomalously long wetspells). When seeking to explain the interannual variations of SREG, the contributions of ILOC and WLOC now strongly decrease,
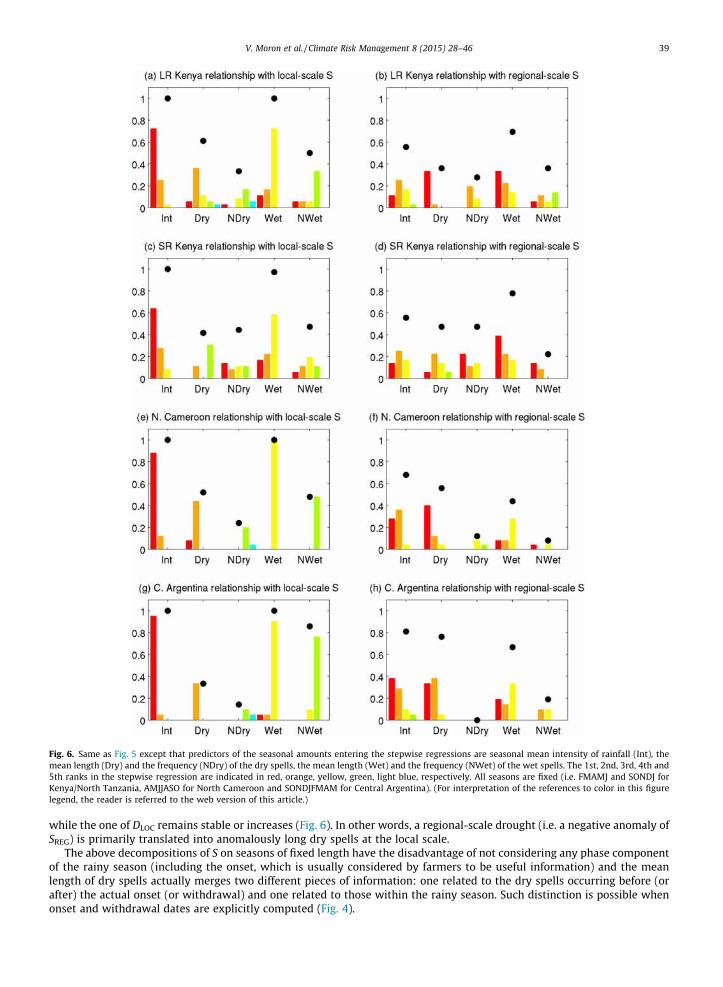
Fig. 6. Same as Fig. 5 except that predictors of the seasonal amounts entering the stepwise regressions are seasonal mean intensity of rainfall (Int), themean length (Dry) and the frequency (NDry) of the dry spells, the mean length (Wet) and the frequency (NWet) of the wet spells. The 1st, 2nd, 3rd, 4th and5th ranks in the stepwise regression are indicated in red, orange, yellow, green, light blue, respectively. All seasons are fixed (i.e. FMAMJ and SONDJ forKenya/North Tanzania, AMJJASO for North Cameroon and SONDJFMAM for Central Argentina). (For interpretation of the references to color in this figurelegend, the reader is referred to the web version of this article.)
V. Moron et al. / Climate Risk Management 8 (2015) 28–46 39
while the one of DLOC remains stable or increases (Fig. 6). In other words, a regional-scale drought (i.e. a negative anomaly ofSREG) is primarily translated into anomalously long dry spells at the local scale.
The above decompositions of S on seasons of fixed length have the disadvantage of not considering any phase componentof the rainy season (including the onset, which is usually considered by farmers to be useful information) and the meanlength of dry spells actually merges two different pieces of information: one related to the dry spells occurring before (orafter) the actual onset (or withdrawal) and one related to those within the rainy season. Such distinction is possible whenonset and withdrawal dates are explicitly computed (Fig. 4).
40 V. Moron et al. / Climate Risk Management 8 (2015) 28–46
Considering seasons of variable length (using onset O and withdrawal E with their difference plus one giving the length Lof the season) instead of fixed length has almost no impact on the interannual variability of SLOC or FLOC at local-scale; themean correlations (spatially averaged over the rain gauges) between variable- and fixed-season SLOC equal to 0.95 (Kenya/North Tanzania Long rains), 0.97 (Kenya/North Tanzania Short rains), 0.98 (North Cameroon), and 0.92 (CentralArgentina). The correlations are slightly lower for FLOC (mean r = 0.85, 0.90, 0.85, and 0.82 for LR, SR, North Cameroon,and Central Argentina, respectively). The impact is still weak on WLOC (mean r = 0.77, 0.80, 0.95, 0.91 for LR, SR, NorthCameroon, and Central Argentina, respectively) while it is stronger as expected on DLOC (mean r = 0.42, 0.51, 0.51, and0.62 for LR, SR, North Cameroon, and Central Argentina, respectively). Fig. 7 shows the same information as Figs. 5 and 6,but for ISCs computed between the onset and the withdrawal dates of the rainy season. At the local scale (left column ofFig. 7) ILOC and WLOC are still the most important contributors to the interannual variability of SLOC while the contributionof OLOC and ELOC is always small (Fig. 7a,c,e,g). The contribution of duration is higher for Central Argentina. At the regionalscale, it is difficult to extract any generic behavior across the 3 networks and it seems that the large contribution of FLOC toSREG (Fig. 7b,d,f,h) comes from the whole range of parameters rather than one single parameter: mostly NWLOC in Kenya andNorth Tanzania, LLOC and WLOC in North Cameroon, and NDLOC and WLOC in Central Argentina (Fig. 7).
The above analyses start from S due to its ‘‘comprehensive’’ character by considering rainy events on the whole across theseason. But the interannual variability of SLOC and SREG could be strongly impacted by a few rainy days not necessarily relatedto medium-to-large scale climate variability, and this noisy component could hide spatially coherent signals in other ISCs. Toovercome this possible bias we have analysed the rainy seasons through the subseasonal scenarios approach developed byMoron et al. (2013).
Rainfall subseasonal scenarios
A subseasonal scenario refers to spatially covariant behavior of rainfall across a season. This analysis has already beenperformed on LR of Kenya/North Tanzania (Moron et al., 2013, see Supplementary information for technical details), andis now extended to the three other rainy seasons/sites studied. Basically, subseasonal scenarios describe typical temporalbehavior of the rainy season across a network of stations by emphasizing the spatially covariant signals. Contrary to theabove analysis, this approach does not start from interannual variations of seasonal amounts but rather from the spatio-tem-poral covariant and persistent signals inside each season.
For LR in Kenya/North Tanzania, four scenarios are retained, as discussed in Moron et al. (2013). Two scenarios, a ‘‘wet’’one and a ‘‘dry’’ one, show their largest anomalies occurring around March, that is, during the first half of the rainy seasonand not during the main seasonal peak (Fig. 8c and d). The two other scenarios show (1) a diluted rainy season with positiveanomalies on the edges of the season surrounding negative anomalies near the normal seasonal peak (Fig. 8b), and (2) a con-tracted rainy season with positive rainfall anomalies peaking in April (Fig. 8a). Note that the variations at the coastal stations(identified from EOF#2 of seasonal amounts, Fig. 3) slightly differ from the remaining stations but the general behavior israther similar (Fig. 8, red lines).
The scenarios for the other networks are summarized on Fig. 9, showing the spatial average +/� one standard deviationamongst the stations of the network. For the East African SR (Fig. 9b), the two subseasonal scenarios are by definition sym-metric around 0 except that skewness leads to stronger positive anomalies. The largest anomalies are now phase-locked withthe mean seasonal peak from mid-October to late November while anomalies tend to zero thereafter (Fig. 9b). In this case,the seasonal amount is probably the optimal variable to forecast since the interannual anomalies of the rainfall close to theclimatological peak are indeed spatially covariant.
For North Cameroon (Fig. 9c), there are strong intra-seasonal modulations of the rainfall anomalies for the three subsea-sonal scenarios. It means that getting a whole season with positive or negative rainfall anomalies at regional-scale may be arare event. The ‘‘wet’’ scenario (in blue1 on Fig. 9c) shows mostly positive anomalies from late July until late September whileearlier in the season anomalies are close to zero. The second scenario (in green on Fig. 9c) shows positive anomalies during thefirst half of the season followed by negative anomalies peaking from late July to late September. The last scenario, which is over-all dry (in red on Fig. 9c), shows strong negative anomalies at both the beginning and the end of the season surrounding weaknegative anomalies.
Intra-seasonal modulations of rainfall are also evidenced for Central Argentina (Fig. 9d) where the ‘‘wet’’ scenario (in blueon Fig. 9d) exhibits positive anomalies until December, then from late March to early May, surrounding near-normal to nega-tive anomalies in January/February, while the ‘‘dry’’ scenario (in green on Fig. 9d) shows, by definition, symmetricalanomalies.
Discussion and concluding remarks
There are myriad factors limiting the skill and the practical and/or efficient use of current seasonal predictions (Blench,1999; Broad and Agrawala, 2000; Hansen, 2002, 2005; Hansen et al., 2006), despite their promises to decrease the vulnera-bility and increase the food security of rural communities, especially in the tropics where malnutrition is still rife. The
1 For interpretation to colours in Fig. 9, the reader is referred to the web version of this paper.

Fig. 7. Same as Fig. 5 except that predictors of the seasonal amounts entering the stepwise regressions are seasonal mean intensity of rainfall (Int), the onset(Ons), withdrawal (End) and Length (Dur) of the rainy season, the mean length (Dry) and the frequency (NDry) of the dry spells, the mean length (Wet) andthe frequency (NWet) of the wet spells and the seasons are defined by onset and withdrawal of the season. The 1st, 2nd, 3rd, 4th, 5th and 6th ranks in thestepwise regression are indicated in red, orange, yellow, green, light blue, dark blue, respectively. (For interpretation of the references to color in this figurelegend, the reader is referred to the web version of this article.)
V. Moron et al. / Climate Risk Management 8 (2015) 28–46 41
PICREVAT project’s initial goals were neither to scrutinize all natural, socio-economic, and political parameters that limit thepractical use of seasonal forecasts, nor to explore all ways that can be used to assess the relationships between climate andyields (Hansen, 2002; Hansen et al., 2006), but rather to point at some critical climate information for crops, both as actualconstraints to crop yield variability, and as explicitly identified by local farmers and inferred from their practices or memo-ries in three different agro-socio-climatic contexts.
A first goal was to assess the relevance of rainy seasons’ intraseasonal components for farmers and their spatial coher-ence. A first main result is the development of two different methodologies: the analytical decomposition of the seasonal

Fig. 8. Rainfall standardized anomalies of the 4 k-means clusters in Kenya in FMAMJ. The rainfall anomalies are reconstructed from a fuzzy k-means in theEOF-space of the significant components (see Supplementary information). The red curves are for the 5 stations along the Indian coast (where EOF#2absolute loading of seasonal amount is larger than EOF#1). (For interpretation of the references to color in this figure legend, the reader is referred to theweb version of this article.)
Fig. 9. Spatial average of standardized rainfall anomalies associated with the subseasonal scenarios (the error bars are +/� one standard deviation acrossstations).
42 V. Moron et al. / Climate Risk Management 8 (2015) 28–46

V. Moron et al. / Climate Risk Management 8 (2015) 28–46 43
rainfall amount into ISCs (Fig. 4) and the extraction of typical subseasonal variations of rainfall. Both approaches allow us toevaluate the potential predictability of rainfall beyond that of seasonal amounts, i.e. toward finer time and spatial scales,which are theoretically better-suited for impact studies and can be tailored for practical use. The seasonal rainfall amountis the most comprehensive variable by definition, and is almost the only target of current seasonal predictions. But seasonalamounts may be strongly impacted by a few heavy rainy days spread across the season, thus hiding relevant climate signals.The analytical breakdown of seasonal amounts into ISCs is appealing in that it targets climate components (e.g. the onset ofthe rains, the length of dry spells, the intensity of the rains) with a potential significance in terms of both agronomy and rain-fall dynamics. The drawback is that it decreases the signal-to-noise ratio since some of the intra-seasonal characteristics,typically the onset and withdrawal, are related to a single wet event inside each rainy season. It is actually trivial that split-ting the interannual information conveyed by the most comprehensive variable, i.e. the seasonal amounts, increases the riskof getting purely local, and thus unpredictable, variations, even if the resulting quantities would perfectly fit with farmers’needs. The subseasonal scenarios, recently used by Moron et al. (2013) in Kenya and North Tanzania, appear promising inthat they avoid the arbitrary definition of onset/withdrawal while still giving some information on the phase of the rains.A possible side effect is the sensitivity to parameters of the cluster analysis (see Supplementary information).
Climatically speaking, our results suggest a modulation in the spatial coherence, thus potential predictability (Moronet al., 2006, 2007), of the ISCs or of specific phases of the rainy season (Figs 5–9). It is important to target the most predictableISCs/phases within the rainy season, and to identify those which will be harder, or even impossible, to predict. For the vari-ables considered predictable from the climatic point of view, the lead-time for practical use by farmers is also a critical issue.The onset, which is usually awaited by farmers to sow, is suggested to be potentially predictable in some regions, such asEast Africa during the LR, Indonesia (Moron et al., 2009a), and the Philippines (Moron et al., 2009b), but not in the three othercases studied, nor in Niger, despite a surprisingly good match between sowing dates and rainy season onset dates (Marteauet al., 2009).
The case of North Cameroon is interesting since the spread between the three subseasonal scenarios is large – from Apriluntil mid-May – suggesting a potential for onset forecasts, but then suddenly decreases around the mean date in early June.The scenarios are then undifferentiated, with rainfall anomalies close to zero in June and July, but tend to spread againtoward the end of the season, suggesting again a potential for end forecasts (Fig. 9c). This behavior tends to fit with farmers’expectations since the performance of both the beginning and the end of the season (in particular the occurrence of heavyrains at this time) seems decisive for crops according to cotton growers and statistical analyses of yields vs rainfall.
In Central Argentina, the two subseasonal scenarios differ more in September–November than at the end of the seasonfrom early April (Fig. 9d). The SR in East Africa (Fig. 9b) illustrate a case where the internal modulation of spatial coherenceseems phase-locked with the climatological seasonal peak, i.e. the highest rainfall amounts in mean are the most spatially-coherent. In this specific case, the seasonal amount is probably the optimal characteristic to predict, and it is perhaps easierto infer ISCs from predicted seasonal forecasts than try to forecast ISCs directly or through subseasonal scenarios. This cor-roborates the fact that the predictive skill is much higher over East Africa in October–November (Mutai et al., 1998;Philippon et al., 2002; Hastenrath et al., 2004) than in March-May (Camberlin and Philippon, 2002).
The translation of climate information into action requires three elements: salience, credibility, and legitimacy (Travisand Bates, 2014). Salience refers to the relevance of the information to the needs of decision makers while credibility andlegitimacy refer to the accuracy and the perception of the climatic information provided. The onset of the rains is a priorisalient information since it is usually termed as awaited information and often coincides with sowing (Marteau et al.,2011), which is a direct action of farmers. However, its salience may be questioned based on the experience gained fromthe Eastern slopes of Mt Kenya where dry sowings, independent from the agronomic onset, are common, at least duringthe SR (Mwongera et al., 2014). Does this practice come from the integration of past knowledge/memory and the difficultyto in predicting onset? The credibility of onset from the climatic point of view (that is, its skill in climatological terms plus itsusefulness) clearly varies geographically, at least among our limited set of terrains. In North Cameroon, and in the Sahel ingeneral (Marteau et al., 2009), the agronomic onset, as defined here, may hardly be predictable while there are some promis-ing signals over East Africa during the LR associated with the large dispersion amongst the subseasonal scenarios (Figs. 8, 9a).The salience of onset is likely to decrease when the wet season is long and/or when the transition from dry to wet conditionsis very gradual, as in Central Argentina. In this case, the spread between the two subscenarios is rather large in Septemberand October during the transition between drier and wetter season.
A second goal was to assess the interest (1) in analysing climate/society relations in a more integrated way, i.e. con-sidering the ensemble of environmental, climatic, and social dynamics (Meze-Hausken, 2004, 2007) and (2) in consideringdynamical changes in farming systems as a decisive modulator of the vulnerability associated with any climate events. Basedon observations made in Kenya, North Cameroon, and Central Argentina, we found that climate events perceived by the end-users are neither stable objects nor independent of the social and environmental context in which those actors drive theirfarming system. For example, we observed that in Central Argentina, soybean yields, and then those of maize, are the mostsensitive to rainfall anomalies. This is especially relevant because of the recent transition of Argentinean Pampas from amixed cropping system (cereals, oil seeds, livestock, etc.) toward a more specialized one, dominated by a transgenic soybeancrop strongly linked to the stock markets. Thus, the agricultural sector became somehow more vulnerable to rainfall vari-ability partly due to this soybeanization. This sensitivity has turned into a crucial cognitive tool allowing the producers toconsider and plan their activity in an integrated way, i.e. elaborating successful strategies that enable some of them to cope

44 V. Moron et al. / Climate Risk Management 8 (2015) 28–46
with adverse climate events, but non-capitalized farmers do not share the mitigation and adaptive capacities of agribusinessand capitalized farmers.
Slow changes, such as soybeanization, preferably induced by socio-economic background and agricultural policies ratherthan climate variations, are also illustrated by the increasing popularity of maize at the expense of sorghum and pearl milletin Kenya, and also by the recent decline of cotton in Northern Cameroon. Fundamentally, these changes in farming practicesmay deeply modify the overall vulnerability to climate, even in stationary climatic conditions. Under such circumstances,any long-term climatic trend, such as the recent rainfall decrease during the LR in East Africa (Lyons and DeWitt, 2012;Leclerc et al., 2014), superimposes a climate-induced risk to an already increased risk induced by a change from drought-re-sistant crops (sorghum and pearl millet) to a less resistant one (maize). In the same vein, crop and/or variety diversification isthe usual option for dealing with uncertainty resulting from climate or other sources (Mongi et al., 2010 among others).Moreover, varieties and/or crop diversification are usually more or less the only available adaptation option for smallholders,even though this last term does not have the same meaning on the eastern slopes of Mt Kenya, where gardening on verysmall plots is the usual practice, and in Argentina, where ‘‘small’’ farms refers to fewer than 200 ha (depending on theregion). Note that while we do not consider the potential positive effects of slow changes in dominant crops (e.g. soybeaniza-tion in Argentina and shift to maize in East Africa) which are due to price variations on national/international markets or totheir possible higher resistance to pests and diseases (as for maize in East Africa), the fact remains that such dynamicalbehavior should be considered in any studies, including seasonal forecasting and of course climate change studies. This alsoraises issues about the classical production-function approach, which generally assumes that the set of crops/varieties andcultural practices remain unchanged (Jones and Thornton, 2003; Thornton et al., 2009) vs a more integrated approach, as theRicardian one, which uses economic value rather than individual crop yields as the main predictand variable (Mendelsohnet al., 1994; Sultan et al., 2010b).
Finally, our study emphasized the fact that climate-induced vulnerability may vary inside a given region to a considerableextent. For example, the three different producers in Argentina do not cope with the same adverse events with the sameefficiency and their possible options may be strongly reduced, especially in case of monoculture. In East Africa, the vulnera-bility differs based on the altitudes, even on subtle gradients as demonstrated by Mwongera et al. (2014); crops originatingin communities living at an altitude of 1100 m are more sensitive to long dry spells after sowing in the medium altitude zone(950 m) than crops originating in lower altitudes (750 m). Seed exchanges in the medium altitude belt are mostly practicedamong farmers of the same community rather than between farmers of different communities (Leclerc and Coppensd’Eeckenbrugge, 2012), which in the long run results in a significant difference between communities in their crop responsesto long dry spells. This varying sensitivity could increase the vulnerability when a less drought resistant crop like maize isadopted independently of the subtle variations of drought frequency.
Overall, our results show that vulnerability to rainfall variations is a highly dynamical topic, not only due to the phase-locking of adverse conditions during critical crop stages, but also due to the extreme variety of expectations and strategiesused to mitigate and adapt to these events (Cooper et al., 2008).
Acknowledgements
This study has been funded by grant #ANR-08-VMCS-001 under the project PICREVAT. In Argentina, the research leadingto these results has received funding from the European Community’s Seventh Framework Program (FP7/2007-2013) undergrant #212492, and from ANR in the frame of the program INTERRA/SYSTERRA (grant #ANR-09-STRA-04). We thank MrJoseph Oyuga from FEWS NET Kenya. Lastly, we thank Mea Halperin for his help in proofreading and correcting of the finalpaper.
Appendix A. Supplementary information
Supplementary information associated with this article can be found, in the online version, at http://dx.doi.org/10.1016/j.crm.2015.03.001.
References
Adger, W.N., 2006. Vulnerability. Global Environ. Change 16, 268–281.Akponikpe, P.B.I., Minet, J., Gérard, B., Defourny, P., Bielders, C.L., 2011. Spatial fields dispersion as a farmer strategy to reduce agro-climatic risk at the
household level in pearl-millet-based systems in the Sahel: a modeling perspective. Agric. Forest Meteorol. 15, 215–227.Albergel, J., Carbonnel, J.P., Vaugelade, J., 1985. Aléas climatiques et production agricole: le cotton au Burkina. Acta Oecologica, Oecologia Applicata 6, 199–
211.Barnston, A.G., Li, S., Mason, S.J., DeWitt, D.G., Goddard, L., Gong, X., 2010. Verification of the first 11 years of IRI’s seasonal climate forecasts. J. Appl. Meteo
Climate 49, 493–518.Travis, W.R., Bates, B., 2014. What is climate risk management? Climate Risk Manag. 1, 1–4.Blanc, E., Quirion, P., Strobl, E., 2008. The climatic determinants of cotton yields: evidence from a plot in West Africa. Agric. Forest Meteorol. 148, 1093–
1100.Blench, R., 1999. Seasonal climatic forecasting: who can use it and how should be disseminated? Nat. Resource Perspect. 47, 1–4.Boyard-Micheau, J., Camberlin, P., Philippon, N., Moron, V., 2013. Regional-scale rainy season onset detection: a new approach based on multivariate
analysis. J. Climate 26, 8916–8928.Broad, K., Agrawala, S., 2000. The ethiopian food crisis–uses and limits of climate forecasts. Science 289, 1693–1694.

V. Moron et al. / Climate Risk Management 8 (2015) 28–46 45
Camberlin, P., 2010. More variable tropical climates have a slower demographic growth. Climate Res. 41, 157–167.Camberlin, P., Philippon, N., 2002. The East African March–May rainy season: associated atmospheric dynamics and predictability over the 1968–97 period.
J. Climate 15, 1002–1019.Camberlin, P., Moron, V., Okoola, R., Philippon, N., Gitau, W., 2009. Components of rainy seasons’ variability in Equatorial East Africa: onset, cessation,
rainfall frequency and intensity. Theor. Appl. Climatol. 98, 237–249.Camberlin, P., Boyard-Micheau, J., Philippon, N., Baron, C., Leclerc, C., Mwongera, C., 2014. Climatic gradients along the windward slopes of Mount Kenya and
their implication for crop risks. Part 1: Climate variability. Int. J. Climatol. http://dx.doi.org/10.1002/joc.3427 (in press).Caviglia, O.P., Andrade, F.H., 2010. Sustainable intensification of agriculture in the Argentinean Pampas: capture and use efficiency of environmental
resources. Am. J. Plant Sci. Biotechnol. 3, 1–8.Challinor, A., 2009. Toward the development of adaptation options using climate and crop yield forecasting at seasonal to multi-decadal timescales. Environ.
Sci. Policy 12, 453–463.Cooper, P.J.M., Dimes, J., Rao, K.P.C., Shapiro, B., Shiferaw, B., Twomlow, E., 2008. Coping better with current climatic variability in the rain-fed farming
systems of sub-Saharan Africa: an essential first step in adapting to future climate change? Agric. Ecosyst. Environ. 126, 24–35.Cutter, S.L., 1996. Vulnerability to environmental hazards. Prog. Human Geography 20, 529–539.Dilley, M., 2000. Reducing vulnerability to climate variability in Southern Africa: the growing role of climate information. Climatic Change 45, 63–73.Folefack, D.P., Kaminski, J., Enam, J., 2011. Note sur le contexte historique et gestion de la filière cotonnière au Cameroun, Discussion paper, mimeoFranklin, S.B., Gibson, D.J., Robertson, P.A., Pohlmann, J.T., Fralish, J.S., 1995. Parallel analysis: a method for determining significant principal components. J.
Vegetation Sci. 6, 99–106.Fussel, H., Klein, R., 2006. Climate change vulnerability assessments: an evolution of conceptual thinking. Climatic Change 75, 301–329.Gallopin, G.C., 2006. Linkages between vulnerability, resilience and adaptive capacity. Global Environ. Change 16, 293–303.Gergely, N., 2009. The cotton sector of Cameroon, World Bank, Africa Region Working Paper no 126.Glantz, M., 1977. The value of a long-range weather forecast for the West African Sahel. Bull. Am. Meteorol. Soc. 58, 150–158.Goddard, L., Mason, S.J., Zebiak, S.E., Ropelewski, C.F., Basher, R., Cane, M.A., 2001. Current approaches to seasonal-to-interannual climate predictions. Int. J.
Climatol. 21, 1111–1152.Goddard, L., Barnston, A.G., Mason, S.J., 2003. Evaluation of the IRI’s ‘‘net assessment’’ seasonal climate forecasts: 1997–2001. Bull. Am. Meteorol. Soc. 84,
1761–1781.Hansen, J.W., 2002. Realizing the potential benefits of climate prediction to agriculture: issues, approaches, challenges. Agric. Syst. 74, 309–330.Hansen, J.W., 2005. Integrating seasonal climate prediction and agricultural models for insights into agricultural practices. Philos. Trans. R. Soc. B 360, 2037–
2047.Hansen, J.W., Challinor, A., Ines, A., Wheeler, T., Moron, V., 2006. Translating climate forecasts into agricultural terms: advances and challenge. Climate Res.
33, 27–41.Hansen, J.W., Mishra, A., Rao, K.P.C., Indeje, M., Ngugi, R.K., 2009. Potential value of GCM-based seasonal rainfall forecasts for maize management in semi-
arid Kenya. Agric. Syst. 101, 80–90.Hastenrath, S., Polzin, D., Camberlin, P., 2004. Exploring the predictability of the ‘‘short rains’’ at the coast of East Africa. Int. J. Climatol. 24, 1333–1343.Hernández, V.A., Moron, V., Fossa Riglos, F., Muzi, E., 2015. Confronting farmers’ perceptions of climatic vulnerability with observed relationship between
yields and climate variability in Central Argentina. Weather Climate Soc. 7, 39–59.Ingram, K.T., Roncoli, C., Kirshen, P.H., 2002. Opportunities and constraints for farmers of West Africa to use seasonal precipitation forecasts with Burkina
Faso as case study. Agric. Syst. 74, 331–349.Jones, P.G., Thornton, P.K., 2003. The potential impacts of climate change on maize production in Africa and Latin America in 2055. Global Environ. Change
13, 51–59. http://dx.doi.org/10.1016/S0959-3780(02)00090-0.Kangah, P., 2004. Rainfall and agriculture in Central West Africa since 1930, Ph.D. thesis, University of Oklahoma.Katz, R.W., Glantz, M.H., 1986. Anatomy of a rainfall index. Mon. Weather Rev. 114, 764–771.Lamb, P.J., 1981. Do we know what we should trying to forecast–climatically? Bull. Am. Meteorol. Soc. 62, 1000–1001.Leclerc, C., Coppens d’Eeckenbrugge, G., 2012. Social organization of crop genetic diversity. The GxExS interaction model. Diversity 4, 1–32.Leclerc, C., Mwongera, C., Camberlin, P., Boyard-Michaud, J., 2013. Indigenous past climate knowledge as cultural built-in object and its accuracy. Ecol. Soc.
18 (4). http://dx.doi.org/10.575/ES-05896-180422.Leclerc, C., Mwongera, C., Camberlin, P., Moron, V., 2014. Cropping system dynamics, climate variability, and seed losses among East African smallholder
farmers: a retrospective survey. Weather Climate Soc. 6 (3), 354–370. http://dx.doi.org/10.1175/WCAS-D-13-00035.1.Luseno, W.K., McPeak, J.G., Barrett, C.B., 2003. Assessing the value of climate forecast information for pastoralists: evidence from southern Ethiopia and
Northern Kenya. World Dev. 31, 1477–1494.Lyon, B., DeWitt, D.G., 2012. A recent and abrupt decline in the East African long rains. Geophys. Res. Lett. 39, 1029/2011GL050337.Magrin, G.O., Travasso, M.I., Rodriguez, G.R., 2005. Changes in climate and crop production during the 20th century in Argentina. Climate Change 72, 229–
249.Marteau, R., Moron, V., Philippon, N., 2009. Spatial coherence of monsoon onset over Western and Central Sahel (1950–2000). J. Climate 22, 1313–1324.Marteau, R., Sultan, B., Moron, V., Alhassane, A., Baron, C., Traoré, S.B., 2011. The onset of the rainy season and farmers’ sowing strategy for pearl millet
cultivation in Southwest Niger. Agric. Forest Meteorol. 151, 1356–1389.Meinke, H., Stone, R.C., 2005. Seasonal and inter-annual climate forecasting: the new tool for increasing preparedness to climate variability and change in
agricultural planning and operations. Climate Change 70, 221–253.Mendelsohn, R., Nordhaus, W.D., Shaw, D., 1994. The impact of global warming on agriculture: a Ricardian approach. Am. Econ. Rev. 84, 753–771.Messina, C.D., Hansen, J.W., Hall, A.J., 1999. Land allocation conditioned on ENSO phases in the Pampas of Argentina. Agric. Syst. 60, 197–212.Meze-Hausken, E., 2004. Contrasting climate variability and meteorological drought with perceived drought and climate change in northern Ethiopia.
Climate Res. 27, 19–31.Meze-Hausken, E., 2007. Seasons in the sun - weather and climate front-page news stories in Europe’s rainiest city, Bergen, Norway. Int. J. Biometeorol. 52,
17–31.Mongi, H., Majule, A.E., Lyimo, J.G., 2010. Vulnerability and adaptation of rainfed agriculture to climate change and variability in semi-arid Tanzania. J.
Environ. Sci. Technol. 4, 371–381.Moron, V., Robertson, A.W., Ward, M.N., 2006. Seasonal predictability and spatial coherence of rainfall characteristics in the tropical setting of Senegal. Mon.
Weather Rev. 134, 3248–3262.Moron, V., Robertson, A.W., Ward, M.N., Camberlin, P., 2007. Spatial coherence of tropical rainfall at regional scale. J. Climate 20, 5244–5266.Moron, V., Robertson, A.W., Boer, R., 2009a. Spatial coherence and seasonal predictability of Monsoon onset over Indonesia. J. Climate 22, 840–850.Moron, V., Lucero, A., Hilario, F., Lyons, B., Robertson, A.W., De Witt, D., 2009b. Spatio-temporal variability and predictability of summer monsoon onset over
the Philippines. Climate Dynamics 33, 1159–1177.Moron, V., Camberlin, P., Robertson, A.W., 2013. Extracting subseasonal scenarios: an alternative method to analyze seasonal predictability of regional-scale
tropical rainfall. J. Climate 26, 2580–2600.Mutai, C.C., Ward, M.N., Colman, A.W., 1998. Towards the prediction of the East Africa short rains based on sea-surface temperature–atmosphere coupling.
Int. J. Climatol. 18, 975–997.Mwongera, C., Boyard-Micheau, J., Baron, C., Leclerc, C., 2014. Social process of adaptation to global environmental changes. How eastern African societies
intervene between crop and climate. Weather Climate Soc. 6, 341–353. http://dx.doi.org/10.1175/WCAS-D-13-00034.1.Novella, N.S., Thiaw, W.M., 2013. African rainfall climatology version 2 for famine early warning systems. J. Appl. Meteorol. Climate 52, 588–606.

46 V. Moron et al. / Climate Risk Management 8 (2015) 28–46
Nyamwange, M., 1995. Famine mitigation in Kenya: some practices, impact and lessons. Middle States Geographer 28, 37–44.Ogallo, L.J., Otengi, S.B., Ambenje, P., Nyakwada, W., Githui, F., 2005. In: Boken, V., Cracknell, A., Heathcote, R. (Eds.), Monitoring agricultural drought: the
case of Kenya. Monitoring and predicting agricultural drought: a global study. Oxford University Press, New-York, USA, pp. 238–251.Orlove, B., Roncoli, C., Kabugo, M., Majugu, A., 2010. Indigenous climate knowledge in southern Uganda: the multiple components of a dynamic regional
system. Climatic Change 100, 243–265.Pengue, W.A., 2005. Transgenic crops in Argentina: the ecological and social debt. Bull. Sci. Technol. Soc. 25, 1–9.Pengue WA (2006) Transgenic crops in Argentina and its hidden costs, In: Ortega, E., Ulgiati, S. (Eds.), Proceedings of IV biennial international workshop
‘‘Advances in Energy Studies’’, pp. 91–101.Philippon, N., Camberlin, P., Fauchereau, N., 2002. Empirical predictability study of October–December East Africa. Q. J. Meteorol. Soc. 128, 2239–2256.Philippon, N., Camberlin, P., Moron, V., Boyard-Micheau, J., 2015a. Wet and dry rainy seasons in East-Africa; what does differ in their intra-seasonal
characteristics. Climate Dynamics. http://dx.doi.org/10.1007/s00382-014-2460-6.Philippon, N., Baron, C., Boyard-Micheau, J., et al, 2015b. Climatic gradients along the windward slopes of Mount Kenya and their implication fro crop risks.
Part 2; crop sensitivity. Int. J. Climatol. (revised) subjudice.Podesta, G.P., Messina, C.D., Grondona, M.O., Magrin, G.O., 1999. Associations between grain crop yields in Central-Eastern Argentina and El Niño-Southern
Oscillation. J. Appl. Meteorol. 38, 1488–1498.Podesta, G., Letson, D., Messina, C., Rocye, F., Ferreyra, A., Jones, J., Llovet, I., Hansen, J.W., Grondona, M., O’Brien, J., 2002. Use of ENSO-related climate
information in agricultural decision making in Argentina: a pilot experience. Agric. Syst. 74, 371–392.Rao, K.P.C., Ndegwa, W.G., Kizito, K., Oyoo, A., 2011. Climate variability and change: farmer perceptions and understanding of intra-seasonal variability in
rainfall and associated risk in semi-arid Kenya. Exp. Agric. 47, 267–291.Recha, C.W., Shisanya, C.A., Makokha, G.L., Kinuthia, R.N., 2008. Perception and use of climate forecast information amongst smallholder farmers in semi-
arid Kenya. Asian J. Appl. Sci. 1, 123–135.Reilly, J.M., Schimmelpfennig, D., 1999. Agricultural impact assessment, vulnerability, and the scope for adaptation. Climatic Change 43, 745–788.Roudier, P., Sultan, B., Quirion, P., Baron, C., Alhassane, A., Traoré, S., Muller, B., 2011. An ex-ante evaluation of the use of seasonal climate forecasts for millet
growers in SW Niger. Int. J. Climatol. 32, 759–771.Roudier, P., Muller, B., d’Aquino, P., Roncoli, C., Soumaré, M., Batté, L., Sultan, B., 2014. The role of climate forecasts in smallholder agriculture: lessons from
participatory research in two communities in Senegal. Climate Risk Manage. 2, 42–55, http://dx.doi.org/10.1016/j.crm.2014.02.001.Sadou, F., Abdoulaye, A., Oumarou, B., Theze, M., Oumarou, Y., 2007. Démarche de diffusion des SCV dans la zone cotonnière du Nord Cameroun: dispositifs,
atouts, limites, in seminaire sur l’agroécologie et les techniques innovantes dans les systèmes de production cotonniers.Salinger, M.J., Sivakumar, M.V.K., Motha, R., 2005. Reducing vulnerability of agriculture and forestry to climate variability and change: workshop and
recommendations. Climatic Change 70, 341–362.Singh, P., Aggarwal, P.K., Bhatia, V.S., Murthy, M.V.R., Pala, M., Oweis, T., Benli, B., Rao, K.P.Cn., Wani, S.P., 2009. In: Wani, S.P., Rockstrom, J., Oweis, T. (Eds.),
Yield Gap Analysis: Modeling of achievable Yields at Farm Level in Rain-Fed Agriculture: Unlocking the Potential, pp. 81–123.Sivakumar, M.V.K., Das, H.P., Brunini, O., 2005. Impacts of present and future climate variability and change on agricultural and forestry in the arid and semi-
arid tropics. Climate Change 70, 31–72.Speranza, C.I., Kiteme, B., Wiesmann, U., 2008. Droughts and famines: the underlying factors and the causal links among agro-pastoral households in semi-
arid Makueni district, Kenya. Global Environ. Change 18, 220–233.Sultan, B., Bella-Medjo, M., Berg, A., Quirion, P., Janicot, S., 2010a. Multi-scales and multi-sites analyses of the role of rainfall in cotton yields in West Africa.
Int. J. Climatol. 30, 58–71.Sultan, B., Barbier, B., Fortilus, J., Mbaye, S.M., Leclerc, G., 2010b. Estimating the potential economic value of the seasonal forecasts in West Africa: a long-
term ex-ante assessment in Senegal. Weather, Climate Soc. 2, 69–87.SWAC/OCDE, 2005. Cotton, Atlas on regional integration in West Africa, Economy series.Thornton, P.K., Jones, P.G., Alagarswamy, G., Andresen, J., 2009. Spatial variation of crop yield response to climate change in East Africa. Global Environ.
Change 19, 54–65. http://dx.doi.org/10.1016/j.gloenvcha.2008.08.005.Turner II, B.L., Kasperson, R.E., Matson, P.A., McCarthy, J.J., Corell, R.W., Chrsitensen, L., Eckley, N., Kasperson, J.X., Luers, A., Martello, M.N., Polsky, C.,
Pulsipher, A., Schiffer, A., 2003. A framework for vulnerability analysis in sustainability science. Proc. Natl. Acad. Sci. USA 100, 8074–8079.