climate risk disclosure barometer - ey - ey - united...
TRANSCRIPT

Climate Risk Disclosure Barometer2017

Contents
About this report 1
Methodology 2
Key findings 3
Sector analysis
Banks 6
Insurance 7
Asset Owners and Managers 9
Transport 10
Energy 11
Metals and mining 13
Buildings 14
Agriculture, food and forest products 15
Materials, chemicals and construction 16

Recognising there are gaps in the information disclosed on the financial impact of climate risk across the investment chain, in December 2016 the industry-led Task Force on Climate-related Financial Disclosures (TCFD) set up by the Financial Stability Board (FSB), issued a series of draft recommendations (the Recommendations). The aim is to help organisations to take account of climate-related issues and disclose the financial impact that climate risks have or could have on their organisations.The Recommendations address a number of major challenges identified by the TCFD: principally the lack of a coherent financial reporting framework, making it difficult for investors, creditors, and underwriters to use existing disclosures in their financial decisions.
The adoption of the Recommendations is voluntary and recommended for all entities. There is also additional focus and specific guidance for certain higher risk sectors in both the financial sector (e.g. banks, insurance companies, asset owners and assets managers) and other sectors (e.g. energy, transportation, material and buildings, agriculture, food and forest
products). Specific categories for climate-related risks in order to enable consistent categorisation are also outlined, including risks related to the transition to a zero-carbon economy and risks related to the physical impacts of climate change.¹
Organisations now have the opportunity to apply a more rigorous and consistent approach to assessing and disclosing the financial impact of climate risks in their reporting. All of the members of the TCFD (including Barclays, BHP Billiton, Dow, Eni, Swiss Re, AXA and Air Liquide) have committed to the disclosure recommendations. What is more, a group of over 140 policymakers from around the world have signalled their support for the Recommendations, calling on all stock markets to ensure listed firms embrace this new guidance on climate risk disclosures.
The final recommendation report is expected to be issued in June - July 2017, post a consultation period, which closed on 12 February 2017.
About this report
1. Transition risks include policy, legal, technology, reputational and market changes to address mitigation and adaptation requirements related to climate change, and span the organisation’s full value chain.
EY undertook analysis of current corporate disclosures in Australia to provide this Report that compares the high risk sectors listed in the Recommendations against each proposed disclosure. The purpose of this being to enable us to map the improvements in climate-related disclosures against the Recommendation, by sector, on an annual basis.
1

Sectors identified by TCFD most exposed to risk
Climate Disclosure Barometer sectors
Number of companies reviewed
Financial Banks Banks 8
Insurance companies Insurance companies 6
Asset owners* Asset owners and asset managers*
32
Asset managers*
Non-Financial Energy Energy 14
Transportation Transport 10
Materials and buildings*
Materials, chemicals and construction
19
Buildings 23
Mining and metals 22
Agriculture, food, and forest products
Agriculture, food, and forest products
16
* For the purposes of this report, these sectors were re-grouped where distinctions between categories could not be determined or where further sub-sector analysis was useful.
ASX200 companies and the 20 largest superannuation funds were filtered against sectors identified by the TCFD as most exposed to climate-related risks — 70 of the ASX200 companies were excluded as they did not fall within these sectors.
A total of 150 companies were therefore assessed (refer breakdown of companies assessed by sector in the table to the right).
The TCFD recommendations are structured around four thematic areas that reflect core elements of how organisations operate – governance, strategy, risk management, and metrics and targets (as shown on the right).
Companies were scored against each of the 11 disclosures across the core elements categories of recommended climate-related financial disclosures (as shown on right):
• 0 — Not publically disclosed
• 1 — Limited discussion of the aspect (or only partially discussed)
• 3 — Aspect is discussed in detail
• 5 — Identified in the report as a key material issue/aspect
The findings are based on disclosures in Annual Reports, Sustainability Reports, and any other publicly available information such as company websites and where available, a company’s disclosures in relation to the Climate Disclosure Project (CDP).
Methodology
Core elements of recommended climate-related financial disclosures
Governance The organization’s governance around climate-related risks and opportunities
Strategy The actual and potential impacts of climate-related risks and opportunities on the organization’s businesses, strategy, and financial planning
Risk Management The processes used by the organization to identify, assess, and manage climate-related risks
Metrics and Targets The metrics and targets used to assess and mange relevant climate-related risks and opportunities
Source: Recommendations of the Task Force on Climate-related Financial Disclosures, 14 December 2017, Task Force on Climate-Related Financial Disclosures
Metrics andTargets
Risk Management
StrategyGovernance
2 EY | Climate Risk Disclosure Barometer 2017

29%Average fornon-financial
31%Average for financial
BuildingsAgriculture, food,and forestry products Energy
Mining and Metals Transport
22% 39% 31%
22% 40%
Asset owners and managers
19%Insurance
44%Banks
56%
Materials, chemical,and construction
24%
Governance
31%
Strategy
25%
Risk Management
32%31%
Metrics and Targets
Average performance against the Recommendations by disclosure category
Average performance against the Recommendations by sector
Key findings
3
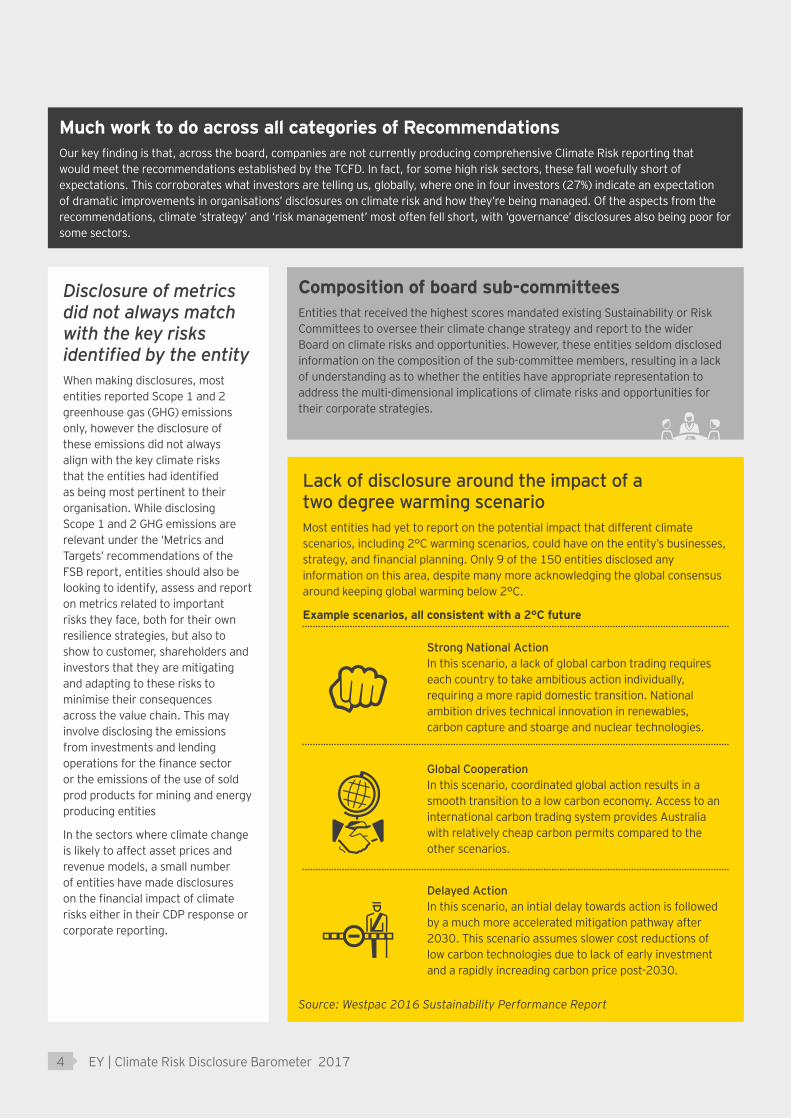
Lack of disclosure around the impact of a two degree warming scenarioMost entities had yet to report on the potential impact that different climate scenarios, including 2°C warming scenarios, could have on the entity’s businesses, strategy, and financial planning. Only 9 of the 150 entities disclosed any information on this area, despite many more acknowledging the global consensus around keeping global warming below 2°C.
Example scenarios, all consistent with a 2°C future
Composition of board sub-committeesEntities that received the highest scores mandated existing Sustainability or Risk Committees to oversee their climate change strategy and report to the wider Board on climate risks and opportunities. However, these entities seldom disclosed information on the composition of the sub-committee members, resulting in a lack of understanding as to whether the entities have appropriate representation to address the multi-dimensional implications of climate risks and opportunities for their corporate strategies.
Disclosure of metrics did not always match with the key risks identified by the entityWhen making disclosures, most entities reported Scope 1 and 2 greenhouse gas (GHG) emissions only, however the disclosure of these emissions did not always align with the key climate risks that the entities had identified as being most pertinent to their organisation. While disclosing Scope 1 and 2 GHG emissions are relevant under the ‘Metrics and Targets’ recommendations of the FSB report, entities should also be looking to identify, assess and report on metrics related to important risks they face, both for their own resilience strategies, but also to show to customer, shareholders and investors that they are mitigating and adapting to these risks to minimise their consequences across the value chain. This may involve disclosing the emissions from investments and lending operations for the finance sector or the emissions of the use of sold prod products for mining and energy producing entities
In the sectors where climate change is likely to affect asset prices and revenue models, a small number of entities have made disclosures on the financial impact of climate risks either in their CDP response or corporate reporting.
Strong National Action In this scenario, a lack of global carbon trading requires each country to take ambitious action individually, requiring a more rapid domestic transition. National ambition drives technical innovation in renewables, carbon capture and stoarge and nuclear technologies.
Global Cooperation In this scenario, coordinated global action results in a smooth transition to a low carbon economy. Access to an international carbon trading system provides Australia with relatively cheap carbon permits compared to the other scenarios.
Delayed Action In this scenario, an intial delay towards action is followed by a much more accelerated mitigation pathway after 2030. This scenario assumes slower cost reductions of low carbon technologies due to lack of early investment and a rapidly increading carbon price post-2030.
Much work to do across all categories of RecommendationsOur key finding is that, across the board, companies are not currently producing comprehensive Climate Risk reporting that would meet the recommendations established by the TCFD. In fact, for some high risk sectors, these fall woefully short of expectations. This corroborates what investors are telling us, globally, where one in four investors (27%) indicate an expectation of dramatic improvements in organisations’ disclosures on climate risk and how they’re being managed. Of the aspects from the recommendations, climate ‘strategy’ and ‘risk management’ most often fell short, with ‘governance’ disclosures also being poor for some sectors.
Source: Westpac 2016 Sustainability Performance Report
EY | Climate Risk Disclosure Barometer 20174

Physical risk strategies are not disclosed as widely as transitional risk strategiesDespite the very real consequences that unaddressed physical risks face for a number of FSB sectors, particularly Agriculture, Food and Forestry products, and Transport, across all sectors transitional risk strategies were better articulated than the physical risk strategies. While a number of entities did disclose their identification and assessment of physical risks to their business, and the various risk management strategies they have in place, the level of disclosure on this topic remains low compared to the risk it poses to all sectors.
CDP Reports were the best source of information for higher performance against the RecommendationsThe analysis indicates that the entities that reported to the CDP often led their peers in this Report, which is likely driven by the structured nature of the CDP questionnaire. For example, the section of the CDP questionnaire related to Governance, Strategy and Risk and Opportunities aligns closely to the TCFD Recommendations for these areas, requiring companies to consider providing more detailed information compared to the disclosures made for typical corporate reports.
For a majority of the entities included in this Report we identified a degree of mis-alignment between the disclosures made in the CDP submissions and the organisations’ broader corporate communications, including the annual report, sustainability report, or investor presentations. Some companies have addressed this gap by issuing specific climate change position papers and/or providing additional information on their website regarding climate related risks and strategies when available.
In his legal opinion on Climate Change and Directors’ Duty, Noel Hutley SC warns that companies’ directors who perceive that climate change presents risks to their business should assess the adequacy of their disclosure and reporting of them. The discrepancy in the disclosures made by the companies through their different lines of external communication poses a risks of disclosures gaps and inconsistency for companies and create potential legal exposures for company directors.
Banks and insurance sector leading the wayOverall, the banking and insurance sectors were currently assessed as the highest benchmark against the TCFD recommedations. This was driven by having higher quality disclosures across all entities included in this Report. Other sectors had individual high performing organisations, whose scores were weighed down by poorer disclosures from the majority of the entities in their sectors. Most entities in the Banks and Insurance sectors submitted high scoring CDP responses which were the contributor to the overall disclosure scores.
5

Sector overviewSeven entities were assessed in this sector. Four of the seven entities received score around 80% (with National Australia Bank and Westpac just outscoring others). These banks generally scored well through the CDP.
Areas of improvement:
• Disclosing the financial impact of a two degree scenario
• Widening the scope of financed emissions metrics beyond lending to power generation and mining
• Improving disclosures around the risks
Banks
Governance:Five of the seven banks reported that overall responsibility for climate change risk management sat with members of the Board. Most entities had established committees to oversee environment or specifically climate change that reported through to senior management or the CEO or Chairman. Given the structure of the banking sector, some committees included members that looked at the implications to credit, investments, brand and own physical assets.
29%Average fornon-financial
31%Average for financial
BuildingsAgriculture, food,and forestry products Energy
Mining and Metals Transport
22% 39% 31%
22% 40%
Asset owners and managers
19%Insurance
44%Banks
56%
Materials, chemical,and construction
24%
Governance
31%
Strategy
25%
Risk Management
32%31%
Metrics and Targets
Average performance against the Recommendations by disclosure category
Average performance against the Recommendations by sector
Strategy:The majority of banks articulated a range of risks from climate change. Regulatory risks including uncertainty around climate regulations impacting the value of energy investments and reporting risks to banks if uncompliant with Australian and New Zealand current regulations. Physical risks included increasing impairments to lending portfolios due to increasing extreme weather events. Some banks specified the additional costs of recent weather events. Reputational risk was frequently identified as an additional risk due to possible changes in customer and investor perceptions of fossil fuel lending.
Many banks discussed a commitment to a two degree climate future, with one bank disclosing the high-level results of two degree scenario analysis. However no bank disclosed the impacts of such a scenario on their business.
Risk management:In most cases banks had well established ESG risk management processes, which climate-related risks and opportunities were managed within. It appears these were applied on a customer basis at the institutional level.
Targets and metrics:Scope 1 and 2 emissions were disclosed by six of the seven banks. Some banks also disclosed emissions intensity per FTE or per metre squared of building space. Three banks had disclosed some form of financed emissions from lending investments. The scope of these financed emissions disclosures varied between lending portfolios and predominantly included power generation and in some cases lending to mining. No disclosure covered all sectors or investments classes beyond debt. There were no specific metrics that related to the impact of physical risk.
Climate targets generally focussed on scope 1 and 2 emissions reductions or emissions intensity reductions. Some banks disclosed renewable energy or green investment targets and one bank disclosed restrictions on lending to certain sectors. These targets generally did not align with the main risks and opportunities identified in the Strategy section.
Sector analysis
64%
45%
72%
45%
6 EY | Climate Risk Disclosure Barometer 2017

Sector overviewSix entities were assessed in this sector. On average these entities received high disclosure scores across all categories. Unsurprisingly the focus of disclosures was on physical risks from climate change. Disclosing carbon footprint of investments providing metrics on the impact of different climate change scenarios on the entity. Two of the six entities received overall scores of 4% or less, while the remaining four entities received an average score of 65% with top score going to Insurance Australia Group. Most disclosures for these entities were located in CDP reports.
Areas of improvement:
• Disclosing carbon footrpint of investments
• Providing metrics on the impact of different climate change scenarios on the entity
Insurance
Governance:The four entities that received an average score of 65% reported on climate change governance processes to a high standard. All had specific committees’ set-up to identify and manage climate-related risks and opportunities that reported in to the Board regularly.
29%Average fornon-financial
31%Average for financial
BuildingsAgriculture, food,and forestry products Energy
Mining and Metals Transport
22% 39% 31%
22% 40%
Asset owners and managers
19%Insurance
44%Banks
56%
Materials, chemical,and construction
24%
Governance
31%
Strategy
25%
Risk Management
32%31%
Metrics and Targets
Average performance against the Recommendations by disclosure category
Average performance against the Recommendations by sector
Strategy:Physical risk strategies were well developed with one entity reporting the risk as material to the business. A range of strategies were employing including Government lobbying, closely monitoring insurance and reinsurance pricing and providing financial incentives for insurance owners to purchase adaptation equipment such as water tanks.
Only one entity discussed strategy related to climate change risk and opportunities from investments. Given the size of investments made by insurance companies, this is an area where improvements could be made.
Risk management:Risk management processes for identifying and managing climate risks were well established in the four entities that received an average score of 65%. These generally involved risk management roles across divisions to cover the different types of risks from climate change.
Targets and metrics:Scope 1 and 2 emissions were disclosed by most entities and some had set absolute emissions reduction targets (one entity was already carbon neutral through the purchasing of offsets).
While the main risks identified by the entities were related to physical risks, there were no metrics that related to this risk.
57%
36%
60%
27%
7

8 EY | Climate Risk Disclosure Barometer 2017

Sector overviewAs CDP disclosures were not common in this group, it was more difficult to source climate-related disclosures, (as these are not always located in the same reports or webpages). Scores varied within this sector. Some Super Funds received high overall scores (with top scorer being AustralianSuper) and provided meaningful metrics that aligned with the key risks to the sector. Risk identification and strategies to address transitional risks were more common than physical risks, such as divestments policies for reducing financed emissions. Carbon footprinting of equity portfolios were the most common metrics disclosed. However these do not address key transitional and physical risks to the sector.
Asset Owners and Managers
Governance:Governance disclosures that related to climate change were hard to source for all entities. Some entities disclosed that ESG, or climate change specifically, was addressed at the Board level, while others disclosed that the responsibility for integrating ESG risks and opportunities was delegated to fund managers.
Strategy:Only some entities disclosed climate change risks and opportunities to their business. Such risks included transitional risks to investments, particularly those that relied on revenue from fossil fuel products and physical risks to assets, mainly in the infrastructure and real estate sectors.
Management strategies varied significantly. Some chose to divest from entities that received certain percentages of revenue from fossil fuel products or integrate carbon risk into their valuation processes. Others promoted stakeholder engagement and advocacy with the management teams of investment. While others out-sourced ESG integration to asset managers.
Like most sectors, there were few disclosure around scenario analysis and the impact of a two degree scenario on the entity.
Risk management:Similarly to the Strategy disclosures, the approach to Risk Management disclosures varied. Not surprisingly, those that stated climate change was not a material risk, generally had little disclosure about risk management. This is compared to those who have multiple strategies to address climate change with detailed risk management plans. Types of processes described included:
• Monitoring and reporting on investment with certain levels of fossil fuel revenue
• Monitoring and reporting on the carbon footprint of equity investments
• Assessments of geographical location and direct carbon emissions of an investment during the investment decision process
Targets and metrics:Although the overall score for this sector was low compared to banks and insurance entities, some entities discuss meaningful metrics that align with key risks to the sector. The most common disclosure: carbon footprint of equity investment and scope 1 and 2 emissions from the entity. Some entities commented that carbon footprinting disclosures can be misleading and instead disclosed metrics related to percentage of holdings in companies with material revenues from fossil fuel products. Disclosures around physical risks is limited.
29%Average fornon-financial
31%Average for financial
BuildingsAgriculture, food,and forestry products Energy
Mining and Metals Transport
22% 39% 31%
22% 40%
Asset owners and managers
19%Insurance
44%Banks
56%
Materials, chemical,and construction
24%
Governance
31%
Strategy
25%
Risk Management
32%31%
Metrics and Targets
Average performance against the Recommendations by disclosure category
Average performance against the Recommendations by sector
19%
18%
25%
16%
9

29%Average fornon-financial
31%Average for financial
BuildingsAgriculture, food,and forestry products Energy
Mining and Metals Transport
22% 39% 31%
22% 40%
Asset owners and managers
19%Insurance
44%Banks
56%
Materials, chemical,and construction
24%
Governance
31%
Strategy
25%
Risk Management
32%31%
Metrics and Targets
Average performance against the Recommendations by disclosure category
Average performance against the Recommendations by sector
42%
30%
45%
45%
Sector overviewThree out of the nine entities included in this sector score zero for their disclosures. The scores for the remaining six entities varied significantly, indicating a lack of consistency in climate-related reporting across the sector. Notably there was a lack of information disclosed by entities in the transport sector on the potential that physical climate risk has to disrupt the industry, which was highlighted during the recent Cyclone Debbie weather event in Queensland. Brambles Ltd received top score in this category.
Transport
Governance:Five out of the nine entities disclosed information on governance. The majority of disclosures mentioned that overall responsibility for ESG or all risk and governance matters sat with the Board. Only two of these entities specifically mentioned how climate-related risks were integrated into their governance processes.
Strategy:Strategy received the sector’s lowest score compare to the other areas. Those entities that provided CDP responses scored the highest in the area as the CDP format provides a list of risks, timeframes and magnitudes for the respondent to select, which drives greater disclosure.
Strategies focused on energy reduction and the use of technology to reduce emissions through energy efficiency and increasing the effectiveness of different energy sources. Interestingly physical risk strategies where not disclosed to the same degree as transitional risks.
Two entities disclosed that they had conducted scenario analysis over their assets to understand physical risks. No disclosures about the financial impacts of this scenario testing were provided nor was information about whether scenarios were consistent with a two degree future.
Risk management:This was the highest rating area, with most companies having established risk management processes. Climate risk management was reported to either be handled holistically as sustainability risk management, or as a separate risk due to its complex characteristics. The highest scoring responses discussed risk management approaches based on the timeframe of the risk and whether the risk was physical or regulatory. The identification and management of these risks sat at both the corporate and asset levels.
Targets and metrics:Overall metric disclosures were quite detailed and focussed on the key area of the supply chain, namely emissions from transportation, even when these emissions where categorised as scope 3 emissions. Some entities also included emissions intensity metrics based on units of output.
Targets ranged across the sector from intensity based targets to energy reduction targets. Although the level of disclosure around targets was reasonably high, no entity set out how their target aligned with a two degree world or other benchmarking tool.
10 EY | Climate Risk Disclosure Barometer 2017

Sector overviewOne out of the 14 entities included in this sector scored zero for their disclosures. Of those that made disclosures beyond their carbon footprint, AGL was the top scoring electric utilities entity and Santos was the top scoring oil and gas entity.
Energy
Governance:Entities that received the highest scores for Governance have mandated existing Sustainability Committees to oversee the climate change strategy and report to the Board on climate risks and opportunities. However the analysis identified that the role of management in assessing and managing climate-related risks and opportunities is often not disclosed. A number of entities made reference to incentives frameworks linked to climate change performance (i.e. achieving targets and/or KPIs).
Strategy:Entities that scored well in this area mentioned the impact on their operations of both transitional and physical risks, and opportunities beyond changes in regulations, with a timeframe identified for each item.
• The majority of the entities mentioned the use of an internal carbon price.
• One oil & gas entity and one electric utilities entity disclosed a comprehensive analysis of the impact of the transition and physical risks on their assets and operations, and outlined strategic initiatives to address them.
• Half of the entities identified increasing physical risks on their assets and operations while the other half did not provide specific disclosures on the impact of physical risks.
• Growth in the demand for natural gas and LNG, combined with the development of renewable energy were identified as strategic opportunities supporting the decarbonisation of the utility sector by some of the oil & gas and electric utility entities. There was less identification of risks from retirement of coal assets.
• Only one entity reported on the impact of a two degree scenario on its business. Two entities have committed to assess the resilience of the portfolio against climate scenarios including a 2 degrees scenario.
Risk management:The process for identifying and managing climate-related risks and opportunities was generally consistent with the entities’ overall risk management processes. Three entities disclosed additional details on the approach taken to assess the climate-related risks including the longer timeframe required to perform the assessment (over 3 year time horizon), the involvement of different internal stakeholders (risk, operations, economic) and the inclusion of emerging risks.
Targets and metrics:Most entities disclosed their scope 1 and scope 2 emissions, and some also disclosed the emissions intensity of their operations.
Six entities reported emissions reduction targets, the, most common being an emissions intensity reduction target with a set base year.
For the entities that identified key climate-related risks and opportunities, the metrics applied did not reflect these. While scope 1 and 2 emissions disclosed by most entities show the direct impact an entity has on climate change, the emissions from the use of sold product (natural gas, oil) is the primary driver for the development of new climate change policies. There was little disclosure about the size of the scope 3 emissions related to the use of sold products.
In a sector where climate change is likely to affect asset prices and revenue models, a small number of entities have made disclosures on the financial impact of climate risks in their CDP response and one entity in its corporate reporting.
29%Average fornon-financial
31%Average for financial
BuildingsAgriculture, food,and forestry products Energy
Mining and Metals Transport
22% 39% 31%
22% 40%
Asset owners and managers
19%Insurance
44%Banks
56%
Materials, chemical,and construction
24%
Governance
31%
Strategy
25%
Risk Management
32%31%
Metrics and Targets
Average performance against the Recommendations by disclosure category
Average performance against the Recommendations by sector
33%
30%
27%
30%
11

12 EY | Climate Risk Disclosure Barometer 2017

29%Average fornon-financial
31%Average for financial
BuildingsAgriculture, food,and forestry products Energy
Mining and Metals Transport
22% 39% 31%
22% 40%
Asset owners and managers
19%Insurance
44%Banks
56%
Materials, chemical,and construction
24%
Governance
31%
Strategy
25%
Risk Management
32%31%
Metrics and Targets
Average performance against the Recommendations by disclosure category
Average performance against the Recommendations by sector
Sector overview Ten out of the 22 entities included in this sector score zero for their disclosures. A further two only disclosed scope 1 and 2 GHG emissions. Of those that made disclosures beyond their carbon footprint, BHP Billiton Limited was the top scoring mining entity and Sim Metal Management Ltd was the top scoring metals entity.
Metals and mining
Governance:Many companies disclosed that climate change was reported to the Board via the Sustainability Committee (or equivalent), with little additional detail into how the Board or Management oversee or identify climate-related risks and opportunities. Physical risks or adaptation planning was only specifically mentioned by two entities. Those entities that received higher scores for Governance disclosed detail about Board and Executive Management involvement in the management of climate-related risks and opportunities and how risk management was operationalised.
Strategy:Entities that scored well in this area mentioned the impact on their operations of both transitional and physical risks and opportunities beyond changes in regulations, with a timeframe identified for each item. Specifically:
• Two entities mentioned the use of an internal carbon price.
• A large number of mining entities identified increasing physical risks from climate change while others disclosed no risks or stated that physical risk would not impact their mining operations.
• Growth in mining products such as uranium, aluminium, copper and lithium were identified.
Risk management:Processes for identifying and managing climate-related risks and opportunities were generally consistent with the entities’ overall risk management processes. Where additional detail was specified (although most did not), this included:
• Using an internal carbon price as a management strategy.
• Detail on how current regulations such as the Safeguard Mechanism are managed.
• Reporting progress against climate targets to monitor progress of risk management strategies.
A majority of entities distinguished management strategies for short-term risks (generally 1 to 3 year time frame) and longer-term risks (generally over a 3 year time horizon).
Targets and metrics:Most entities disclosed their scope 1 and scope 2 emissions, with some also disclosing the emissions intensity of their operations.
Five entities reported emissions reduction targets – most common being an absolute emissions reduction target with a set base year, with one entity reporting an emissions intensity target. BHP Billiton has stated their commitment to set a science based target in the next two years.
For the entities that have identified the key climate-related risk and opportunities, the metrics applied by the entities did not reflect these risks and opportunities. While scope 1 and 2 emissions disclosed by most entities show the direct impact an entity has on climate change, the emissions from the use of sold products for fossil fuel mining product are the primary driver of climate change for some mining entities. There was little disclosure about the size of the scope 3 emissions related to the use of sold products.
20%
21%
20%
27%
13

Sector overview22 entities were assessed in this sector, with four entities scoring zero for their disclosures. Overall the sector scored comparatively well (Investa received highest score). Many entities appear to already be in the process of managing climate risks, particularly from a transitional mitigation perspective with the adoption of energy efficient lighting the most commonly discussed strategy and noticeably the low-hanging fruit.
Areas for improvement:• The setting of climate risk related targets.• Accelerating adaptive action due to the risks physical climate risk poses to
these assets.
Buildings
Governance:Most entities spoke about the commitment of the Board to the wider ethics of sustainability without providing specific details about the ways in which the Board views and evaluates climate risk and action. Five entities provided details of committees that explicitly considered climate-related risks and opportunities within their mandates (these committees all reported back to the Board level).
Strategy:Entities identified risks and impacts from regulation and physical changes. Some entities also noted reputational risks and risks from changes in consumer behaviour (leading to an increased in vacancy rates). However the impacts noted for these risks did not always address the whole issue. For instance some entities described the impact from physical changes in terms of additional energy costs and excluded the impacts of asset damage.
Other notable trends in this sectors disclosures included:
• Energy efficiency was the most commonly mentioned strategy, aligning with the large electricity usage of the sector.
• Despite the identification of physical climate risks to the sector, only some entities mentioned the adaptation actions in place for their assets.
No entities reported on the impact of different climate scenarios, while one entity had set a science-based target.
Risk management:The disclosure of climate-related risk management processes generally aligned with the entities risk management processes for all risks, with the timeframe of the risk being very important.
Despite the larger impact that physical risk is expected to place on this sector, some entities focused on mitigation activities such as reducing energy and water usage, rather than outlining adaptive actions being put in place to increase the resilience of their assets.
Those entities that received the highest scores in this sector set out how there management strategies were integrated at the asset and corporate level. These entities provided a lot of detail around energy monitoring systems, upgrade programs and how adaptation accessed at the design stag and reviewed periodically.
Targets and metrics:Most entities reported their Scope 1 and Scope 2 emissions, and a number of entities disclosed their Scope 3 emissions and emissions intensity based on net lettable area. A number of different metrics were adopted by entities including NABERS Rating, NGER data, Green Star, GRESB and like-for-like comparison.
Targets focused on emissions or energy intensity reduction. One entity had committed to a net zero emissions target by 2040, which was also aligned to a science-based target.
29%Average fornon-financial
31%Average for financial
BuildingsAgriculture, food,and forestry products Energy
Mining and Metals Transport
22% 39% 31%
22% 40%
Asset owners and managers
19%Insurance
44%Banks
56%
Materials, chemical,and construction
24%
Governance
31%
Strategy
25%
Risk Management
32%31%
Metrics and Targets
Average performance against the Recommendations by disclosure category
Average performance against the Recommendations by sector
40%
29%
44%
42%
14 EY | Climate Risk Disclosure Barometer 2017

Sector overview16 entities were assessed in this sector, with six entities scoring zero for their disclosures. For this sector, physical risks pose the biggest threat to current business operations. Tassal Group Limited and Woolworths Limited were the top performing entities in this sector.
Areas for improvement:
• Physical risk management strategies
• Providing metrics on the impact of different climate change scenarios on the entity
Agriculture, food and forestry products
Governance:Ten of the 16 companies within this sector received a score for Governance, and the level of disclosure varied between companies. Most companies noted that climate change and sustainability matters were handled by the Board as part of wider governance responsibilities. Two companies spoke in detail about the mechanisms through which the Board manages non-financial risks.
Strategy:Physical risks and opportunities from changing levels in natural resources were reported by some entities. This was reported predominantly in the context of contributing positively to society and responding to customer expectations, rather than responding regulation or improving resilience.
Other interesting trends in strategy disclosures included:
• One entity mentioned the use of an internal shadow carbon price.
• Strategies were mostly discussed in terms of risk management, rather than opportunity identification. Two entities went into detail about climate-related opportunities that have been identified and actioned.
• Two entities discussed the use of climate change scenarios and alignment with a two degree future but there was no disclosure about the financial impact on their business from these scenarios.
Risk management:The process for identifying and managing climate-related risks and opportunities was generally integrated within the entity’s overall risk management process, with three entities providing detail about specific climate related risk identification and management processes.
Despite the larger impact that physical risk is expected to place on this sector, most entities focused on transitional risk in this section.
All entities focused on long term risks, with no specific mention of short term risks and opportunities identified or currently being managed.
Targets and metrics:This section received the highest average score, with most entities reporting their Scope 1 and Scope 2 emissions. A number of entities disclosed their Scope 3 emissions on top of their Scope 1 and Scope 2 emissions, and some entities also reported the emissions intensity of their operations or products. Despite the expected impact physical risks will have on this sector, there were no metrics disclosed by any entities specifically relating to this risk.
Noticeably only one entity disclosed a specific emissions reduction target. Four other companies reported on assessing or reducing GHG in general terms without providing specific forward looking targets.
29%Average fornon-financial
31%Average for financial
BuildingsAgriculture, food,and forestry products Energy
Mining and Metals Transport
22% 39% 31%
22% 40%
Asset owners and managers
19%Insurance
44%Banks
56%
Materials, chemical,and construction
24%
Governance
31%
Strategy
25%
Risk Management
32%31%
Metrics and Targets
Average performance against the Recommendations by disclosure category
Average performance against the Recommendations by sector
18%
20%
23%
25%
15

Sector overview19 entities were assessed in this sector, with only three entities scoring zero for their disclosures. Overall the level of disclosures were quite low, with limited entities reporting under the CDP. Incitec Pivot Limited was the top performing entity in this sector.
Materials, chemicals and construction
Governance:Most of the companies within this sector received a score for Governance. Most companies noted that climate risks and opportunities were handled by the Board, both within their general governing capacity overseeing operations, and through wider sustainability measures adopted by the Board. A number of companies also reported on the existence of Sustainability sub committees that report to the Board with issues including health and safety, sustainability and climate related risks.
Strategy:Strategy disclosures generally covered transitional and physical risk areas to a similar degree. Not many entities disclosed the impacts of the risks identified and no entity disclosed the impact of different climate change scenarios. One entity acknowledged the two degree Paris Agreement but did not discuss the impacts on their operations.
Risk management:Most entities reported on their general risk management processes rather than climate-related specific risk management processes.
Strategies to reduce emissions were most commonly specified, with less detail around physical risk management and on-going review of these risks.
To integrate climate change risk management strategies into the business, a wide range of actions were mentioned across this section, including the use of technology to share information across the divisions, training of staff and contractors and benchmarking against international environmental standards. As some entities were mainly contractors extra consideration was given to how management strategies aligned with the broader risk management strategies of the site.
Targets and metrics:Most entities in this sector reported their scope 1 and scope 2 emissions, with a small number of entities disclosing certain scope 3 emissions. One entity disclosure emissions intensity based on output. There were no metrics that focussed on additional supply chain emissions, where the entity operated as a service company to the fossil fuel mining or energy sector. These metrics would assist investors in understanding potential stranded asset risks.
Many entities had set targets based on intensity or absolute emissions. These targets varied in terms of ambition and timeframe. No entity aligned their target with a two degree future or a science-based target.
29%Average fornon-financial
31%Average for financial
BuildingsAgriculture, food,and forestry products Energy
Mining and Metals Transport
22% 39% 31%
22% 40%
Asset owners and managers
19%Insurance
44%Banks
56%
Materials, chemical,and construction
24%
Governance
31%
Strategy
25%
Risk Management
32%31%
Metrics and Targets
Average performance against the Recommendations by disclosure category
Average performance against the Recommendations by sector
29%
20%
19%
34%
16 EY | Climate Risk Disclosure Barometer 2017

Let’s continue the conversation.
Sustainability on the goAccess our thought leadership anywhere with EY Insights, our new mobile app. Visit eyinsights.com.
For more insights or to browse our archive of webcasts and videos, visit ey.com/au/sustainability.
PerthLynsay Hughes [email protected]
SydneyAndi Csontos [email protected]
Adam Carrel [email protected]
New ZealandTracey Ryan [email protected]
BrisbaneElizabeth Rose [email protected]
MelbourneRebecca Dabbs [email protected]
Terence Jeyaretnam [email protected]
Christopher Thorn [email protected]
EY Asia-PacificMathew Nelson [email protected]
EY OceaniaMatthew Bell [email protected]
17

About EY EY is a global leader in assurance, tax, transaction and advisory services. The insights and quality services we deliver help build trust and confidence in the capital markets and in economies the world over. We develop outstanding leaders who team to deliver on our promises to all of our stakeholders. In so doing, we play a critical role in building a better working world for our people, for our clients and for our communities.
EY refers to the global organisation, and may refer to one or more, of the member firms of Ernst & Young Global Limited, each of which is a separate legal entity. Ernst & Young Global Limited, a UK company limited by guarantee, does not provide services to clients. For more information about our organisation, please visit ey.com.
About EY’s Climate Change and Sustainability Services Governments and organizations around the world are increasingly focusing on the environmental, social and economic impacts of climate change and the drive for sustainability.
Your business may face new regulatory requirements and rising stakeholder concerns. There may be opportunities for cost reduction and revenue generation. Embedding a sustainable approach into core business activities could be a complex transformation to create long-term shareholder value.
The industry and countries in which you operate as well as your extended business relationships introduce specific challenges, responsibilities and opportunities.
Our global, multidisciplinary team combines our experience in assurance, tax, transactions and advisory services with climate change and sustainability knowledge and experience in your industry. You’ll receive tailored service supported by global methodologies to address issues relating to your specific needs. Wherever you are in the world, EY can provide the right professionals to support you in reaching your sustainability goals.
© 2017 Ernst & Young, Australia. All Rights Reserved. APAC no. AU00002956 PH1730448
ED NoneThis communication provides general information which is current at the time of production. The information contained in this communication does not constitute advice and should not be relied on as such. Professional advice should be sought prior to any action being taken in reliance on any of the information. Ernst & Young disclaims all responsibility and liability (including, without limitation, for any direct or indirect or consequential costs, loss or damage or loss of profits) arising from anything done or omitted to be done by any party in reliance, whether wholly or partially, on any of the information. Any party that relies on the information does so at its own risk. Liability limited by a scheme approved under Professional Standards Legislation.
Ernst & Young ABC Pty Limited (ABN: 12 003 794 296); Australian Financial Services Licence No: 238167
ey.com
EY | Assurance | Tax | Transactions | Advisory