climate resilient and environmentally sound agriculture - module 2
TRANSCRIPT

Module 2. Climate variability and climate change
CLIMATE-RESILIENT AND ENVIRONMENTALLY SOUND
AGRICULTURE OR “CLIMATE-SMART” AGRICULTURE
Information package for government authorities

Module 2. Climate variability and climate change
Introduction to the information package
The future of humankind and the planet relies on human activities becoming more efficient, the food chain being no exception. This online information package was written with the idea of providing an overview of the challenges that the agriculture sector—and to a certain extent the food production chain—faces to feed the world while becoming more efficient. It also explores ways to address these challenges.
Through simplified concepts and relevant resources and examples, we explore the impacts of global change on agriculture, the impacts of agriculture on ecosystems and possible technical and policy considerations that can help building food security under current and future challenges.
The technical and policy considerations explored are meant to contribute towards climate-resilient and environmentally sound or “climate-smart” agriculture—agriculture that increases productivity; enhances resilience to global change; stops ecosystem services deterioration; and produces economic and social benefits.
The information presented here comes from findings, experience and ideas from all over the world, as we believe there are already elements to catalyse change. We also believe this change has to come largely from local communities, for which reason, wherever possible, we provide examples at local levels.
See how to use the information package.
Module 2. Climate variability and climate change
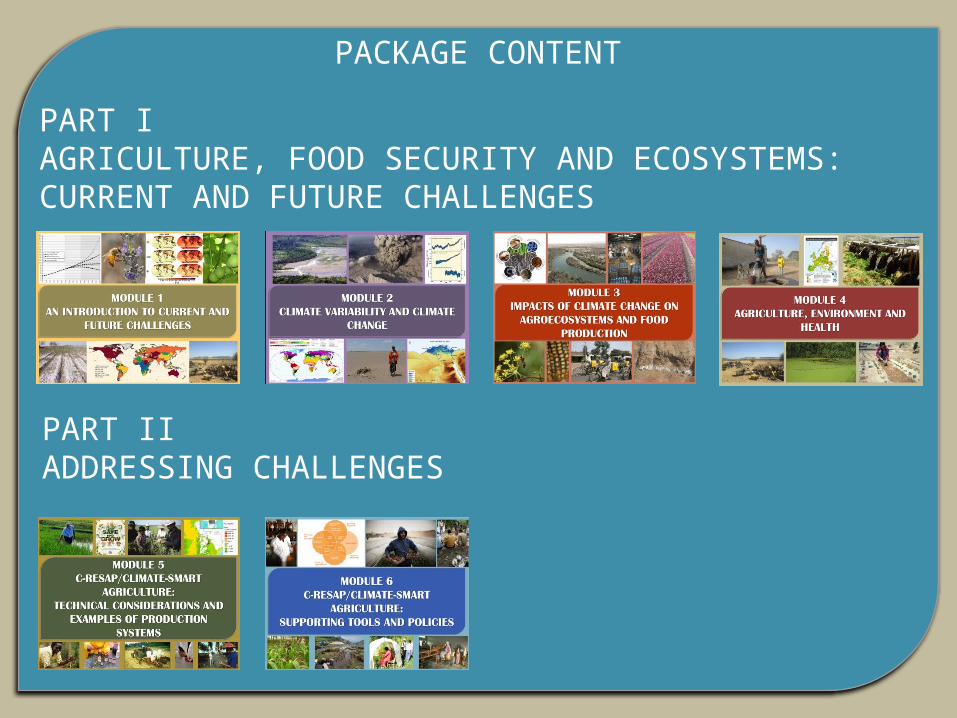
PART IAGRICULTURE, FOOD SECURITY AND ECOSYSTEMS: CURRENT AND FUTURE CHALLENGES
PART IIADDRESSING CHALLENGES
PACKAGE CONTENT
Module 2. Climate variability and climate change
MODULE 2CLIMATE VARIABILITY AND
CLIMATE CHANGE

Module 2. Climate variability and climate change
Module structure
Module 2. Climate variability and climate change
Objectives
The objective of this module is to summarise climate change concepts.
Structure
The module provides simple definitions of weather and climate; discusses climate variability and climate change; gives some evidence of climatic change; and briefly looks at projections of how climate may be for the rest of the century. Illustrations are linked to files with a larger view, expanding on the topics covered, or providing access to full text documents
Caveat
The information provided in this module provides comes from models which are currently believed to be the best available but they need to be looked out with caution as models are continuously refined.

Module 2. Climate variability and climate change
Climate and weather• Climate and weather are different
• Weather is what happens in a given time (e.g. days or hours), climate is the average weather over long periods
• Factors that can affect climate are called “climate forcing mechanisms”
Weather and climate are different. Weather is the conditions, such as temperature, rain and wind that we see over short periods. These can change hour by hour, day by day.
Climate can be thought of as the average weather over a long period. It results from the interactions between the atmosphere, oceans, ice sheets, land masses and vegetation. Scientists have defined characteristic climate zones around the world (see map). They give us an indication of the average climatic conditions of an area, i.e. arid, warm temperate, polar, etc.
The factors that affect climate are called climate forcing mechanisms; they can include variations in solar radiation, deviations in the Earth's orbit, volcanic activity, continental drift, and greenhouse gas concentrations.
Köppen-Geiger Climatic Classification.

Module 2. Climate variability and climate change
Climate and weatherExamples
“Climate is what we expect, weather is what we get”
See the difference between climate and weather in South America:
South America's climate zones range from dry steppe to equatorial monsoon. It also includes tropical, as well as subtropical areas. Zones change with altitude, with each altitudinal zone displaying distinct local climate, soils, crops, domestic animals and modes of life (Figure A).
The temperatures in South America on a given day - “the weather” (Figure B).
Figure A. Climate zones in South America. Note the classification differs slightly from Köppen-Geiger.
Figure B. Weather in South America. Temperatures on 13 August, 2011.
Source: The Weather Channel.

Module 2. Climate variability and climate change
Climate variability
• Climate varies naturally at different time and spatial scales• Climate variability can manifest periodically or suddenly
The Earth's climate is dynamic and naturally varies at different time scales, e.g. within months, seasons, decades or larger scales. It also varies regionally or globally. Each "up and down" fluctuation can lead to conditions which are warmer or colder, wetter or drier, more stormy or quiescent. Some regions experience greater variability than others. More…
El Niño (a variation in the Pacific oceanic temperatures) and the Southern Oscillation (a variation in surface air pressure over the western Pacific Ocean) are examples of climate variability.
Climate variability is manifested in other ways as well. Decadal and seasonal shifts in wind patterns and sea surface temperatures in the Atlantic cause changes in hurricane frequency. Changes in volcanic activity can also change temperatures. Sometimes climate varies in ways that are random or not fully explainable. More…
The Asian monsoon from space.
Photo: NASA image STS51F-31-069.

Module 2. Climate variability and climate change
Climate variabilityExamples
Mount Pinatubo, in the Philippines, erupted in 1991. Gases and ash reached an altitude of about 34 km and covered over 400 km in a few hours. They were dispersed over the whole planet within a year. The “cloud” over the Earth caused global temperatures to vary, temporarily reducing them by 0.5 °C between 1992 and 1993.
There is evidence that suggests the eruptions of the Laki craters in Iceland (1783–1784) affected the weather in Europe; weakened African and Indian monsoon circulations; and resulted in 1–3 millimetres less of daily precipitation than normal over the Sahel of Africa (Oman et al., 2006).
Mount Pinatubo eruption. Source: U.S. Geological Survey Fact Sheet 113-97.
Photo: Roderick Batalon.

Module 2. Climate variability and climate change
Climate variabilityExamples
In Central America climate variability translates into droughts and floods caused by tropical storms and hurricanes.
According to the Comisión Centroamericana de Desarrollo y Medio Ambiente (CCDA /SICA), between 1930 and 2008, 248 severe weather events were recorded in the region, with 85% being floods, tropical storms and landslides, 9% droughts, 4% forest fires and 2% extremes in temperatures (mainly low temperatures).
Honduras is the country which experienced the highest climate variability during this period.
Aerial shots of damage by Hurricane Mitch to agricultural land: palm crops covered in mud.
Photo: FAO/L. Dematteis.

Module 2. Climate variability and climate change
Climate variabilityReflections
Ethiopia provides a good example of the influence of climate variability on a developing country’s economy.
GDP in Ethiopia rises or falls about a year behind variations in average rainfall (see figure).
With agriculture accounting for half of GDP and 80% of jobs, the Ethiopian economy is sensitive to climate variability, particularly variations in rainfall.
Source: Adapting to climate variability and change, USAID and Ethiopia - Managing water resources to maximize sustainable growth: Water resources assistance strategy, The World Bank.
Is your country sensitive to climate variations? You could consult your national statistics institute for rainfall records together with GDP data and find out if there is any relation.

Module 2. Climate variability and climate change
Weather disasters and extreme events• Extreme weather events are rare
• Weather disasters—not necessarily extremes in climatic statistical terms—result in ecological and economic losses
• Weather disasters could reduce global GDP by up to 1%
Although the term “extreme weather event” was reserved for events that statistically were rare (occur with a frequency below 5%), the term is increasingly used to refer to weather events that result in disasters.
Information on the few extreme weather events recorded in history can be found in the World weather/climate extremes archive maintained by The World Meteorological Organization and Arizona State University (USA).
Weather disasters, which result from large departures from average weather conditions—but not necessarily climatic statistical extremes—result in ecological and economic losses. It is estimated that weather disasters could reduce global GDP by up to 1%.
Weather disasters can include, for example, severe: heat and cold waves, tornadoes, dust storms, droughts, tropical cyclones, floods.
Khulna in August 2010. A home still flooded by Cyclone Aila, which swept through Bangladesh in May 2009.
Photo: FAO/M. Uz Zaman.
Module 2. Climate variability and climate change
Weather disasters and extreme events
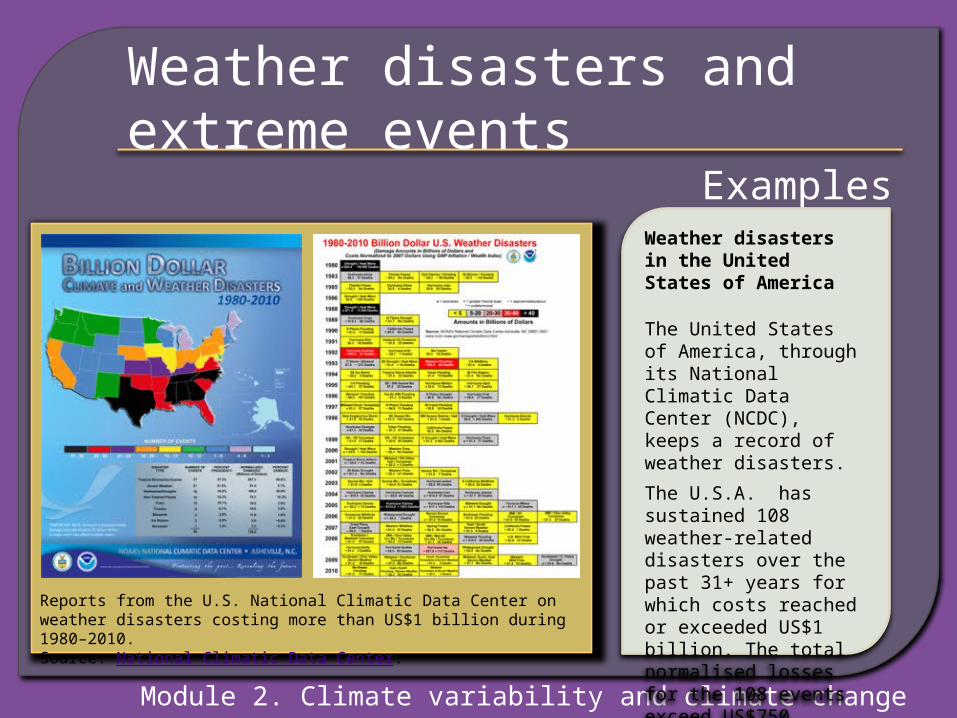
ExamplesWeather disasters in the United States of America
The United States of America, through its National Climatic Data Center (NCDC), keeps a record of weather disasters.
The U.S.A. has sustained 108 weather-related disasters over the past 31+ years for which costs reached or exceeded US$1 billion. The total normalised losses for the 108 events exceed US$750 billion.
Reports from the U.S. National Climatic Data Center on weather disasters costing more than US$1 billion during 1980–2010. Source: National Climatic Data Center.

Module 2. Climate variability and climate change
Weather disasters and extreme events
ExamplesDrought in East Africa
By the end of August 2011, the worst drought in 60 years in the Horn of Africa had sparked a severe food crisis and high malnutrition rates, with parts of Kenya and Somalia experiencing pre-famine conditions.
More than 10 million people were affected in drought-stricken areas of Djibouti, Ethiopia, Kenya, Somalia and Uganda and the situation continued deteriorating..
A pastoralist stands near a carcass in Sericho, Kenya. He used to walk 5 km with the herd to find pasture, but the distance is now 30–50 km.
Photo: Tran Ngoc Huyen.

Module 2. Climate variability and climate change
Weather disasters and extreme events
ReflectionsThe publication Weather extremes
in a changing climate: Hindsight on
foresight has a series of examples of weather disasters all over the world from 2000 to 2010.
Heat waves, floods, droughts, bush fires, cold spells were prominent and all continents were affected. These events cost millions of dollars all over the world.
Photos: Adapting to climate change and climate variability, USAID; Ethiopia - Managing Water Resources to Maximize Sustainable Growth: Water Resources Assistance Strategy, WB; Dimaberkut; FAO/Asim Hafeez.
Have there been weather disasters associated with your area? Which type? Do they seem to show a pattern? How have they varied in the last decade? Do you know what are the costs of each event?

Module 2. Climate variability and climate change
Climate change
• Climate change implies sustained changes over decades
• Changes have been more marked in the last 3 decades and are associated with human activities
Climate change implies sustained changes (over several decades or longer) to the average values for climate variables such as temperature, precipitation, winds or atmospheric pressure. These changes are normally detected as trends, for example, a trend of global warming, sea level rise or reduction of snow cover (See figures and explanations via the links).
Data gathered over the 30-year period from 1961 to 1990 define the latest Normals used for climate reference. Scientists have observed changes in the last decades compared to these values. There is evidence that these changes have been mainly caused by human activities, through an increased greenhouse effect, and that these changes are occurring at a faster rate than ever.
Scientists have been monitoring these changes; reports of their findings can be found on the IPCC website.
Observed changes in climate.Source: IPCC Climate Change 2007: Synthesis report .

Module 2. Climate variability and climate change
What is the greenhouse effect
• The atmosphere and greenhouse gases (GHGs) control the temperature of Earth; without them the Earth would be much cooler
• Human activities are increasing GHG concentrations and the planet is warming faster than ever
The planet and its atmosphere absorb and reflect the solar energy reaching it. The balance between absorbed and reflected energy determines the average temperature.
The atmosphere and certain gases stop the heat from escaping into space. They allow the sun’s energy through, but stop it from escaping back into space, acting like a greenhouse. The gases producing this effect, such as water vapour, carbon dioxide and methane, are called Greenhouse Gases (GHGs).
Without the greenhouse effect, the Earth would be 30 °C cooler, making it uninhabitable for most forms of life.
Unfortunately human activities are increasing the concentration of GHGs in the atmosphere and amplifying the greenhouse effect, trapping more and more heat and increasing global temperatures. A 1 or 2 °C increase could drastically change the life on the planet.
Emissions of long-lived GHGs from 1970 to 2004.Source: IPCC Climate Change 2007: Synthesis Report.
Module 2. Climate variability and climate change
Observations on climate change
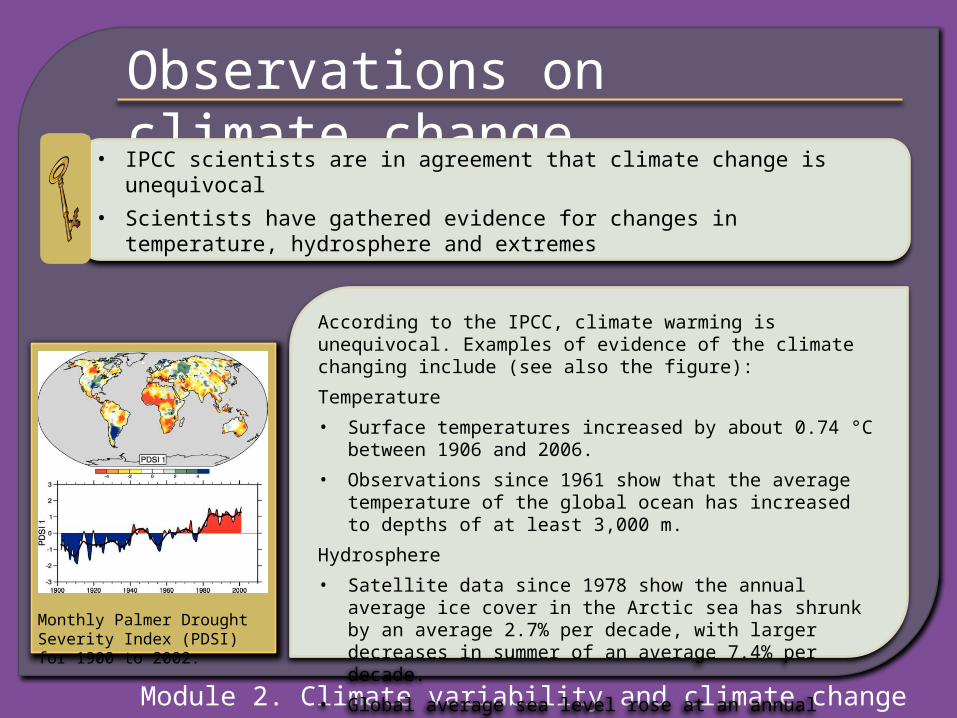
• IPCC scientists are in agreement that climate change is unequivocal
• Scientists have gathered evidence for changes in temperature, hydrosphere and extremes
According to the IPCC, climate warming is unequivocal. Examples of evidence of the climate changing include (see also the figure):
Temperature
• Surface temperatures increased by about 0.74 °C between 1906 and 2006.
• Observations since 1961 show that the average temperature of the global ocean has increased to depths of at least 3,000 m.
Hydrosphere
• Satellite data since 1978 show the annual average ice cover in the Arctic sea has shrunk by an average 2.7% per decade, with larger decreases in summer of an average 7.4% per decade.
• Global average sea level rose at an annual average of 1.8 mm (1961 to 2003) and 3.1 mm (1993 to 2003).
Monthly Palmer Drought Severity Index (PDSI) for 1900 to 2002.

Module 2. Climate variability and climate change
Observations on climate change
ExamplesChanges in the Yellow River Basin.
Obvious climate changes have been observed over the past decades in the Yellow River Basin. The mean annual temperature has risen continuously, especially since the 1990s, while precipitation and runoff have consistently decreased.
The frequency and intensity of climate events has also changed in recent years .
Mean annual temperature between 1961 and 2004 recorded in Menyuan station, one of the meteorological stations along the Yellow River Basin. Source: The China Climate Change Partnership Framework - Final Report.
Menyuan station
Tem
pera
ture
°C

Module 2. Climate variability and climate change
Observations on climate change
Reflections
In 2009, the Mexican government reported in its 4th National Communication to the UNFCCC that from 1971 the country’s temperature increased by an average 0.6 °C. With the last 10 years indicating an accelerated warming of 0.7 °C. These data are in agreement with global findings.
Temperature changes between 1971 and 2008 in Mexico.Source: Instituto Nacional de Ecología .
Are you aware of observations for your country or region?
How do they compare to global observations?
You may be able to find data in the National Communications to the UNFCCC, your Environment Ministry, local universities or regional research centres.

Module 2. Climate variability and climate change
Projecting future GHG emissions
• Scientists use models and scenarios to study potential future greenhouse gas emissions and associated impacts on climate
• If better policies are not introduced, the concentration of GHGs in the atmosphere will continue to increase
Scientists use computer models and scenarios (or assumptions about the future) to study the way that emissions and climate would change under different development paths.
The IPCC uses the Special Report on Emissions Scenarios (SRES), which groups scenarios into families A1, A2, B1 and B2. These explore “story lines” or alternative development pathways, covering a wide range of demographic, economic and technological driving forces. The SRES scenarios do not include additional climate policies. Post-SRES scenarios have refined assumptions but this has only minor effects on overall emissions.
At the moment there is high agreement that if better climate change mitigation policies and related development practices are not introduced, global GHG emissions will continue to grow over the next few decades (see graph).
Global GHG emissions (in GtCO2-eq per year) in the absence of additional climate policies. Source: IPCC, SyR-3.

Module 2. Climate variability and climate change
How will climate be in the future?
• Continued GHG emissions can cause further warming, with larger changes than those observed for the 20th century
• Temperature, precipitation, snow cover, sea level will change and weather events are expected to increase in frequency and magnitude
Continued GHG emissions can cause further warming and induce many changes in the global climate during the 21st century. These changes could be larger than those observed during the 20th century, for example: • Temperatures will continue to increase.• Warming would be greatest over land, especially at
northern latitudes, and least over the Southern Ocean (near Antarctica) and northern North Atlantic, continuing recent observed trends.
• The area of snow cover will contract.• Sea ice is expected to shrink in both the Arctic and
Antarctic under all SRES scenarios.• Sea level might rise 0.18–0.59 m (without considering
ice melting).• Hot extremes, heat waves, cyclones and heavy
precipitation events may become more frequent and intense.
Relative changes in precipitation for the period 2090–2099, relative to 1980–1999. Source for both: IPCC Syr-3.
Projections of global surface warming.

Module 2. Climate variability and climate change
How will climate be in the future?
ExamplesUsing projections to know how countries could be affected
Projections for sea level rise (SLR) are controversial, due to the contribution of many factors. Some countries are exploring what could happen under different SLR projections. According to the Arab Forum on Environment and Development, a SLR of only 1 m would flood much of the Nile Delta, inundating about one third of the land. Coastal cities such as Alexandria, Idku, Damietta and Port-Said would be at risk. In this case, it is estimated that about 8.5% of Egypt’s population will be displaced (see figure for other projections).
Remote sensing and GIS analysis depict areas of the Nile Delta at risk of 1 m to 5 m sea level rise. Source: Impact of Climate Change on Arab Countries.

Module 2. Climate variability and climate change
How will climate be in the future?
ReflectionsClick here to find a summary of the most recent climate regional projections according to the Fourth Assessment Report of the IPCC.
Temperature anomalies, observations and projections at continental level. Source: IPCC, Contribution of Working Group I to the Fourth Assessment Report of the Intergovernmental Panel on Climate Change, 2007.
What are the IPCC projections for your region?
Regional projections are very coarse (or low resolution); are you aware of downscaling models for your area?
Areas to look for would be differences in temperature, precipitation, water availability, sea level rise, desertification, ice cover changes, weather events.
If available, make a list of the projections for your area.

Module 2. Climate variability and climate change
Resources
References used in this module and further readingThis list contains the references used in this module. You can access the full text of some of these references through this information package or through their respective websites, by clicking on references, hyperlinks or images. In the case of material for which we cannot include the full text due to special copyrights, we provide a link to its abstract in the Internet.
Institutions dealing with the issues covered in the moduleIn this list you will find resources to identify national and international institutions that might hold information on the topics covered through out this information package.
Glossary, acronyms and abbreviationsIn this glossary you can find the most common terms as used in the context of climate change. In addition the FAOTERM portal contains agricultural terms in different languages. Acronyms of institutions and abbreviations used throughout the package are included here.

Module 2. Climate variability and climate change
Please select one of the following to continue:
Part I - Agriculture, food security and ecosystems: current and future challenges
Module 1. An introduction to current and future challenges
Module 2. Climate variability and climate change
Module 3. Impacts of climate change on agro-ecosystems and food production
Module 4. Agriculture, environment and health
Part II - Addressing challenges
Module 5. C-RESAP/climate-smart agriculture: technical considerations and examples of production systems
Module 6. C-RESAP/climate-smart agriculture: supporting tools and policies
About the information package:
How to use
Credits
Contact us
How to cite the information package
C. Licona Manzur and Rhodri P. Thomas (2011). Climate resilient and environmentally sound agriculture or “climate-smart” agriculture: An information package for government authorities. Institute of Agricultural Resources and Regional Planning, Chinese Academy of Agricultural Sciences and Food and Agriculture Organization of the United Nations.

Module 2. Climate variability and climate change