climate regions of oregon and spain: similarities ......climate regions model lesson jeff salvati 4...
TRANSCRIPT

Climate Regions Model Lesson Jeff Salvati
1
Climate Regions of Oregon and Spain: Similarities, Differences, and Inferences
Overview - Students will investigate the similarities and differences in climate regions between Oregon and Spain. In these investigations, students will create assumptions and inferences based on the comparison. The tools available will include maps that indicate climate, elevation, rainfall, and temperature averages. In order to access all materials, internet connection is required to retrieve the correct links and documents.
National Geography Standards
Standard 7 - The physical processes that shape the patterns of Earth's surface. Standard 15 - How physical systems affect human systems. Oregon Geography Content Standards
HS.14. - Create and use maps, technology, imagery and other geographical representations to extrapolate and interpret geographic data. HS.20. - Analyze the impact on physical and human systems of resource development, use, and management and evaluate the issues of sustainability.
Connections to Common Core
9-10.RH.7 - Integrate quantitative or technical analysis (e.g., charts, research data) with qualitative analysis in print or digital text Essential Question - "How can we use knowledge of climate, elevation, temperature, and rainfall to
predict agricultural possibilities in separate regions?"
Objectives
Students will: -Understand the similarities and differences in climate between Oregon and Spain -Be able to interpret maps that illustrate rainfall, temperature, elevation, and climate for both Oregon and Spain -Be able to make one assumption on crop production based on climate information garnered from the lesson
Grade Levels: 9-10 Time: 1-2, 50 minute class periods
Materials
Teacher Items:
-White board with markers (at least 4)
-Projector with computer and Internet access

Climate Regions Model Lesson Jeff Salvati
2
Teachers will need to provide:
-The following handouts for each student, which are linked in the lesson as well: -Climate maps of Oregon (page 6) -Rainfall maps of Oregon (page 7) -Elevation maps of Oregon (page 8) -Spain Climate Packet (page 9) -Koppen Climate Classification Cheat Sheet (page 13) -Oregon: Temperature, Elevation, Rainfall sheet (page 14) -Crop production PDF via Internet projection (can be printed) -Temperature maps and climographs of Crater Lake
Students will need:
-Writing utensil -Computer access with Internet -Blank piece of paper -Coloring material (pencils or crayons)
Background
This brief lesson can be included in a Geography unit involving climate and/or map
interpretation skills. Students should know the basics of map interpretation, be able to read
and comprehend climographs, and have a general background to the different types of climate
(or at least have the resources to interpret climate types), as this will be important for the
attention grabber and the lesson itself.
Procedures
Introduction: Begin the lesson by asking students to take out a blank piece of paper and a
writing utensil. As an attention grabber and review, write the words "Climate Types" on the
white board in front of the class. Ask students to come up to the board, and using a white board
marker, create a web chart linking different types of climate to the word. Each student can
contribute one climate type, such as Tropical Rainforest, Mediterranean, or Subartic. This can be
modified for advanced students to include a brief description as well. In all, you should have a
web chart with the words "Climate Types" in the middle, with several branches off indicating the
different Koppen climate classifications. Following this, recap with the entire class the
characteristics of the climate types that the students have written down. This will also give you a
general indication of how well the students can recall them, allowing you to modify the lesson
to their needs. Inform the students of the lesson background, essential question, and the overall
objectives, indicating the need to remember and understand these climate classifications.

Climate Regions Model Lesson Jeff Salvati
3
Activity Plan:
1) Creating a Koppen Map of Oregon: Hand out to each student a blank climate map of Oregon
with cities and the Koppen Climate Classification Cheat Sheet .Inform the students that they
need to color the blank map and coordinate it with correct climate classification by labeling it
with the 3-letter classification written on the map. They will use the Cheat Sheet as a guide of
where to color the correct climate type, and will need to add a few cities to their map (Use this
website to project a complete map of Oregon to help students fill in the cities they are missing,
or use another similar resource). Ending Student Product: Climate map of Oregon completely
colored and labeled
2) Temperature, Elevation, Rainfall Correlations: Once students complete their map of Oregon,
place them into groups of 3, and pass out the Oregon: Temperature, Elevation, Rainfall sheet
to each student, then pass out the following items:
• Oregon Average Temperature Climographs via Portland State University
• Oregon Elevation Map, By Cities
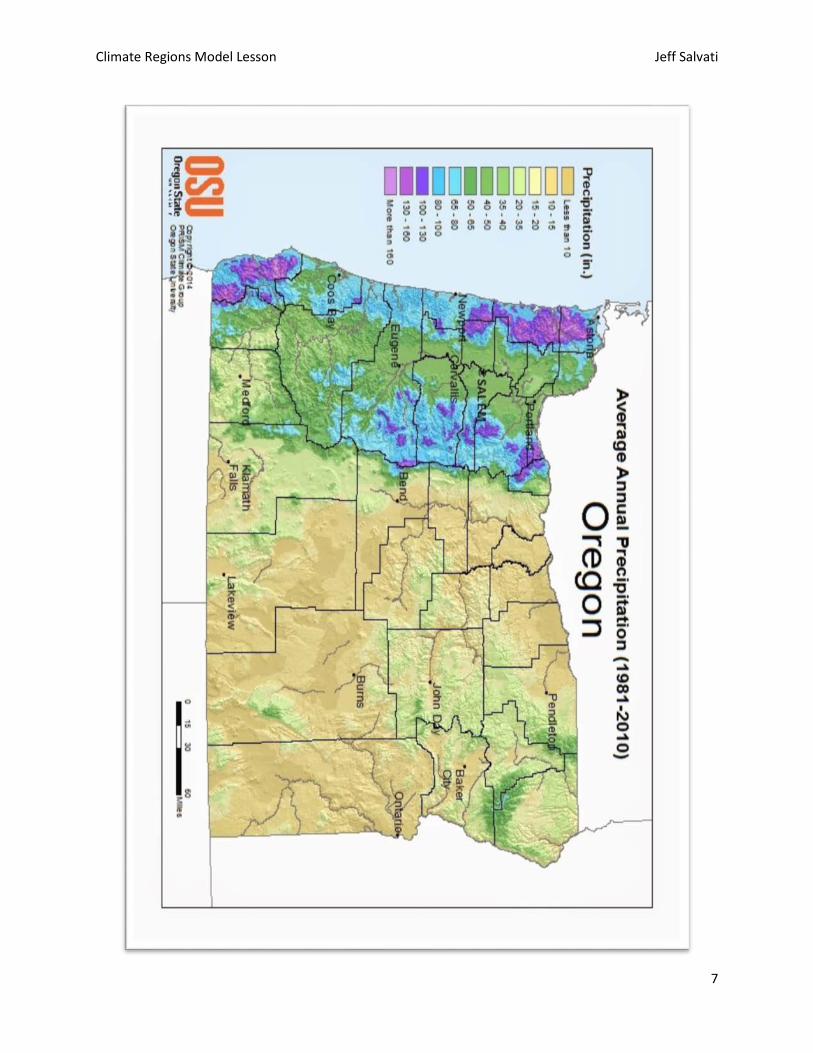
• Oregon Rainfall Map via Oregon State University, Crater Lake
Precipitation
One member of each group is assigned one of the above maps, so that each group of 3 has one
of each. Students will then take notes on their corresponding notes paper about their map.
Once each student is done, they will share their information with the rest of the group as
they each fill out their note sheets in a jigsaw-like fashion. Ask groups to share their general
conclusions that are at the end of their note sheet. Ending Student Product: Each student
will have their Oregon sheet completely filled out, including information from their group
members on their own.
Formative Check - Briefly ask students to share some of their conclusions that they have made. This is a
good opportunity to informally check for understanding with each student group.
Possible Class Break - As an exit question, ask student groups to share their "best conclusion" with the
entire class. As a bellringer the next day, ask for each student to share one important concept from the
previous day.

Climate Regions Model Lesson Jeff Salvati
4
3) Connecting Oregon to Spain. Students will need computer access for this section to access
the climographs and temperature information on Spain. At this point, students should have a
completed climate map of Oregon, with color, and a filled out note sheet with information on
Oregon's rainfall, temperature, and elevations. Now, students, still in groups of three, are to be
handed the Spain Climate packet. In their groups, students will complete the Oregon and Spain
Comparison Worksheet that links similarities and differences between Oregon and Spain. Ending
Student Product: Completed Comparison Worksheet (group work).
4) Conclusion and Assessment. Ask the students to take out a blank piece of paper. Using the
projector, project the Grown in Oregon crop production map. Students will write a one page
reflection piece on the information that they have learned from this lesson. They will need to
have a general explanation of what they have learned about the different climate types
between Oregon and Spain. Also, the instructor will ask the students to make an assumption
comparison based on the Oregon Crop Production map projected on the screen. For example,
"Wine production is growing in Jackson County. Because they have a similar climate, wine could
be produced in region of Spain" (students may use general directions for this -
northwest, southeast, etc.), and then defend why they made that assumption in their paper.
While these assumptions may or may not be accurate in actuality, the purpose is to make
connections between climate, crop production, and physical processes.
5)Exit Ticket: Students will need one more piece of paper. As a "fun" finale, show these two
maps, indicating the crop production in Spain ( Map 1 and Map 2) . Teachers may need to
provide help in interpreting the maps. Students answer these two questions on a separate sheet
of paper for an exit ticket:
1) Was your assumption correct?
2) What surprised you about this map in regard to the products?
Final Products to Turn In
-Reflection papers by individual students.
-Groups turn in their group work.
-Exit Ticket
Climate Regions Model Lesson Jeff Salvati
5
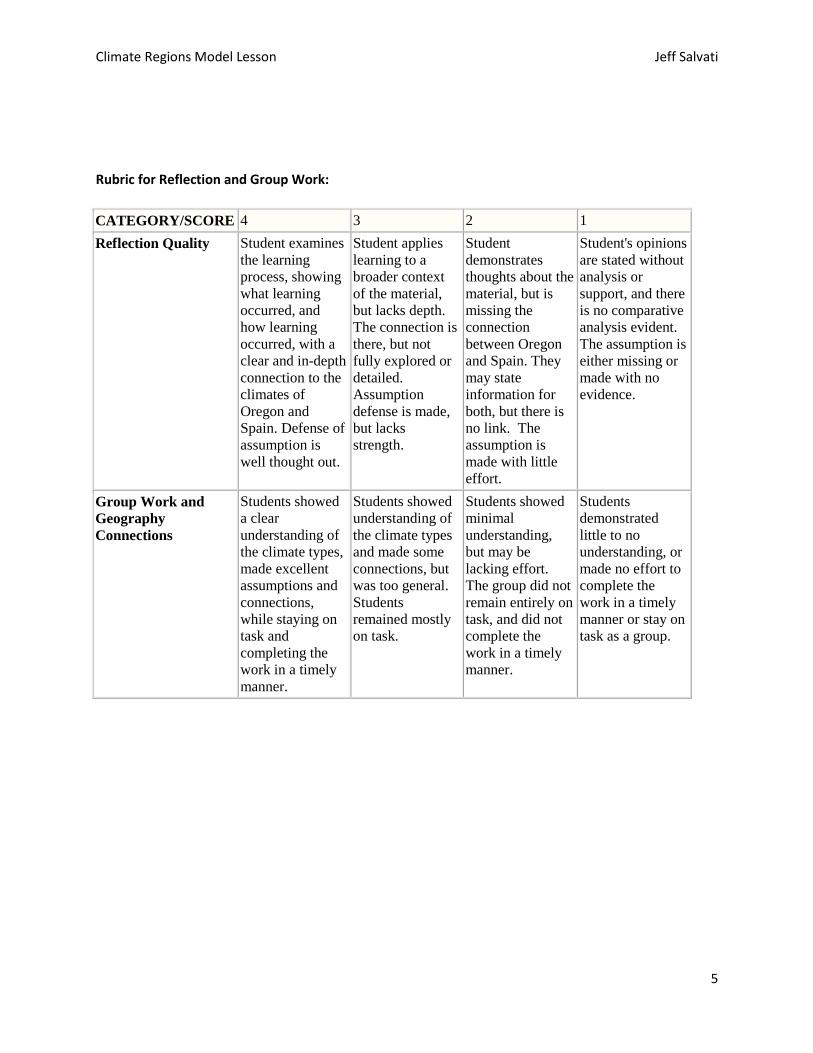
Rubric for Reflection and Group Work:
CATEGORY/SCORE 4 3 2 1 Reflection Quality Student examines
the learning process, showing what learning occurred, and how learning occurred, with a clear and in-depth connection to the climates of Oregon and Spain. Defense of assumption is well thought out.
Student applies learning to a broader context of the material, but lacks depth. The connection is there, but not fully explored or detailed. Assumption defense is made, but lacks strength.
Student demonstrates thoughts about the material, but is missing the connection between Oregon and Spain. They may state information for both, but there is no link. The assumption is made with little effort.
Student's opinions are stated without analysis or support, and there is no comparative analysis evident. The assumption is either missing or made with no evidence.
Group Work and Geography Connections
Students showed a clear understanding of the climate types, made excellent assumptions and connections, while staying on task and completing the work in a timely manner.
Students showed understanding of the climate types and made some connections, but was too general. Students remained mostly on task.
Students showed minimal understanding, but may be lacking effort. The group did not remain entirely on task, and did not complete the work in a timely manner.
Students demonstrated little to no understanding, or made no effort to complete the work in a timely manner or stay on task as a group.

Climate Regions Model Lesson Jeff Salvati
6
Climate Regions Model Lesson Jeff Salvati
7
Climate Regions Model Lesson Jeff Salvati
8
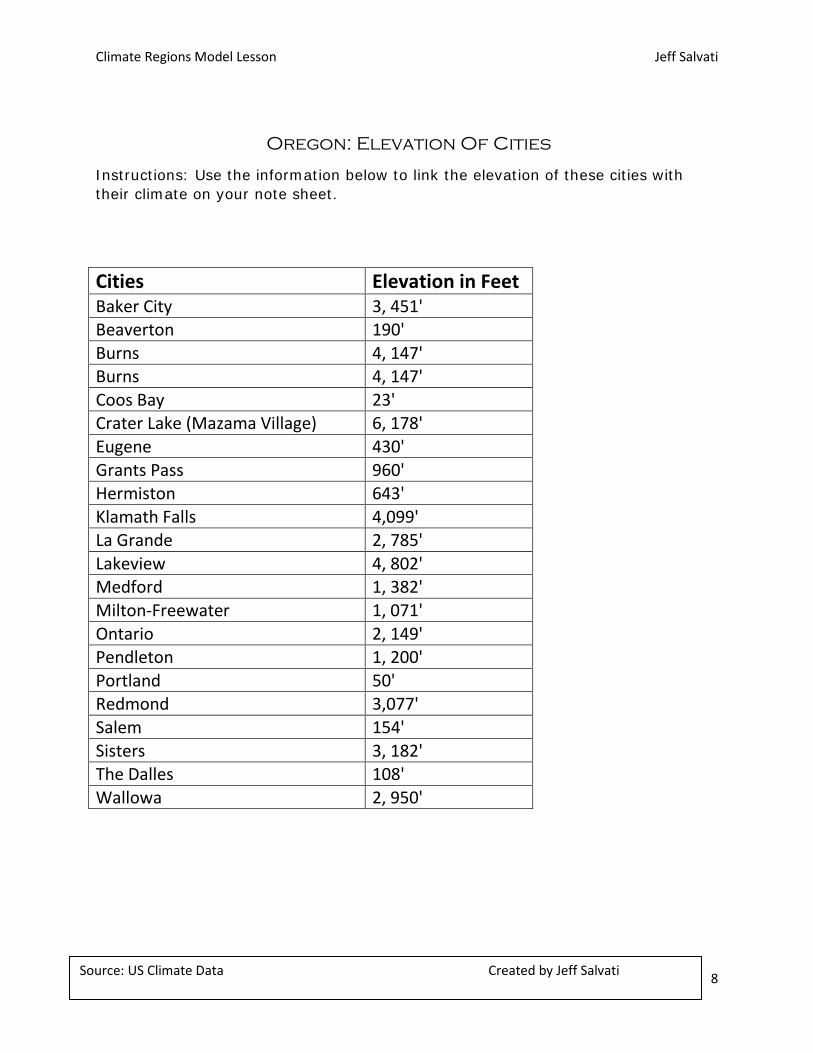
Oregon: Elevation Of Cities
Instructions: Use the information below to link the elevation of these cities with their climate on your note sheet.
Cities Elevation in Feet Baker City 3, 451' Beaverton 190' Burns 4, 147' Burns 4, 147' Coos Bay 23' Crater Lake (Mazama Village) 6, 178' Eugene 430' Grants Pass 960' Hermiston 643' Klamath Falls 4,099' La Grande 2, 785' Lakeview 4, 802' Medford 1, 382' Milton-Freewater 1, 071' Ontario 2, 149' Pendleton 1, 200' Portland 50' Redmond 3,077' Salem 154' Sisters 3, 182' The Dalles 108' Wallowa 2, 950'
Source: US Climate Data Created by Jeff Salvati

Climate Regions Model Lesson Jeff Salvati
9
Spain Climate Packet
Table of Contents
Spain Map.....................1
Koppen Climate Map....2
Yearly Precip.................3
Elevation Map...............4
Source:
http://www.graphatlas.com/spain.php

Climate Regions Model Lesson Jeff Salvati
10
Source:
http://www.axbocz.net/koppen/koppen-climate-map

Climate Regions Model Lesson Jeff Salvati
11
Average Yearly Precipitation in Spain
Source:
http://static.ddmcdn.com/gif/maps/jpg/EUR_ES_THEM_Annl

Climate Regions Model Lesson Jeff Salvati
12
Elevation of Spain
Source:
http://wak.infobaselearning.com/countries-of-the-world/europe/spain/DisplayMapsAndFlags.aspx?cID=26882

Climate Regions Model Lesson Jeff Salvati
Source: http://en.climate-data.org/ Created by Jeff Salvati
OREGON CLIMATE CHEAT SHEET Use the Koppen climate classifications below as a guide to completing your climate map of
Oregon. Keep in mind that the climate regions are not always continuous - some may isolated
within another climate type.
Classification Köppen-Geiger Examples Cities (Include in your map)
Warm-summer Mediterranean climate
Csb Portland, Eugene, Salem, Beaverton, Coos Bay
Cold semi-arid climates BSk Redmond, Pendleton, Hermiston, Ontario, Bend
Warm humid continental climate
Dsb Klamath Falls, La Grande, Burns, Sisters, Lakeview
Warm humid continental climate
Dfb Baker City, Wallowa
Hot-summer Mediterranean climate
Csa Medford, Grants Pass, The Dalles, Milton-Freewater
Subarctic climate Dsc Mazama Village (Crater Lake)

Climate Regions Model Lesson Jeff Salvati
Source: http://en.climate-data.org/ Created by Jeff Salvati
Name
Oregon: Temperature, Elevation, Rainfall
Temperature Notes: Look for correlations between average temperatures with the months of the year, any variations present, and any trends.
What I noticed about:
• Csb areas -
• Bsk -
• Dsb -
• Dfb -
• Csa -
• Dsc -
----------------------------------------------------------------------------------------
Rainfall Notes: Look for trends between this map of annual precipitation and your colored climate map of Oregon. What areas receive the most rain? The least?
What I noticed about:
• Csb areas -
• Bsk -
• Dsb -
• Dfb -
• Csa -
• Dsc -

Climate Regions Model Lesson Jeff Salvati
Source: http://en.climate-data.org/ Created by Jeff Salvati
Elevation Notes: Look for trends between this map, the list of elevation of the cities, and the elevation map of Oregon. What correlations, or trends, do you find between these three maps?
What I noticed about:
• Csb areas -
• Bsk -
• Dsb -
• Dfb -
• Csa -
• Dsc -
----------------------------------------------------------------------------------------
Conclusion Notes: As a group, write down 4 general conclusions that you can make based on your research of Oregon's climate.
1.
2.
3.
4.