climate-kic ghg mitigation assessment : ‘enabling the transition’ projects francisco koch 1, jon...
TRANSCRIPT

CLIMATE-KIC GHG MITIGATION ASSESSMENT :
‘ENABLING THE TRANSITION’ PROJECTS
Francisco Koch1, Jon Hughes2 and Martin Wattenbach3
1South Pole Advisory Technoparkstrasse 1 | 8005 Zurich | Switzerland2National Physical Laboratory | Hampton Rd | Teddington | Middlesex | UK | TW11 0LW3Helmholtz Centre Potsdam, GFZ German Research Centre For Geosciences,Telegrafenberg, 14473 Potsdam, Germany

Step 6
Leakage assessment
Step 5Calculate the estimated GHG Mitigation Impact
Step 4Describe the baseline scenario
Step 3Define the project unit and project boundary used for the assessment
Step 2.Indicate the main GHG sources that will be reduced by the project
Step 1Describe how the proposed project reduces GHG emissions (GHG mitigation story)
Inno
vatio
n pr
ojec
ts (S
teps
1-6
)
Pathfinder projects
Step 1 and 2 only
GHG Mitigation Impact Assessment - stepwise procedure
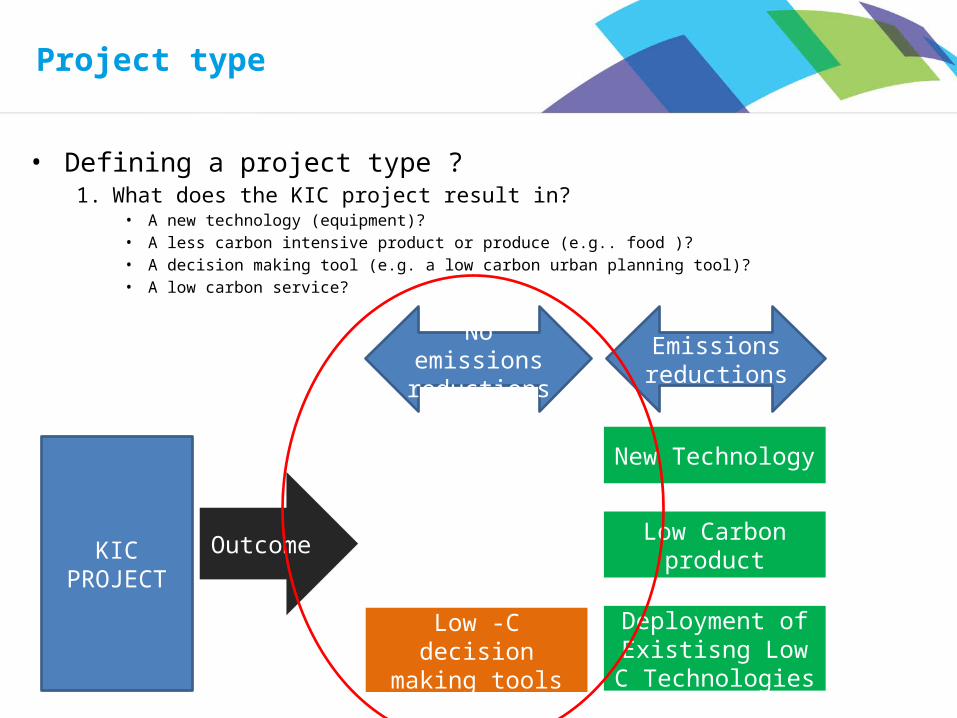
• Defining a project type ?1. What does the KIC project result in?
• A new technology (equipment)?• A less carbon intensive product or produce (e.g.. food )?• A decision making tool (e.g. a low carbon urban planning tool)?• A low carbon service?
Project type
KIC PROJECTOutcome
New Technology
Low Carbon product
Low -C decision making tools
Deployment of Existisng Low C Technologies
No emissions reductions
Emissions reductions

MUNEP
• Decision making tool for municipal governments
• Provides information on transferring to electric buses
• Previous Pathfinder project

• The soft ware tool combines traffic planning and technical models to construct trans portation scenarios with electric buses.
• By applying the tool, different electrification scenarios for entire bus networks can be developed and analysed.
• This approach enables public transport authorities (PTAs) and local public transport (LPT) operators (PTOs) to take long-range decisions on how to implement electric mobility.
• This project can reduce GHG emissions by speeding up the transition to electric vehicles which have lower emissions than diesel buses.
Step 1. GHG Mitigation Story

Step 2. Indicate the main GHG emissions sources
GHG Mitigation measure (s) that result from your project’s implementation
Targeted GHG
Sources of GHG impacted by the measure
Reduced bus operation emissions due to substitution of diesel buses with electric ones in consequence of planning support
CO2 Diesel combustion in LPT buses (2.64 kg/l)

Project Unit = Application of the tool for a large city
• Substitution of 50 diesel buses (assumption: articulated buses, length of 18 m) by electric ones ( = deployment of low carbon technologies) by triggering an ac cording procurement
• 50 buses is a typical number for a series of procurement processes of a large European city.
• Typical operational figures are:– Commercial speed: 15 km/h– Daily operation time: 13 hours (e.g. 6 a.m. – 7 p.m.)– Operation days per year: 308– Thus, the product calculates to 60,000 km per year, giving the yearly mileage for each bus. This is a typical value
for a bus in LPT service
• Activity metric: The transport service (passenger transport) ‘A’ provided by the project unit calculates as follows:
– A = 50 articulated buses x 60,000 km/yr/bus = 3,000,000 km/yr.
• The scaling factor would be the number of cities / municipalities that the project outcome will be applied to.
Step 3. Define the project unit

Project boundary
Project unitSubstitution of 50 articulateddiesel buses by electric ones
Process:LPT service –
Operation of 50 articulated buses
CO2 emissions fromdiesel combustion
Current configuration
Diesel supply chain
Vehicle (conv.) supplychain
Diesel consumption
Vehicle „consumption“ (wear)
CO2 emissions fromdiesel supply
CO2 emissions fromvehicle (conv.) supply
LeakageNot included in calculation!
Project boundary
Project unitSubstitution of 50 articulateddiesel buses by electric ones
Process:LPT service –
Operation of 50 articulated buses
Zero GHG emissionsfrom vehicle operation
New configuration
Electricitysupply (grid)
Vehicle (electr.)supply chain
Electricity consumption
Electric vehicle „consumption“ (wear)
CO2 emissions fromelectricity supply
CO2 emissionsfrom vehicle(electr.) supply
Not included in calculation! Leakage
Step 3: Project Boundary

Step 4. Define the baseline scenario
• Continuation of the current situation • Each articulated diesel bus (18 m, approx. 21 t) consumes approximately 47 l/100km
of diesel, each litre diesel combusts to 2.64 kg CO2. Thus, 1.24 kg CO2 is emitted per kilometer (‘BL_emissions_factor’)
• Project Lifetime – Assumption that electric buses will become common place within 5 years so the baseline
emissions will be valid for 5 years
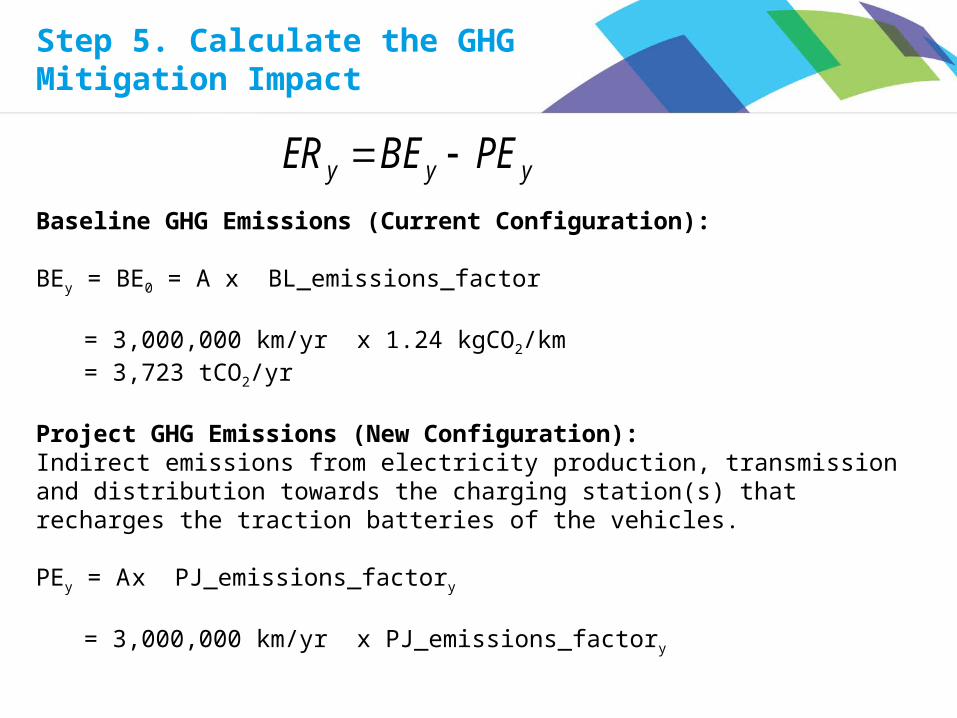
Step 5. Calculate the GHG Mitigation Impact
yyy PEBEER Baseline GHG Emissions (Current Configuration):
BEy = BE0 = A x BL_emissions_factor
= 3,000,000 km/yr x 1.24 kgCO2/km = 3,723 tCO2/yr
Project GHG Emissions (New Configuration):Indirect emissions from electricity production, transmission and distribution towards the charging station(s) that recharges the traction batteries of the vehicles.
PEy = A x PJ_emissions_factory
= 3,000,000 km/yr x PJ_emissions_factory

Step 5. Calculate the GHG Mitigation Impact
yyy PEBEER Project emissions continuedPJ_emissions_factory = emissions_per_kWhy x electricity_consumption_per_km
The following figure shows the assumed emissions factors of electricity supply for the relevant years (linear extrapolation from IEA data to year 2020):

Step 5. Calculate the GHG Mitigation Impact
yyy PEBEER Year BL_emissions_factor Diesel bus emissions
"BEy"PJ_emissions_factor Electric bus emissions
"PEy"Emissions reductions
"ERy"Mitigation potential indicator "ERy / A"
2016 1.24 kgCO2/km 3,722 tCO2 0.85 kgCO2/km 2,550 tCO2 1,172 tCO2 0.39 kgCO2/km2017 1.24 kgCO2/km 3,722 tCO2 0.84 kgCO2/km 2,511 tCO2 1,211 tCO2 0.40 kgCO2/km2018 1.24 kgCO2/km 3,722 tCO2 0.82 kgCO2/km 2,472 tCO2 1,250 tCO2 0.42 kgCO2/km2019 1.24 kgCO2/km 3,722 tCO2 0.81 kgCO2/km 2,433 tCO2 1,289 tCO2 0.43 kgCO2/km2020 1.24 kgCO2/km 3,722 tCO2 0.80 kgCO2/km 2,394 tCO2 1,328 tCO2 0.44 kgCO2/km
The total GHG mitigated over the validity period equals 6,252 tCO2
Referenceshttps://www.gov.uk/government/uploads/system/uploads/attachment_data/file/69554/pb13773-ghg-conversion-factors-2012.pdf
http://www.morgenpost.de/berlin-aktuell/article121309814/Berlin-bekommt-156-neue-Gelenkbusse-von-der-Stange.html
http://www.daimler.com/dccom/0-5-7153-49-1705229-1-0-0-0-0-0-9293-0-0-0-0-0-0-0-0.html , http://media.daimler.com/dcmedia/0-921-1399355-1-1601507-1-0-1-0-0-0-0-0-0-1-0-0-0-0-0.html
Ralph Pütz (VDV e.V.), “Strategische Optimierung von Linienbusflotten”, Dissertation, TU Berlin, 2010; confirmed by oral communication of several LPT operators
http//www. iea. org/co2highlights/ (from GHG Mitigation Assessment Guidance document, Annex I, Germany)
P. Sinhuber et. al., “Study on power and energy demand for sizing the energy storage systems for electrified local public transport buses”, Vehicle Power and Propulsion Conference (VPPC), 2012 IEEE)
http://ifeu.de/verkehrundumwelt/pdf/Flottenversuch%20Elektromobilitaet%20-%20Endbericht%20ifeu%20(final)%20-%20Rev%20Apr2014.pdf
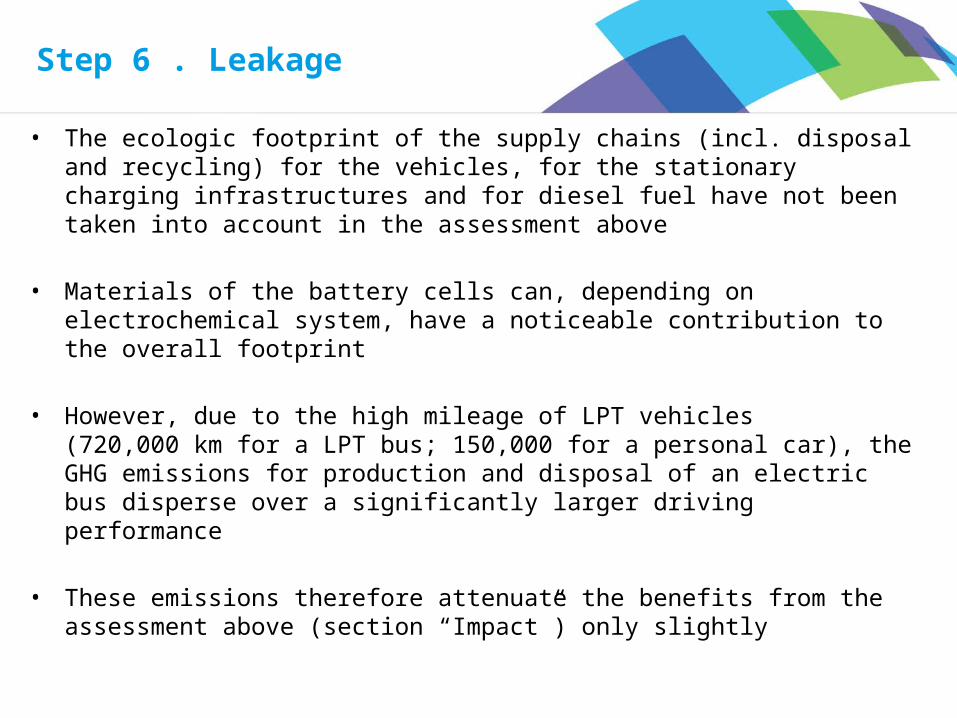
• The ecologic footprint of the supply chains (incl. disposal and recycling) for the vehicles, for the stationary charging infrastructures and for diesel fuel have not been taken into account in the assessment above
• Materials of the battery cells can, depending on electrochemical system, have a noticeable contribution to the overall footprint
• However, due to the high mileage of LPT vehicles (720,000 km for a LPT bus; 150,000 for a personal car), the GHG emissions for production and disposal of an electric bus disperse over a significantly larger driving performance
• These emissions therefore attenuate the benefits from the assessment above (section “Impact”) only slightly
Step 6 . Leakage